-
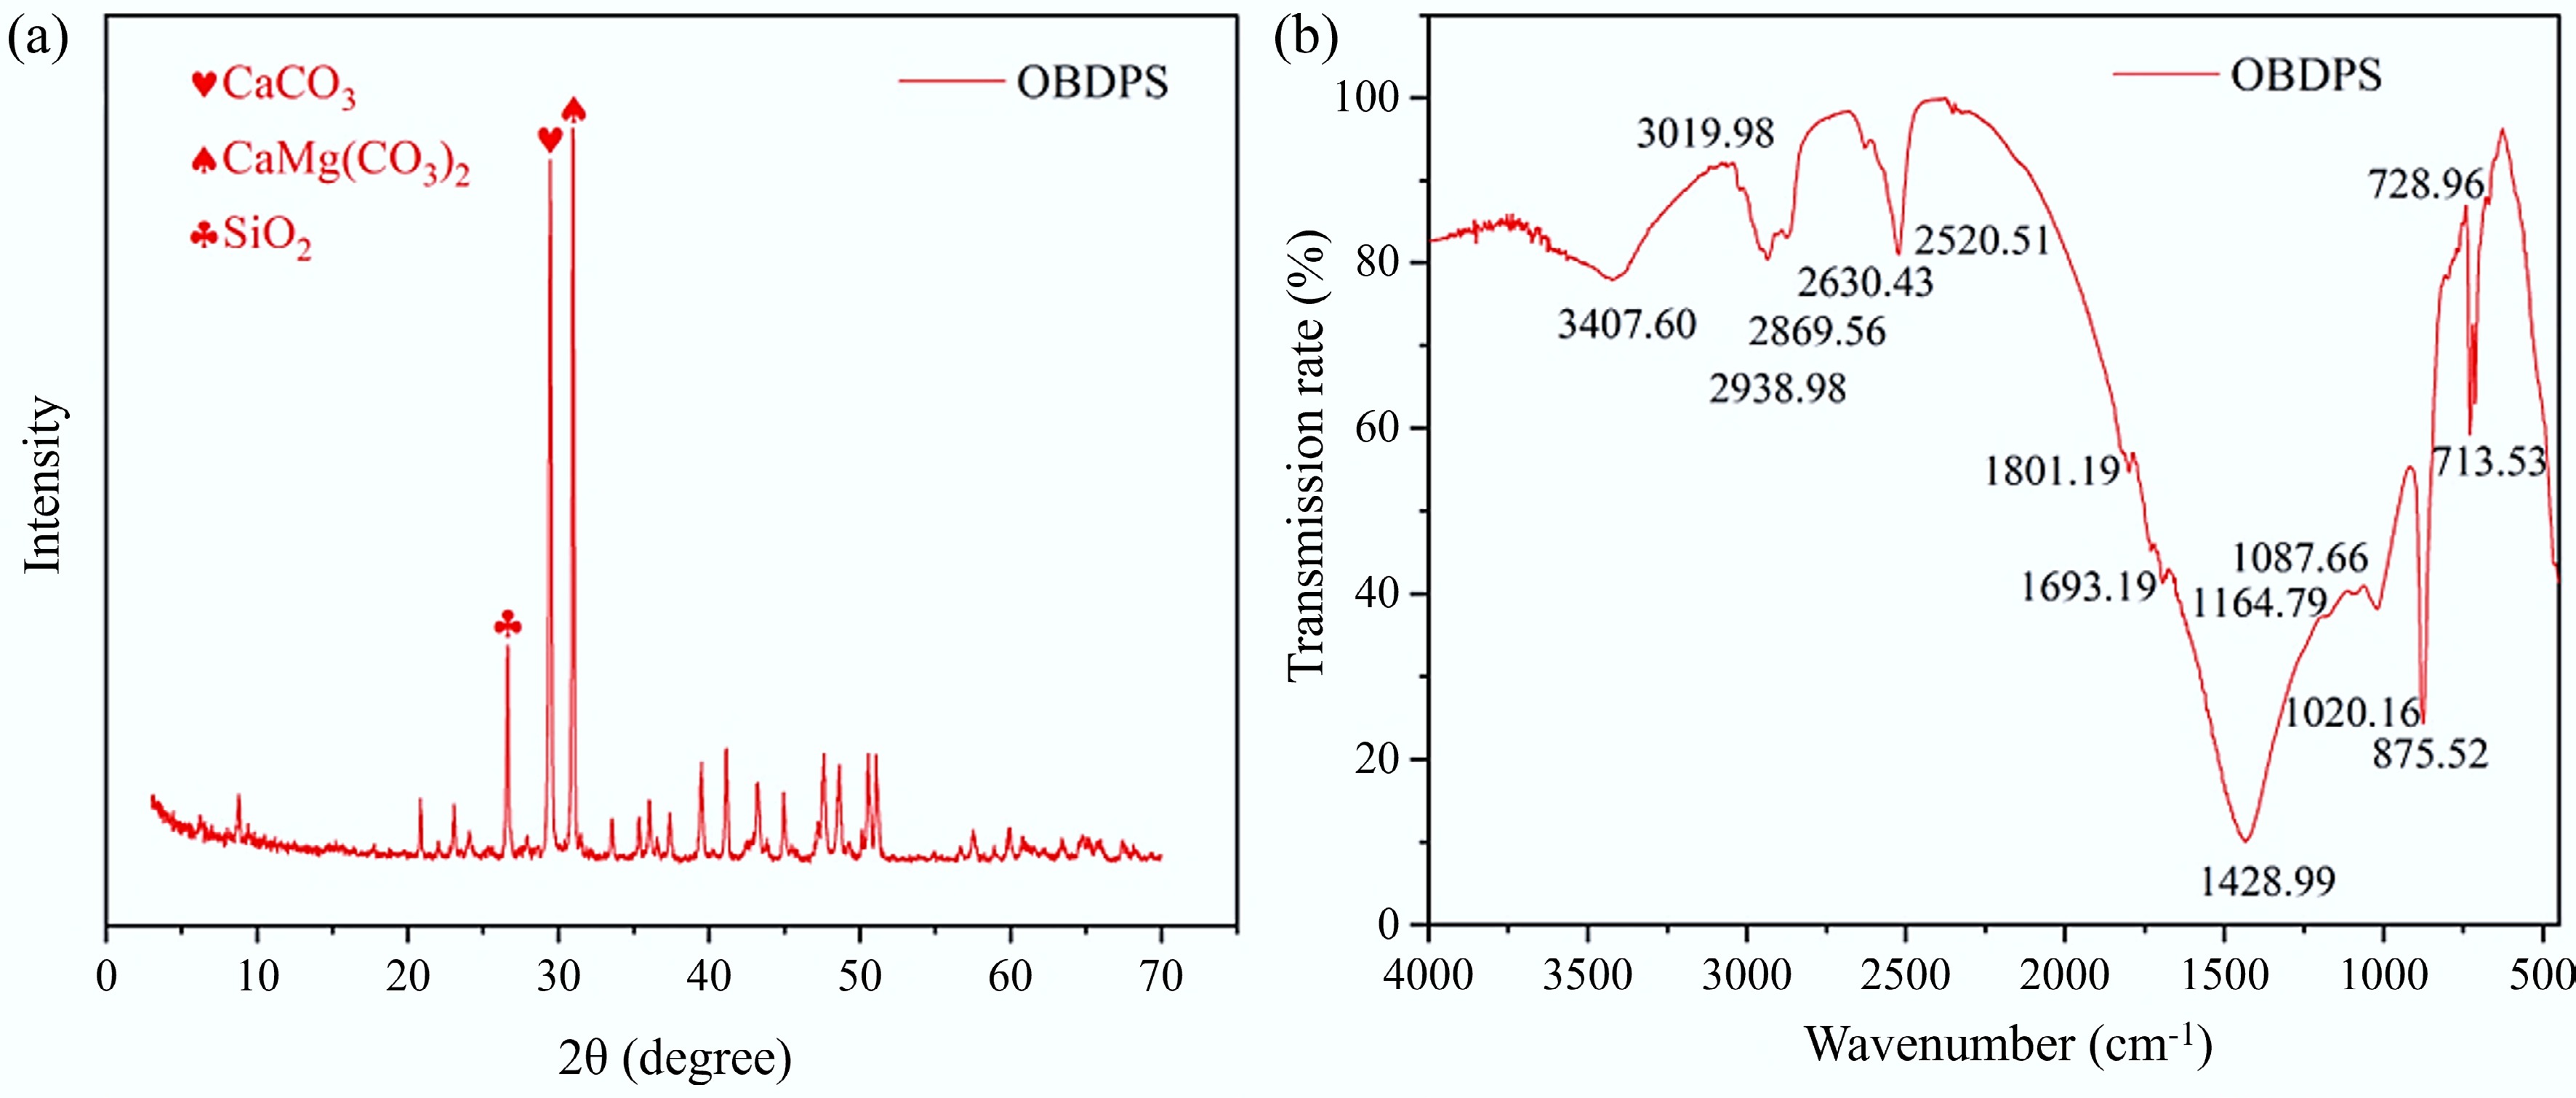
Figure 1.
(a) X-ray diffraction of OBDPS; (b) Fourier transform infrared spectroscopy of OBDPS.
-
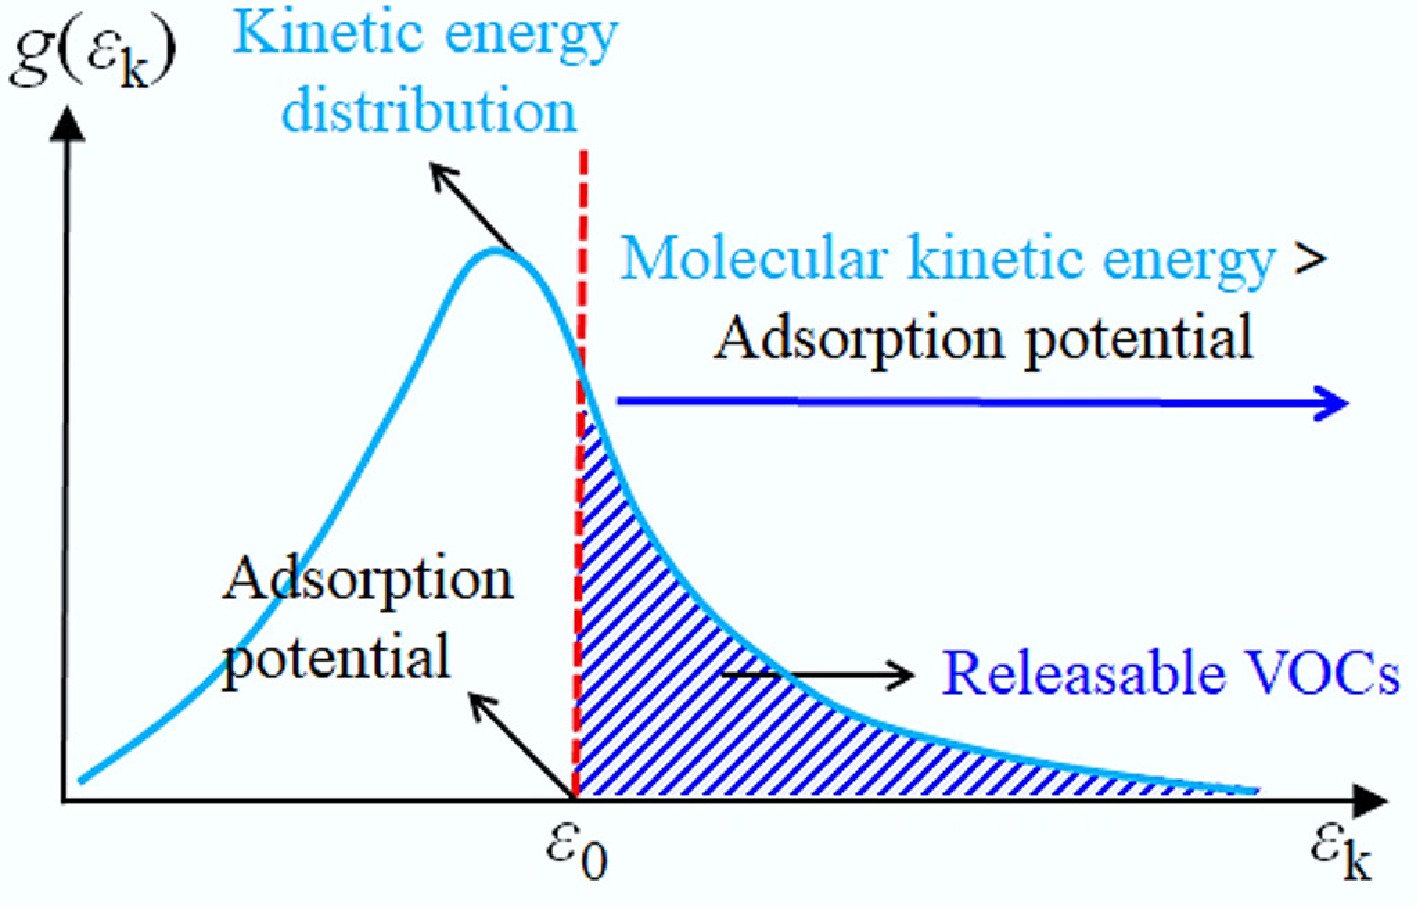
Figure 2.
The schematic illustrates the distribution of kinetic energy and the ratio of VOCs which can be emitted.
-
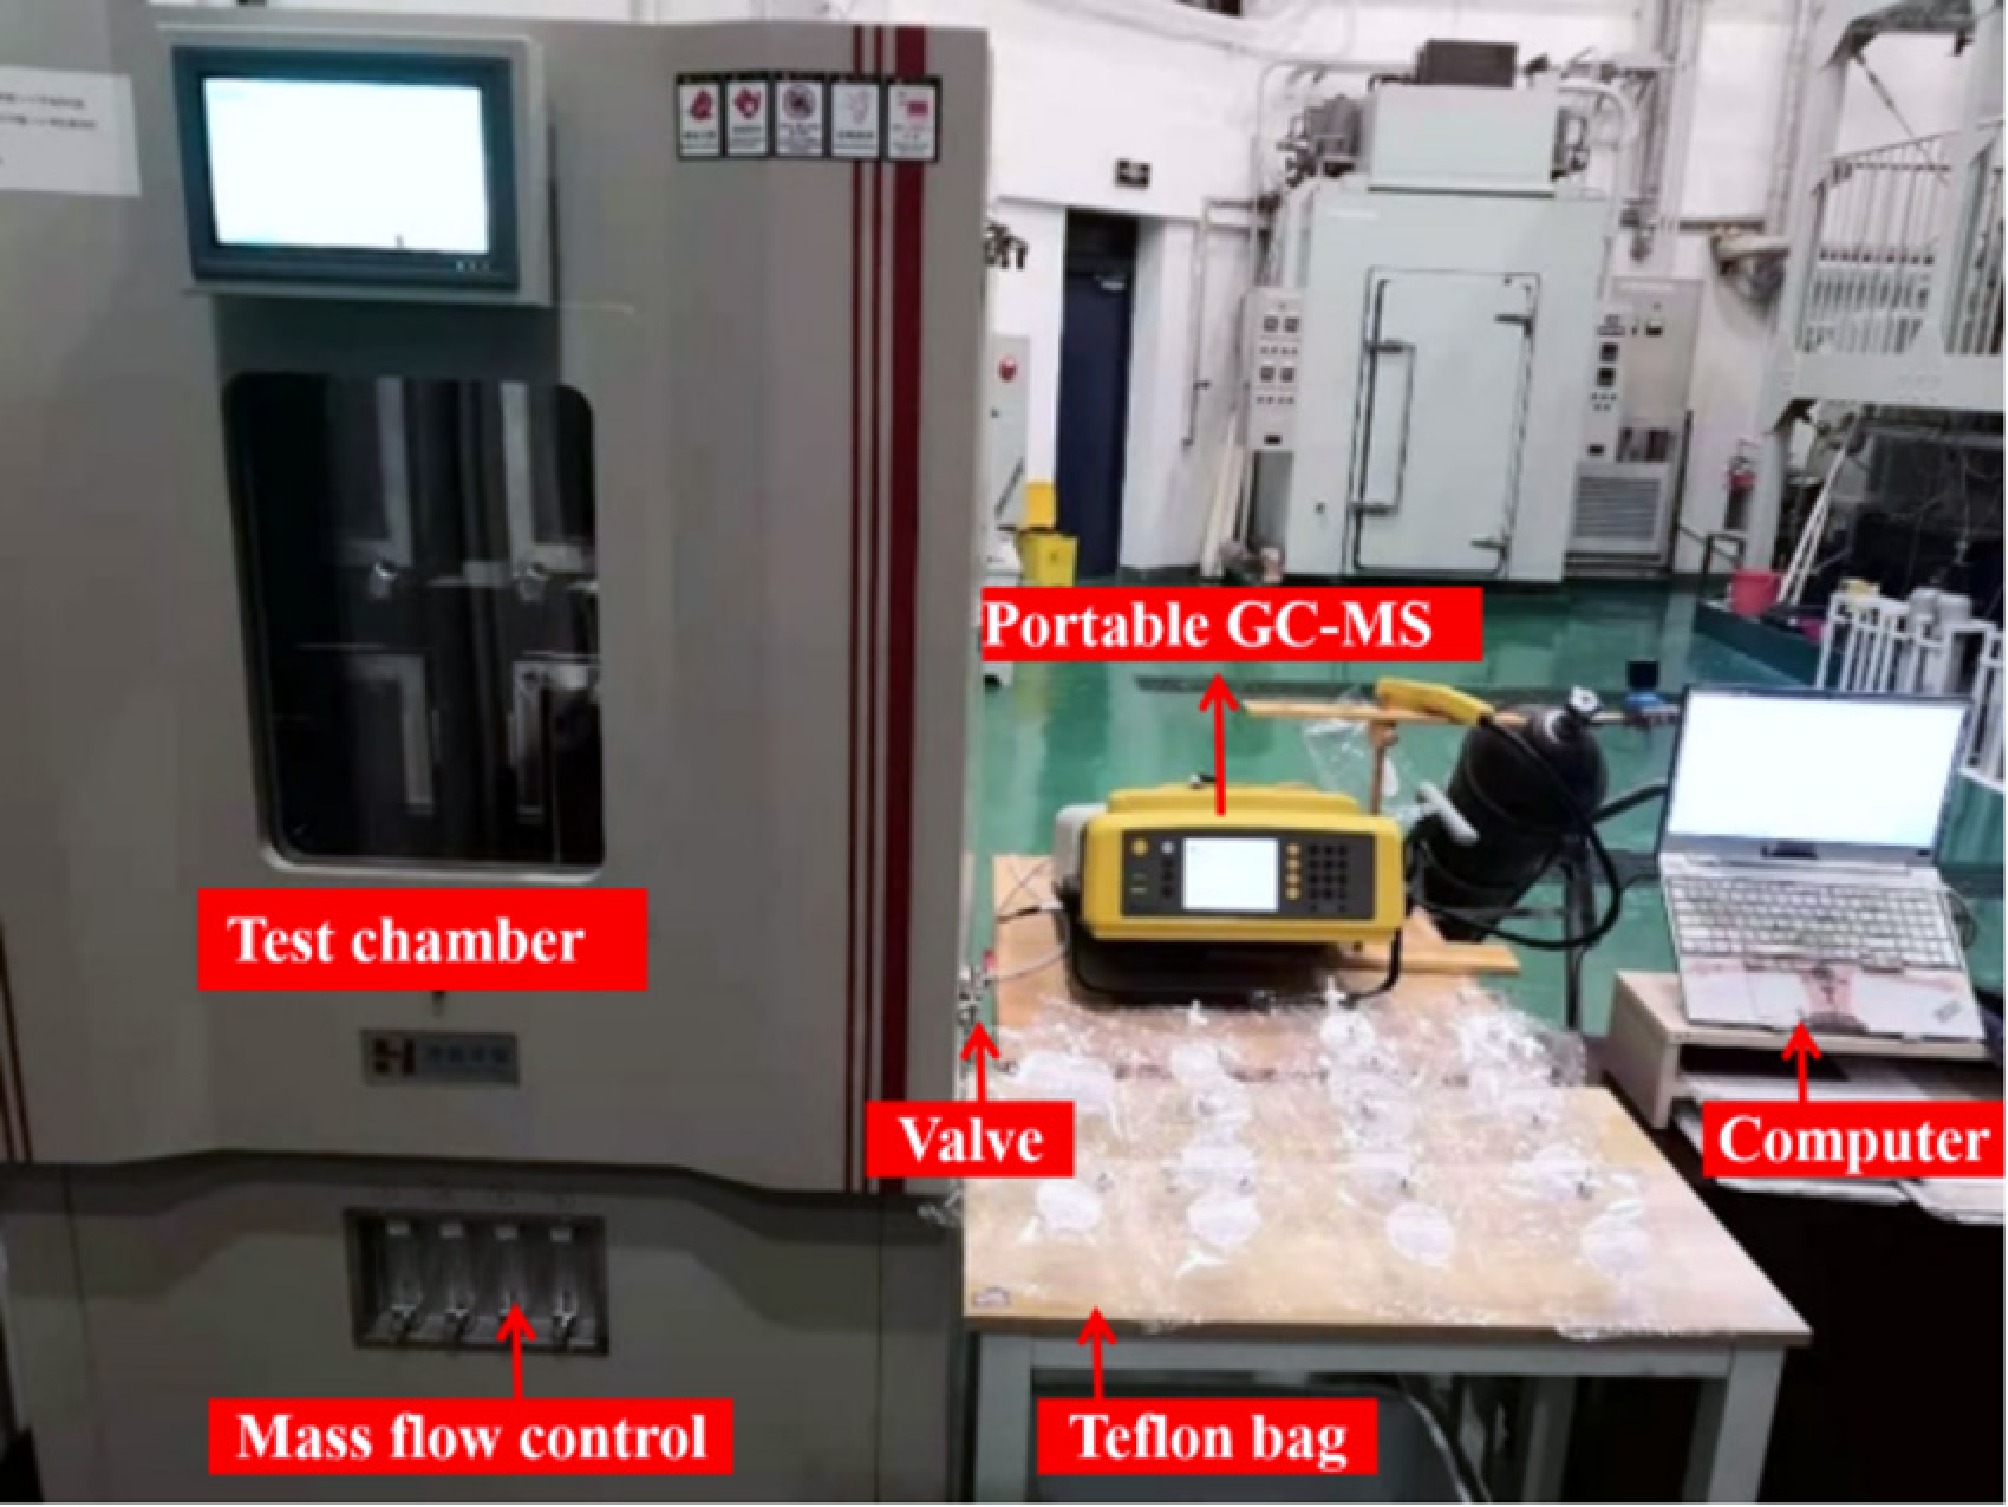
Figure 3.
Physical picture of the experimental devices.
-
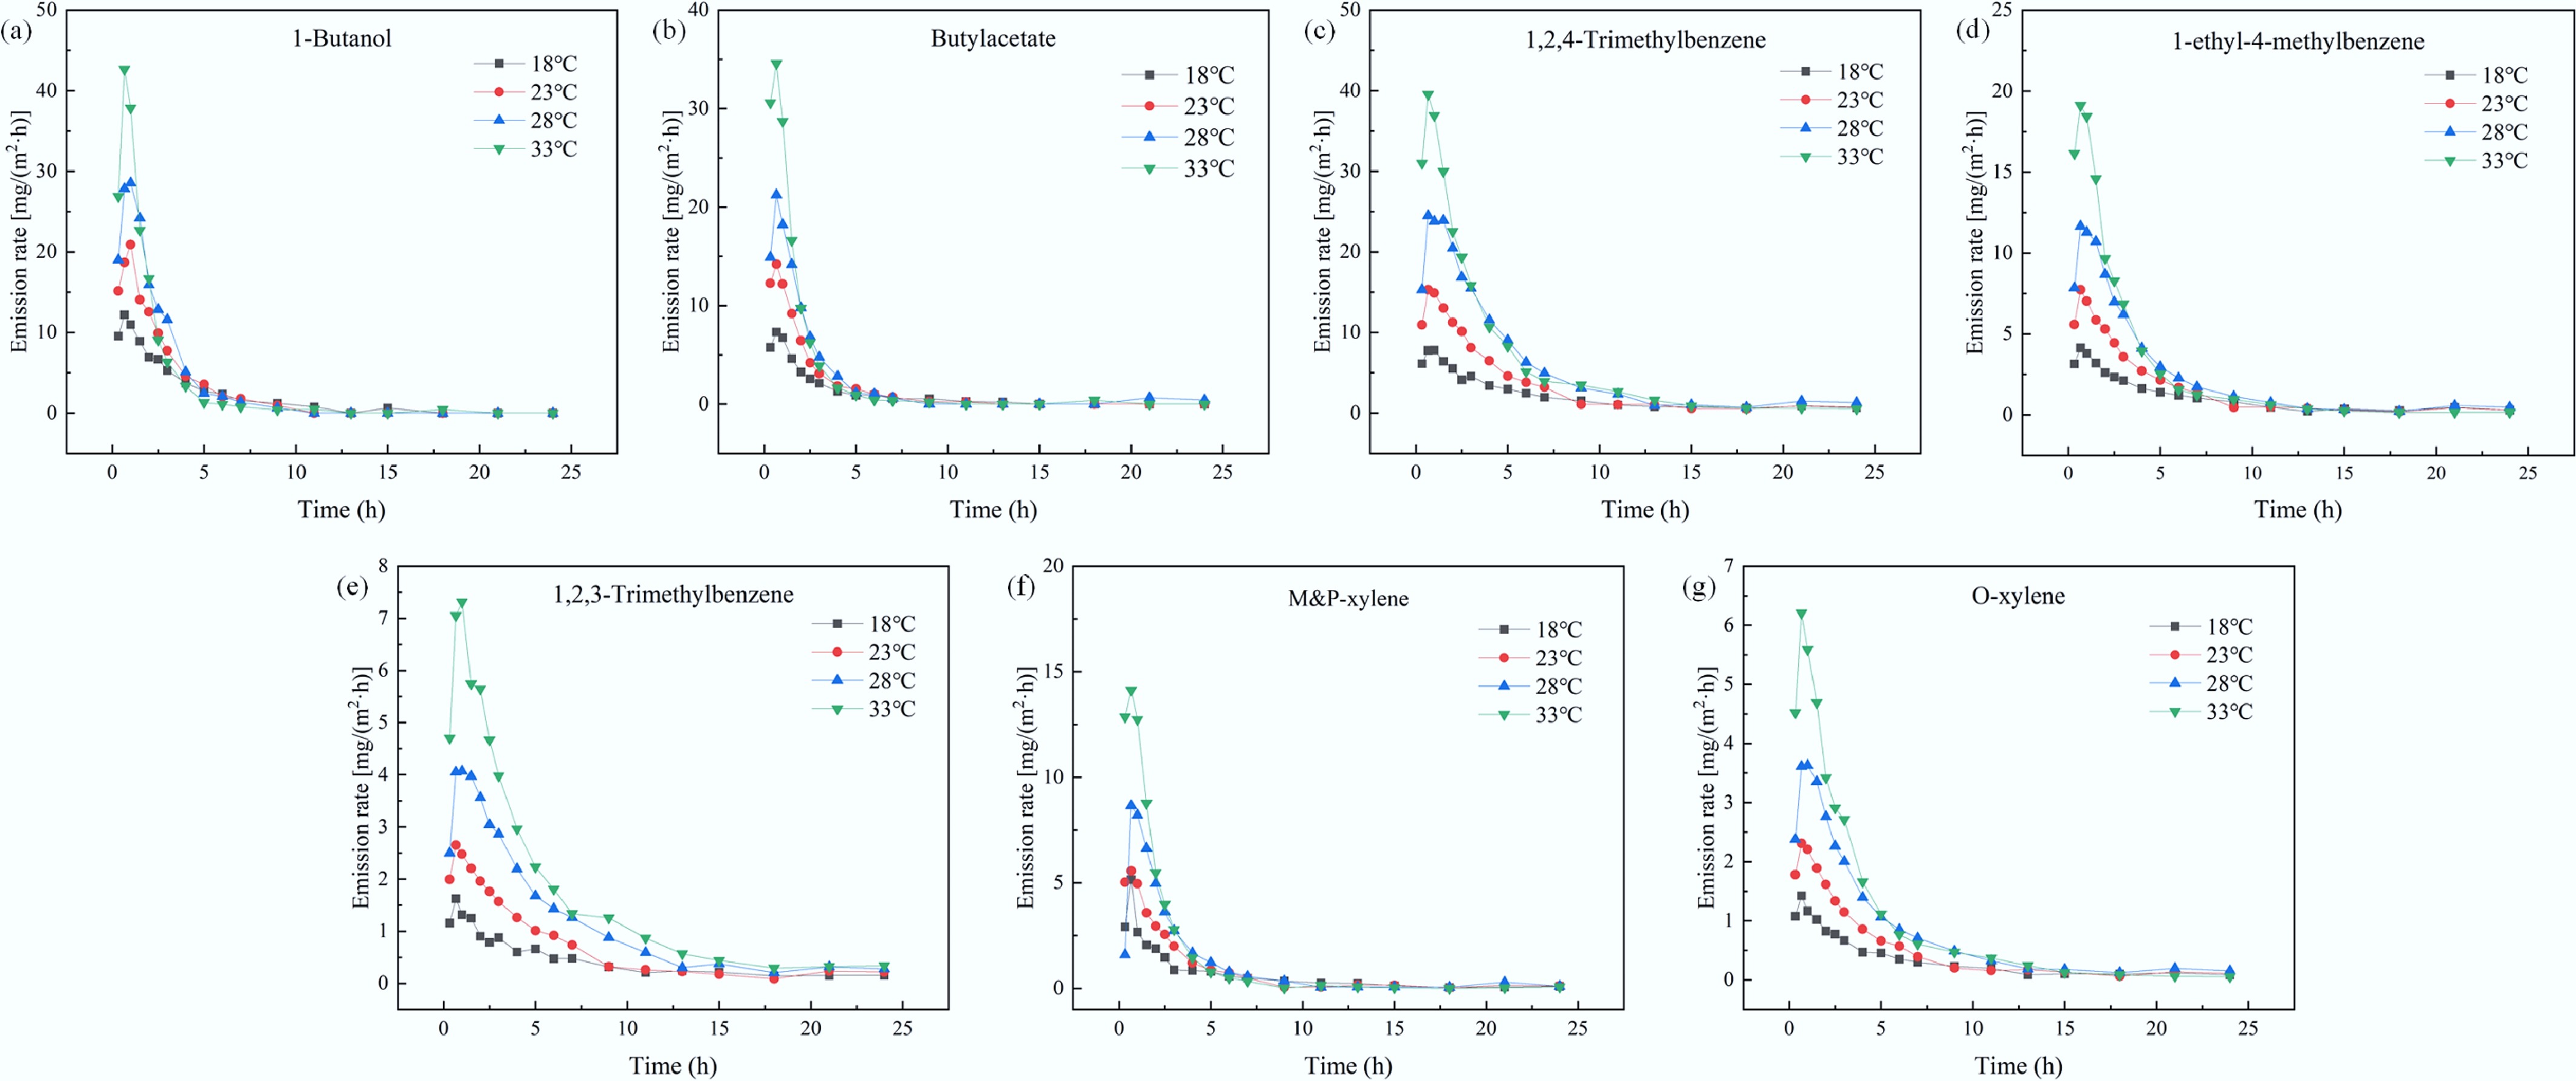
Figure 4.
Emission rate of VOCs from OBDPS at different temperatures.
-
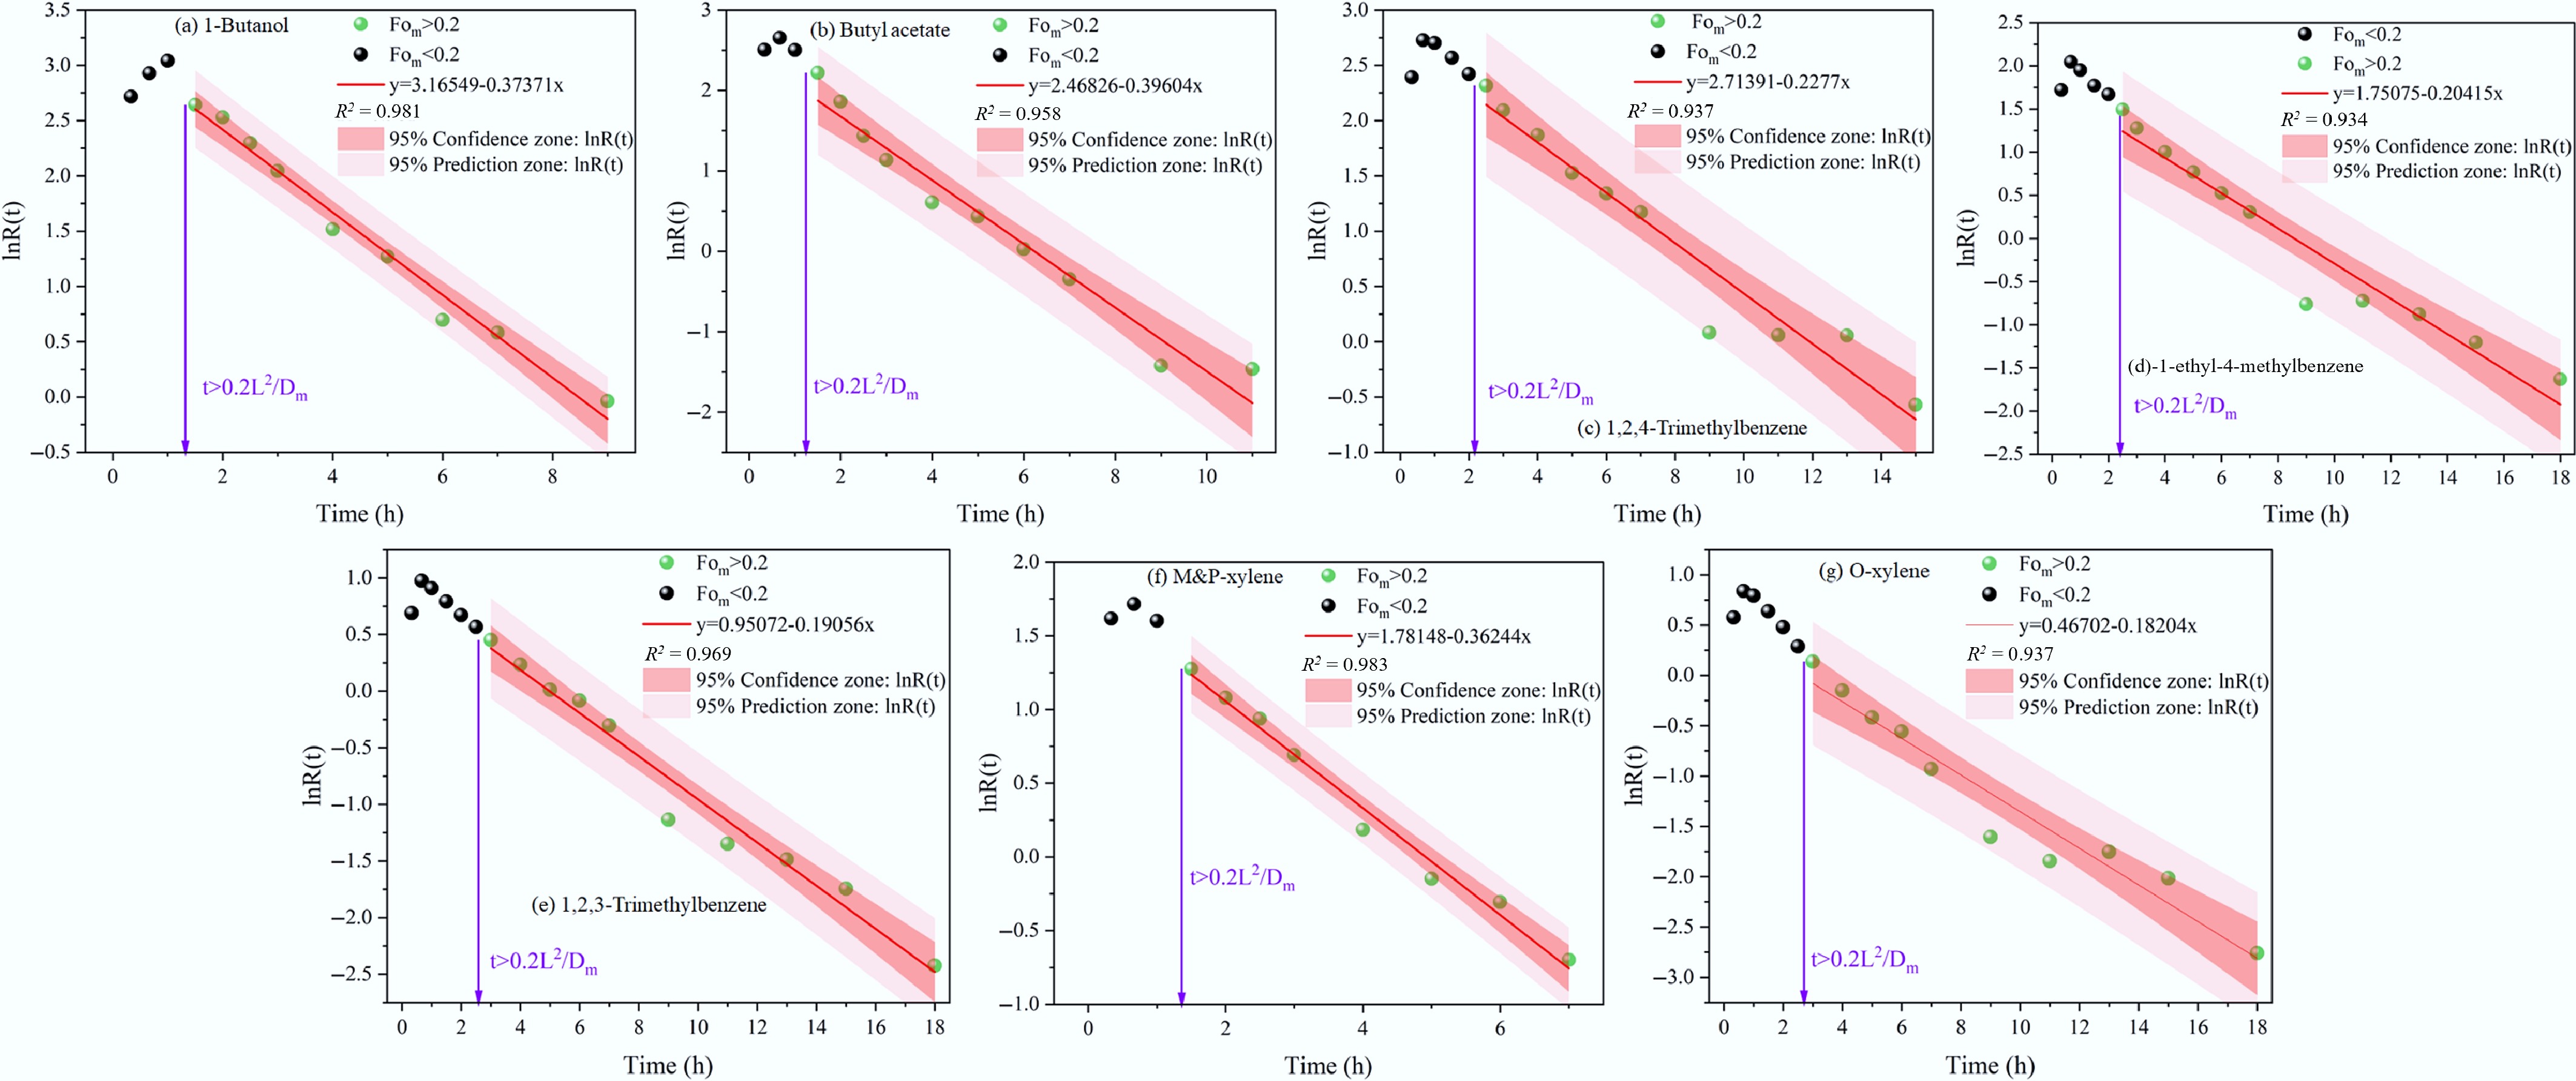
Figure 5.
Linear fitting results for seven major pollutants at 23 °C.
-
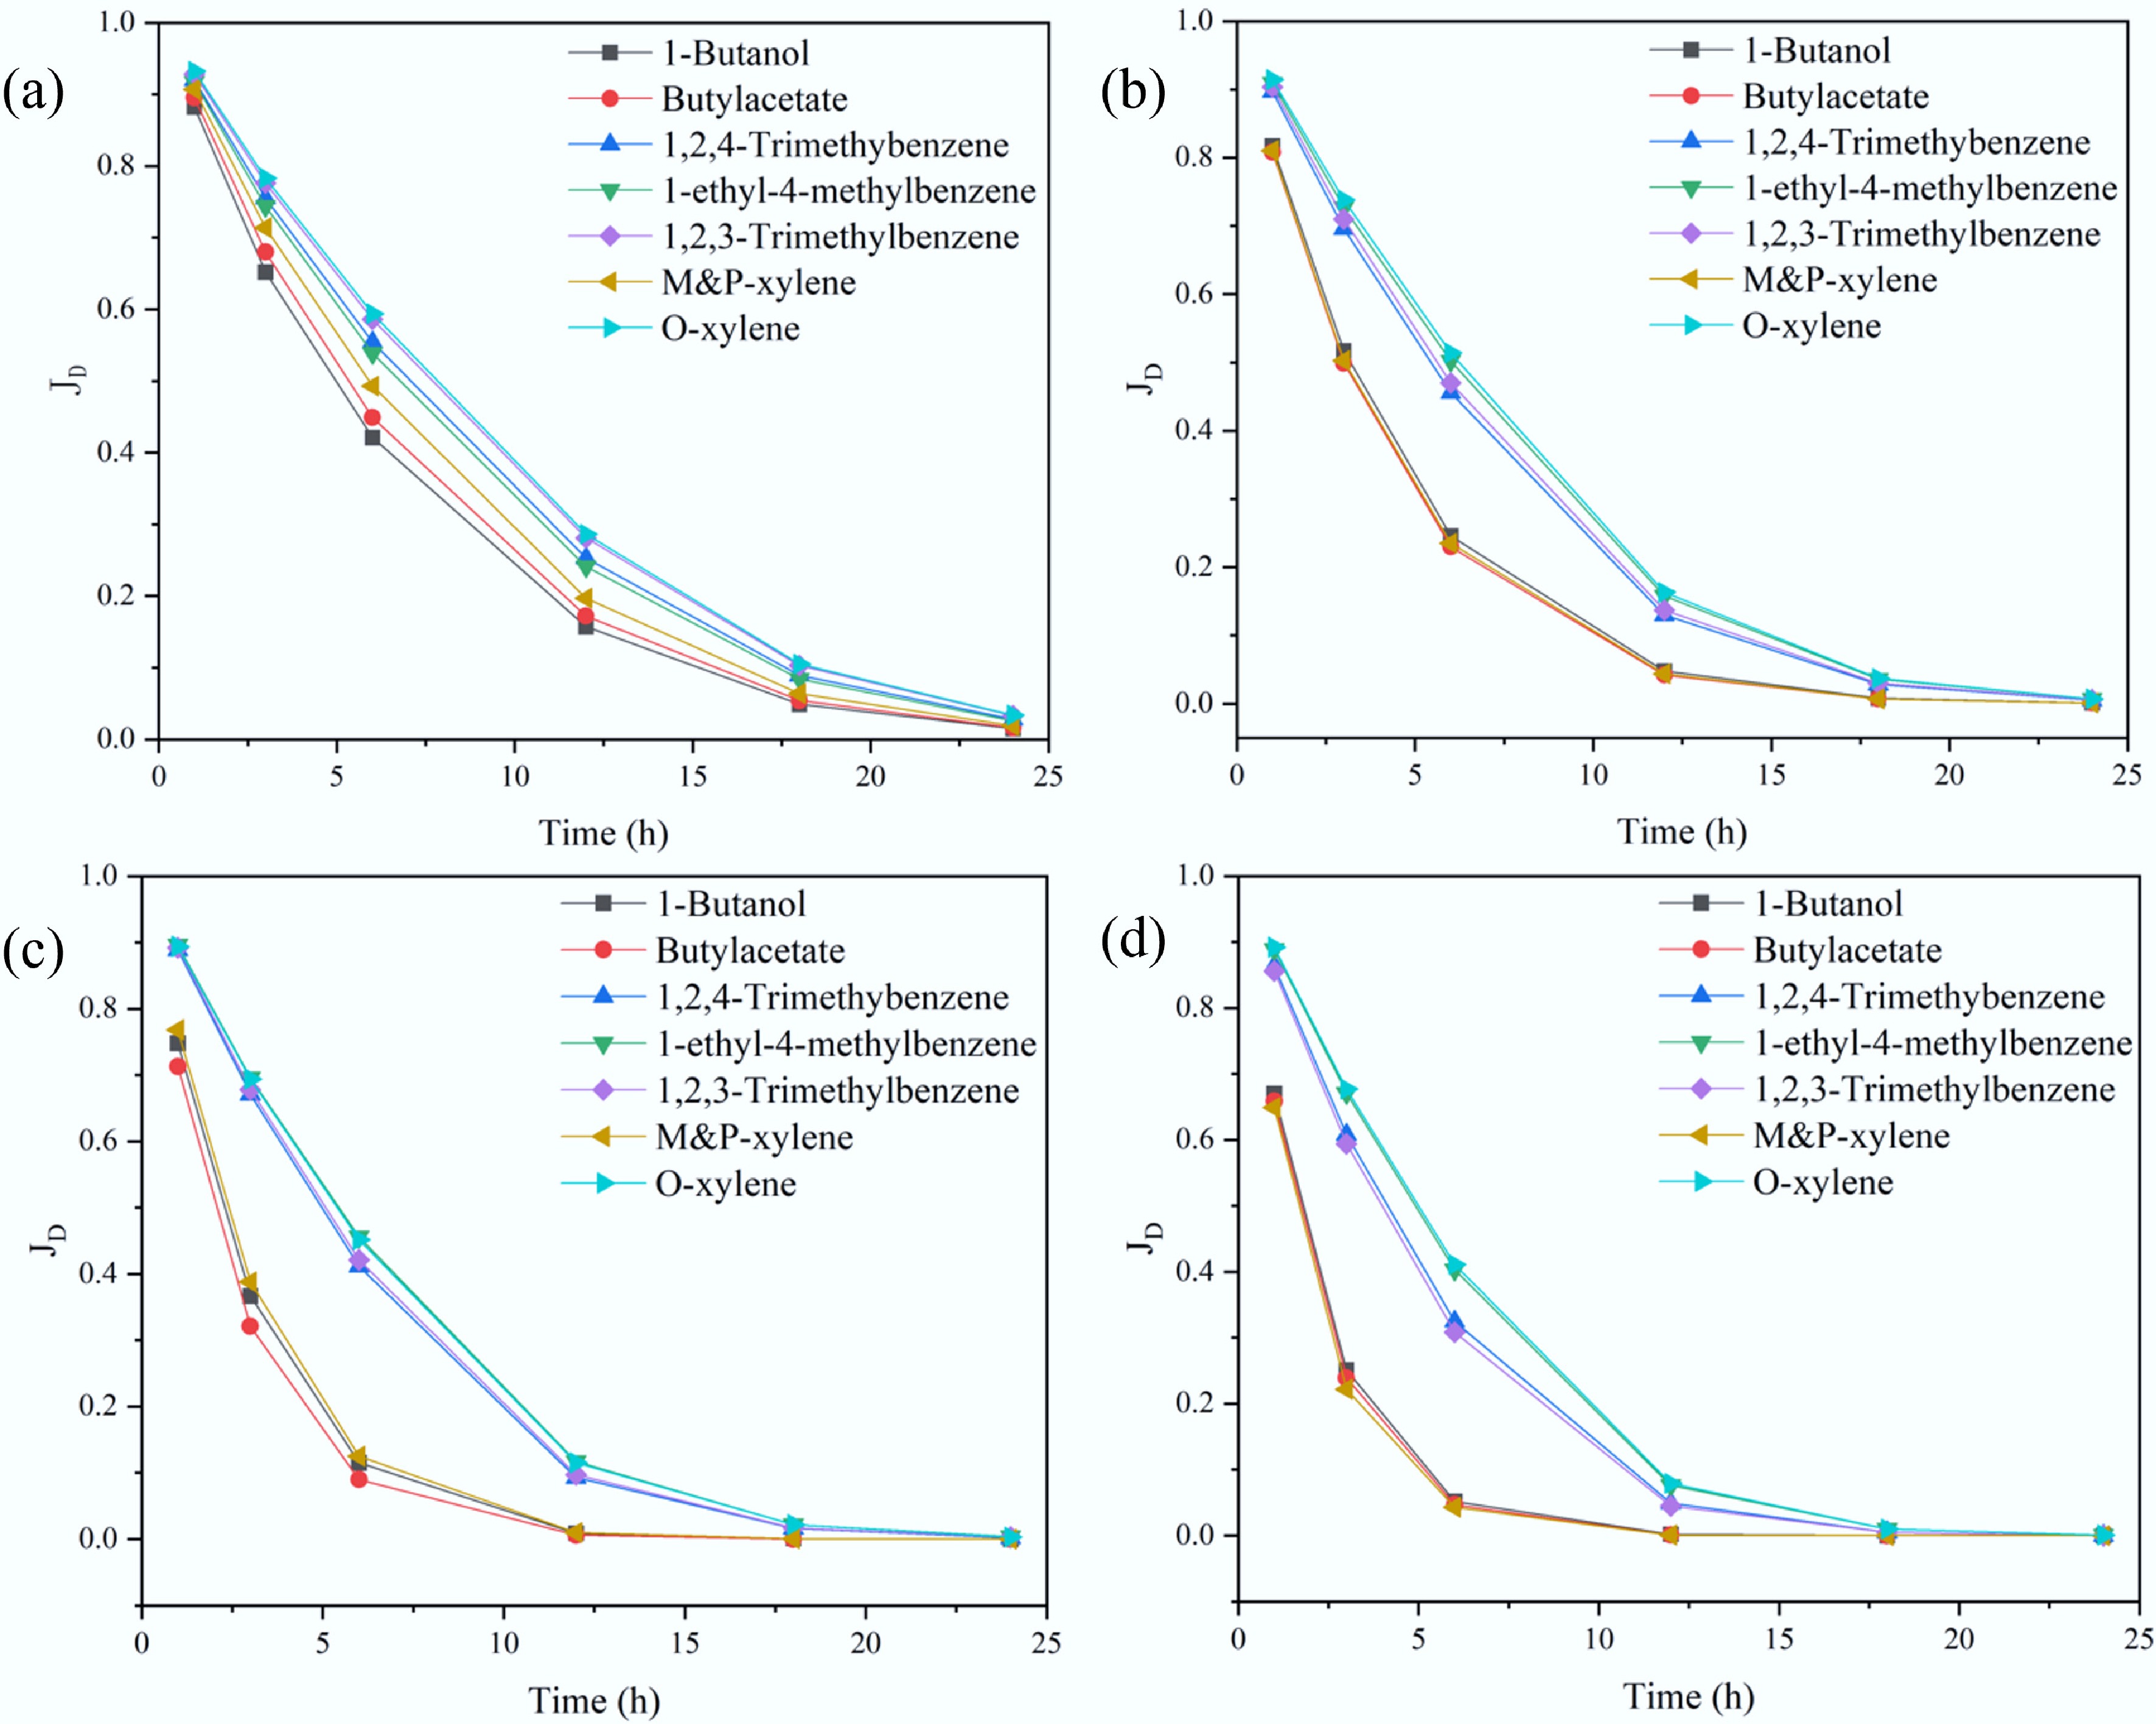
Figure 6.
Sensitivity analysis of Dm in a semi-infinite diffusion scenario at different temperatures. (a) 18 °C, (b) 23 °C, (c) 28 °C, and (d) 33 °C.
-
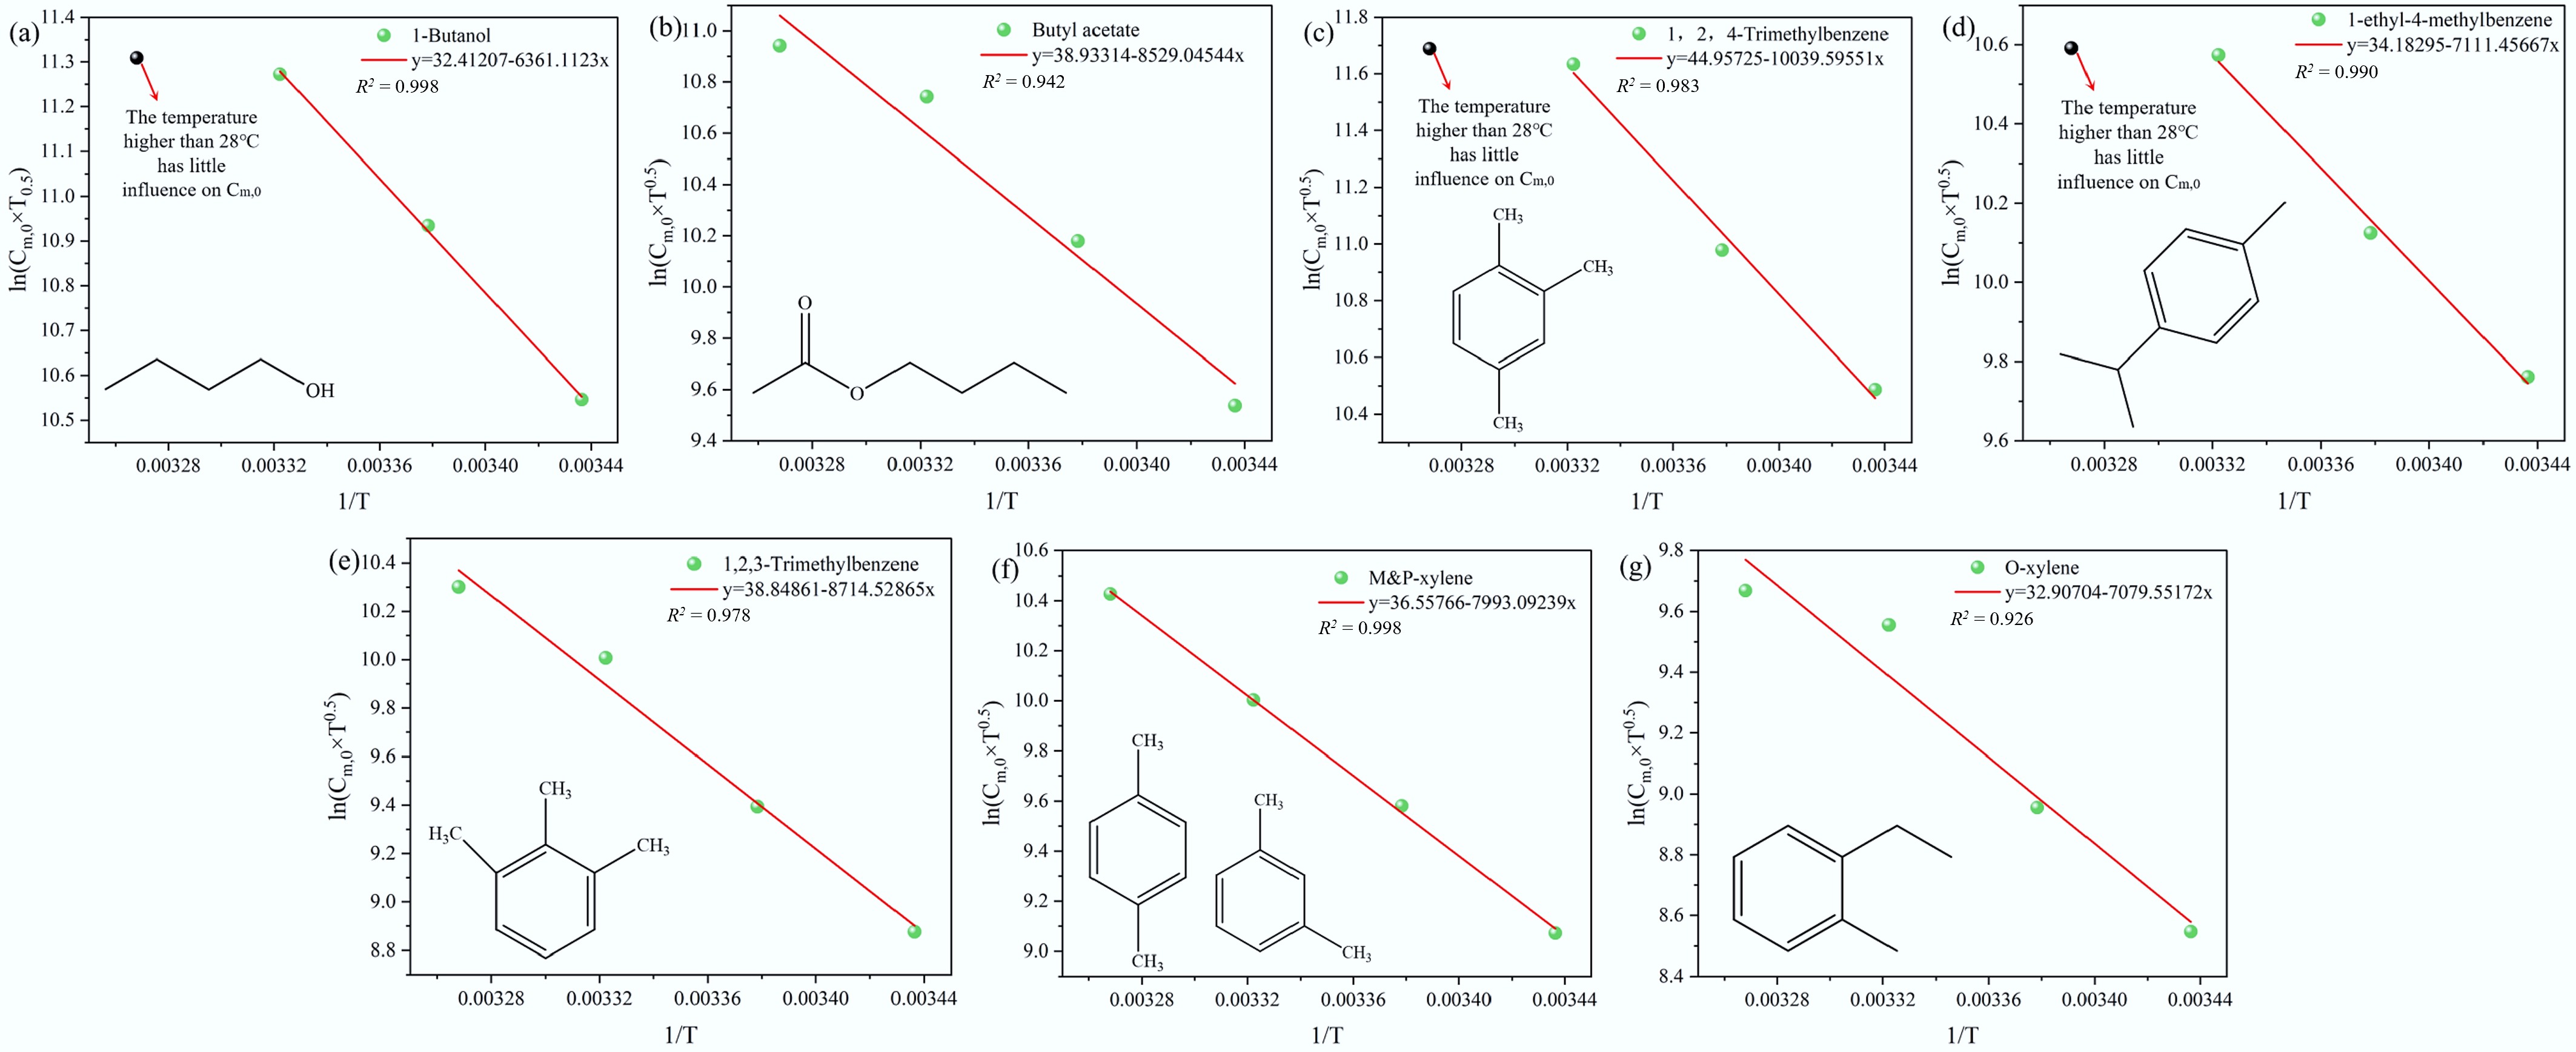
Figure 7.
Curves of Cm,0 by fitting the experimental values.
-
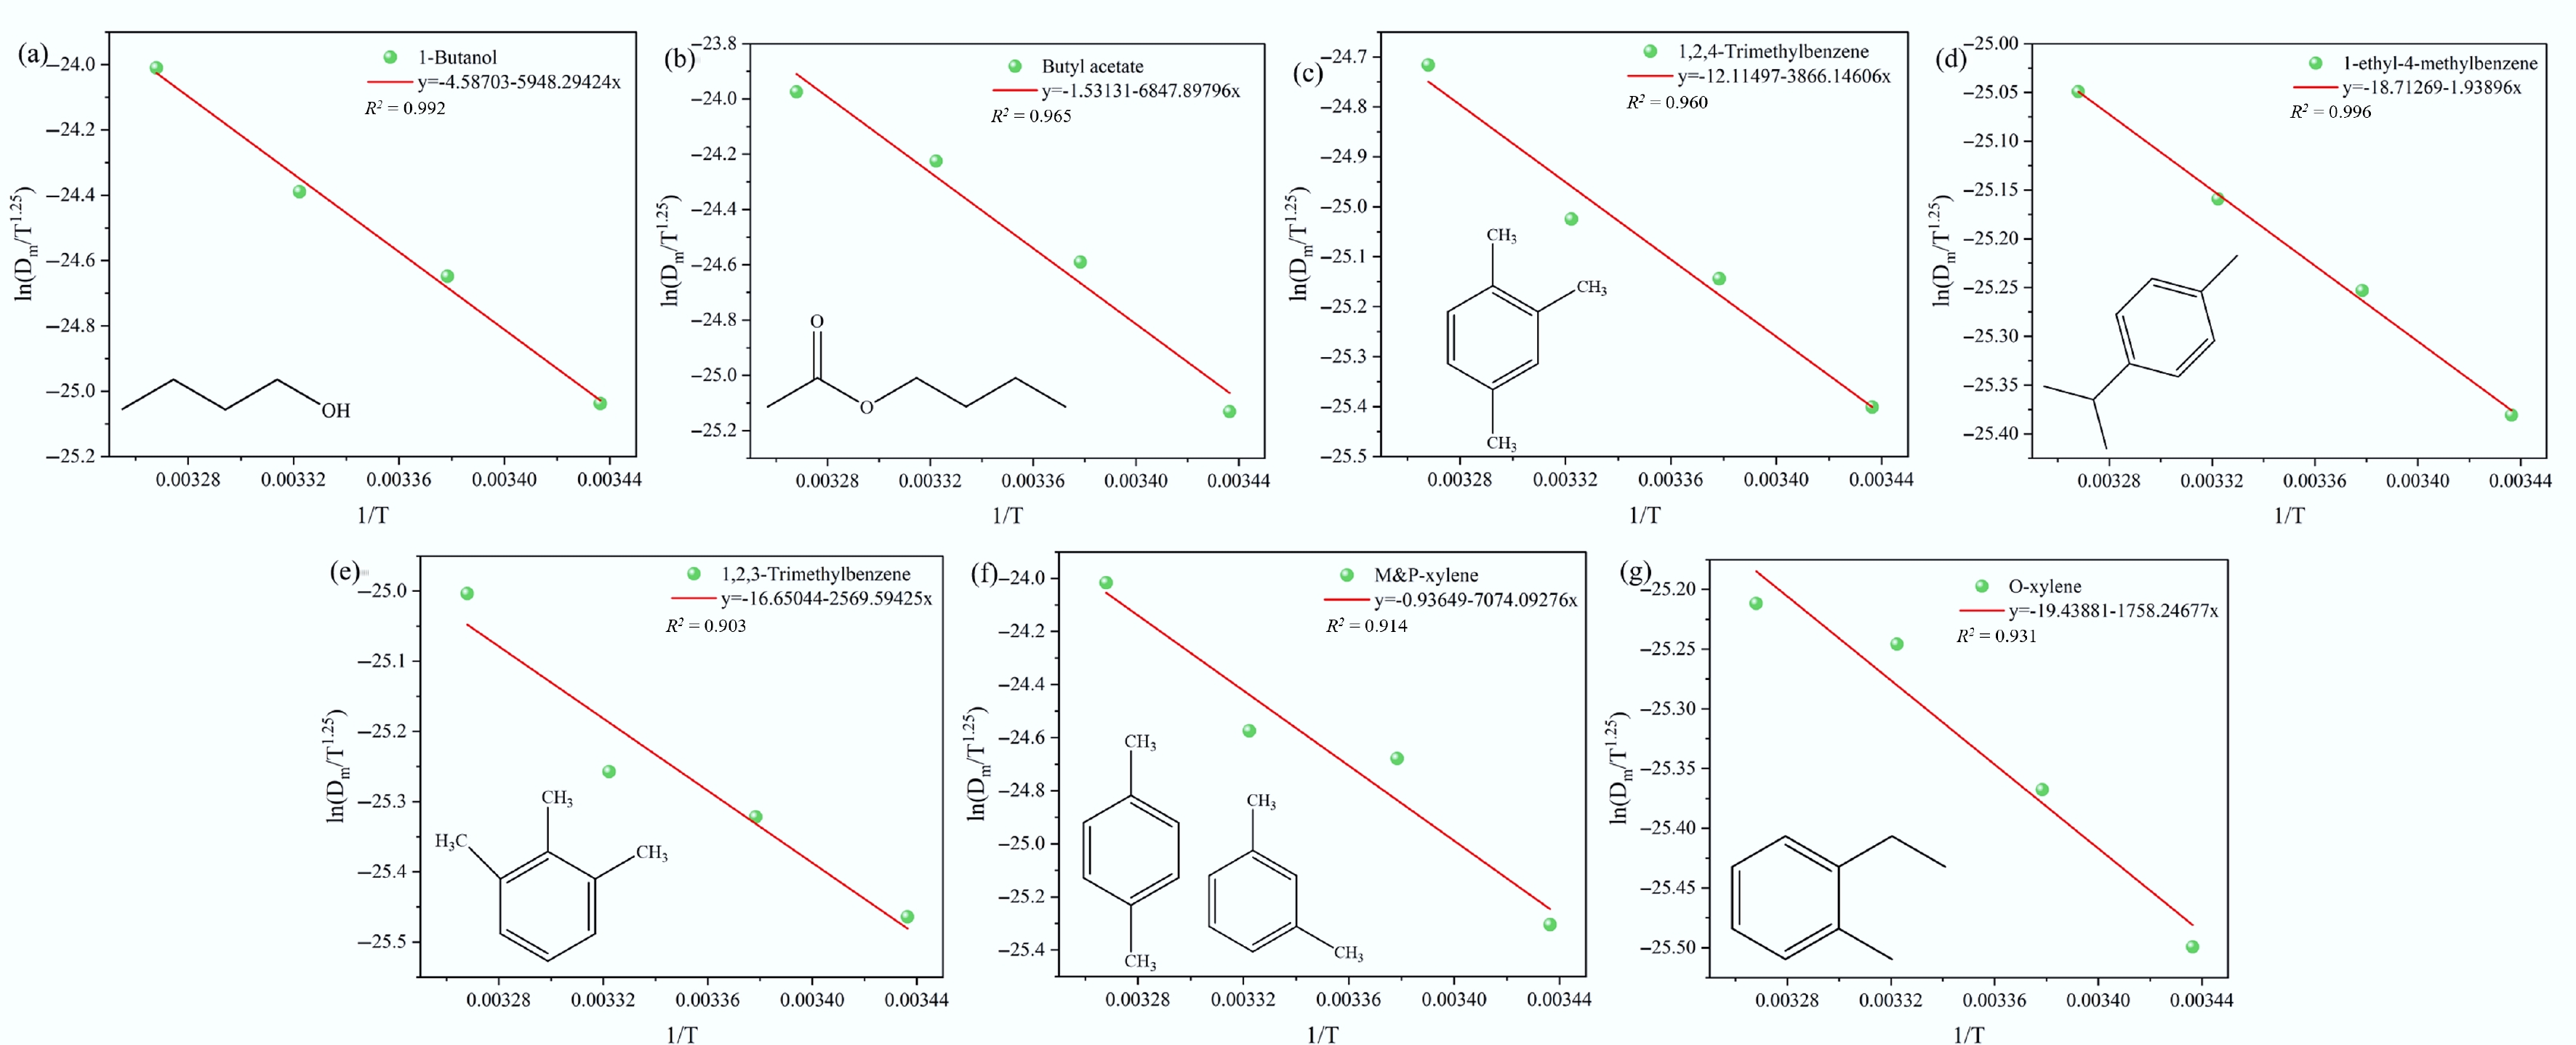
Figure 8.
Curves of Dm by fitting the experimental values.
-
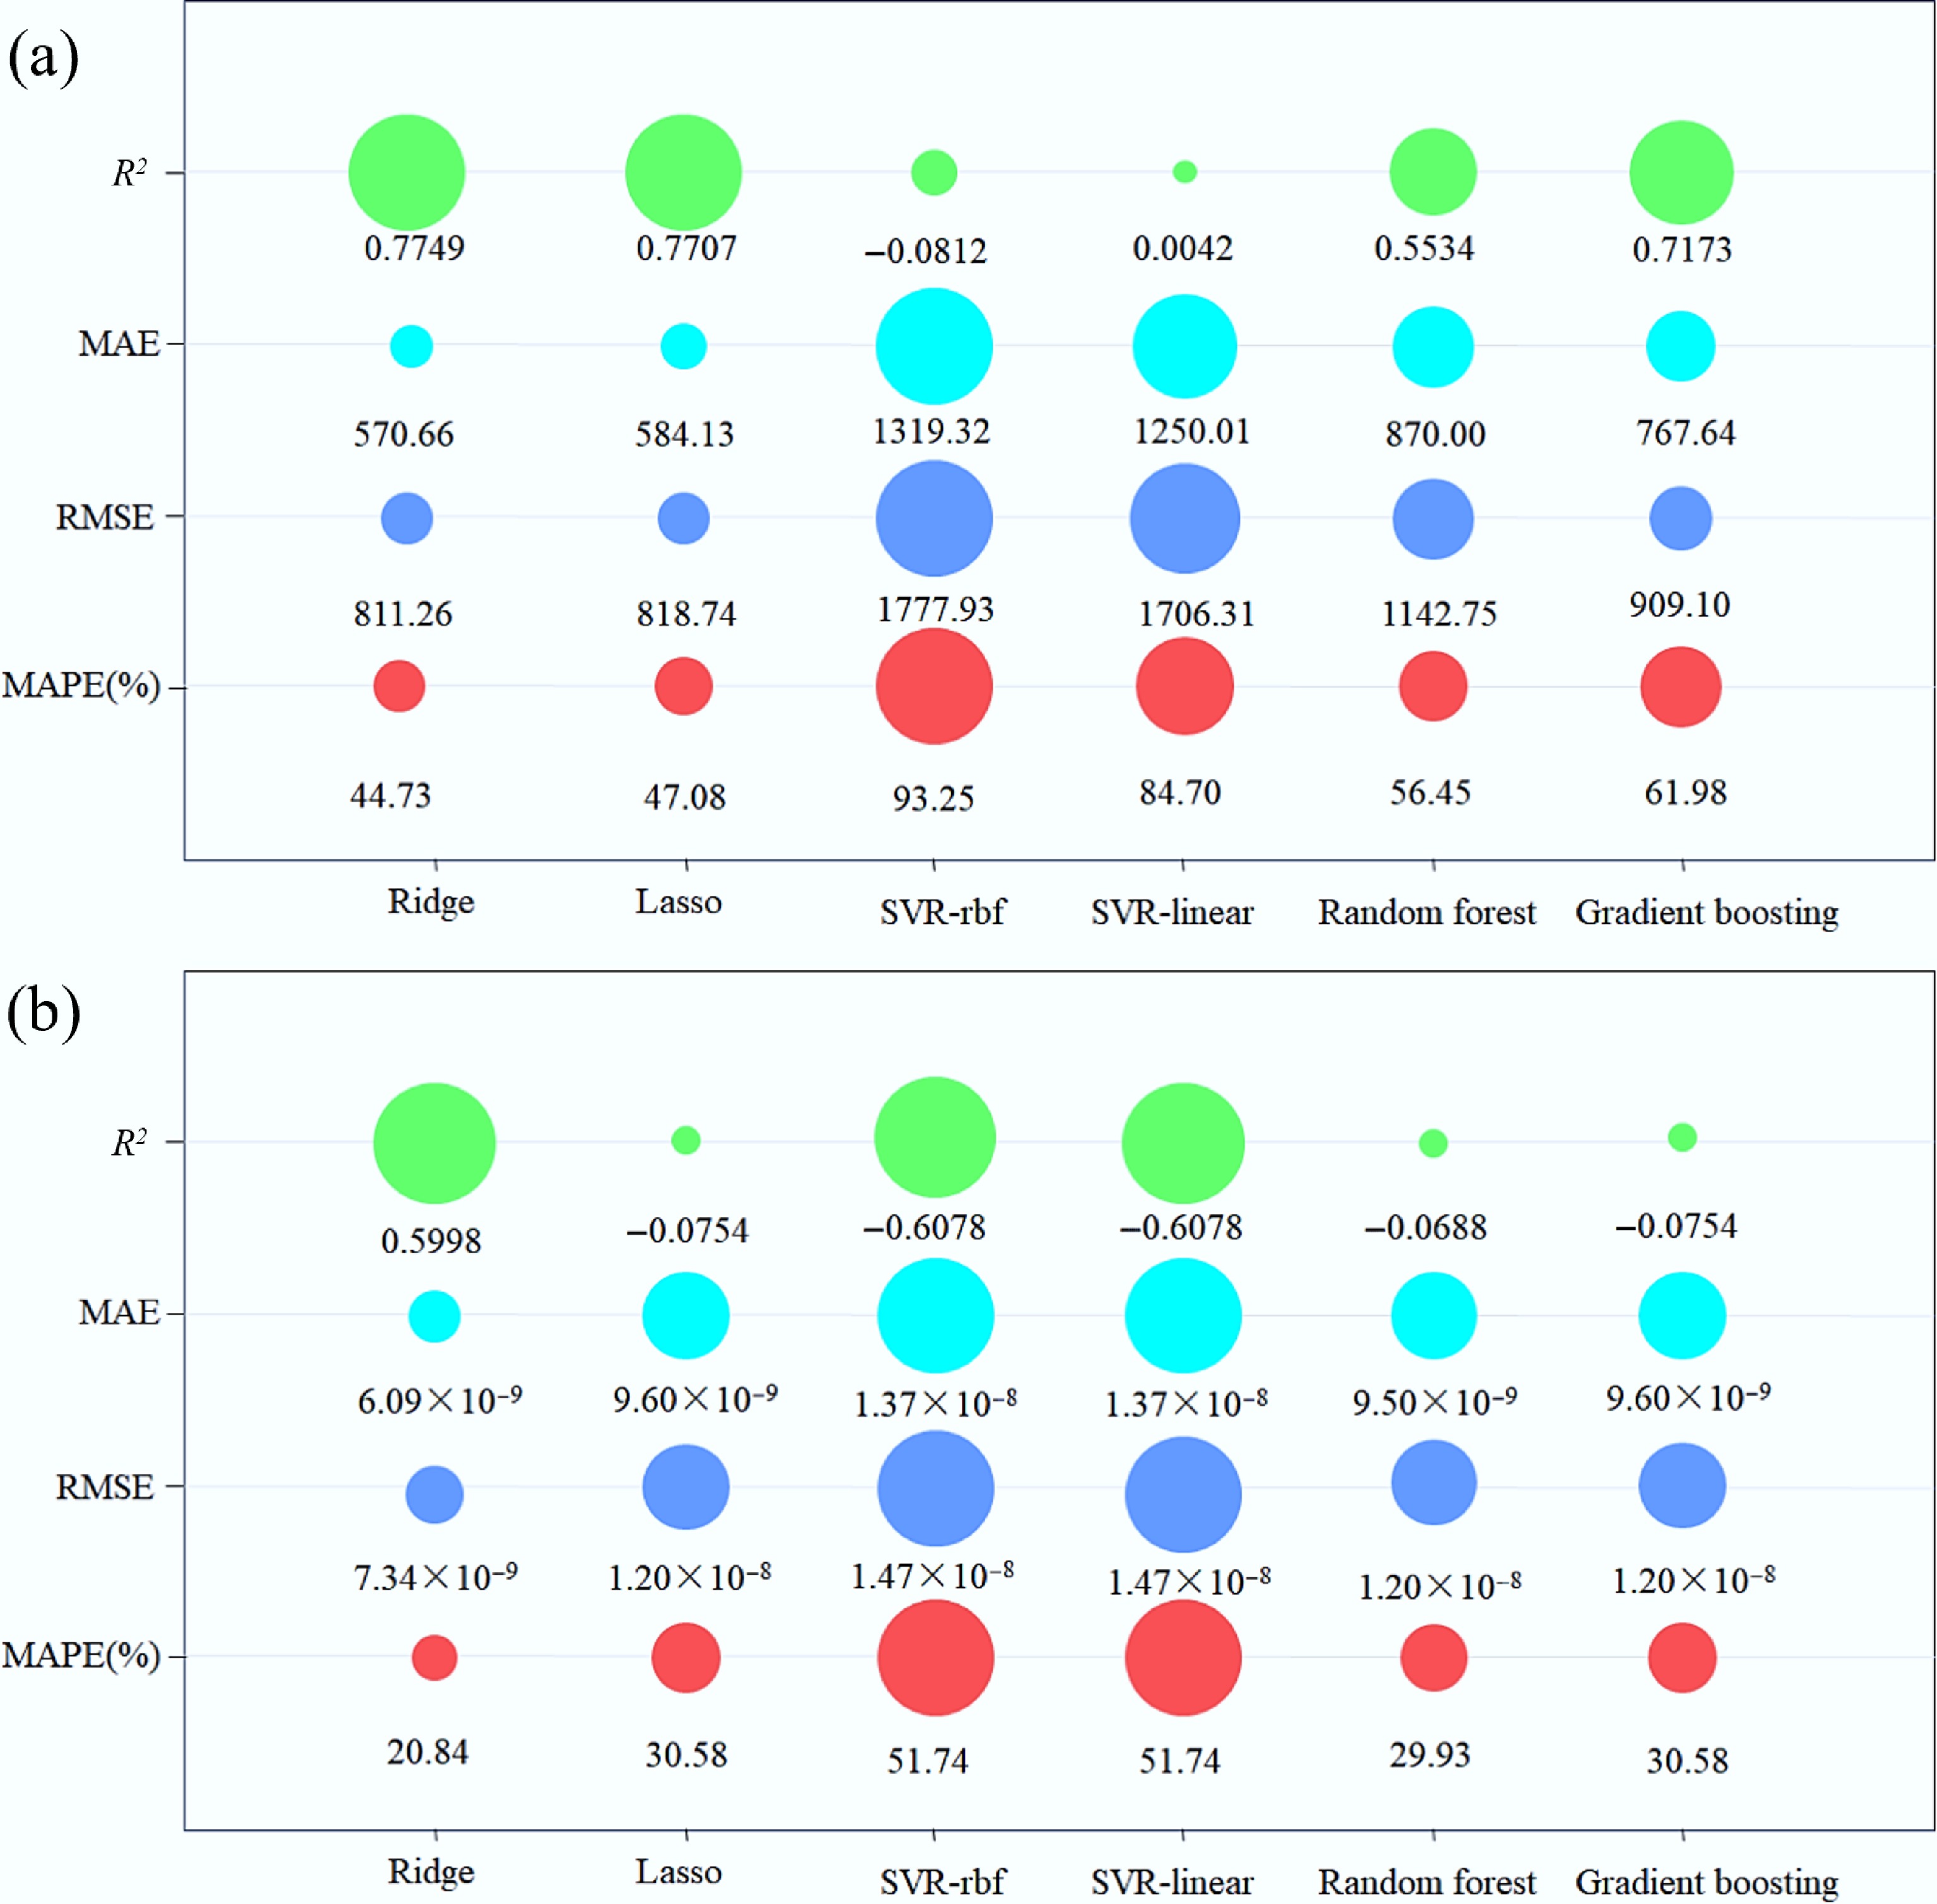
Figure 9.
Performance comparison of different machine learning models for predicting (a) Cm,0, and (b) Dm.
-
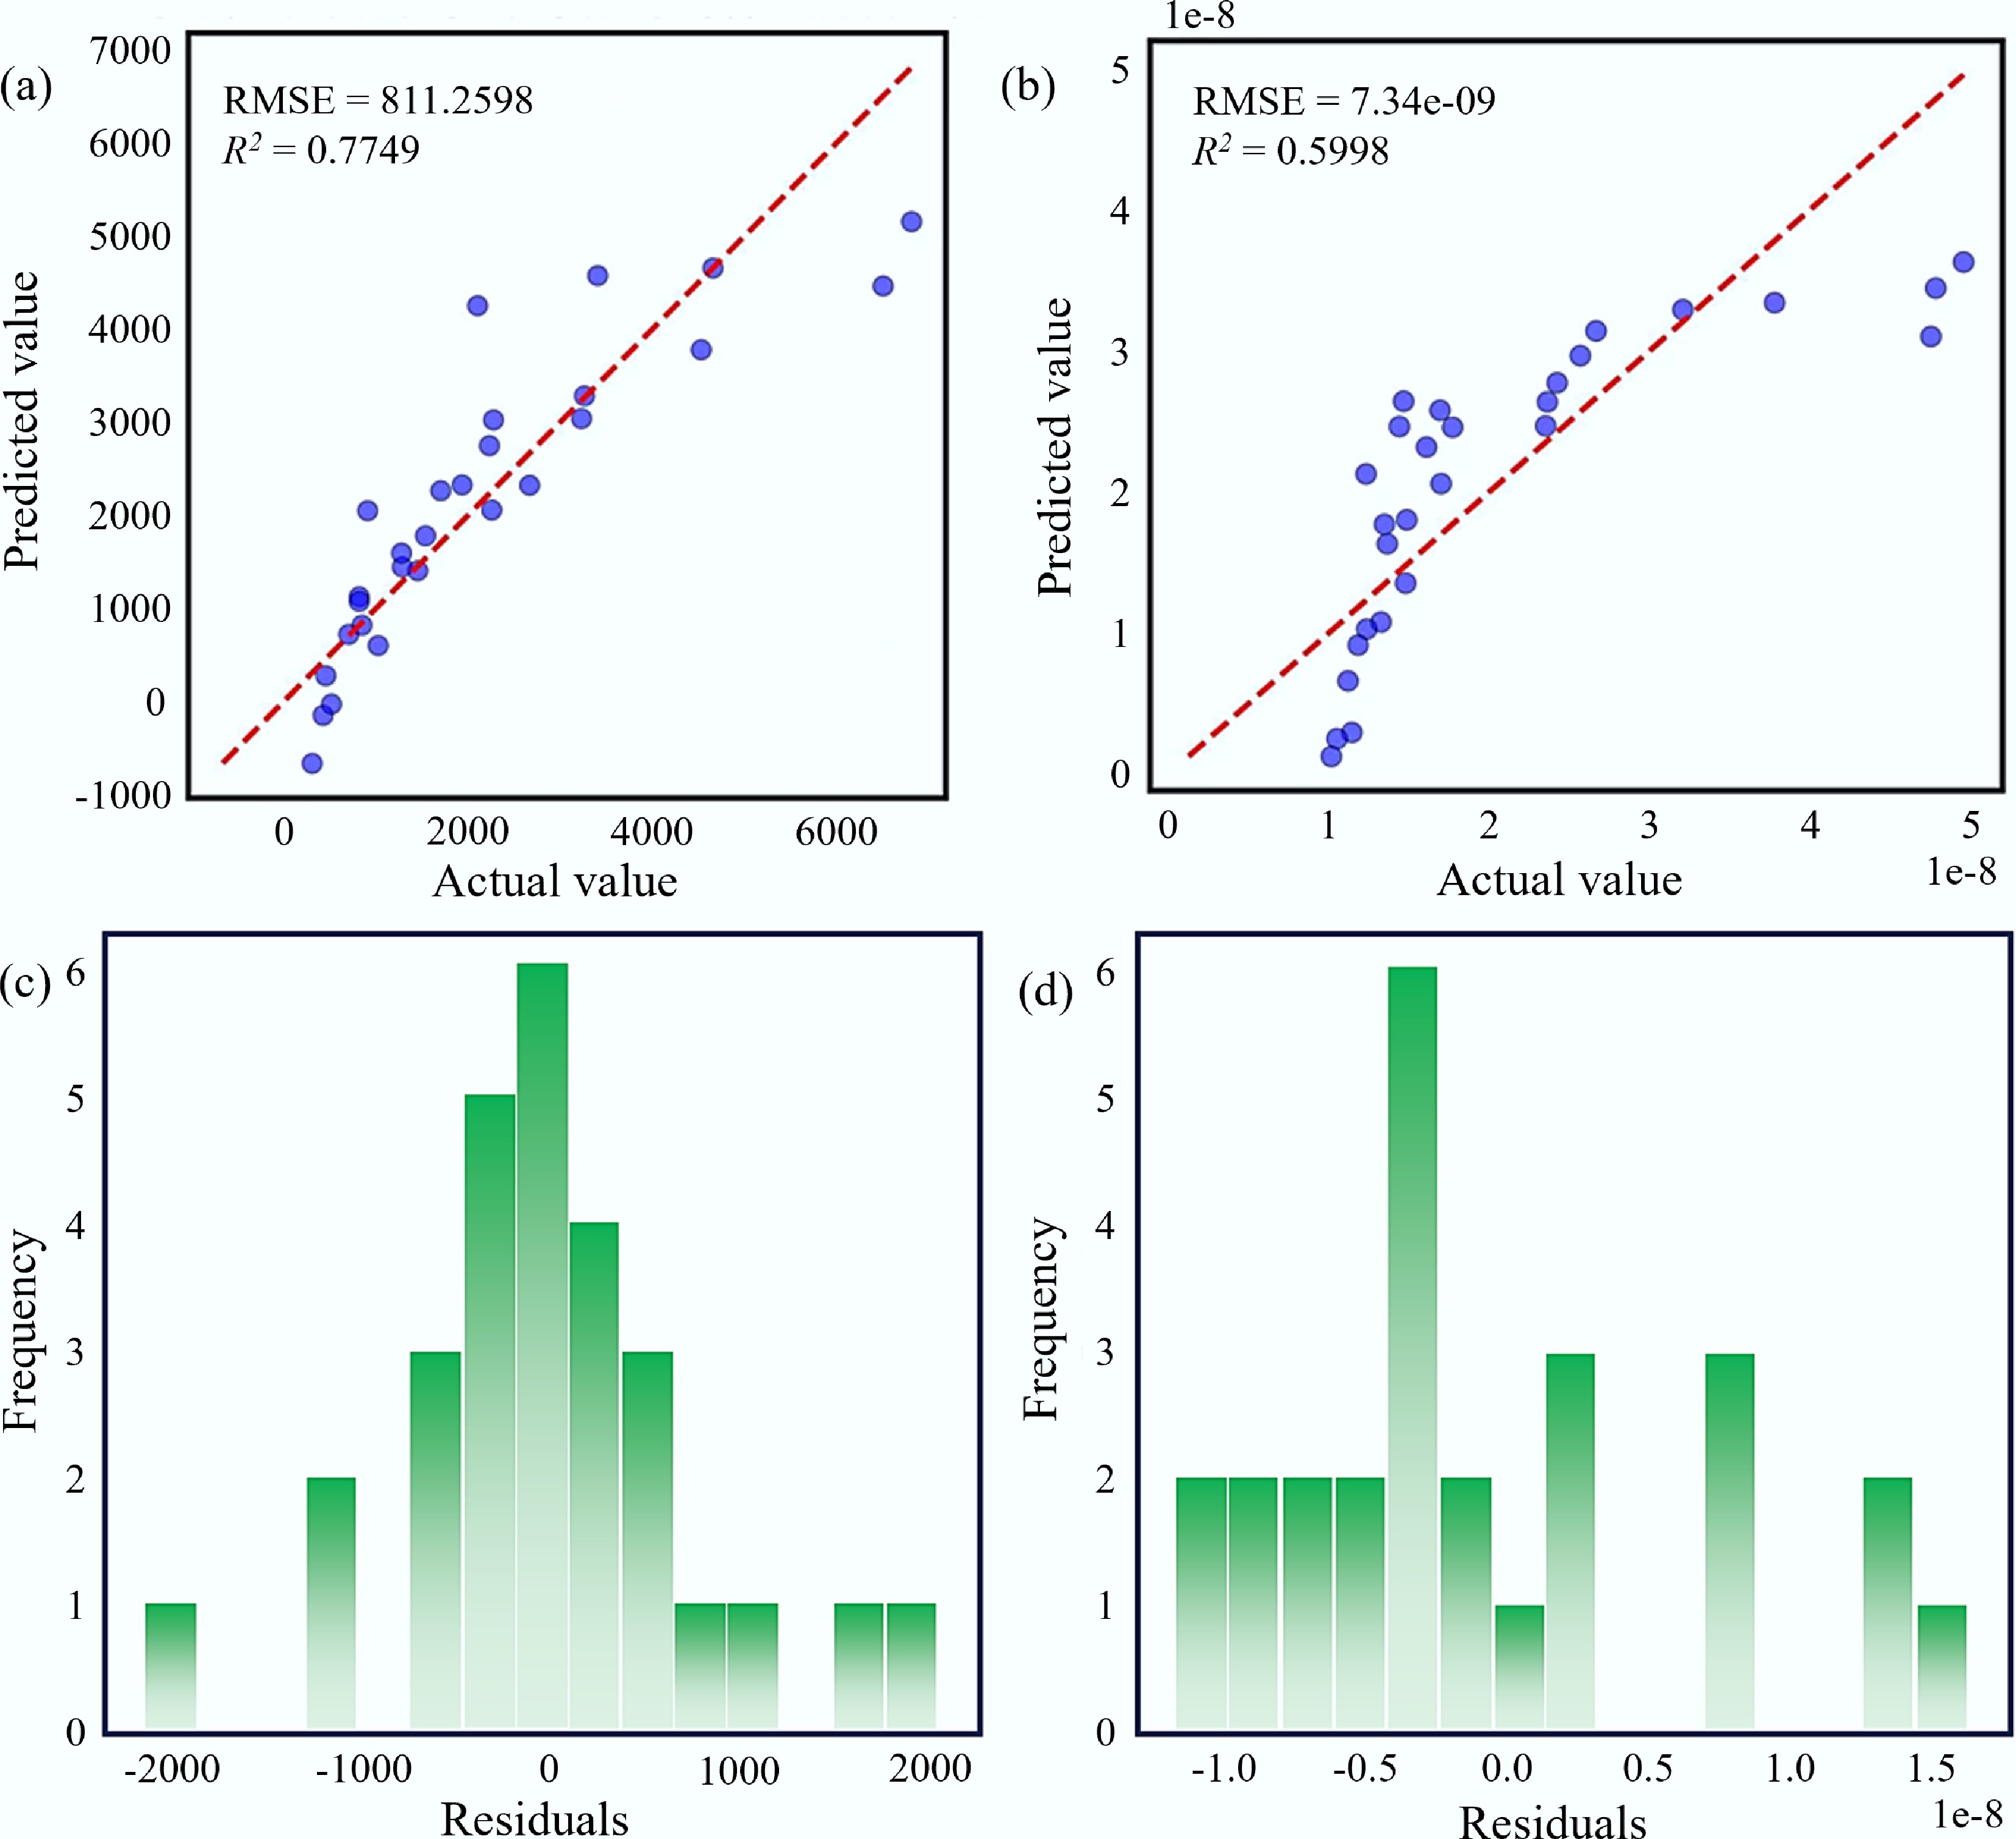
Figure 10.
(a) Cm,0-leave-one-out cross validation; (b) Dm-leave-one-out cross validation; (c) Cm,0-residual distribution; (d) Dm-residual distribution.
-
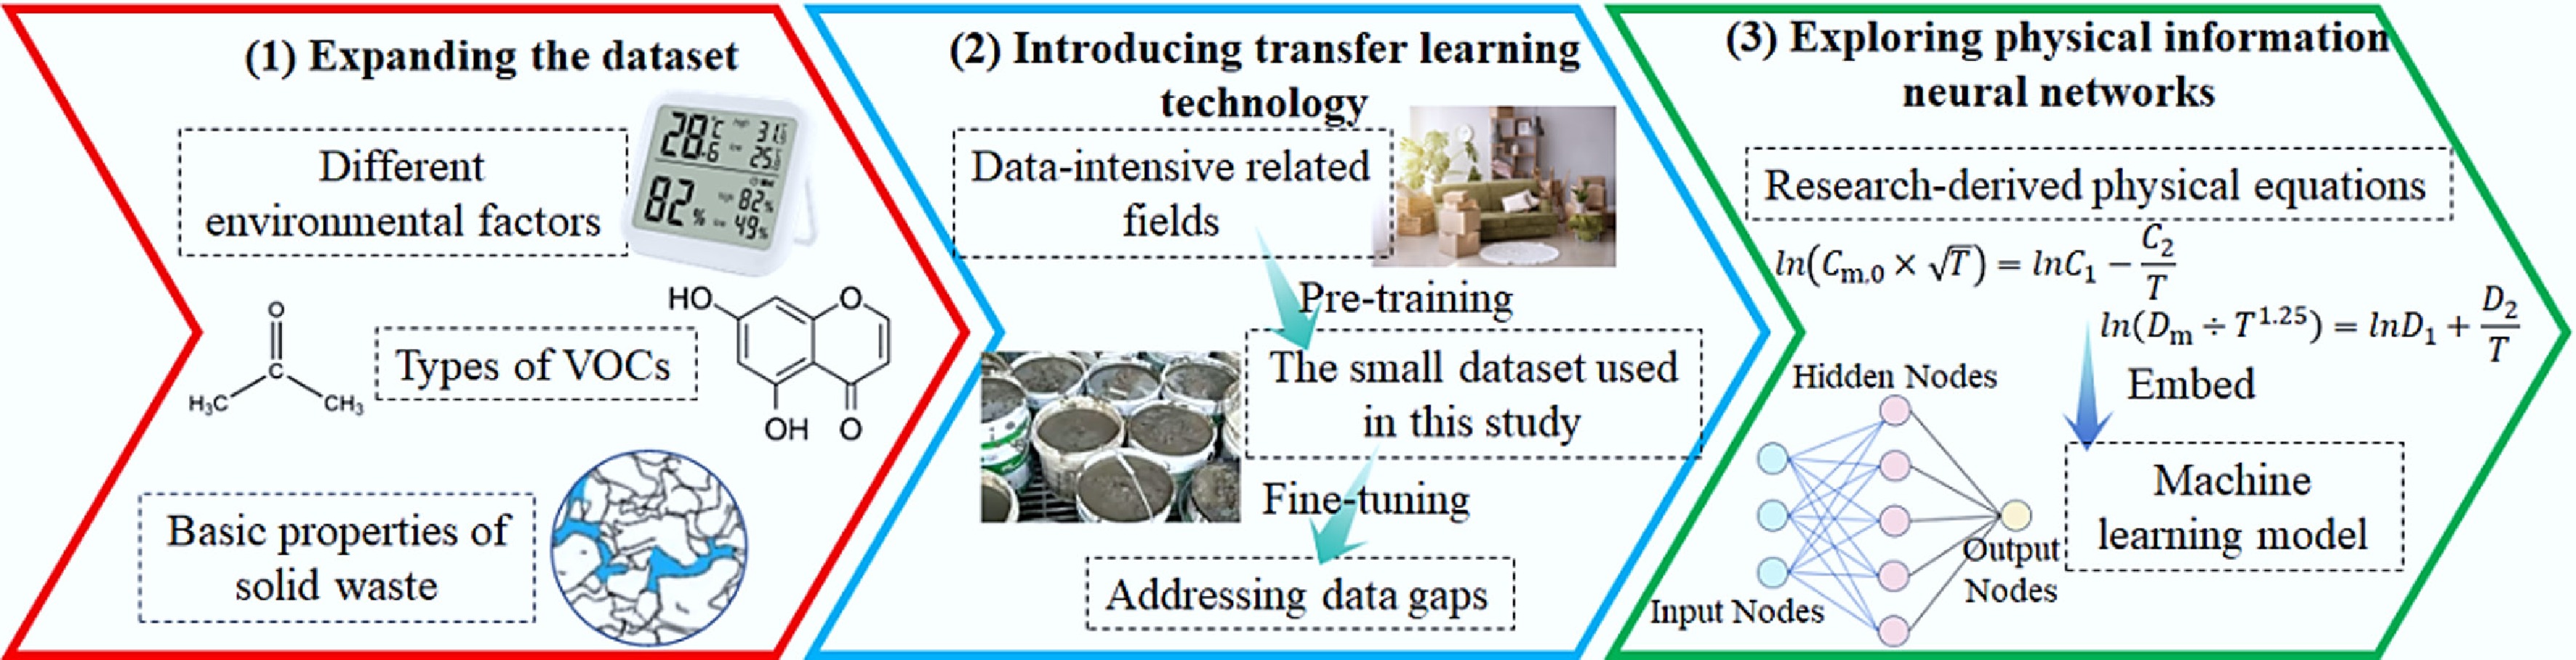
Figure 11.
Key research directions for the future.
-
Temperature Types of VOCs Cm,0 (μg m−3) Dm (m2 s−1) R2 18 °C 1-Butanol 2.230 × 10³ 1.608 × 10⁻⁸ 0.967 Butylacetate 0.813 × 10³ 1.464 × 10⁻⁸ 0.938 1,2,4-Trimethybenzene 2.101 × 10³ 1.118 × 10⁻⁸ 0.991 1-Ethyl-4-methylbenzene 1.017 × 10³ 1.141 × 10⁻⁸ 0.980 1,2,3-Trimethylbenzene 0.419 × 10³ 1.049 × 10⁻⁸ 0.925 M&P-xylene 0.510 × 10³ 1.231 × 10⁻⁸ 0.950 O-xylene 0.302 × 10³ 1.013 × 10⁻⁸ 0.934 23 °C 1-Butanol 3.260 × 10³ 2.423 × 10⁻⁸ 0.981 Butylacetate 1.532 × 10³ 2.568 × 10⁻⁸ 0.958 1,2,4-Trimethybenzene 3.406 × 10³ 1.477 × 10⁻⁸ 0.937 1-Ethyl-4-methylbenzene 1.450 × 10³ 1.324 × 10⁻⁸ 0.934 1,2,3-Trimethylbenzene 0.698 × 10³ 1.236 × 10⁻⁸ 0.969 M&P-xylene 0.842 × 10³ 2.350 × 10⁻⁸ 0.983 O-xylene 0.450 × 10³ 1.180 × 10⁻⁸ 0.937 28 °C 1-Butanol 4.531 × 10³ 3.207 × 10⁻⁸ 0.977 Butylacetate 2.667 × 10³ 3.778 × 10⁻⁸ 0.979 1,2,4-Trimethybenzene 6.507 × 10³ 1.699 × 10⁻⁸ 0.988 1-Ethyl-4-methylbenzene 2.253 × 10³ 1.485 × 10⁻⁸ 0.975 1,2,3-Trimethylbenzene 1.278 × 10³ 1.346 × 10⁻⁸ 0.986 M&P-xylene 1.273 × 10³ 2.665 × 10⁻⁸ 0.969 O-xylene 0.814 × 10³ 1.362 × 10⁻⁸ 0.979 33 °C 1-Butanol 4.660 × 10³ 4.782 × 10⁻⁸ 0.977 Butylacetate 3.228 × 10³ 4.957 × 10⁻⁸ 0.976 1,2,4-Trimethybenzene 6.816 × 10³ 2.361 × 10⁻⁸ 0.994 1-Ethyl-4-methylbenzene 2.274 × 10³ 1.692 × 10⁻⁸ 0.958 1,2,3-Trimethylbenzene 1.700 × 10³ 1.771 × 10⁻⁸ 0.997 M&P-xylene 1.930 × 10³ 4.753 × 10⁻⁸ 0.957 O-xylene 0.904 × 10³ 1.438 × 10⁻⁸ 0.964 Table 1.
Effect of temperature on Cm,0, Dm and R2
Figures
(11)
Tables
(1)