


-
Paint sludge is the waste residue produced during the painting, levelling, and drying processes of automobiles. It is classified as hazardous waste due to its high concentration of VOCs[1−4]. Disposing of paint sludge typically involves collecting it in sealed containers before storing it for later disposal. Nevertheless, owing to improper management practices and unavoidable environmental factors, VOCs discharged from paint sludge may still diffuse into the environment, thereby causing detrimental impacts on the environment and human health[5−7]. Consequently, it is imperative to understand the emission behavior and characteristics of VOCs from paint sludge to achieve effective source-emission control.
In our previous study, we investigated VOC emissions from automotive paint sludge in a 60-L ventilated chamber[8]. The study revealed that diffusion control is the primary control mechanism for VOCs released by automotive paint sludge. Aromatic hydrocarbons exhibited lower emission rates than oxygenated compounds from paint sludge into the ambient air. Since the effective diffusion pores in the wet paint sludge were filled with water, VOCs were more easily emitted from dry paint than from wet paint sludge. Moreover, the cumulative emission mass flux of single VOCs and total VOCs fitted well with the first-order kinetic equation. In light of the above discoveries, we subsequently established a diffusion-controlled prototype to describe the release behaviors of total VOCs from automotive solvent-based paint sludge[9]. Assuming that paint sludge was a homogeneous solid material, the diffusion-controlled model was established based on the worst field management scenario. This scenario was characterized by two key parameters, namely, the diffusion coefficient (Dm) and the initial emittable concentration (Cm,0). Finally, the model was validated using environmental data from a ventilated test chamber, demonstrating its reliability and effectiveness.
A plethora of other studies have hitherto concentrated on formaldehyde and VOCs emanating from building materials. These studies have demonstrated that temperature exerts a considerable effect on the emission rate and the defining parameters. With increasing temperature, the emission rate, Cm,0, and Dm have often been reported in the literature to increase accordingly[10−12]. The temperature range of 15–30 °C caused a 1.5–129 increase in VOC emission rates and concentrations, as demonstrated by Lin et al.[13]. Wang et al.[11] reported that, for the key parameter Dm related to adsorption and desorption of VOCs, skin temperature rises with increasing temperature. Huang et al.[14] stated that Cm,0 of formaldehyde increases considerably with rising temperatures between 25.0 and 80.0 °C. Nevertheless, theoretical investigation into this significant occurrence is lacking, so it is challenging to ascertain Cm,0 at temperatures other than those employed in the trials.
We do not yet fully understand why and how emissions vary. This is because we do not yet understand the microscopic dynamic processes that occur when pollutants travel through materials, or their interactions with environmental conditions. As a result, we cannot predict how formaldehyde and VOC emissions from building materials will behave. This makes it difficult to develop effective models that can be used to prevent pollution. Although theoretical derivations and experimental validations have established physical relationships between temperature and emission parameters, these relationships are based on specific conditions. To explore the potential for developing more universal and rapid prediction models, we have preliminarily introduced machine learning methods to evaluate their performance on the currently limited dataset. This aims to provide guidance for subsequent research on leveraging experimental data to drive model development.
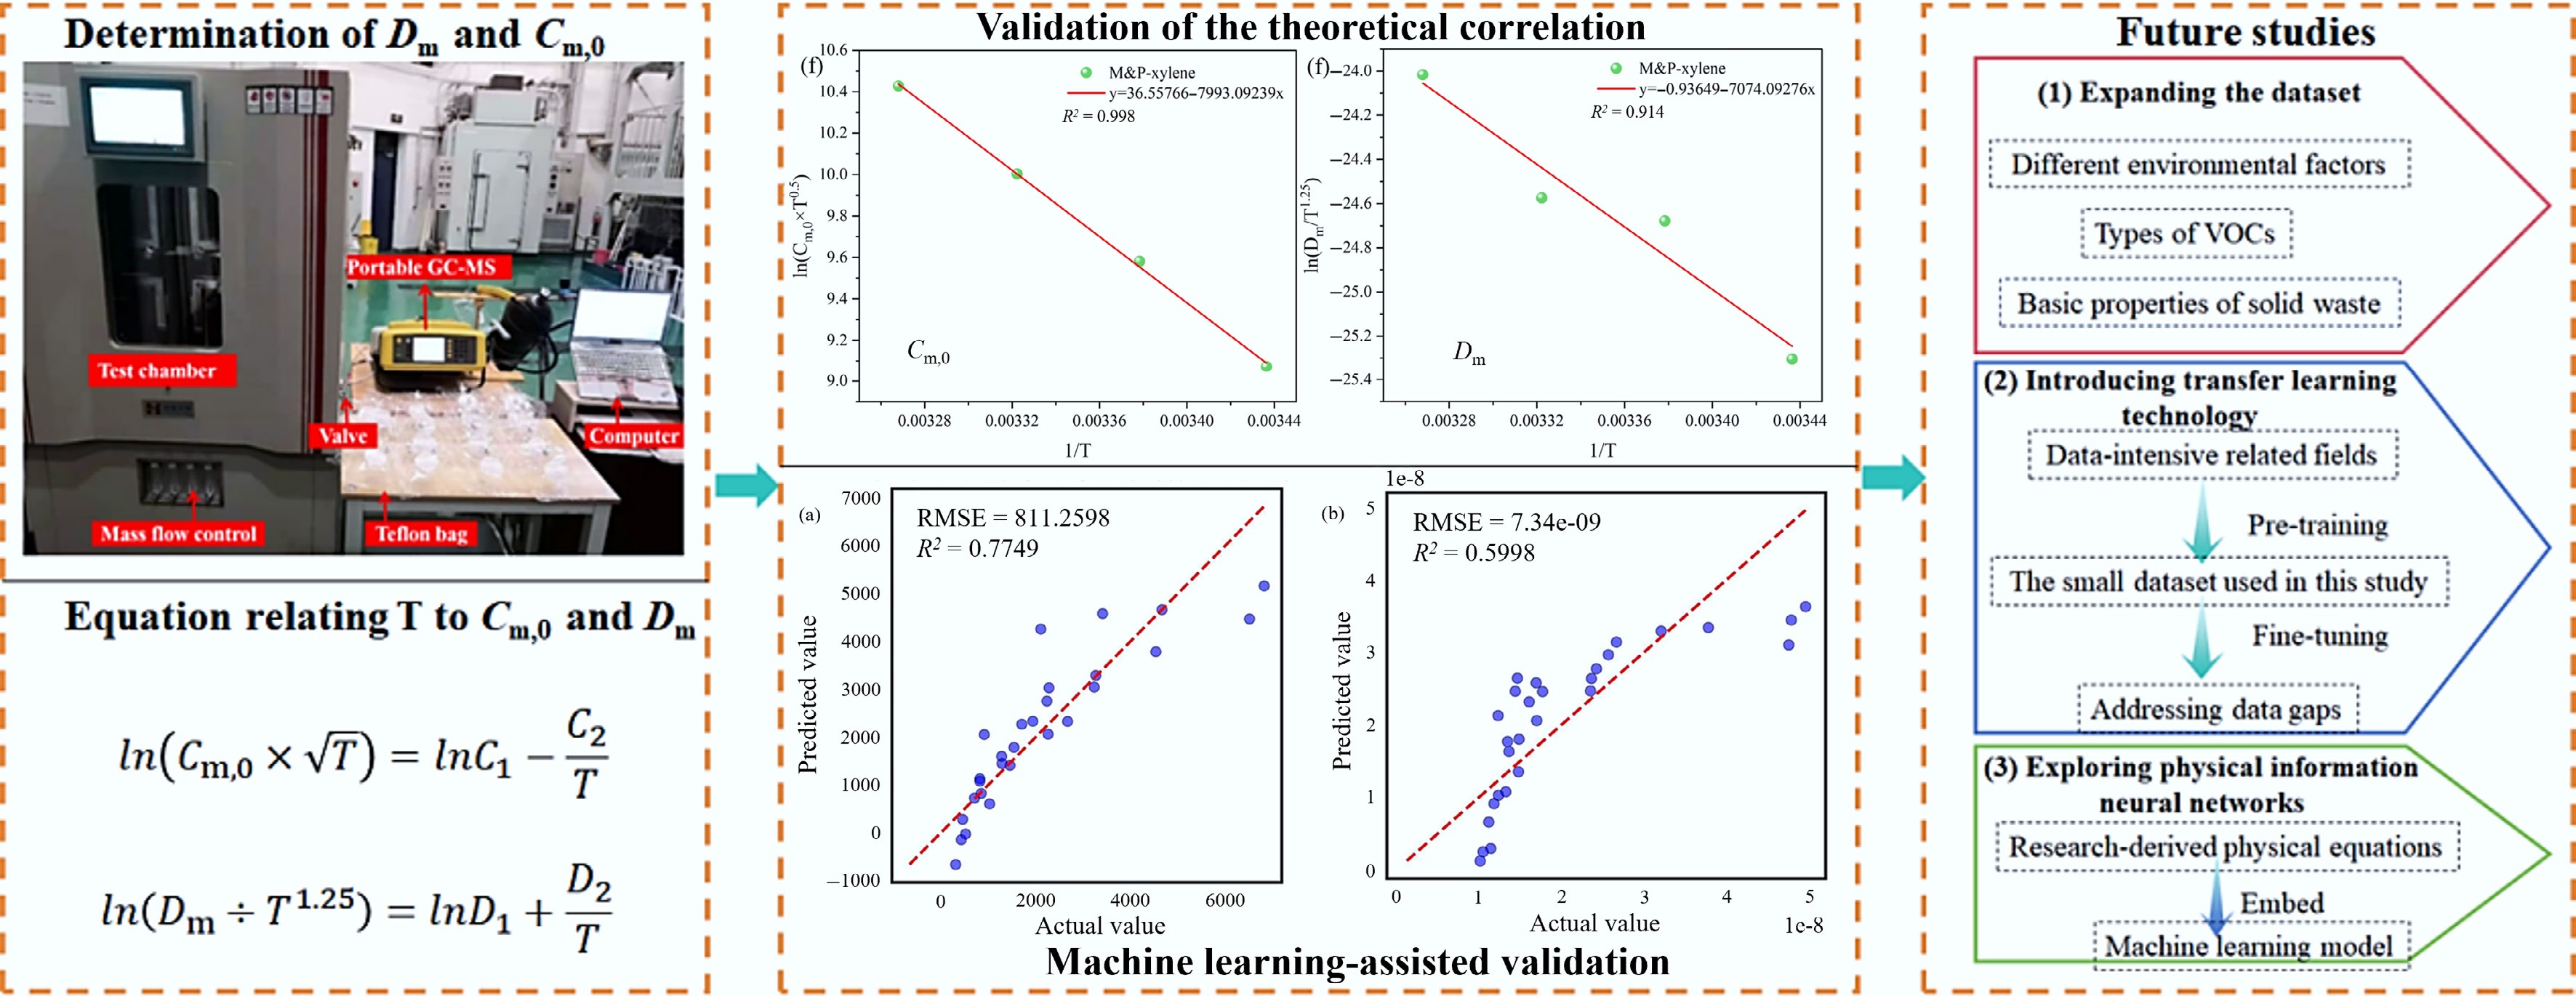
Therefore, the research objectives of the present study are (1) to measure the release rates and total release of seven major VOCs from oil-based dry paint sludge (OBDPS) at different temperatures and to obtain the corresponding release characterization parameters (Cm,0 and Dm) based on the release rates; (2) to establish the theoretical correlations between Cm,0 and T, as well as Dm and T, and to validate them based on the coefficients of determination; and (3) to assist in predicting baseline characteristics of Cm,0 and Dm through machine learning models, and to validate the feasibility of applying machine learning in this field. This study facilitates the prediction of the release of VOCs from paint sludge at different temperatures, guiding the management of solid waste containing VOCs.
-
Paint sludge is a very complex material containing, in addition to pigments, curing agents, and flotation agents, water, a variety of organic solvents, and untreated paint resins[15]. Its compositional content depends on the properties of the paint used, the spraying method, the spray capture, and the treatment process in the recycled water system. After water evaporation, the paint residue solidifies and forms a film on the surface. It is highly viscous and difficult to handle, and is a typical solid waste containing VOCs[16].
In this paper, the selected automobile paint coating is oil-based dry paint sludge (OBDPS), which comes from the spraying workshop of an automobile manufacturing plant in Changchun, Jilin, China. Physical and chemical performance test methods are listed in Appendix S1. Through the drying difference method, the water content of OBDPS was found to be 0.45%, which is much lower than that of wet paint sludge. Therefore, its effect can be neglected. By comparing the scanning electron microscope images of the four different paint sludges (Supplementary Fig. S1), it can be observed that the water-based wet paint sludge (WBWPS) and the oil-based wet paint sludge (OBWPS) are spherical particles with regular shapes and varying sizes (overall less than 200.0 μm), while the oil-based paint sludge is a clumped particle with irregular shapes. Both types of water-wet paint sludge clearly formed agglomerates of particles between pores, while the pore structure of oil-based wet paint sludge was relatively loose. The shapes of the two types of dry paint sludge are similar, with irregularly shaped lumpy particles of different particle sizes, but the particle size of the OBDPS is larger than that of the WBDPS. Moreover, compared with OBWPS, both dry paint sludges have a looser pore structure than the wet paint sludge.
As shown in Fig. 1, the primary constituents of OBDPS encompass dolomite (CaMg[CO3]2), calcite (CaCO3), quartz (SiO2), talc (Mg3[Si4O10][OH]2, mica (KAl2[AlSi3O10][OH]2 and traces of chlorite (Y3[Z4O10][OH]2-Y3[OH]6). The OBDPS mainly contained: methyl (-CH3) at 2,938.98 cm−1, methylene (-CH2-) at 2,869.56 cm−1, carboxyl and amide I peaks C=O stretching vibration absorption peaks at 1,801.19 cm−1. The absorption peaks of ketones, aldehydes, acids, and esters in the aliphatic and aromatic groups are identified at 1,693.19 cm−1 due to their characteristic C=O stretching vibration. And C=C–OH stretching vibration absorption peaks in the aromatic group at 1,428.99 cm−1.
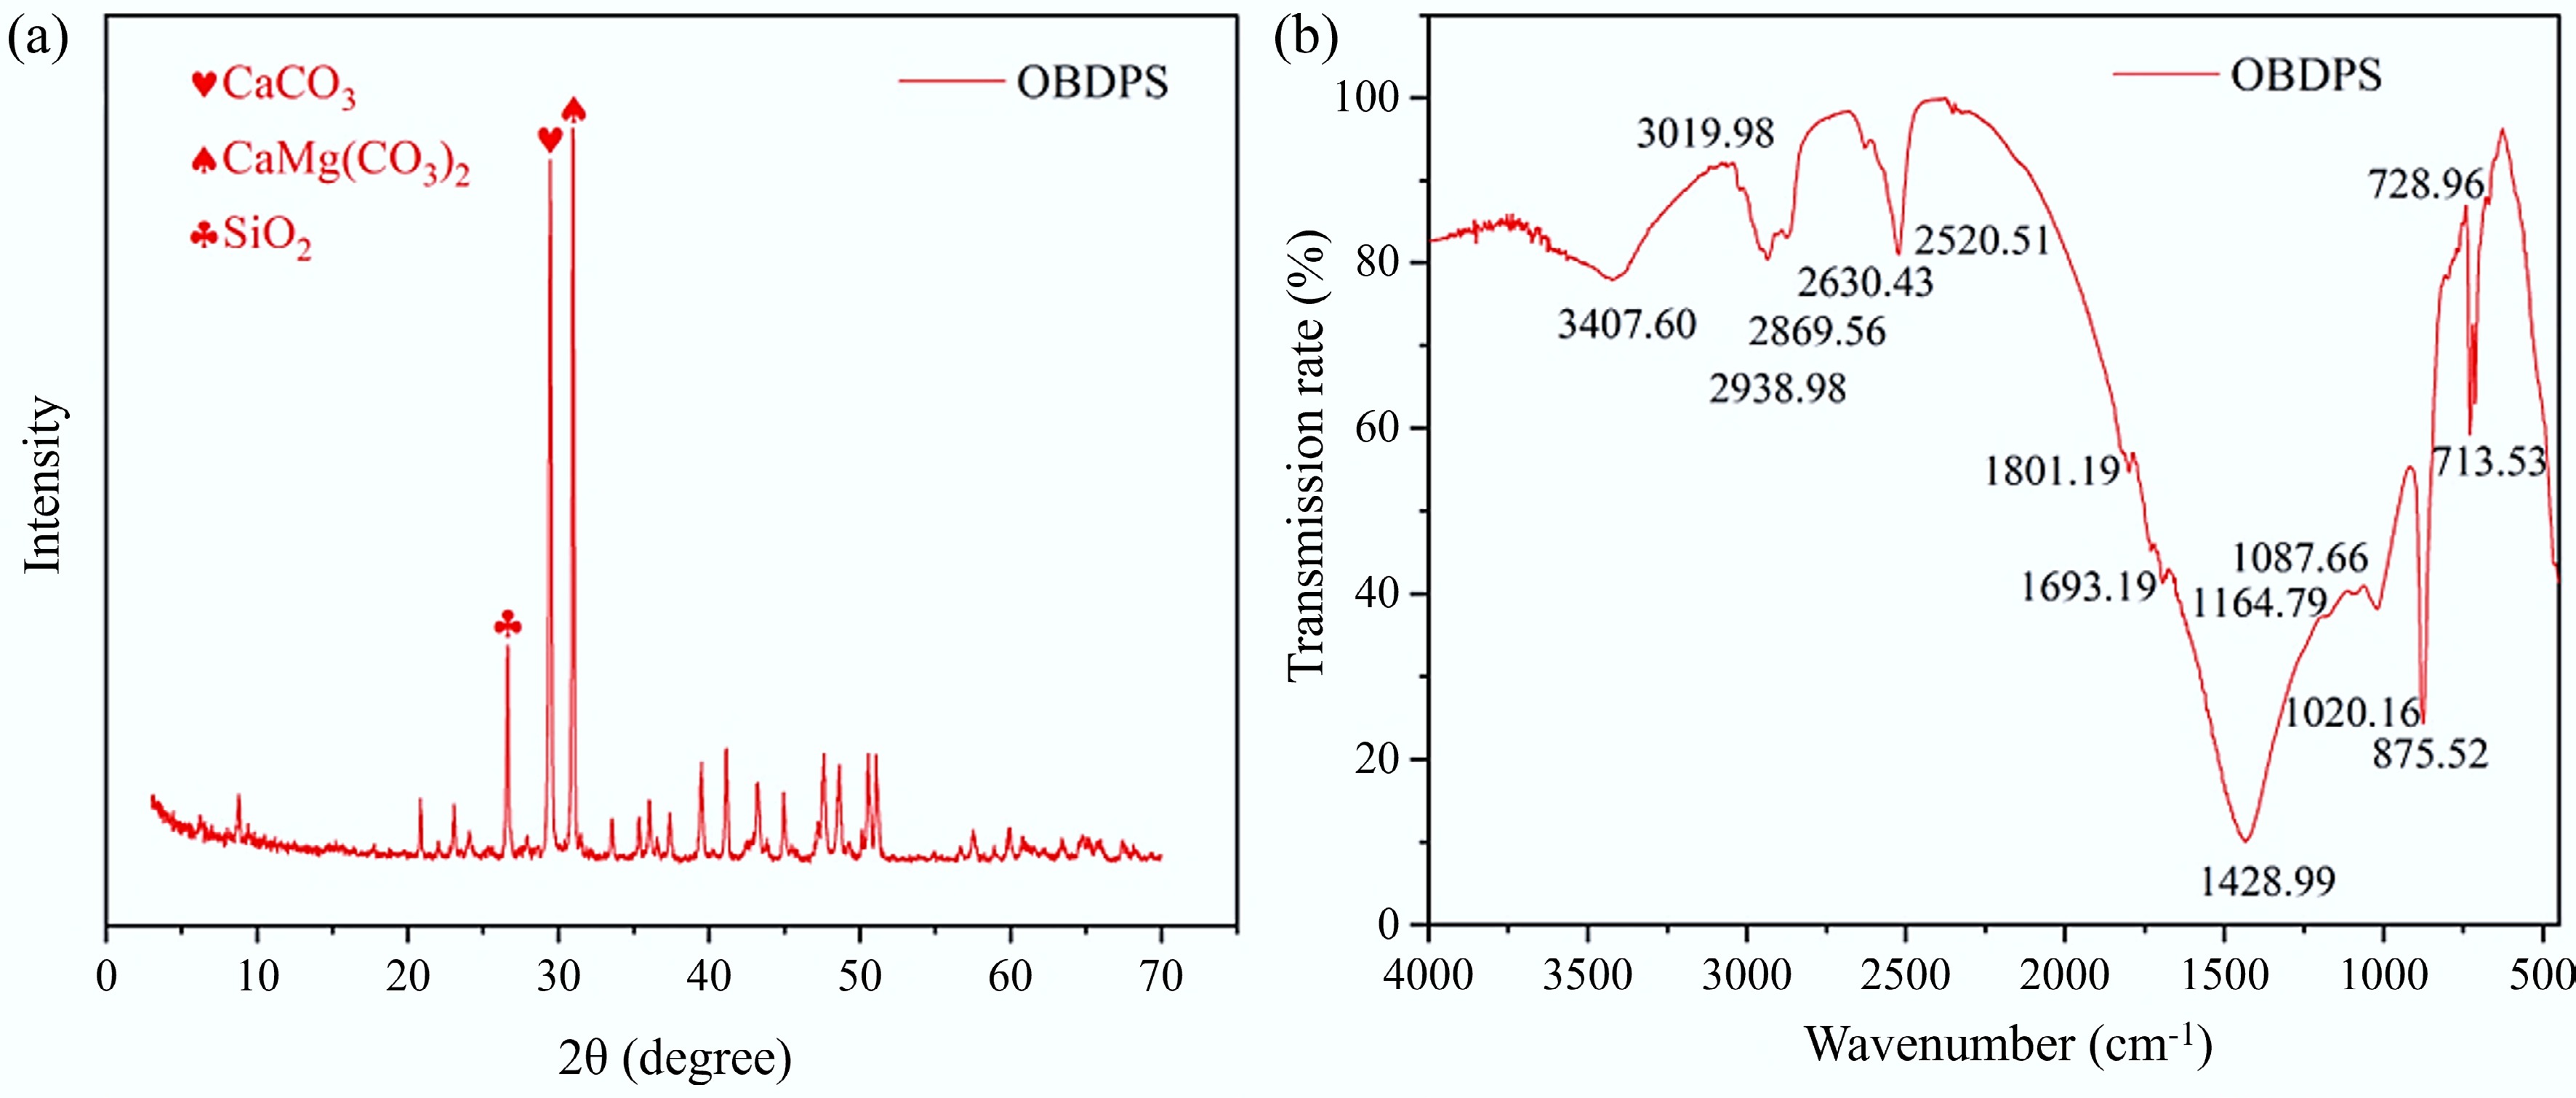
Figure 1.
(a) X-ray diffraction of OBDPS; (b) Fourier transform infrared spectroscopy of OBDPS.
Theoretical correlation development
-
The probability density distribution of the molecular kinetic energy of an ideal gas system at equilibrium as a function of temperature can be expressed in terms of Maxwell's law of distribution[17]:
$ g({\varepsilon }_{k})=\dfrac{2}{\sqrt{\pi }}{({{k}_{B}}T)}^{-\frac{3}{2}}{e}^{-\frac{{\varepsilon }_{k}}{{k}_{B}T}{\varepsilon _{k}^{\frac{1}{2}}}}d{\varepsilon }_{k} $ (1) where, εk is defined as the kinetic energy of a single ideal gas molecule, J/mol; kB is defined as the Boltzmann constant, 1.38 × 10⁻²³ J/K; and T is defined as the temperature, K.
It is important to acknowledge that, despite the variation in the concentration of certain VOC molecules between the interior and the surface of a material, statistical physics theory indicates that the distribution remains consistent with the statistical mean, so the kinetic energy distribution of the VOC molecules remains unaltered[14]. Therefore, the probability is that the kinetic energy of the molecules on all adsorption sites on the surface of the solid waste matrix is greater than the potential energy of adsorption, corresponding to the proportion of solid waste VOC molecules that are capable of being released at a specific temperature. The blue shaded area shown in Fig. 2 is the releasable proportion of solid waste VOCs. The horizontal coordinate of the figure is the molecular kinetic energy, and the vertical coordinate is the probability density of the kinetic energy distribution. ε0 is used to denote the potential energy of adsorption between the VOC molecules and the solid waste matrix, defined as the change in free energy per mole of VOC molecules when the VOCs are physically adsorbed at the interface of the solid matrix.
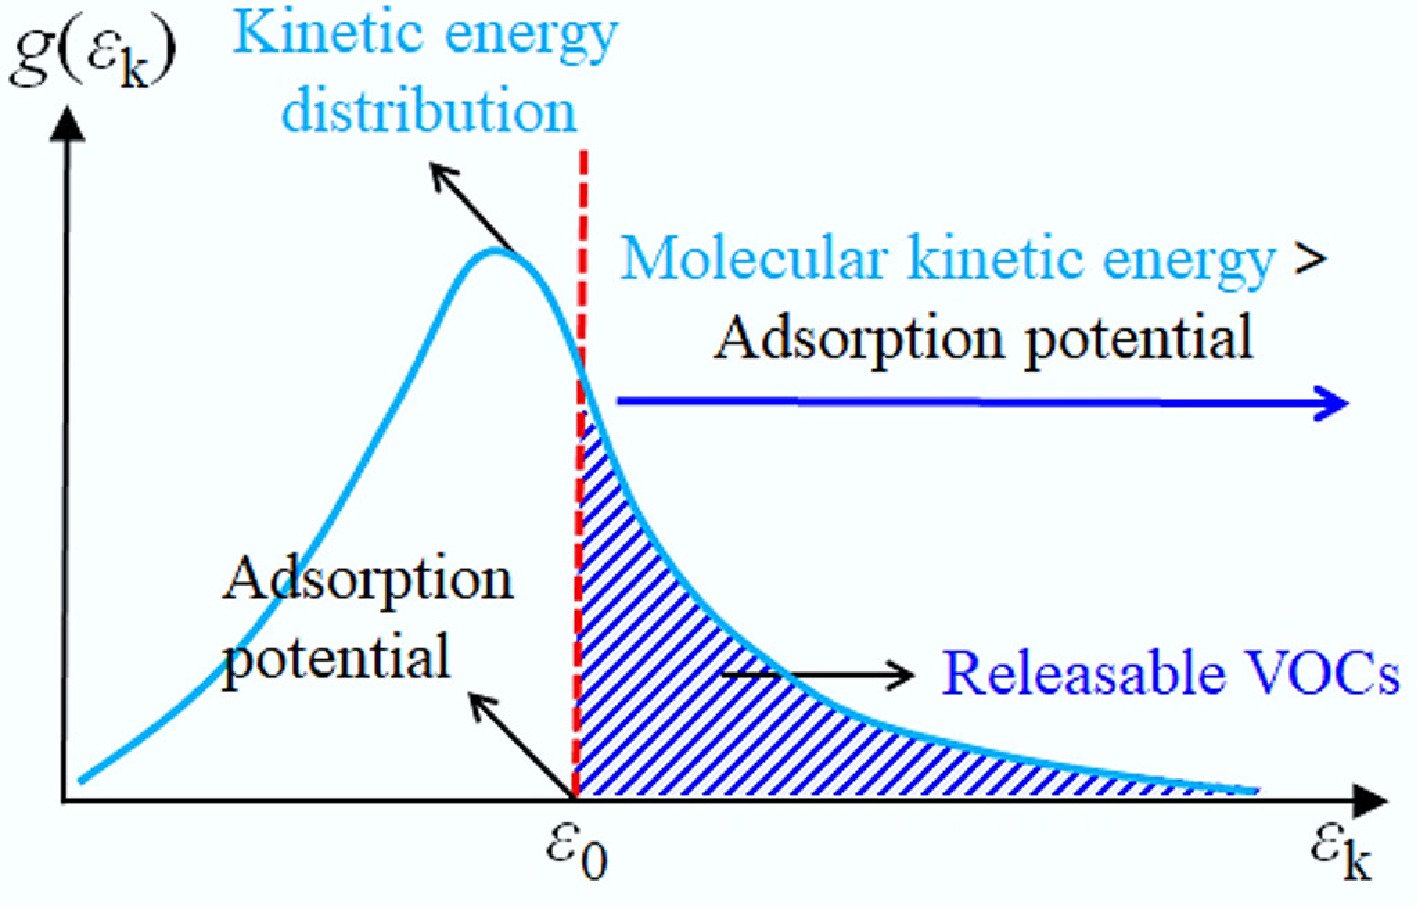
Figure 2.
The schematic illustrates the distribution of kinetic energy and the ratio of VOCs which can be emitted.
The blue shaded area in the figure equals the releasable proportion of VOCs, which decreases with increasing adsorption potential energy. The fraction η that can be released can be expressed as:
$ \begin{split}\eta =\;&1-\int\nolimits_{0}^{{\varepsilon }_{0}}g\left({\varepsilon }_{k}\right)d{\varepsilon }_{k}=1-\int\nolimits_{0}^{{\varepsilon }_{0}}\dfrac{2}{\sqrt{\pi }}{({{k}_{B}}T)}^{-\frac{3}{2}}{e}^{-\frac{{\varepsilon }_{k}}{{k}_{B}T}{\varepsilon _{k}^{\frac{1}{2}}}}d{\varepsilon }_{k}\\=\;&2+{\dfrac{2}{\sqrt{\pi }}\left(\dfrac{{\varepsilon }_{0}}{{k}_{B}T}\right)}^{\frac{1}{2}}{e}^{-\frac{{\varepsilon }_{0}}{{k}_{B}T}}-2{\varPhi }\left[{\left(\dfrac{2{\varepsilon }_{0}}{{k}_{B}T}\right)}^{\frac{1}{2}}\right]\end{split} $ (2) In Eq. (2), the symbol Φ denotes the standard normal cumulative distribution function. In addition, as clarified above, the adsorption potential ε0 energy is basically constant at different temperatures; in this way, it can be regarded as a constant.
Generally, at room temperature, if
$ {\left(\dfrac{2{\varepsilon }_{0}}{{k}_{B}T}\right)}^{\frac{1}{2}}> 3 $ $ \mathit{\Phi }\left[{\left(\dfrac{2{\varepsilon }_{0}}{{k}_{B}T}\right)}^{\frac{1}{2}}\right]\approx 1 $ $ \eta =\dfrac{{C}_{\mathrm{m},0}}{{C}_{\text{Total}}}=\dfrac{2}{\sqrt{\pi }}{\left(\dfrac{{\varepsilon }_{0}}{{k}_{B}T}\right)}^{1/2}{e}^{-\frac{{\varepsilon }_{0}}{{k}_{B}T}} $ (3) The deformation and simplification of Eq. (3) leads to:
$ {C}_{\mathrm{m},0}=\dfrac{{C}_{1}}{\sqrt{T}}exp\left(-\dfrac{{C}_{2}}{T}\right) $ (4) Equation (4), in which C1 and C2 are constants, is the theoretical quantitative correlation between the initial releasable concentration Cm,0 and the temperature T.
Further processing of Eq. (4) gives:
$ \mathit{{ln}}\left(C_{\mathrm{m},0}\times\sqrt{T}\right)=lnC_1-\dfrac{C_2}{T} $ (5) The relationship between temperature T, the releasable proportion η, and initial releasable concentration Cm,0 of VOCs was quantitatively constructed using Eqs (3) and (5), where the constants C1 and C2 can be obtained experimentally, and can help to predict the η and Cm,0 at the corresponding temperature conditions.
The transformation relationship between the diffusion coefficient Dm for single-phase media and the effective diffusion coefficient De for porous media was derived from the Eq. (S11) in Appendix S2 as[19,20]:
$ {D}_{\mathrm{m}}=\dfrac{{D}_{\mathrm{e}}}{{K}_{\mathrm{m}}}=\dfrac{\theta {D}_{\mathrm{g}}}{\tau {K}_{\mathrm{m}}} $ (6) where, τ is used to denote the curvature of VOCs inside the material.
The gaseous diffusion of VOCs inside the solid waste is dominated by Fick diffusion, which is then given by the Fuller, Schettler and Giddings equation[21]:
$ {D}_{\mathrm{g}}=\dfrac{{10}^{-3}{T}^{1.75}{(1/{M}_{\mathrm{A}}+1/{M}_{\mathrm{B}})}^{1/2}}{{P}_{\mathrm{t}}{\left({V_{\mathrm{A}}^{1/3}}+{V_{\mathrm{B}}^{1/3}}\right)}^{2}} $ (7) In Eq. (7), Pt is the system pressure, Pa; the molecular weights of components A and B are denoted by MA and MB, respectively; the molecular diffusion volumes of components A and B are denoted by VA and VB, respectively; and the meanings of the remaining parameters are the same as those defined in the Appendix S3.
After bringing the distribution coefficient expression Eq. (S20) in Appendix S2 into Eq. (6), associative (7) can be obtained:
$ {D}_{\mathrm{m}}=\dfrac{{10}^{-3}b{v}_{\text{ad}}{(1/{M}_{\mathrm{A}}+1/{M}_{\mathrm{B}})}^{1/2}{(2PMR)}^{1/2}}{A{\mathit{\Gamma }}_{\mathrm{m}}{N}_{A}{P}_{t}{\left({V_{\mathrm{A}}^{1/3}}+{V_{\mathrm{B}}^{1/3}}\right)}^{2}}{T}^{1.25}exp (-{E}_{\mathrm{d}}/RT) $ (8) For the same solid waste, all parameters of Eq. (8), except Dm, are independent of temperature. Therefore, Eq. (8) describes the theoretical relationship between Dm and T well in the case where Fick diffusion dominates. Further simplifying it yields:
$ {D}_{\mathrm{m}}={D}_{1}{T}^{1.25}exp ({D}_{2}/T) $ (9) Both D1 and D2 in Eq. (9) are constants.
A further treatment of Eq. (9) gives:
$ {ln } \left({D}_{\mathrm{m}}\div {T}^{1.25}\right)=ln{D}_{1}+\dfrac{{D}_{2}}{T} $ (10) According to Eqs (3), (5), and (10), the temperature-dependent profiles of η, Cm,0, and Dm can be predicted once the system-specific constants (C1, C2, D1, D2) are calibrated. It is important to recognize that this derivation rests on the premise of physisorption-dominated interactions within a homogeneous matrix. Specifically, the adsorption potential ε0 is treated as temperature-invariant, and the asymptotic simplification from Eq. (2) to Eq. (3) is valid, provided the thermal energy kBT remains substantially lower than the desorption barrier (i.e., [2ε0/kBT]0.5 > 3). Within the moderate temperature window explored in this work, these conditions are well satisfied. While extensions to higher thermal regimes or heterogeneous pore structures would require revisiting these assumptions, the current framework provides a robust, first-principles foundation for understanding VOC mobility in organic-rich solid wastes.
Analysis of the concentration-trace method for determining key model parameters reveals that difficulties in establishing convergence criteria for rate expressions or inaccuracies in predictions are often due to an approximate linear dependence on sensitivity coefficients. Furthermore, when sensitivity coefficients are linearly correlated, it is impossible to distinguish the effects of different parameters on the model response. Therefore, sensitivity coefficients with a high degree of linear independence are required. Relative sensitivity coefficients (JD and JC) can be obtained by dividing the rate of change in cumulative release flux M(ti) by the rate of change in the key parameter. These coefficients characterize the sensitivity of cumulative VOC release to changes in each parameter, and their expressions are as follows:
$ {J}_{D}=\dfrac{\partial M({t}_{i})}{\partial D}\approx \dfrac{M(C,(1+\alpha )D,{t}_{i})-M(C,(1-\alpha )D,{t}_{i})}{2\sigma M({t}_{i})} $ (11) $ {J}_{C}=\dfrac{\partial M({t}_{i})}{\partial C}\approx \dfrac{M(D,(1+\alpha )C,{t}_{i})-M(D,(1-\alpha )C,{t}_{i})}{2\sigma M({t}_{i})} $ (12) In the equations: σ = 0.1 represents the rate of change of the three key model parameters, and M(ti) denotes the cumulative VOC release flux at time ti.
Machine learning models and evaluation
-
Given the cost and complexity of VOC emission experiments, this study obtained a total of 28 valid data points. To avoid model overfitting, we adopted a simple model architecture and rigorous cross-validation. This included ridge regression, lasso regression, SVR-rbf, SVR-linear, random forest, and gradient boosting regressor. Among these, ridge regression, lasso regression, and SVR-linear are linear models, while SVR-rbf, random forest, and gradient boosting regressor are nonlinear models. Additionally, model performance was evaluated using the coefficient of determination (R2), mean absolute error (MAE), root mean square error (RMSE), and mean absolute percentage error (MAPE). Detailed descriptions of the machine learning models and evaluation metrics are provided in the Appendix S3.
Experimental section
-
The VOCs in this experiment include alcohols, lipids, and benzenes. In order to minimize the influence of the evaporation of internal matrix water inside the solid waste on the diffusion and release of VOCs, the OBDPS with lower water content and more pollutant types was chosen as the test object of the environmental test chamber emission experiments.
We validate the derived theoretical correlations by using temperature deviations of ± 0.5 °C and fluctuation ranges of ≤ ± 0.3 °C at four distinct temperatures (18, 23, 28, and 33 °C). The emission rate footprint (ER-history) method can be used to solve for two parameters (Cm,0, Dm) of VOC release from a single-phase medium in a semi-infinite diffusion scenario[14]. The principle of the method is briefly described in Appendix S4. The experimental setup consisted of a VHX-60-4 VOC release chamber, a US HAPSITE portable gas chromatograph/mass spectrometer, a Teflon collection gas bag, and a computer workstation (Fig. 3). The specific experimental setup conditions are consistent with our previous experimental conditions[9].
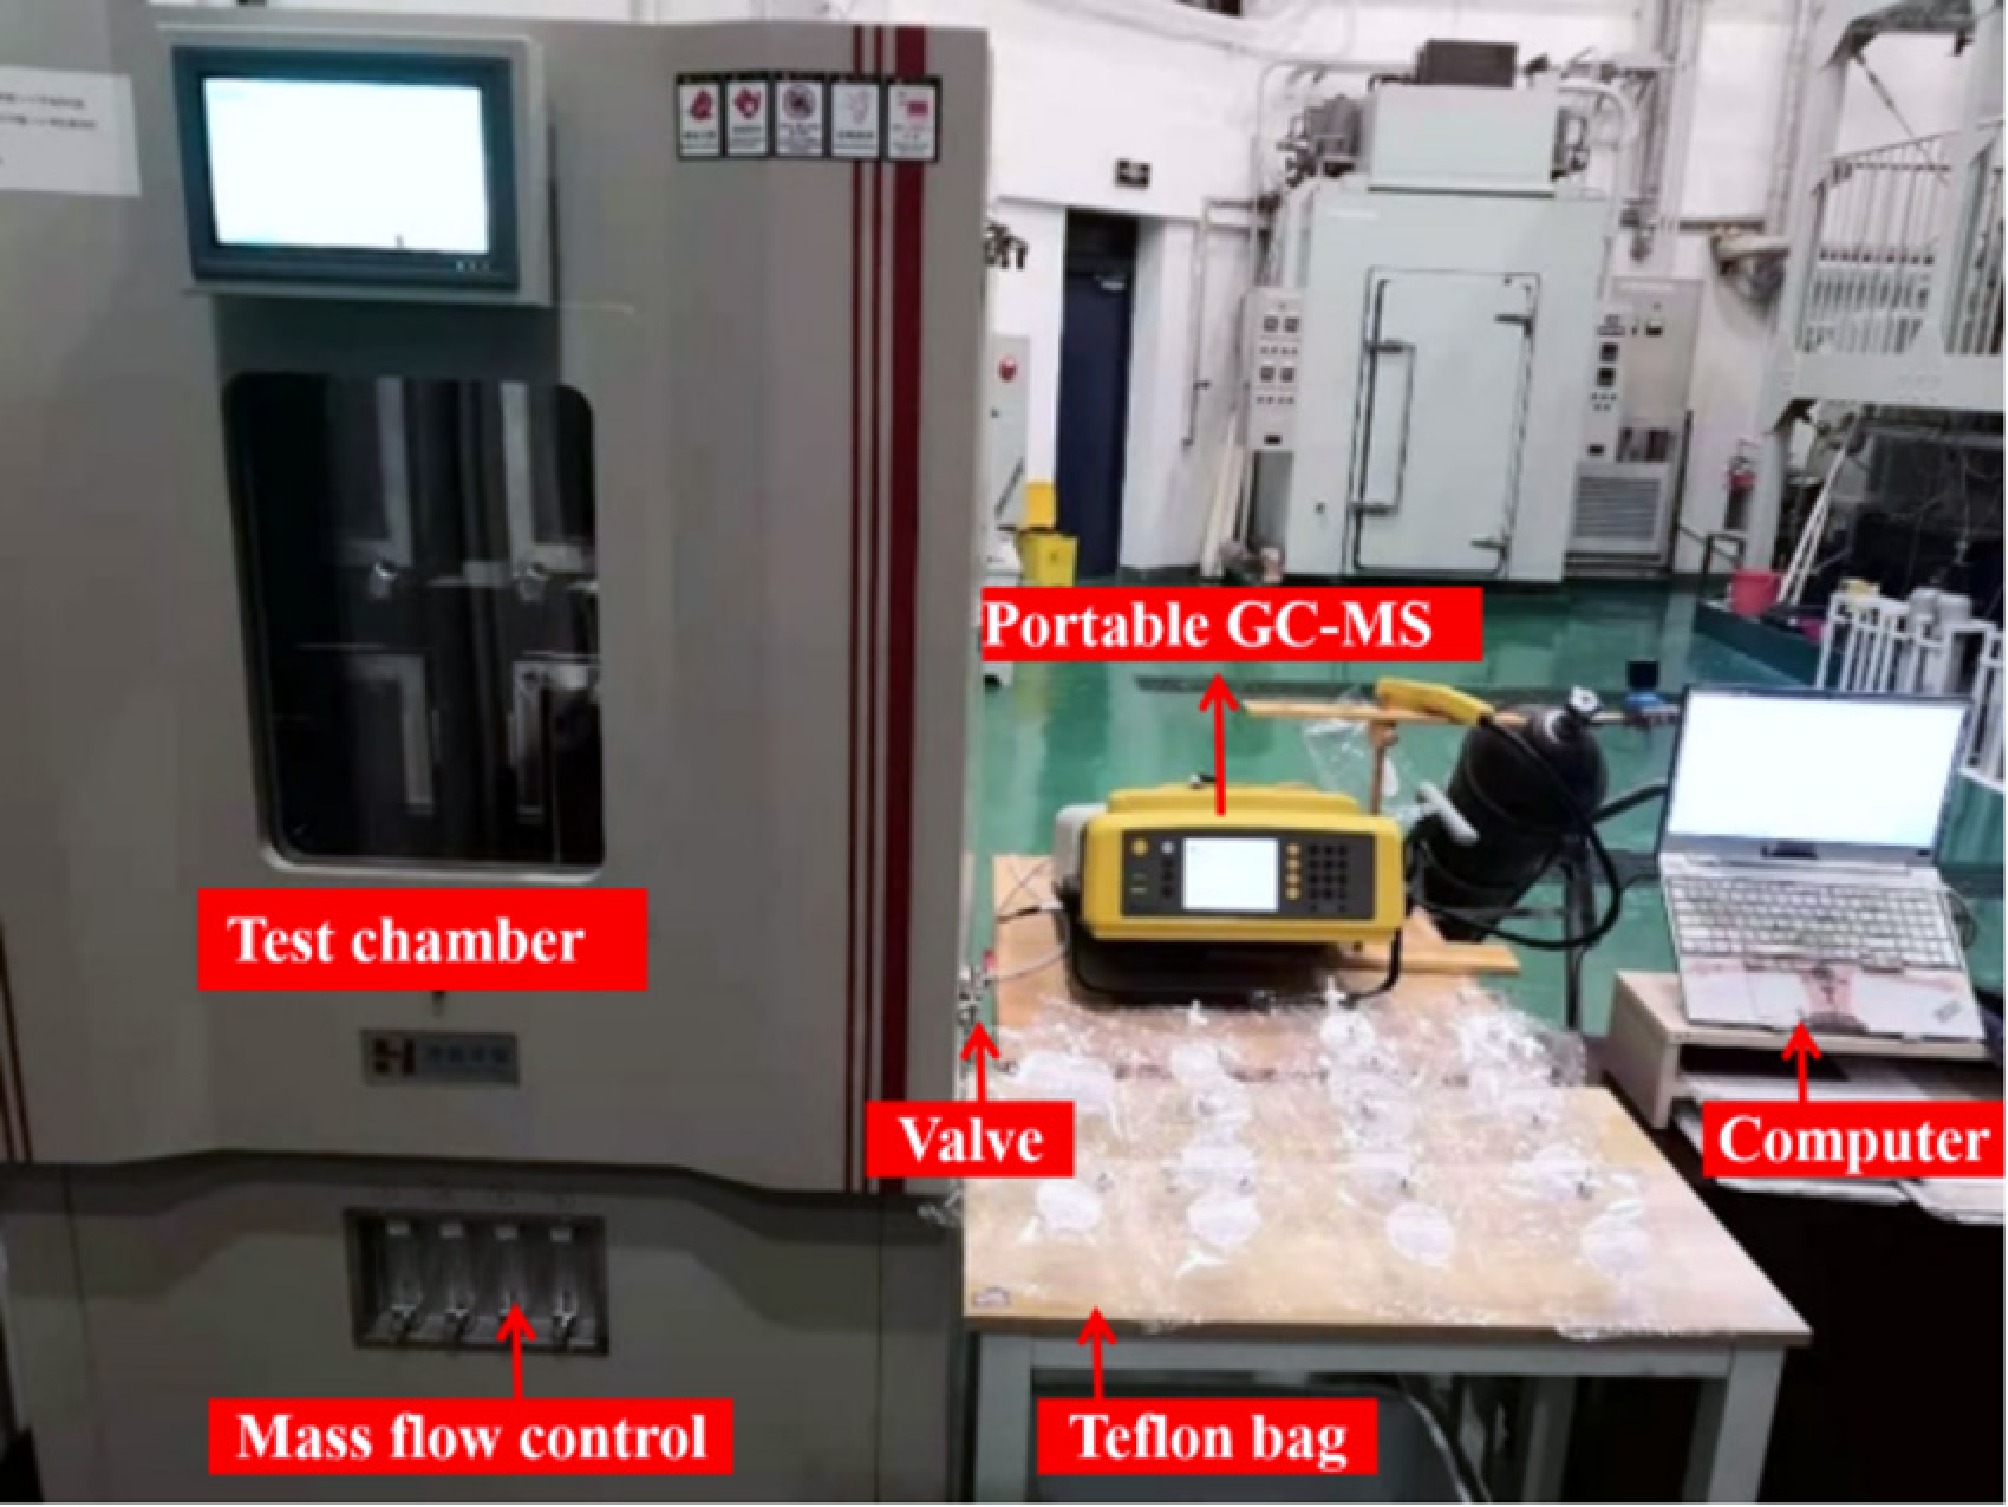
Figure 3.
Physical picture of the experimental devices.
In contrast, the relative humidity and ventilation of the environmental test chamber were kept at 50% RH and 2 times/h. To minimize experimental errors, four emanation tests were conducted for the OBDPS at each of the four temperature gradients. Meanwhile, the VOCs in this experiment included 1-butanol, butyl acetate, 1,2,4-trimethyltoluene, 1-ethyl-4-methylbenzene, 1,2,3-trimethyltoluene, M&P-xylene, and O-xylene, which have been identified as the most predominant constituents in OBDPS.
-
Under the conditions of the four temperature gradients, the emission rates and cumulative emissions of seven VOCs were measured over time, respectively. The results are shown in the Fig. 4 and Supplementary Fig. S2, respectively. As the temperature increases, the release rates of all VOCs increase significantly. However, after the release time reaches 5 h, the release rate decreases significantly, and even converges. After the release time exceeds 15 h, all VOCs are basically no longer released. This is consistent with the cumulative release results (Supplementary Fig. S2).
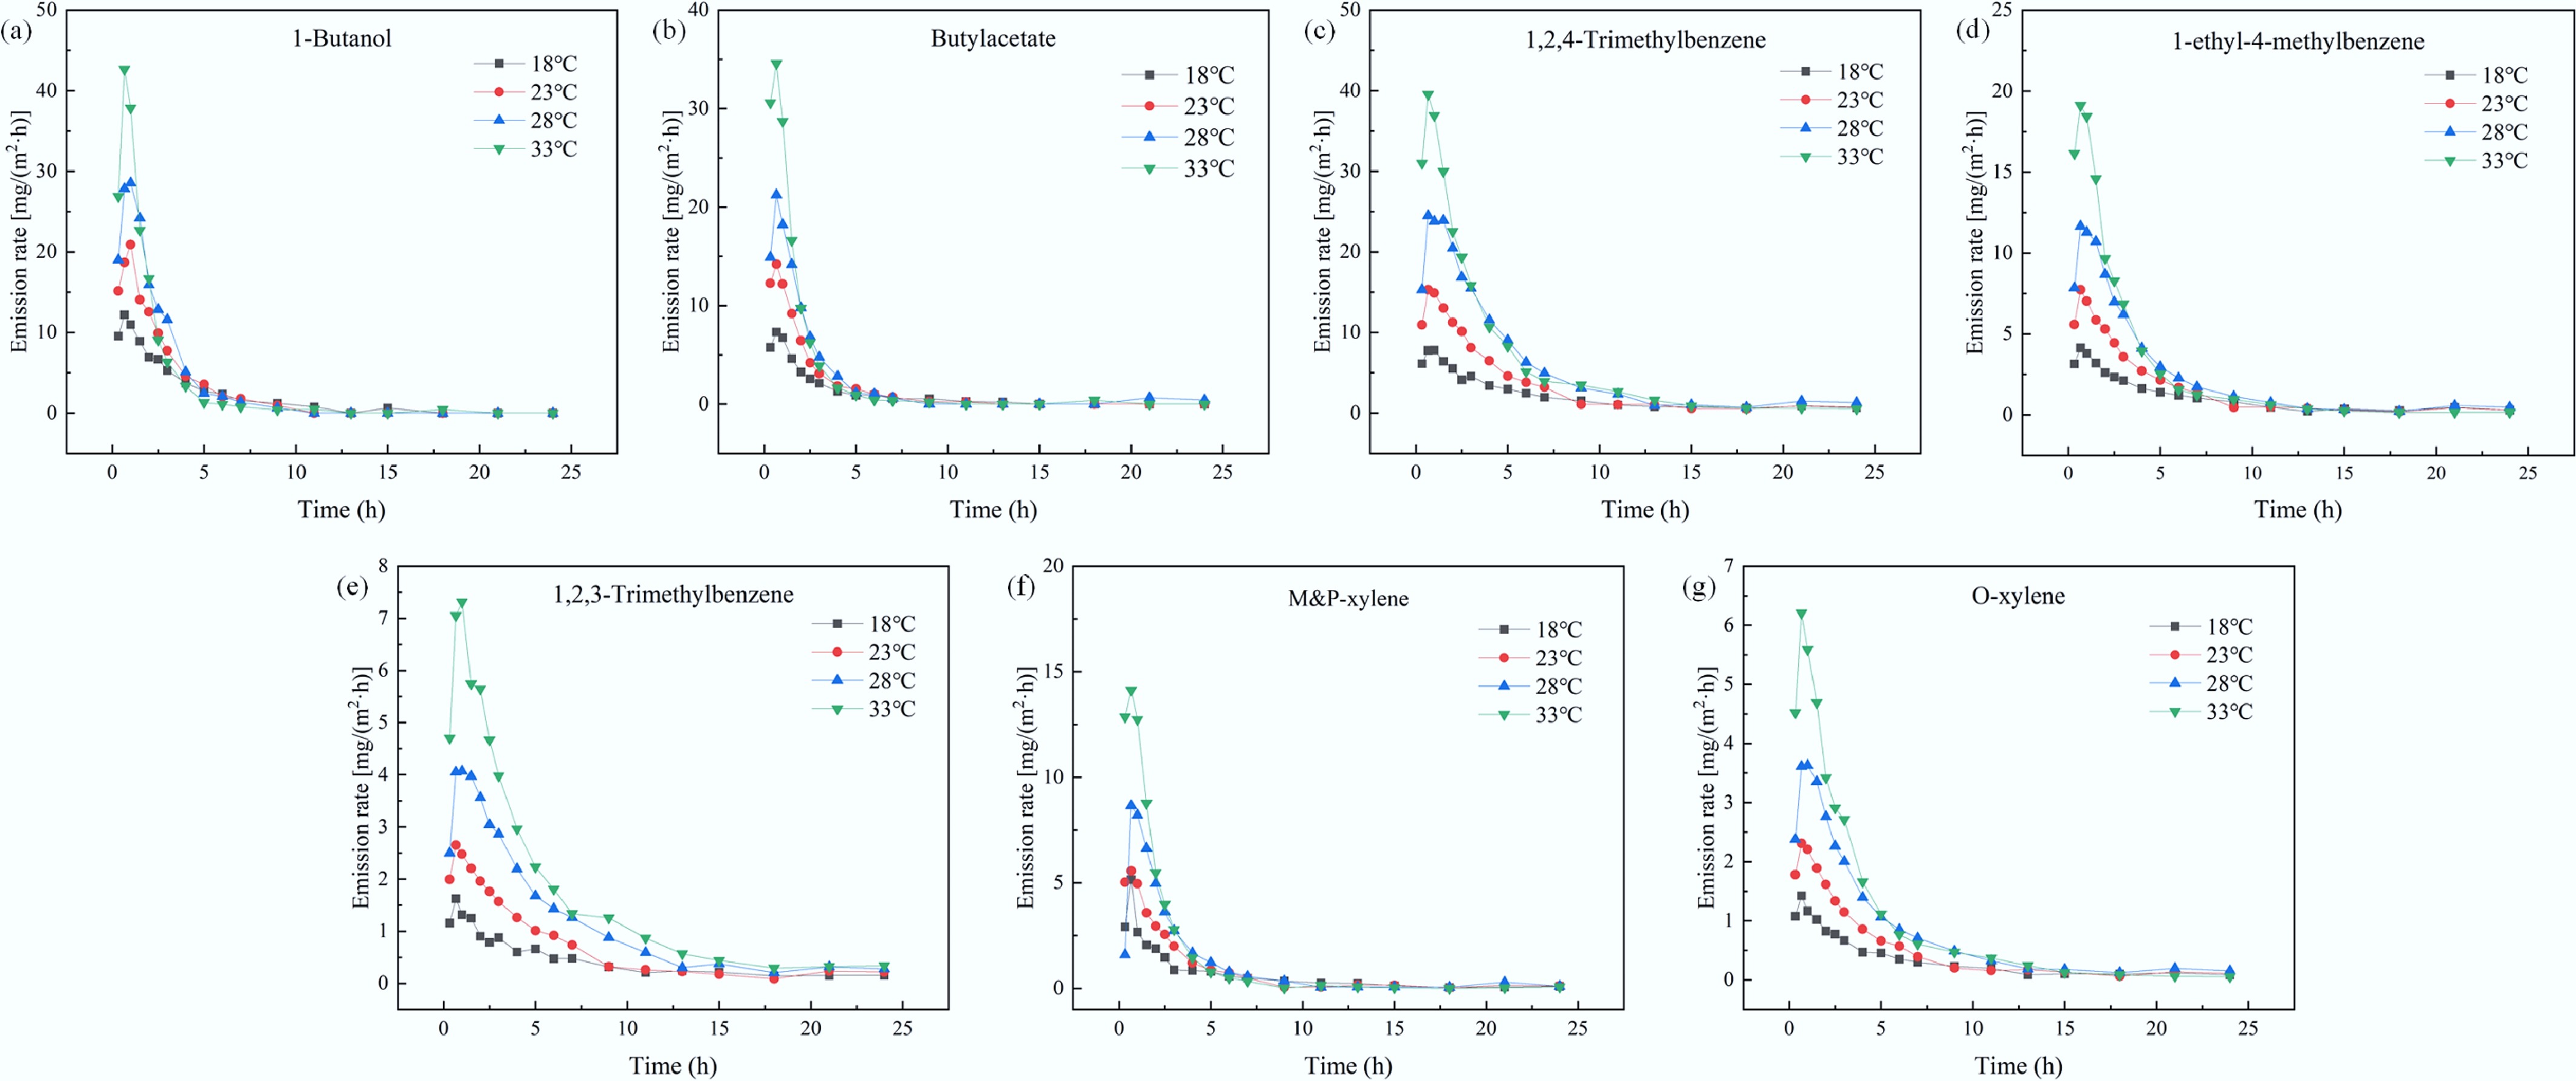
Figure 4.
Emission rate of VOCs from OBDPS at different temperatures.
As shown in Supplementary Fig. S2, it can be clearly observed that the total release of all VOCs increases with temperature. In particular, an increase in temperature to 33 °C leads to a 77.84%–287.35% increase in total releases compared with the 18 °C condition. A more detailed analysis is explained in the Supplementary Fig. S2. Based on these phenomena, it is tentatively posited that an elevated temperature is associated with an increased cumulative release of solid waste VOCs when other variables remain constant.
Equation (S5) in Appendix S2 was used in conjunction with the data in Supplementary Fig. S2 to calculate the linear fitting results for each of the seven major pollutants at each of the four temperatures. The values of t > 0.2 L2/Dm were taken during the fitting process. It should be noted that the fitting results are only valid within a certain time. This is mainly because after a certain period of time, the VOCs have basically been completely released. Among them, the specific fitting results for the standard condition are shown in Fig. 5. The fitting effects for the other three temperatures are displayed in Supplementary Figs S3−S5.
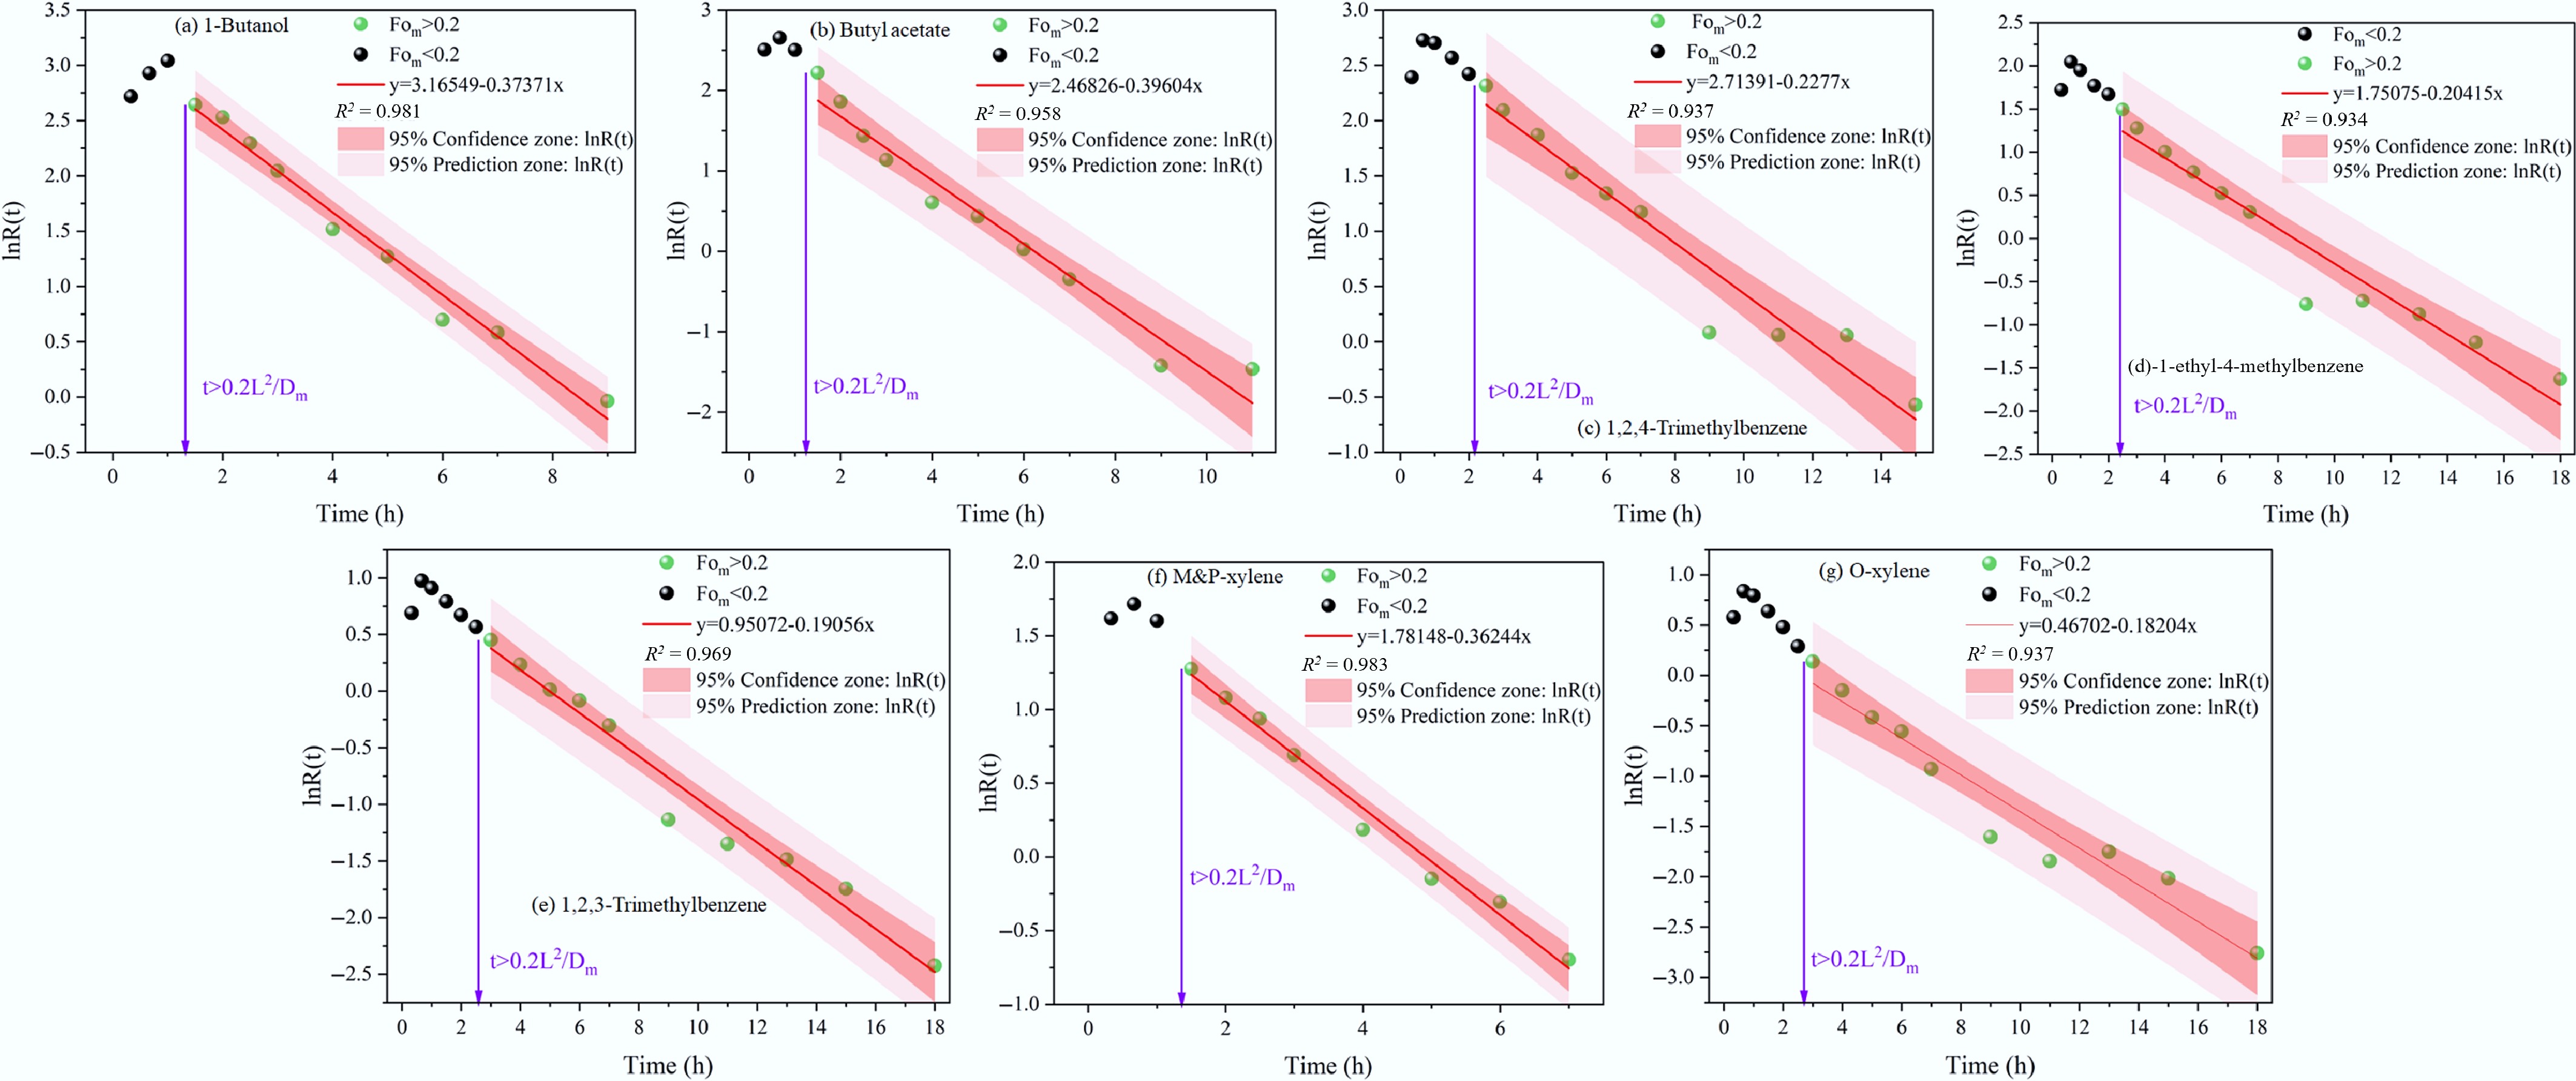
Figure 5.
Linear fitting results for seven major pollutants at 23 °C.
Then, based on the Eqs (S3) and (S4) for SL and INT in Appendix S2, the release characterization parameters (Cm,0, Dm) of the seven VOCs were determined under standard working conditions. The release characterization parameters at the other three temperatures were obtained in the same way. Thus, the results of the initial releasable concentrations, diffusion coefficients, and determination coefficients (R2) determined at 18–33 °C are summarized in Table 1. All R2 values were greater than 0.93, indicating that the present study has a high fitting effect.
Table 1. Effect of temperature on Cm,0, Dm and R2
Temperature Types of VOCs Cm,0 (μg m−3) Dm (m2 s−1) R2 18 °C 1-Butanol 2.230 × 10³ 1.608 × 10⁻⁸ 0.967 Butylacetate 0.813 × 10³ 1.464 × 10⁻⁸ 0.938 1,2,4-Trimethybenzene 2.101 × 10³ 1.118 × 10⁻⁸ 0.991 1-Ethyl-4-methylbenzene 1.017 × 10³ 1.141 × 10⁻⁸ 0.980 1,2,3-Trimethylbenzene 0.419 × 10³ 1.049 × 10⁻⁸ 0.925 M&P-xylene 0.510 × 10³ 1.231 × 10⁻⁸ 0.950 O-xylene 0.302 × 10³ 1.013 × 10⁻⁸ 0.934 23 °C 1-Butanol 3.260 × 10³ 2.423 × 10⁻⁸ 0.981 Butylacetate 1.532 × 10³ 2.568 × 10⁻⁸ 0.958 1,2,4-Trimethybenzene 3.406 × 10³ 1.477 × 10⁻⁸ 0.937 1-Ethyl-4-methylbenzene 1.450 × 10³ 1.324 × 10⁻⁸ 0.934 1,2,3-Trimethylbenzene 0.698 × 10³ 1.236 × 10⁻⁸ 0.969 M&P-xylene 0.842 × 10³ 2.350 × 10⁻⁸ 0.983 O-xylene 0.450 × 10³ 1.180 × 10⁻⁸ 0.937 28 °C 1-Butanol 4.531 × 10³ 3.207 × 10⁻⁸ 0.977 Butylacetate 2.667 × 10³ 3.778 × 10⁻⁸ 0.979 1,2,4-Trimethybenzene 6.507 × 10³ 1.699 × 10⁻⁸ 0.988 1-Ethyl-4-methylbenzene 2.253 × 10³ 1.485 × 10⁻⁸ 0.975 1,2,3-Trimethylbenzene 1.278 × 10³ 1.346 × 10⁻⁸ 0.986 M&P-xylene 1.273 × 10³ 2.665 × 10⁻⁸ 0.969 O-xylene 0.814 × 10³ 1.362 × 10⁻⁸ 0.979 33 °C 1-Butanol 4.660 × 10³ 4.782 × 10⁻⁸ 0.977 Butylacetate 3.228 × 10³ 4.957 × 10⁻⁸ 0.976 1,2,4-Trimethybenzene 6.816 × 10³ 2.361 × 10⁻⁸ 0.994 1-Ethyl-4-methylbenzene 2.274 × 10³ 1.692 × 10⁻⁸ 0.958 1,2,3-Trimethylbenzene 1.700 × 10³ 1.771 × 10⁻⁸ 0.997 M&P-xylene 1.930 × 10³ 4.753 × 10⁻⁸ 0.957 O-xylene 0.904 × 10³ 1.438 × 10⁻⁸ 0.964 As shown in Table 1, the initial releasable concentration Cm,0 of all VOCs becomes larger with increasing temperature. At lower temperatures, the heat of adsorption is reduced, and the rate of the adsorption process of VOC molecules is accelerated. The process is reversible; adsorbate molecules can also absorb heat to escape into the air again. Desorption is defined as the process by which VOC molecules are ejected from a surface upon which they have been adsorbed. This occurs when the molecular kinetic energy is greater than the physical binding energy between the molecules and the solid skeleton particles[22]. At room temperature, the quantity of VOC molecules able to be released is only a small proportion of their total adsorbed content. Since the nature of physical adsorption is dispersion force, the relationship between adsorption potential energy and the volume of the adsorption process remains unaltered at any given temperature; thus, adsorption potential energy is independent of temperature[23]. The potential energy of adsorption is basically constant across different temperatures, and the change in kinetic energy of VOC molecules caused by temperature changes directly affects the value of Cm,0 in the solid waste. Increases in temperature naturally increase the kinetic energy of VOCs, which in turn enhance the desorption of the aforementioned compounds. This phenomenon is reflected in the increase of the Cm,0 value.
However, the Cm,0 values of 1-ethyl-4-methylbenzene at 28 °C and 33 °C are very close. At 28 °C, most 1-ethyl-4-methylbenzene originally adsorbed inside the solid has been desorbed into free state 1-ethyl-4-methylbenzene molecules, and the amount of these free state 1-ethyl-4-methylbenzene molecules is close to that at 33 °C. Therefore, although the theoretical Cm,0 value increases when the temperature rises to a certain numerical value, it is also necessary to measure it specifically according to the sample storage time[24].
As illustrated by the findings presented in Table 1, the diffusion coefficient Dm of each VOC component increases in proportion with rising temperatures. These results are consistent with the research findings of several scholars in the field of porous building materials[19,21]. When the temperature increases, it leads to an increase in the force between VOCs, the solid waste solid skeleton matrix, and the force between VOC molecules. At the same time, the kinetic energy of the VOC molecules inside the waste becomes larger with the increase in ambient temperature, and the molecular thermal movement becomes violent. Therefore, its migration rate becomes faster, which leads to an increase in the diffusion coefficient[17].
Moreover, the elevated temperature gives rise to an increase in the vapour pressure of each VOC constituent, concomitant with an enhancement in solubility in air. This facilitates convective diffusion of VOCs on the outer layer of the solid surface, rendering it easier for VOCs to be released into the ambient air medium. This process, in turn, indirectly increases Dm, a parameter which is instrumental in characterizing the diffusion intensity of VOCs. Among them, compared with 18 °C, M&P-xylene showed the largest increase in diffusion coefficient at 33 °C, reaching up to 3.86 times, followed by butyl acetate at 3.386 times.
To better understand the extent to which the key model parameters—the diffusion coefficient Dm and the initial releasable concentration Cm,0—influence the cumulative release flux of VOCs, this study also conducted a sensitivity analysis. Based on the sensitivity formula in Eqs (11) and (12), and the single-phase medium model under a semi-infinite diffusion scenario, calculations revealed that the sensitivity coefficient JC of Cm,0 remained constant at JC = 1 as time increased, indicating that the cumulative release flux is directly proportional to Cm,0. In other words, reducing the value of Cm,0 within the solid waste can control the cumulative release flux of VOCs. In contrast, the diffusion coefficient Dm, relative to the sensitivity coefficient, gradually approaches 0 over time (Fig. 6). This indicates that changes in Dm have a positive correlation with M(ti), but the magnitude of this effect diminishes progressively. That is, in the later stages of the experiment, the influence of Dm is almost negligible compared to the initial stages of emission. In practice, during long-term storage of solid waste, the diffusion coefficient changes due to pore collapse caused by waste pile settlement. Even so, under long-term release conditions, Dm has a minor effect on the cumulative flux. Therefore, the established model does not require correction and can still be used to predict long-term VOC releases.
However, at the same time but at different temperatures, 1-butanol, butyl acetate, and M&P-xylene have JD values significantly lower than those of 1-ethyl-4-methylbenzene, 1,2,4-trimethylbenzene, 1,2,3-trimethylbenzene, and O-xylene. This is opposite to the magnitude order of Dm among the aforementioned seven VOCs. This indicates that under the same conditions, the cumulative release flux M(ti) of VOCs with larger diffusion coefficients is less affected by the diffusion coefficient. The smaller the Dm of a VOC, the more its impact on M(ti) during the initial phase needs to be considered. Conversely, for VOCs with larger Dm values, their impact on M(ti) in the later stages can be largely disregarded. Comparing the effects of Cm,0 and Dm on M(ti) under a semi-infinite diffusion scenario, Cm,0 exhibits the highest sensitivity to M(ti), followed by Dm. In other words, from the perspective of formulating VOC release control strategies for actual semi-infinite diffusion scenarios, priority should be given to reducing Cm,0, followed by reducing Dm during the early release phase, thereby achieving the goal of reducing M(ti).
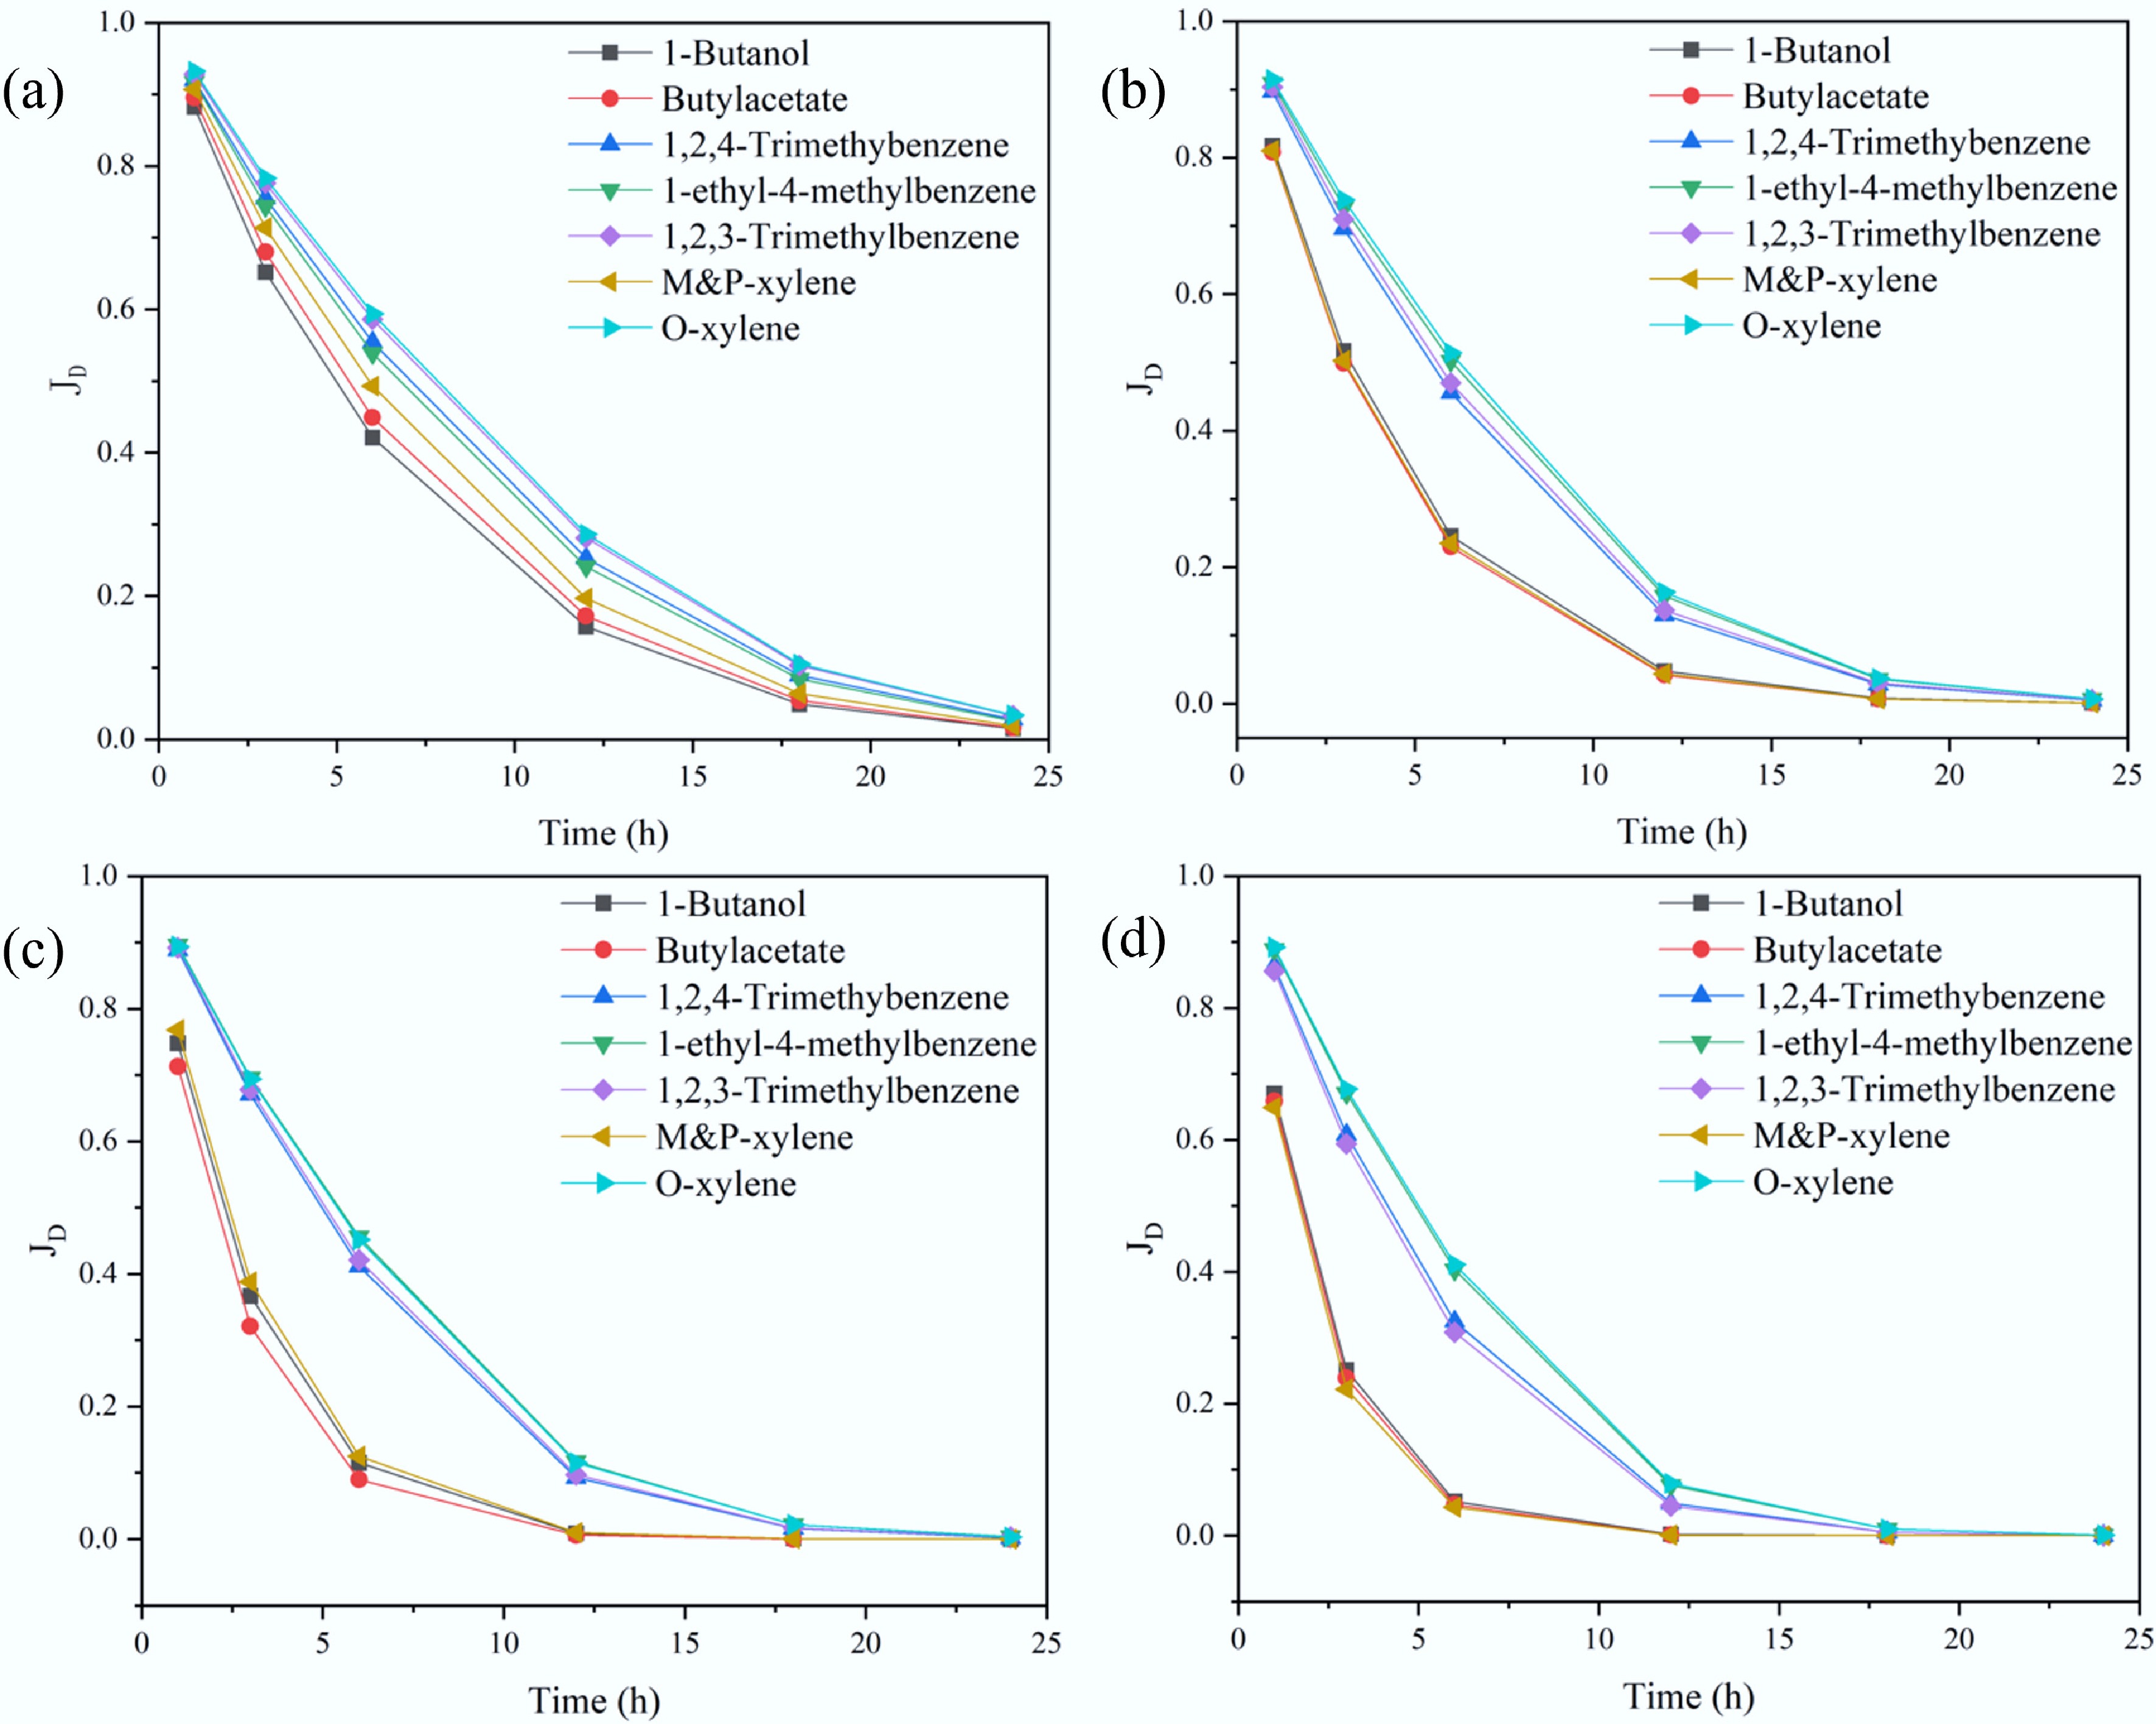
Figure 6.
Sensitivity analysis of Dm in a semi-infinite diffusion scenario at different temperatures. (a) 18 °C, (b) 23 °C, (c) 28 °C, and (d) 33 °C.
Validation of the theoretical correlation
-
According to Supplementary Fig. S1, the release rate of VOCs decreases gradually with the increase of release time. This also indicates that the conclusion of this experiment is only valid for a short period of time. Consequently, when investigating the effect of OBDPS temperature parameters on the release of VOCs from the source, Cm,0 and Dm can be adopted as indicator parameters. However, it is necessary to further verify whether these parameters remain applicable in further practical applications.
The Cm,0 value obtained in Table 1 was employed in the regression model of Eq. (5) against the independent variable T, and the results of this analysis are presented in Fig. 7. The constants lnC1 and C2 of the correlation Eq. (5) are also labeled in the figure. This can help us to find the releasable ratio of various VOCs η. With the exception of 1-butanol, 1,2,4-trimethylbenzene, and 1-ethyl-4-methylbenzene, the effect on Cm,0 is reduced at 33 °C in comparison to 28 °C. The rest of the Cm,0 are positively correlated with the change of temperature T, and all of them have R2 greater than 0.9. This result indicates that Eq. (5) can predict the Cm,0 of VOCs at different temperatures, but it may be biased beyond a certain temperature. In other words, Eq. (5) can only predict the initial releasable concentration Cm,0 of most of the VOCs in the same solid waste within a certain time range, and it is still necessary to obtain the accurate Cm,0 by distributing the test data.
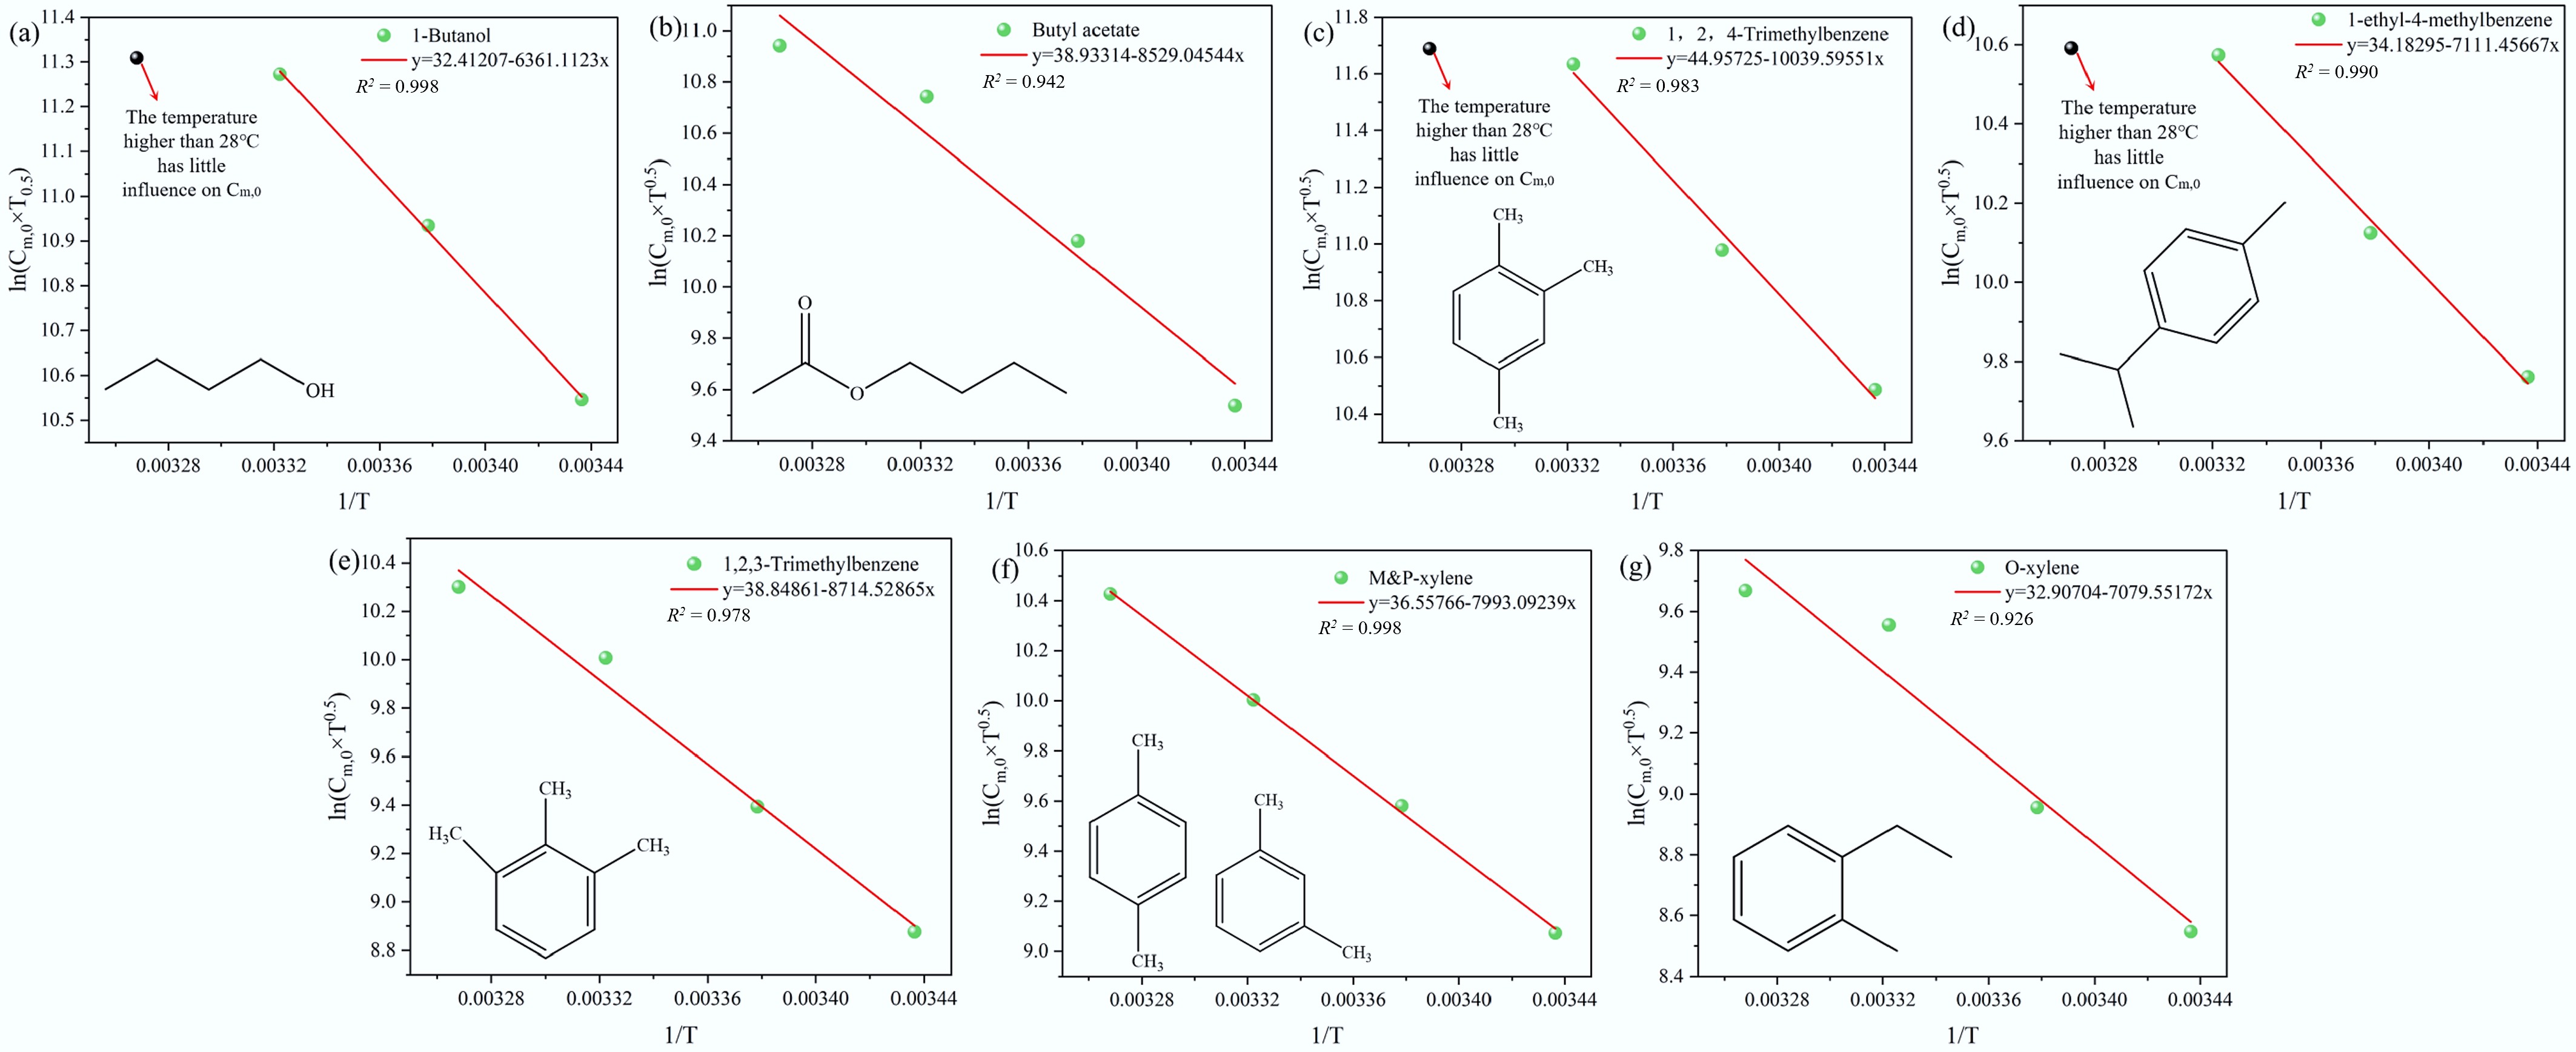
Figure 7.
Curves of Cm,0 by fitting the experimental values.
Similarly, Eq. (10) was utilized to fit the relationship between Dm and T in Table 1 and Fig. 8. The constants lnD1 and D2 of the correlation Eq. (10) are also labeled together in the figure. In this case, all the Dm values exhibit a positive correlation with the change in temperature T, and R2 exceeded 0.9. This finding confirms the high predictive accuracy of Eq. (10) and supports the validity of the theoretical derivation. More importantly, the linear relationships established in Figs 7 and 8 transform the empirical fitting exercise into a physically meaningful parameterization of the sludge-VOC system. The slopes C2 and D2 are not merely regression constants; they quantify the intrinsic adsorption energetics and diffusion activation barriers, respectively. Such thermodynamic insights, extracted from relatively simple emission experiments, provide a rational basis for predicting how changes in sludge composition or VOC molecular structure will influence temperature-dependent emission behavior.
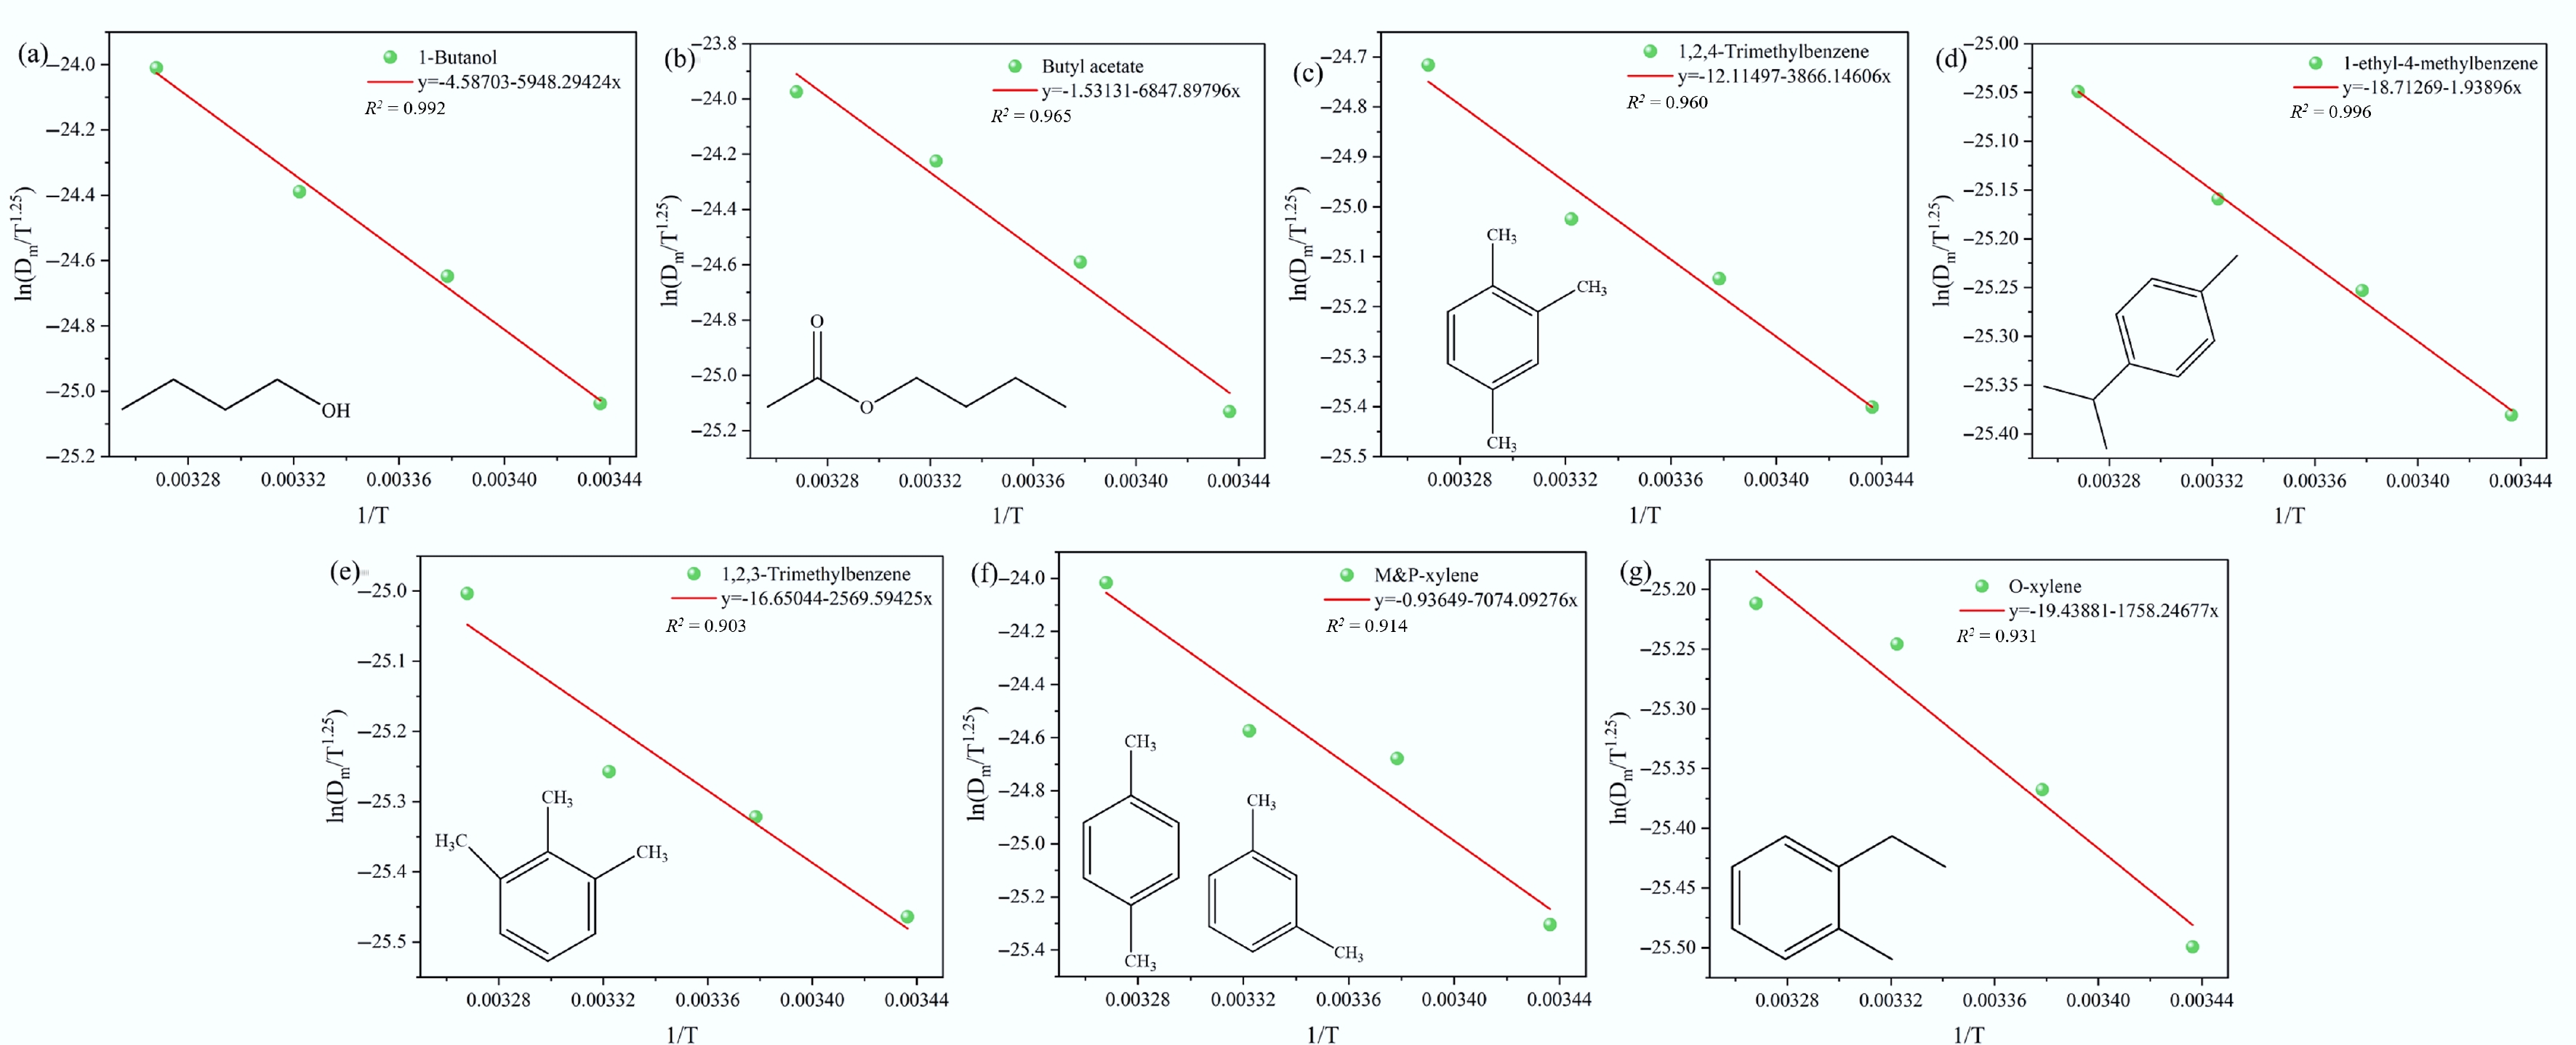
Figure 8.
Curves of Dm by fitting the experimental values.
According to the above derivation, for a given VOC, Eqs (5) and (10) can effectively predict the changes in release characteristic parameters over a certain release time. It can also be found that increasing temperature enhances the total release of VOCs.
The excellent agreement between theory and experiment (R2 > 0.9) confirms that within this moderate temperature range, the underlying assumptions—particularly the constancy of the adsorption potential and the dominance of Fickian diffusion—are not only mathematically convenient, but physically justified. However, one must bear in mind that these correlations describe macroscopic effective behavior; they implicitly average over the nanoscale heterogeneity of the paint sludge matrix (e.g., variations between resin-rich domains and inorganic filler surfaces).
Considering the total amount of hazardous waste emissions from the entire automotive industry each year, the waste paint sludge and waste paint can reach more than 3 × 10³ t[3,25]. Moreover, the types of VOCs in paint sludge are very complex, with as many as 20 types of VOCs[8]. This study is able to predict the release of OBDPS well in the short term by statistical physical theory. However, in terms of long-term emissions, after the physical adsorption of VOCs in the paint sludge is almost completely released, VOCs will be released through chemical processes. This process can last for at least a few years, and may take place through processes such as hydrolysis reactions and aging reactions. It can thus be concluded that the present study applies exclusively to short-term VOC emissions from OBDPS. Furthermore, it is challenging to guarantee that no chemical processes occur during measurement, thereby compromising the integrity of experimental data. Therefore, it is necessary to improve the current measurement method and the constructed model.
Machine learning-assisted validation
-
In addition to mathematical model predictions, we also employed machine learning to forecast baseline characteristics of Cm,0 and Dm using data from this study (Table 1). Six predictive models were established, including ridge regression (Ridge), lasso regression (Lasso), SVR-rbf, SVR-linear, random forest, and gradient boosting regressor. Each model was evaluated using the R2, MAE, RMSE, and MAPE. Higher R2 values indicate better predictive accuracy, while lower MAE, RMSE, and MAPE values signify improved model precision. The prediction results from different models are shown in Fig. 9. Comparative analysis reveals that the Ridge model demonstrates relatively superior predictive performance. Considering this study employs mathematical models to forecast data exhibiting linear relationships, the traditional linear model (Ridge) achieves optimal results (R2 = 0.7749), consistent with practical outcomes.
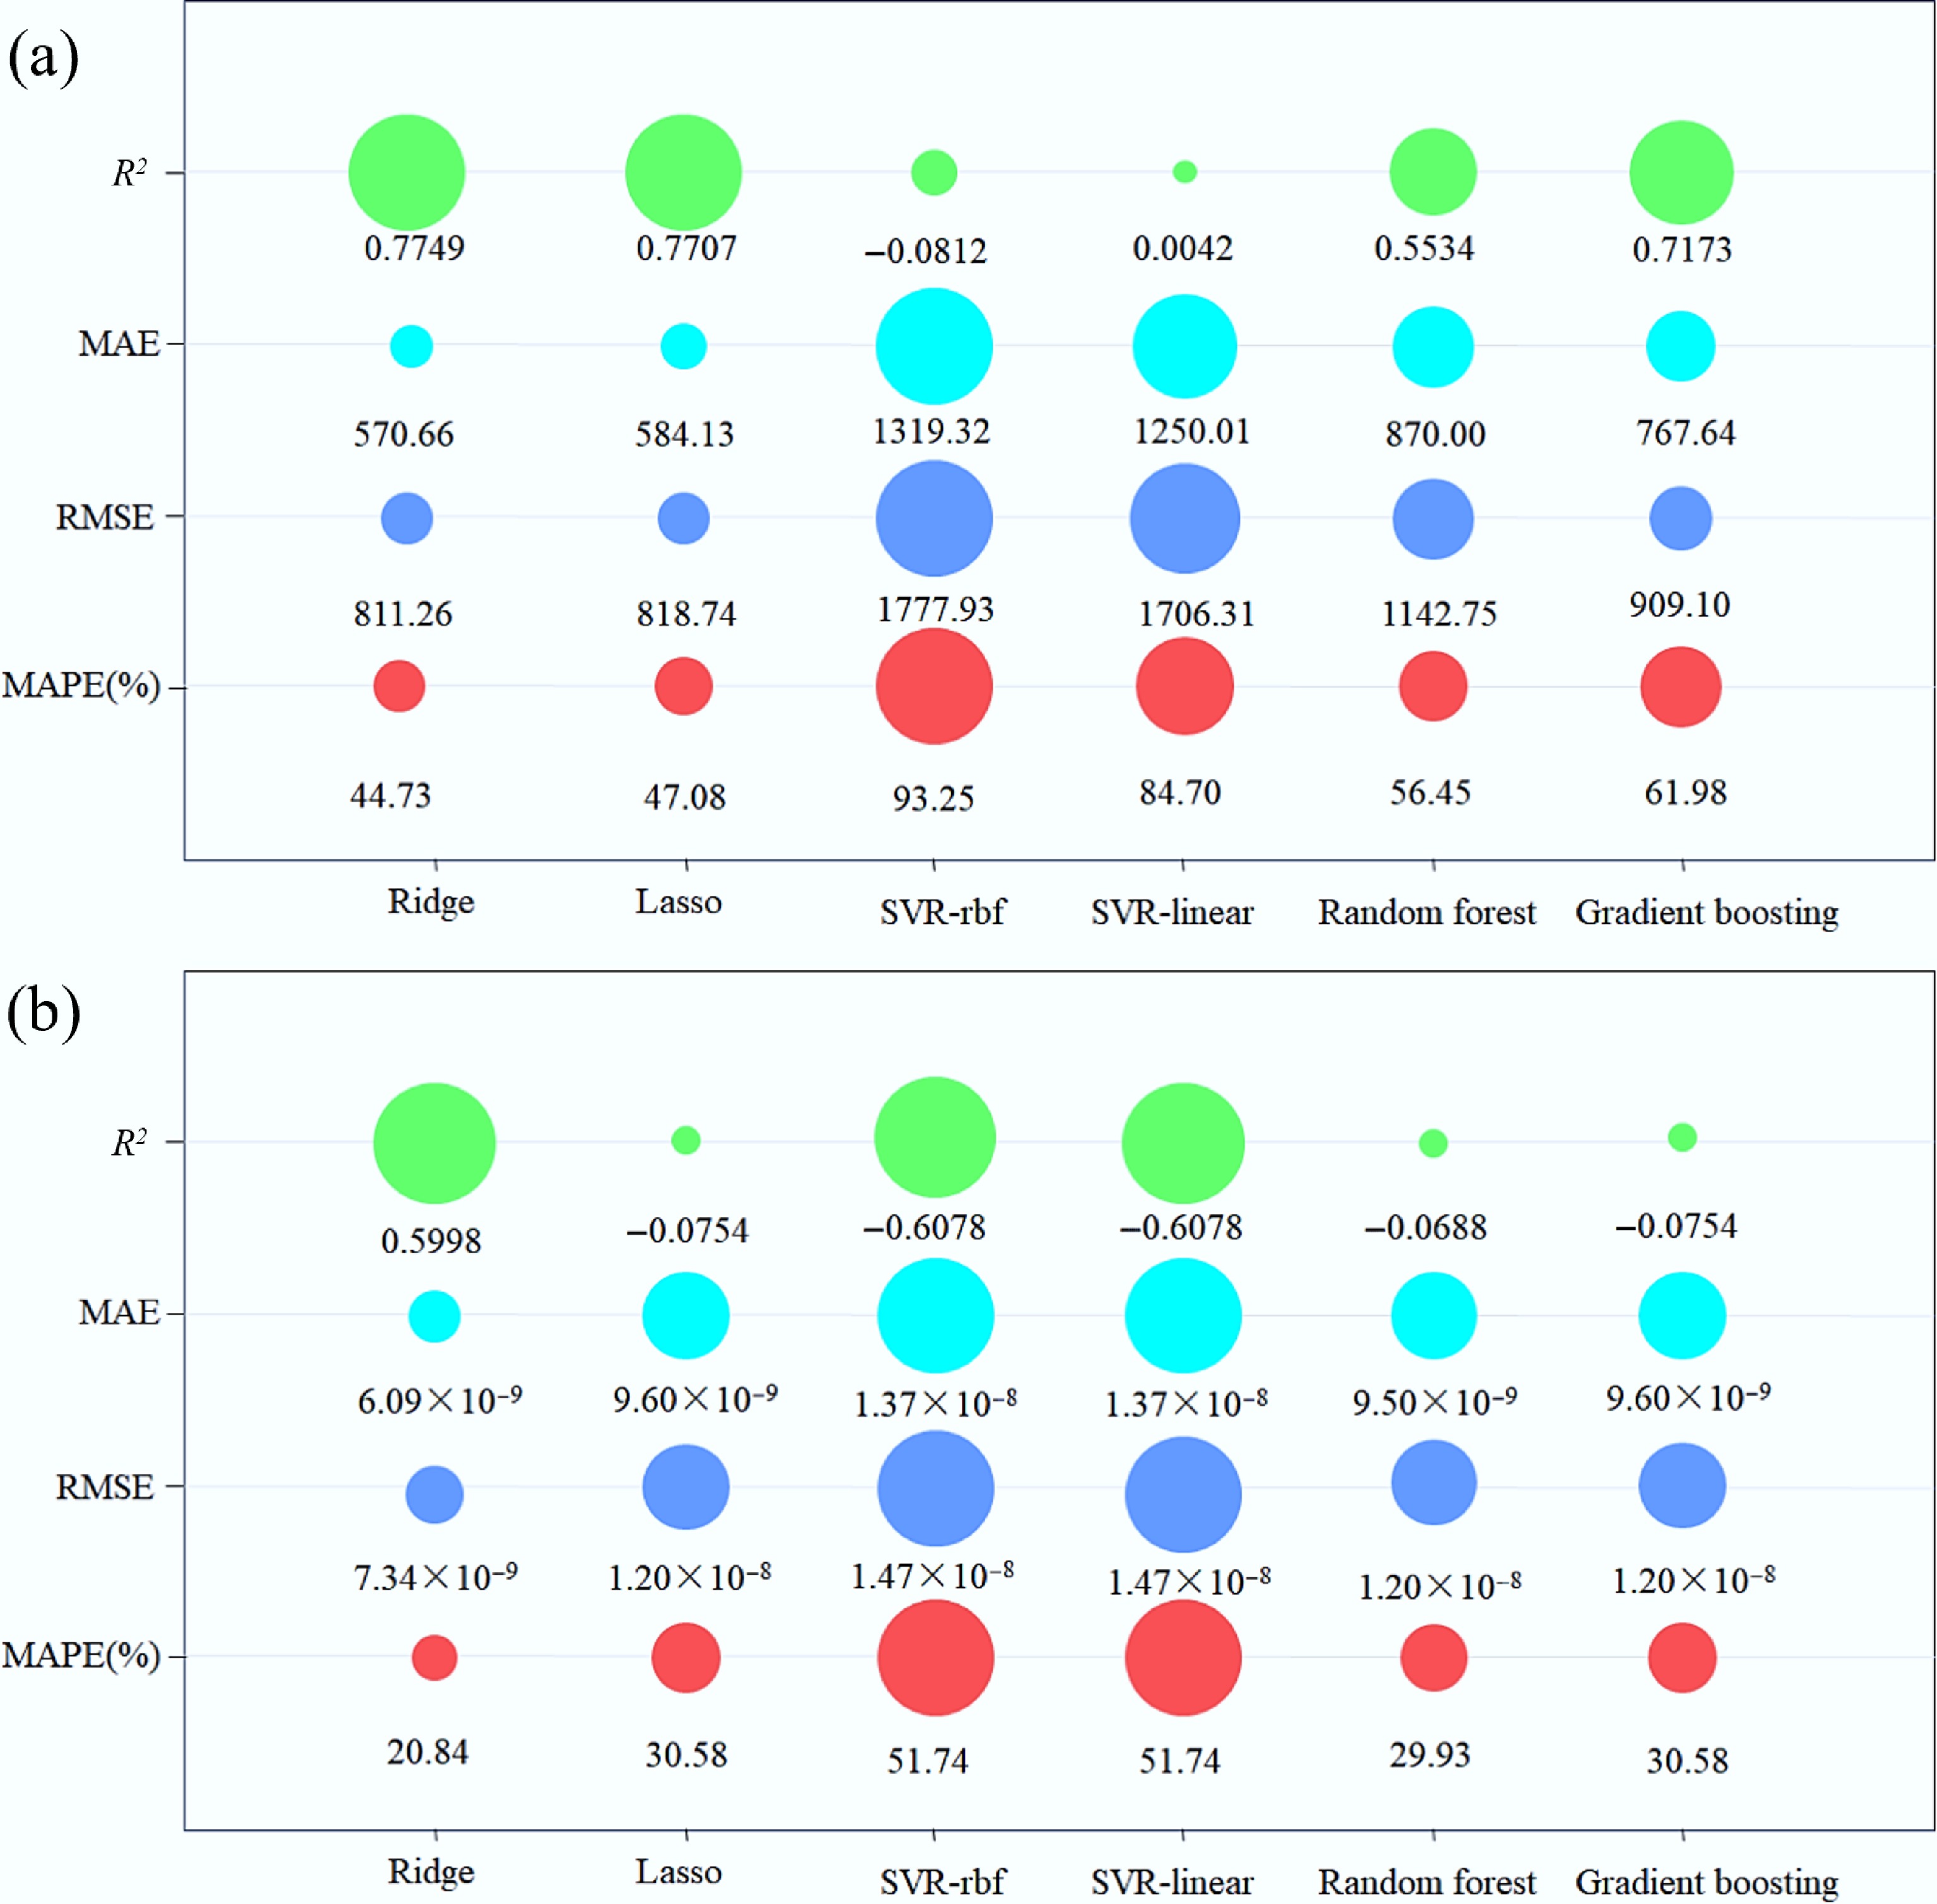
Figure 9.
Performance comparison of different machine learning models for predicting (a) Cm,0, and (b) Dm.
Additionally, Fig. 10 illustrates the performance of the Ridge model on the experimental dataset, comparing experimental values with model predictions, along with the residual distribution. These results indicate that the predictive accuracy (R2) of the machine learning model is lower than that of the theoretical physical model developed in this study. This suggests that when data volume is limited, models incorporating physical information demonstrate greater robustness and extrapolation capability compared to purely data-driven models.
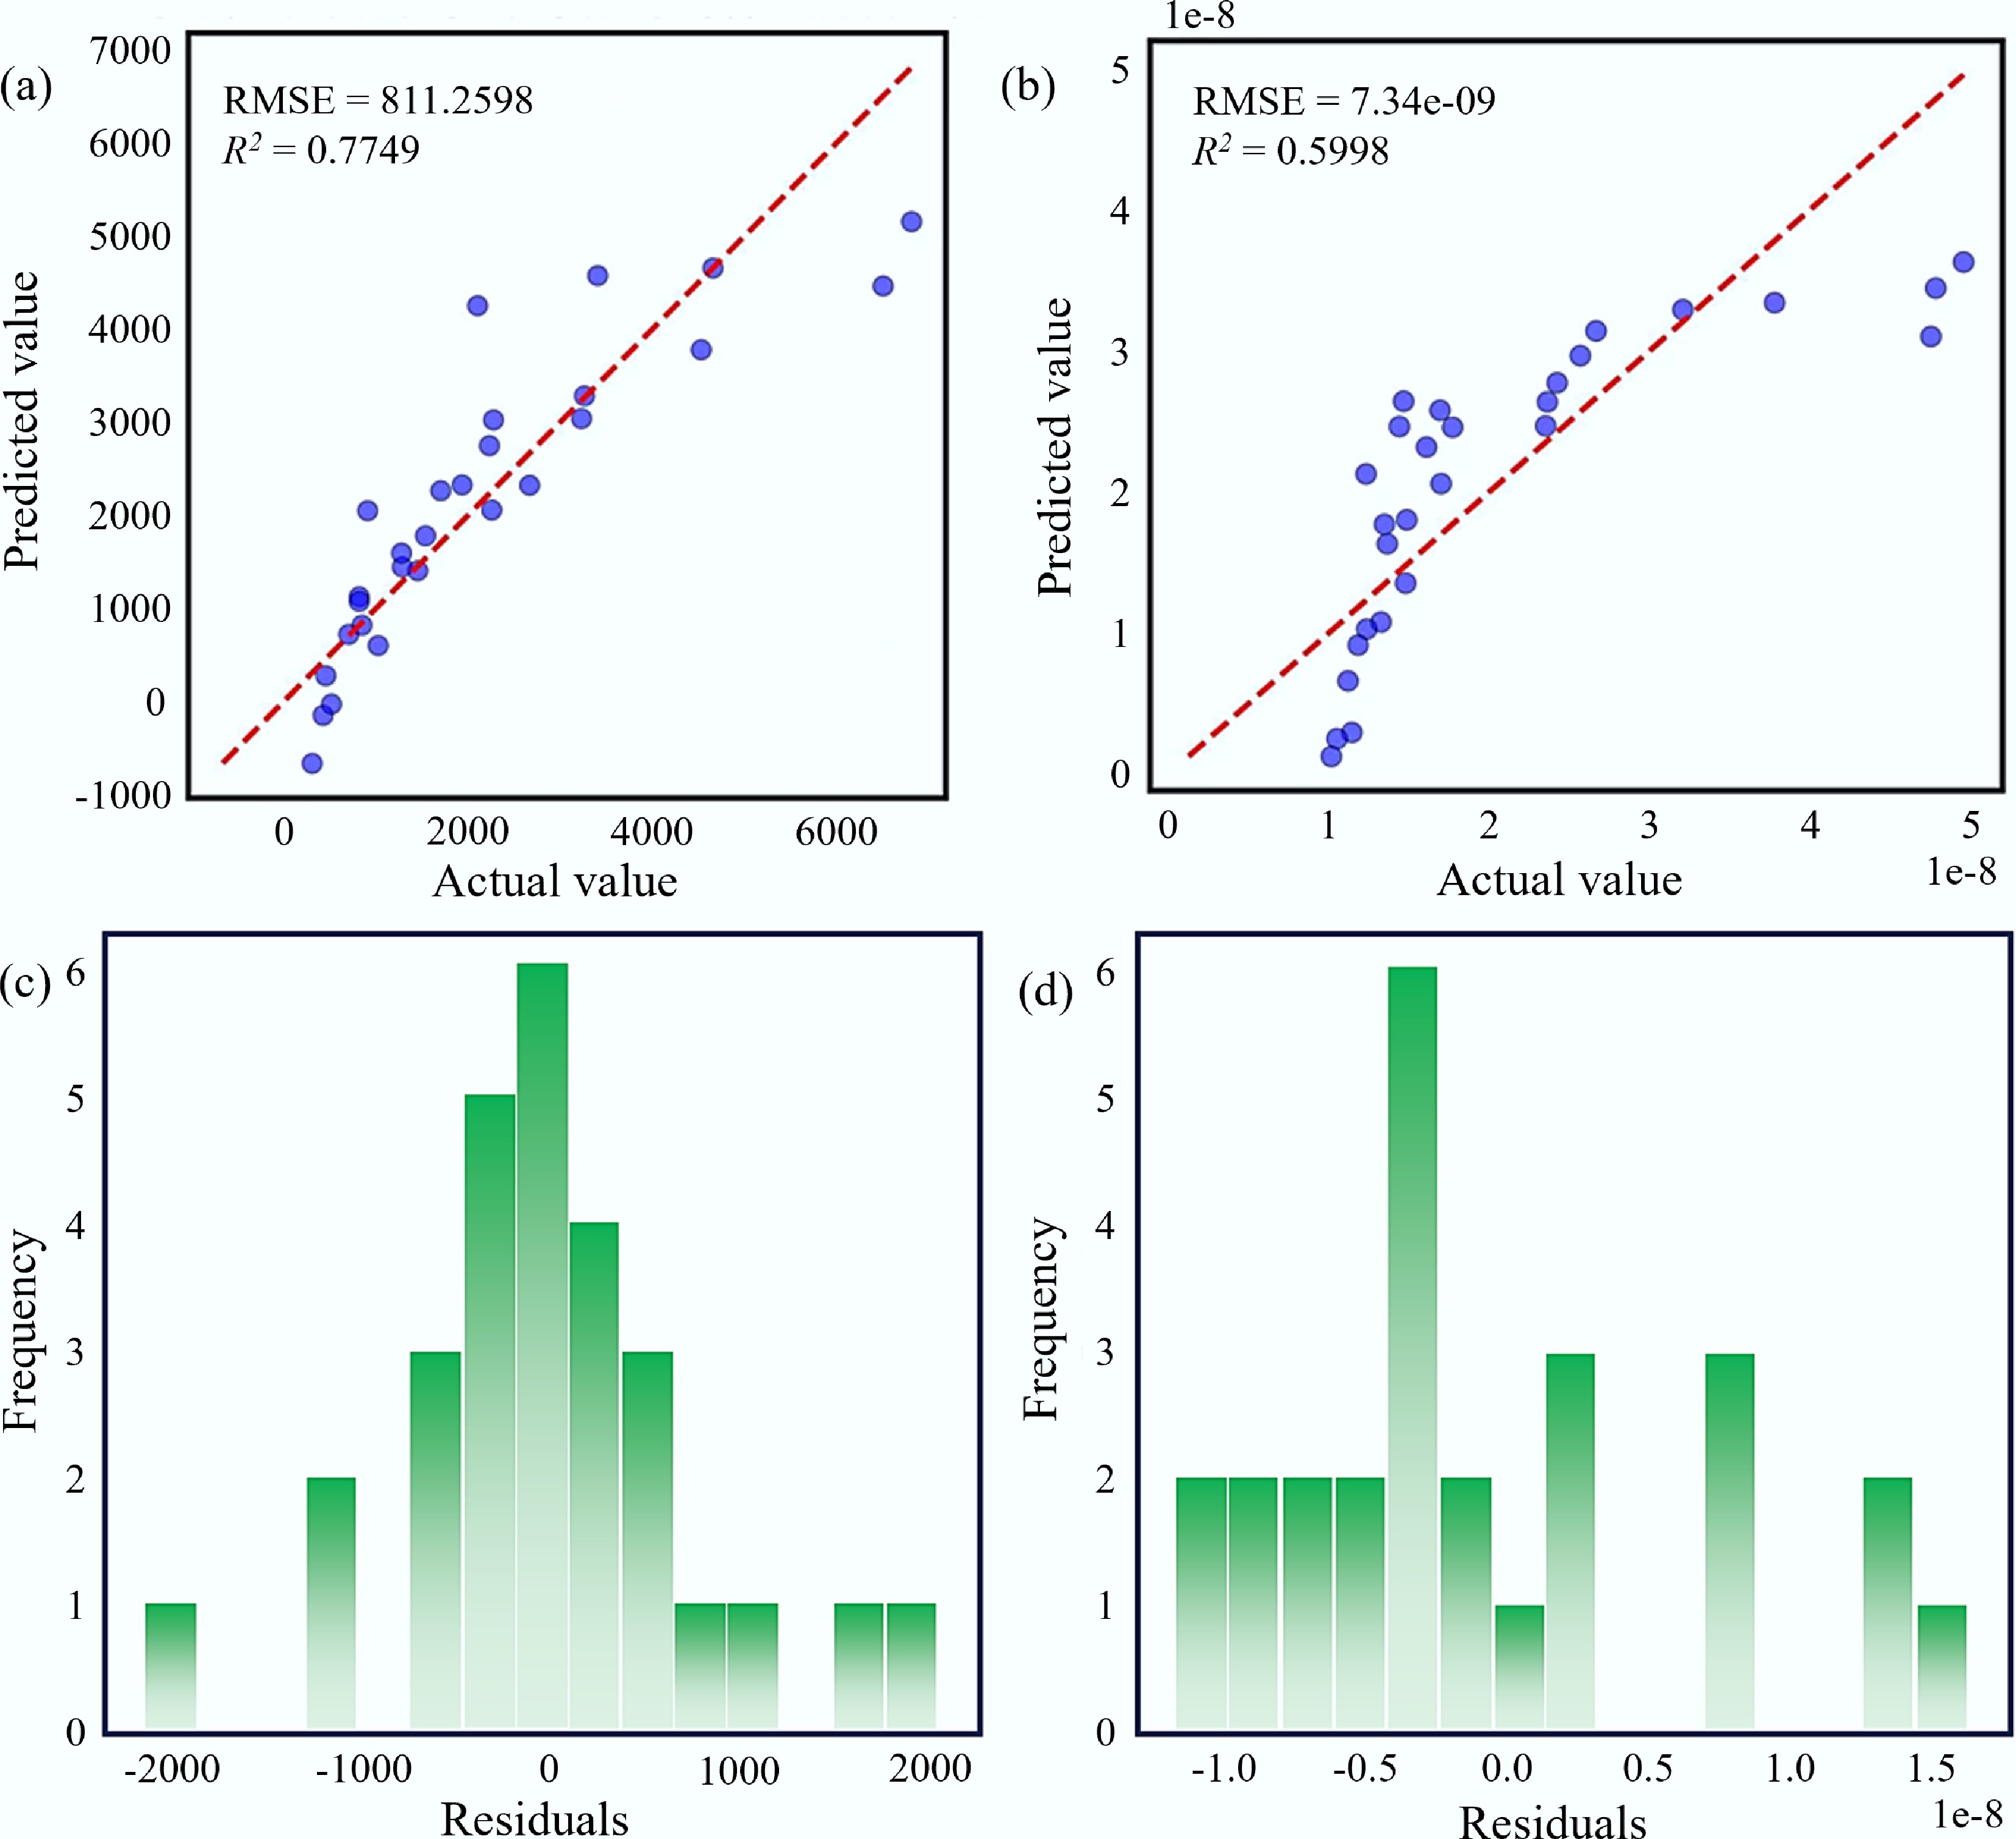
Figure 10.
(a) Cm,0-leave-one-out cross validation; (b) Dm-leave-one-out cross validation; (c) Cm,0-residual distribution; (d) Dm-residual distribution.
The machine learning model's predictive performance is unsatisfactory, particularly for Dm, likely due to the limited dataset size. This makes it challenging to capture the complex nonlinear characteristics of Dm and Cm,0 as they vary with temperature. However, feature importance analysis in this section reveals that temperature remains the most significant input feature identified by the model. This data-driven finding corroborates the validity of the theoretical derivations in this study. Therefore, this section of the study offers an alternative approach for investigating the influence of key emission parameters on VOCs from automotive oil-based dry paint sludge.
Caveats on model generalization. It is important to interpret these machine learning results with appropriate caution. The current dataset, comprising 28 experimental observations, is inherently limited in size and diversity. While the Ridge regression model exhibits reasonable predictive accuracy within the training domain (R2 = 0.77), its extrapolation capability to unseen temperature conditions or chemically distinct VOC species remains unverified and likely constrained. The moderate performance of nonlinear models (e.g., random forest, gradient boosting) further underscores the risk of overfitting when applying high-capacity algorithms to small datasets. Consequently, the machine learning component of this study should be viewed not as a standalone predictive tool, but rather as a proof-of-concept demonstration—illustrating that data-driven approaches can capture the underlying physical trends, and more importantly, highlighting the urgent need for larger, systematically curated emission datasets to unlock the full potential of artificial intelligence in environmental waste management. Overinterpretation of the specific numerical predictions beyond the tested temperature range (18–33 °C) or for untested VOC compounds is strongly discouraged.
Future studies
-
The application of machine learning in this study reveals that constructing highly accurate predictive models is challenging based solely on the current scale of experimental data. Therefore, future research should focus on the following three aspects (Fig. 11): (1) expanding the dataset, which is the most direct approach. Beyond increasing experimental data collected at different temperature gradients, further exploration should include environmental factors (relative humidity and air exchange rate), VOC types, and solid waste properties (porosity, moisture content, and solid matrix structure) as input features. This will help models understand material differences; (2) incorporating transfer learning techniques. When target VOC data are scarce, it is feasible to pre-train a model using a large dataset from a related field (e.g., VOC emissions from building materials) and then fine-tune it on the small dataset of this study. This leverages the physical similarity of diffusion processes, using domain knowledge to compensate for data scarcity; (3) exploring physical information neural networks (PINNs). Embed theoretically derived relationships (e.g., Eqs [5] and [10]) as prior knowledge within the model to achieve deep integration of physics and data. This ensures the model adheres to physical laws even with limited data, minimizes model drift, and significantly enhances generalization capabilities.
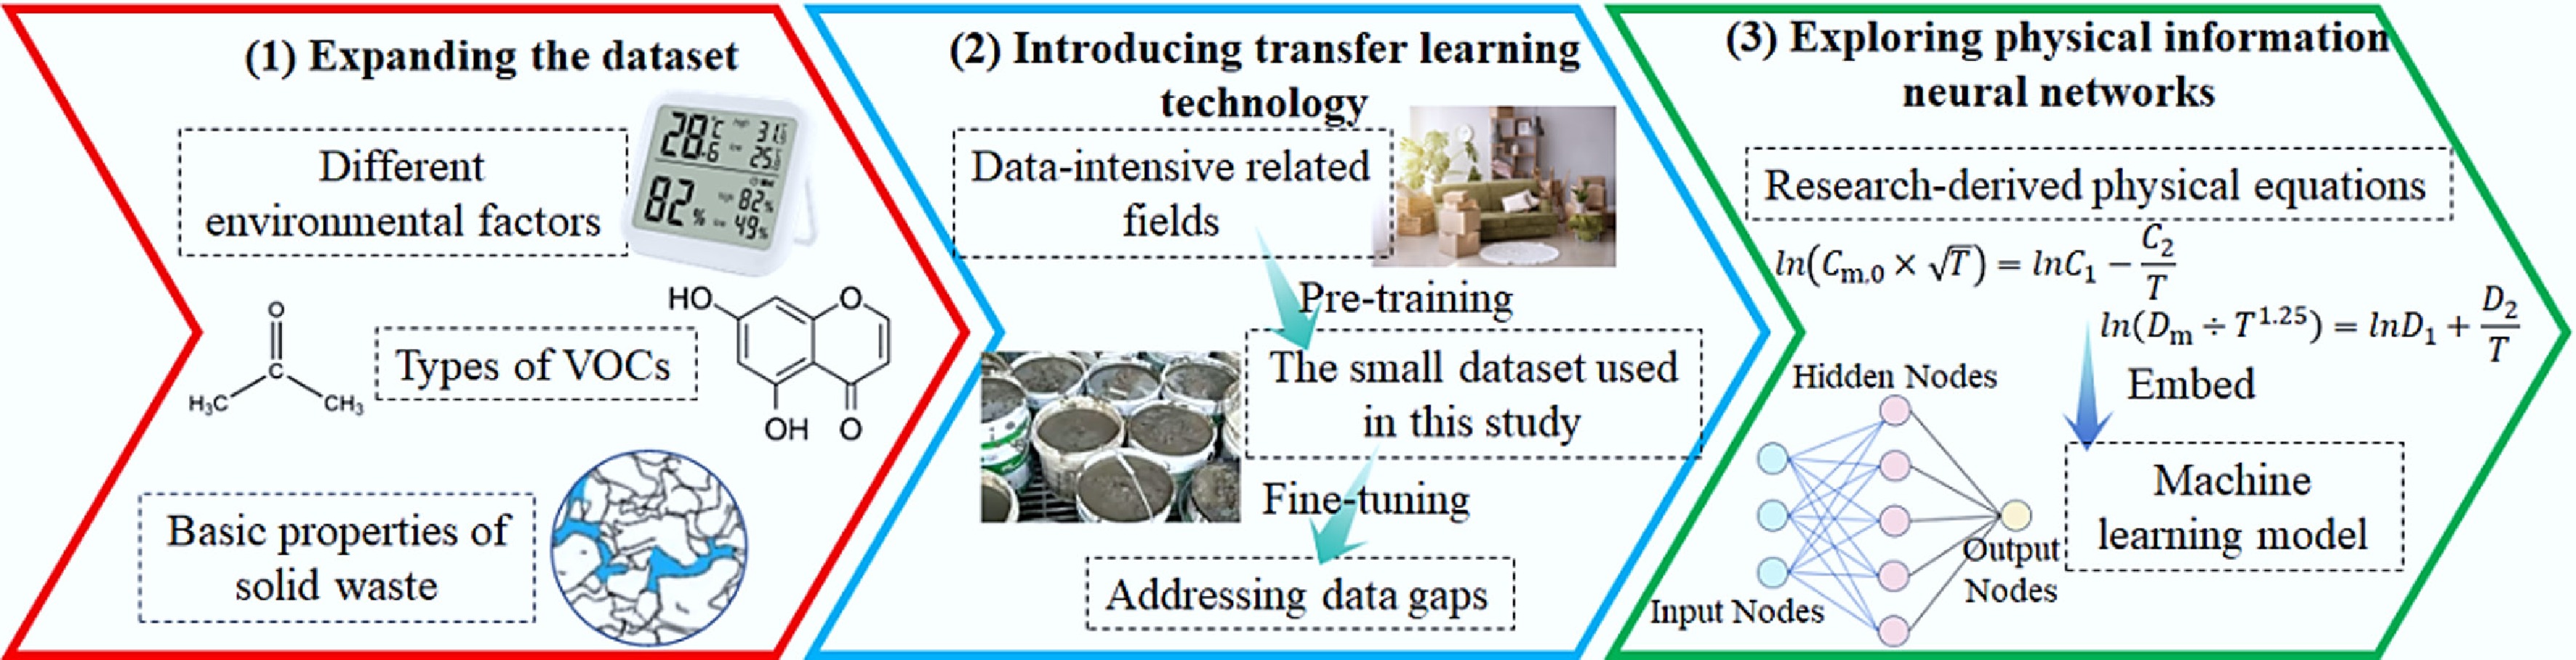
Figure 11.
Key research directions for the future.
-
In summary, based on previous research, this study investigates the temperature effect on the release of OBDPS. Furthermore, simulations are carried out to verify the effect. We determined the release characterization parameters of seven major VOCs in OBDPS at four different temperatures. The release characterization parameters were found to increase with increasing temperature. Using the derived equations, we further verified that Dm shows a positive correlation with 1/T, and Cm,0 also presents a positive correlation with 1/T. The coefficients of determination were found to exceed 0.9, exhibiting a high degree of precision. This indicates that the theoretical correlations and experimental results are highly compatible, suggesting that the equations in this study can better predict the physical VOC emissions. However, this fitting process only satisfies within a certain time range. Beyond a certain time, the release characterization parameters need to be obtained from specific emission experimental data. Simultaneously, utilizing various machine learning models to predict baseline characteristics of Cm,0 and Dm provides an alternative approach for investigating the influence of key emission parameters on VOCs from automotive OBDPS. The findings of this study offer theoretical and practical foundations for the management of solid wastes containing VOCs and associated risk assessments.
-
It accompanies this paper at: https://doi.org/10.48130/een-0026-0010.
-
The authors confirm their contributions to the paper as follows: all authors made a contribution to the conception and design of the study; Zewei Liu: conceptualization, methodology, writing; Fuhang Huo: conceptualization, methodology, writing; Lei Zhang: methodology, review and editing; Ruihao Yang: methodology, review and editing; Zixian Pang: methodology; Xianglong Li: methodology; Mingqian Cheng: conceptualization, methodology, project administration; Tingting Liu: conceptualization, methodology, project administration; Ya Xu: conceptualization, methodology, project administration; all authors provided commentary on previous iterations of the manuscript. All authors reviewed the results and approved the final version of the manuscript.
-
The datasets generated during and/or analyzed during the current study are available from the corresponding author on reasonable request.
-
This research was supported by the Yunnan Fundamental Research (No. 202401CF070139), the National Natural Science Foundation of China (No. 22406076), and the Central Government Guides Local Science and Technology Development Fund (No. 24ZYQA025).
-
The authors hereby declare that there are no known competing financial interests nor personal relationships that might have appeared to influence the research reported in this paper.
-
Full list of author information is available at the end of the article.
- The supplementary files can be downloaded from here.
- Copyright: © 2026 by the author(s). Published by Maximum Academic Press, Fayetteville, GA. This article is an open access article distributed under Creative Commons Attribution License (CC BY 4.0), visit https://creativecommons.org/licenses/by/4.0/.
-
About this article
Cite this article
Liu Z, Huo F, Zhang L, Yang R, Pang Z, et al. 2026. Temperature-dependent emission of volatile organic compounds from automotive oil-based dry paint sludge: a statistical physics, experimental, and machine learning study. Energy & Environment Nexus 2: e016 doi: 10.48130/een-0026-0010 

Temperature-dependent emission of volatile organic compounds from automotive oil-based dry paint sludge: a statistical physics, experimental, and machine learning study
- Received: 08 April 2026
- Revised: 24 April 2026
- Accepted: 08 May 2026
- Published online: 04 June 2026
Abstract: Automotive paint sludge is a hazardous organic waste with extremely high volatile organic compound (VOC) content. Improper disposal poses a severe threat to the surrounding environment. Diffusion-controlled models can characterize cumulative VOC emission behavior and guide safe disposal. However, the two key parameters, the diffusion coefficient (Dm) and the initial emittable concentration (Cm,0), depend heavily on temperature (T), and this dependence remains unexplored. In this work, we first derive theoretical correlations linking Dm and Cm,0 to T, based on statistical physics. The logarithm of Dm/T1.25 is found to vary linearly with 1/T, while the logarithm of Cm,0∙T0.5, also follows a linear relationship with 1/T. To validate these correlations, we conducted VOC emission experiments on automotive oil-based dry paint sludge at four temperatures (18, 23, 28, and 33 °C) and analyzed seven representative VOCs. The experimental results agree well with the theoretical predictions, confirming the reliability of the proposed physical framework for VOC emission characterization. Furthermore, we employed multiple machine learning models to predict the baseline characteristics of Cm,0, and Dm, offering an alternative approach to investigate how key emission parameters respond to temperature variations. This study provides a robust, theory-driven, and data-augmented methodology for predicting and regulating temperature-dependent VOC emissions from organic hazardous waste, with direct implications for cleaner paint sludge treatment and process design.