-
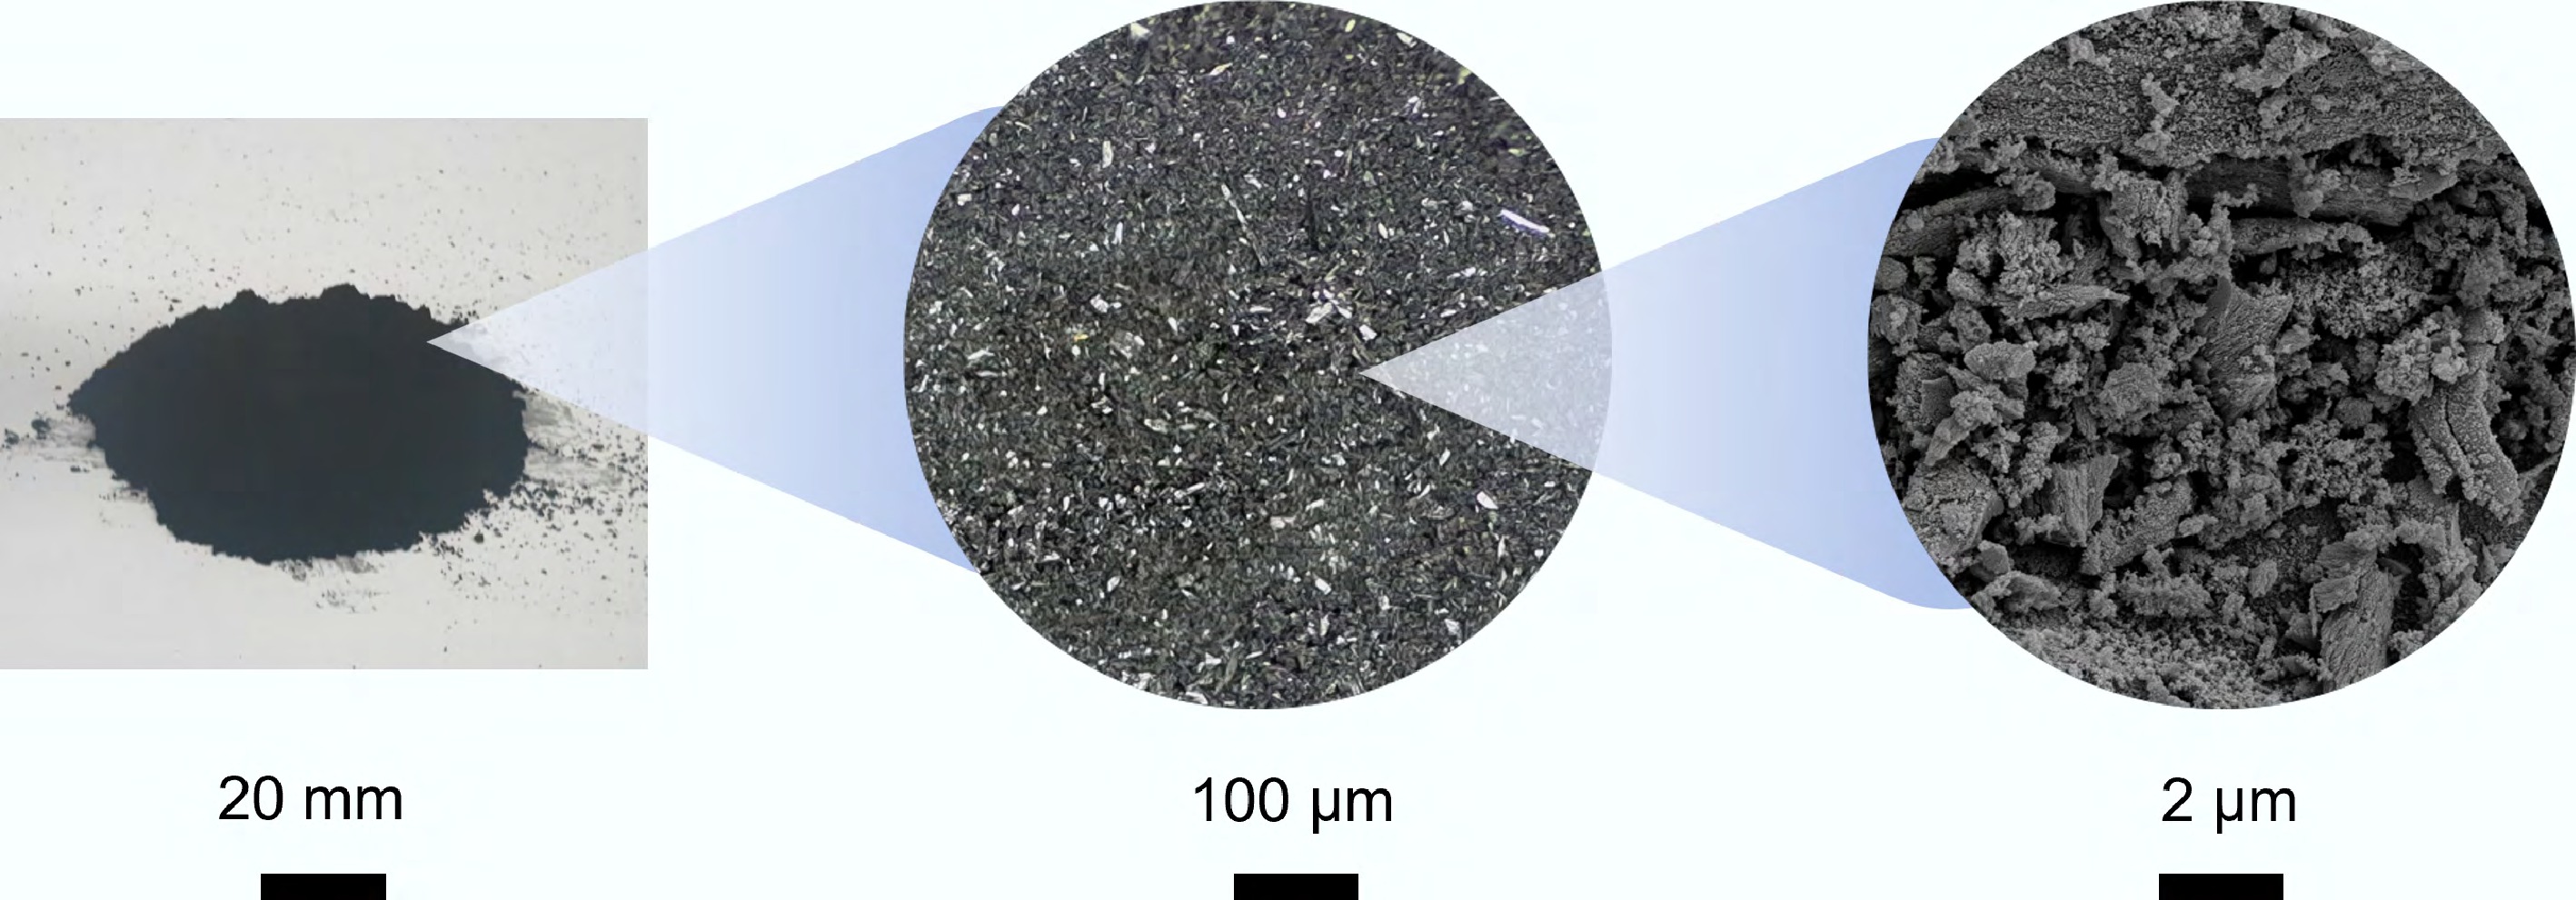
Figure 1.
The morphology of biochar at different magnifications.
-
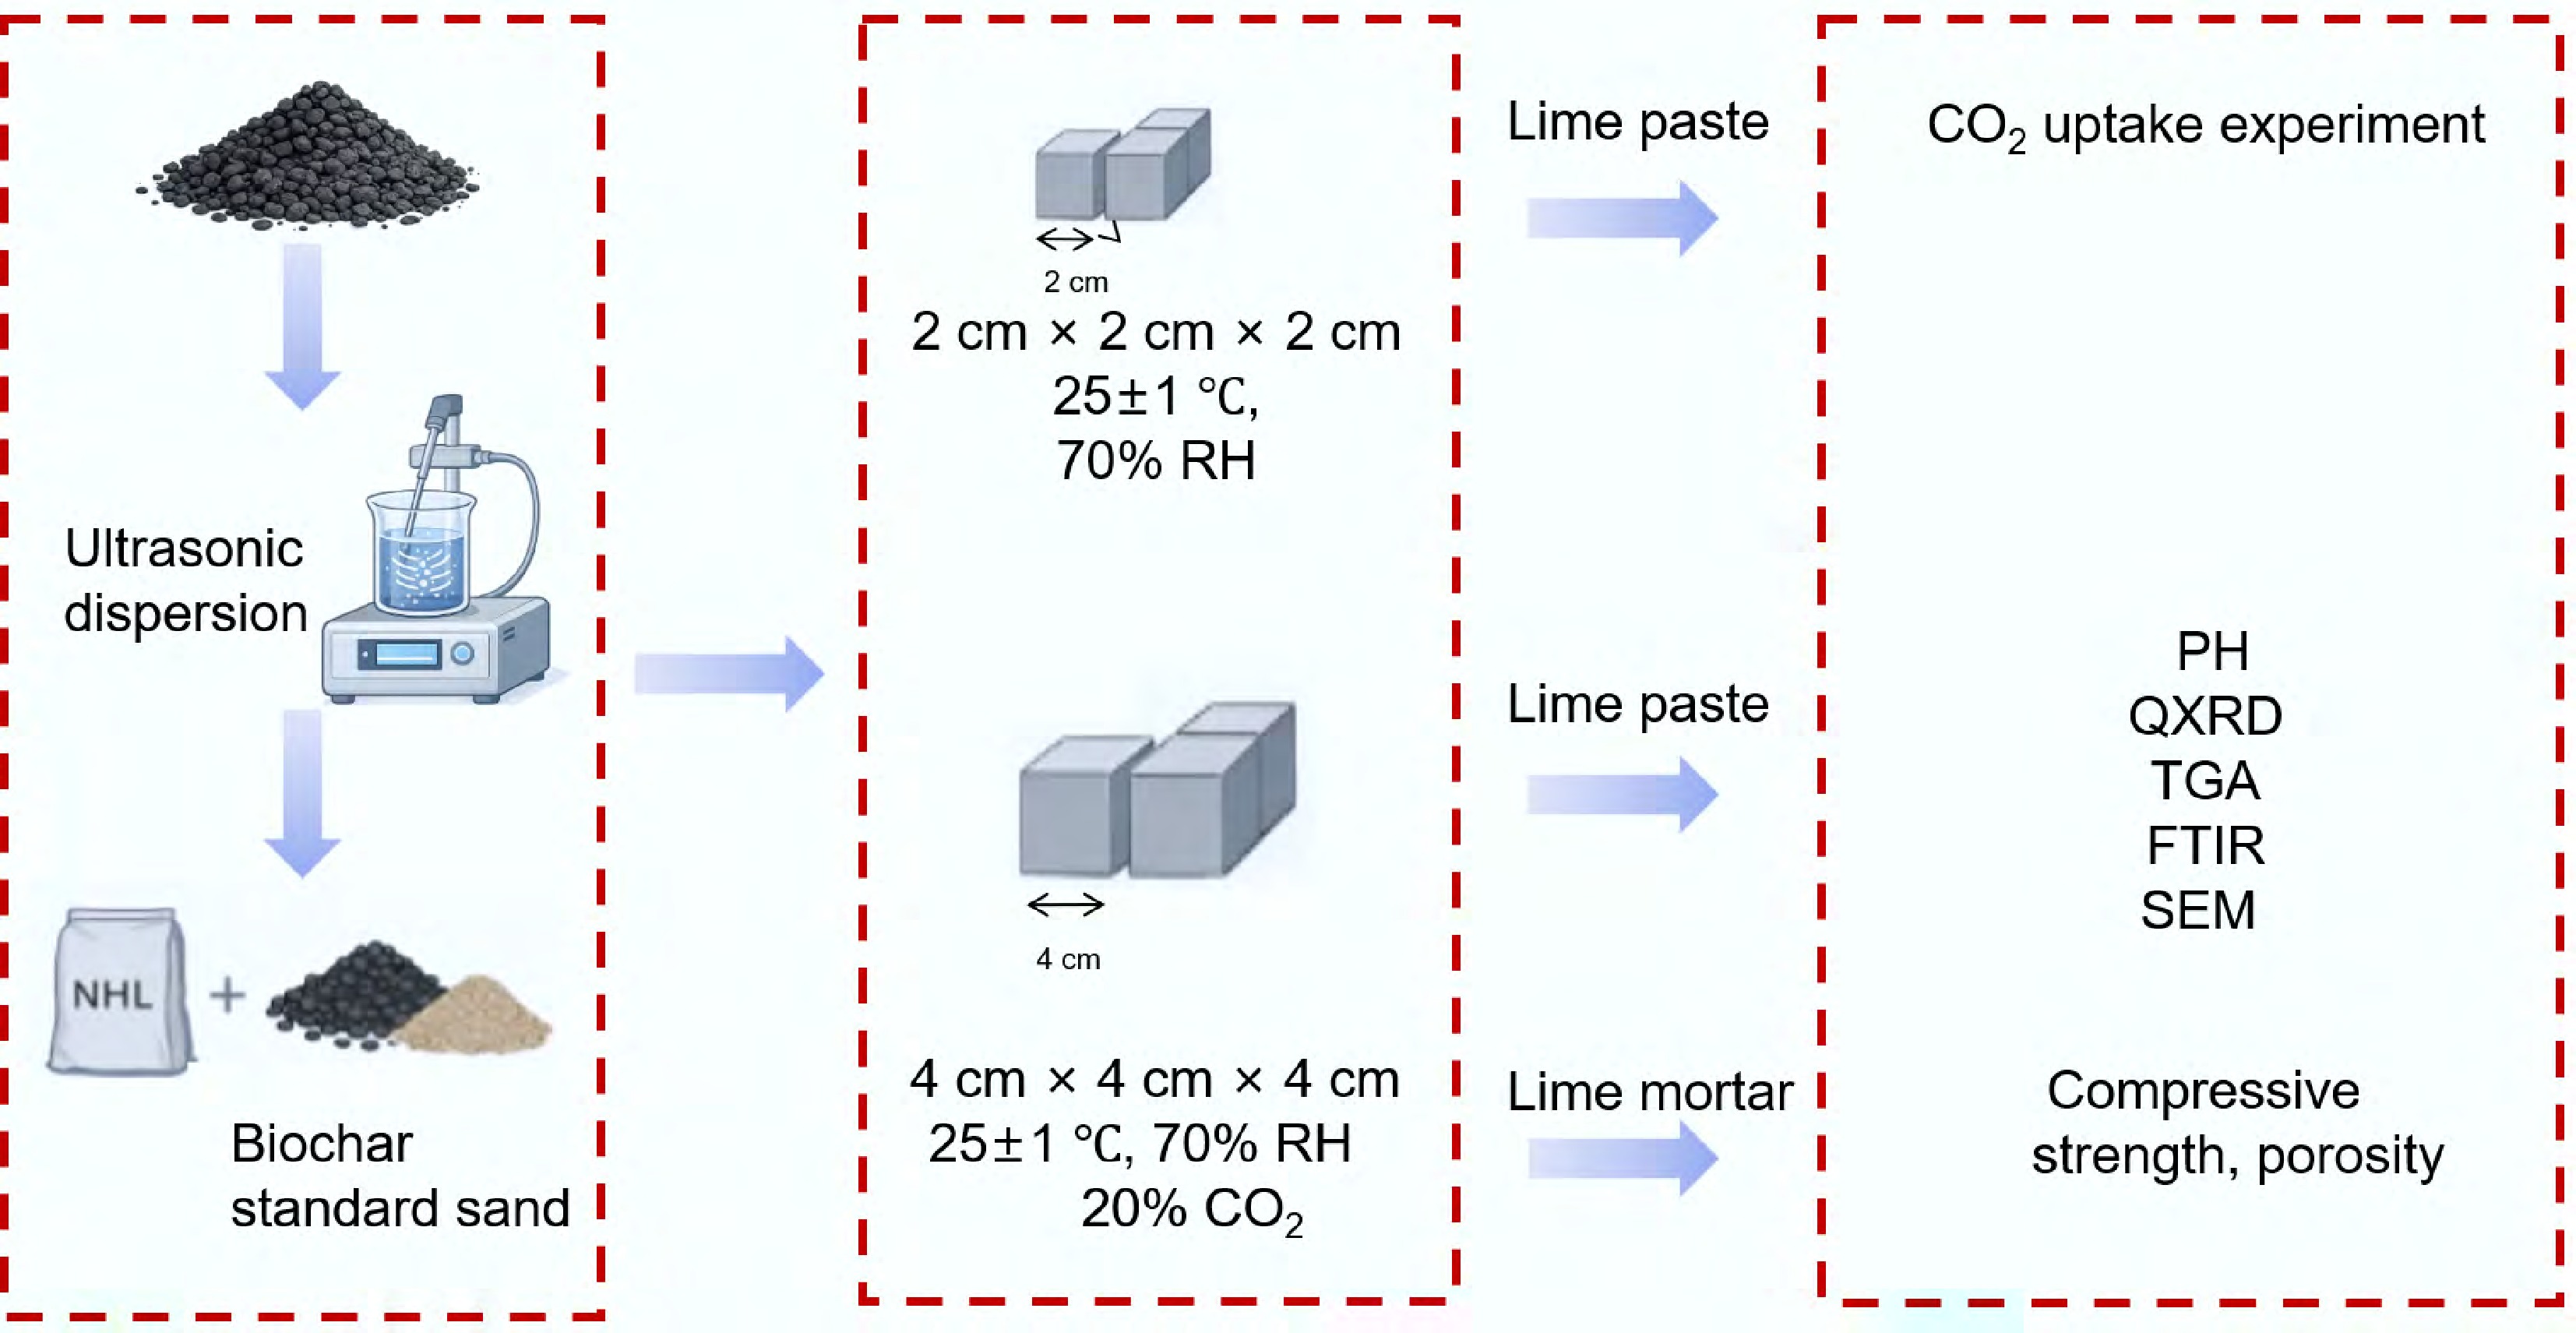
Figure 2.
Experimental preparation process.
-
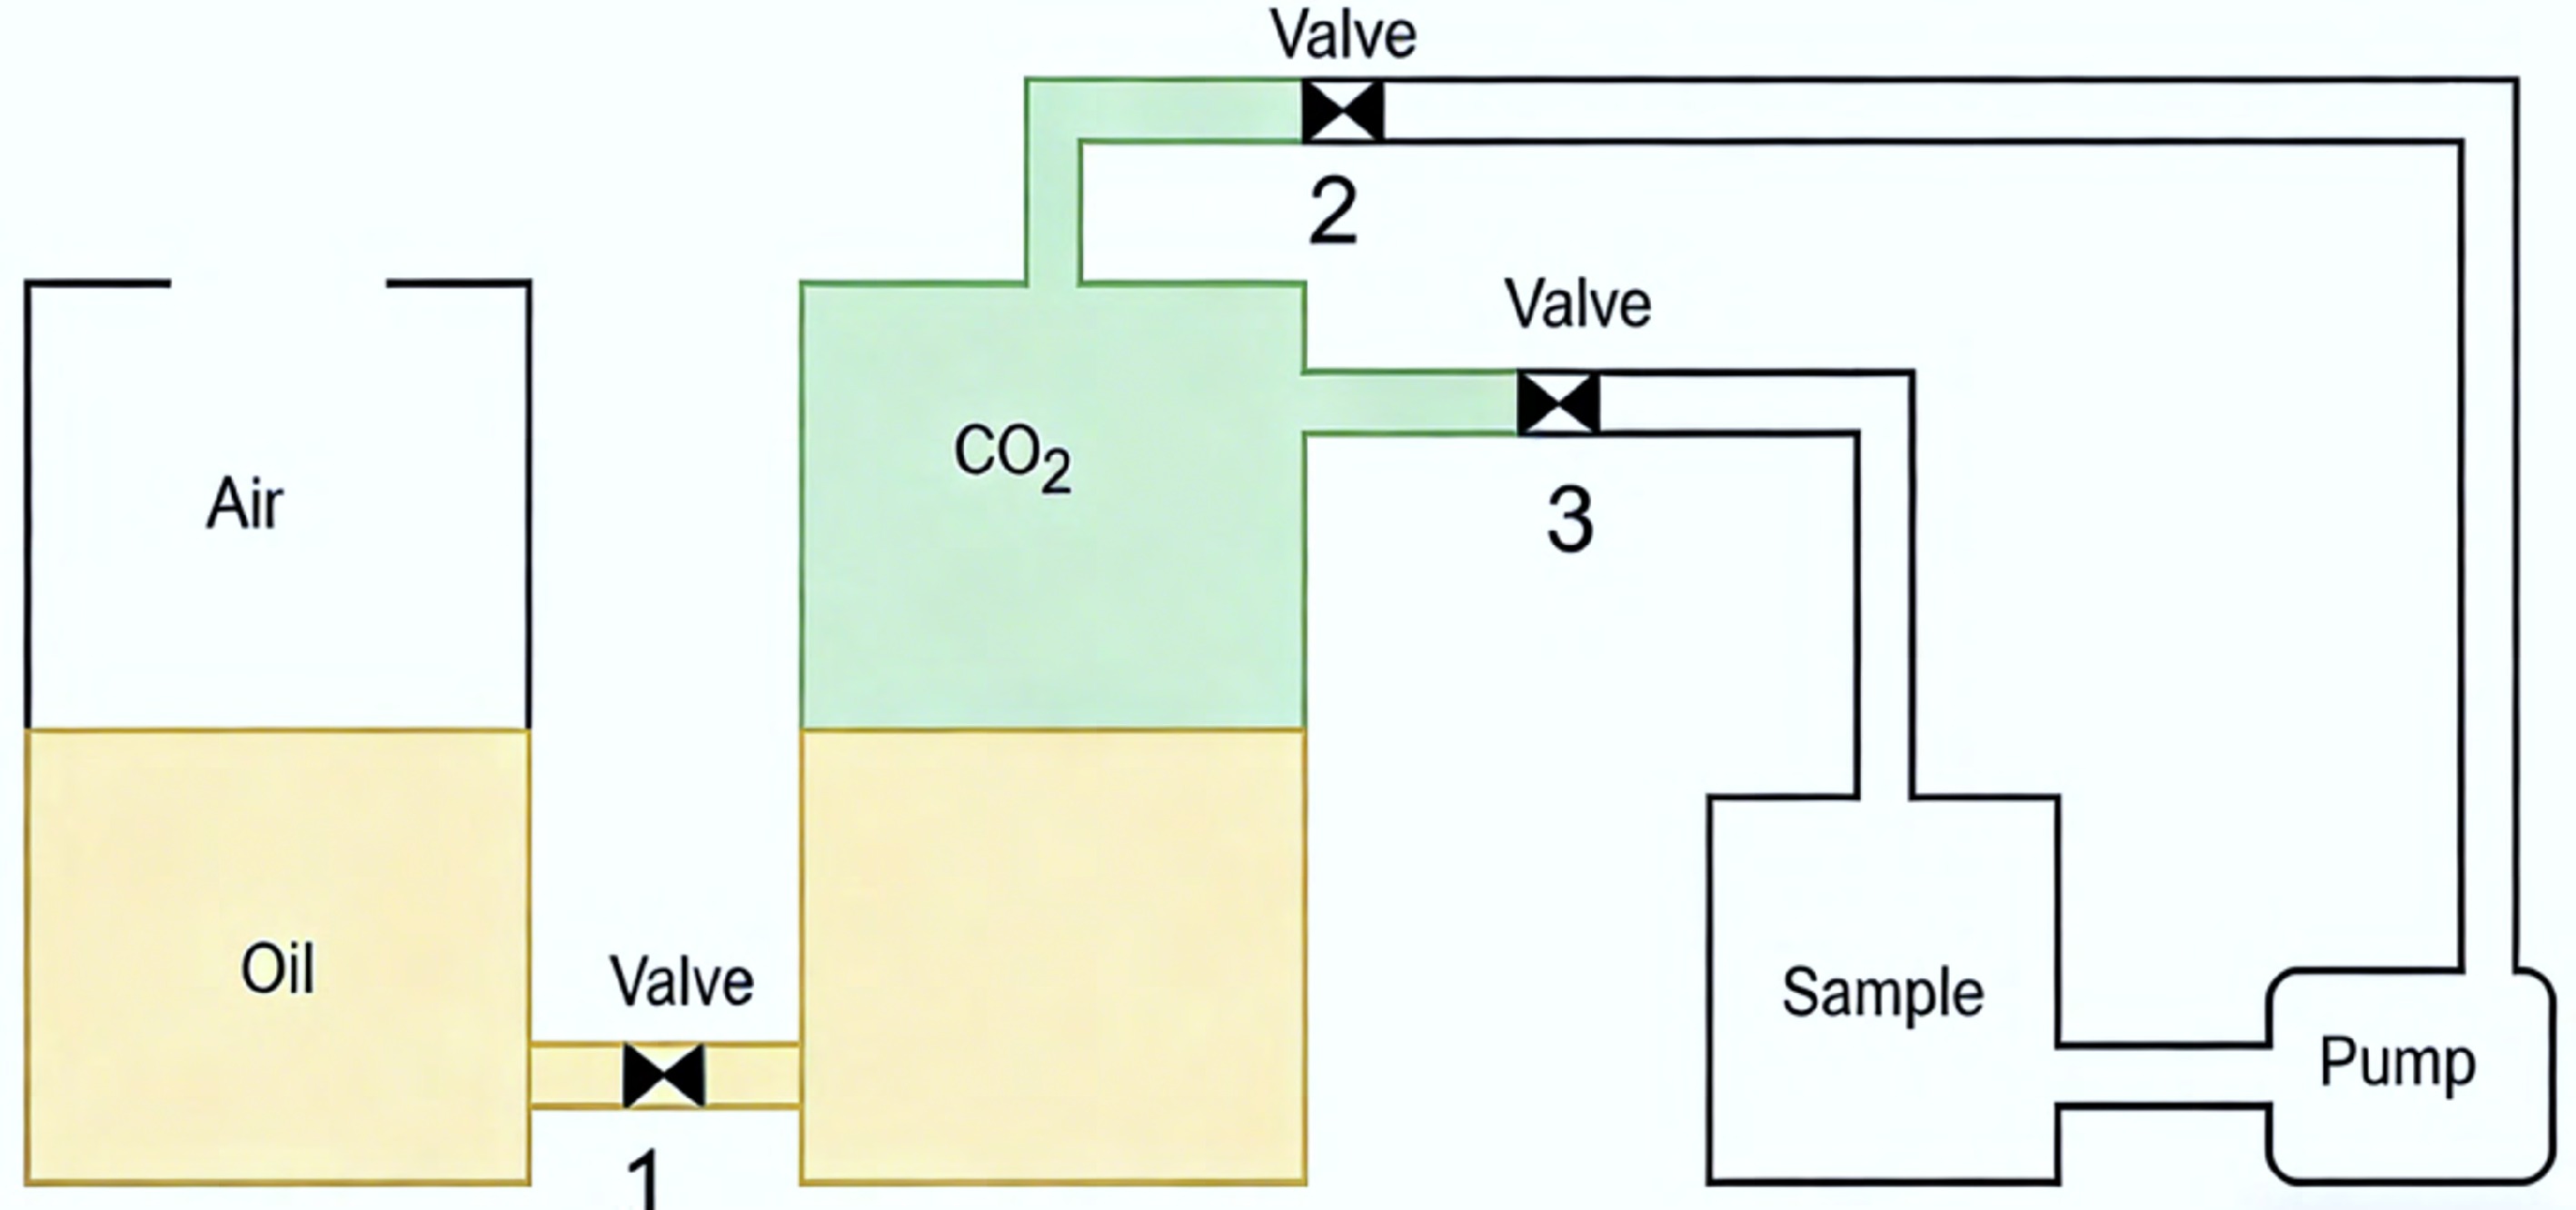
Figure 3.
Schematic diagram of the CO2 uptake evaluation apparatus.
-
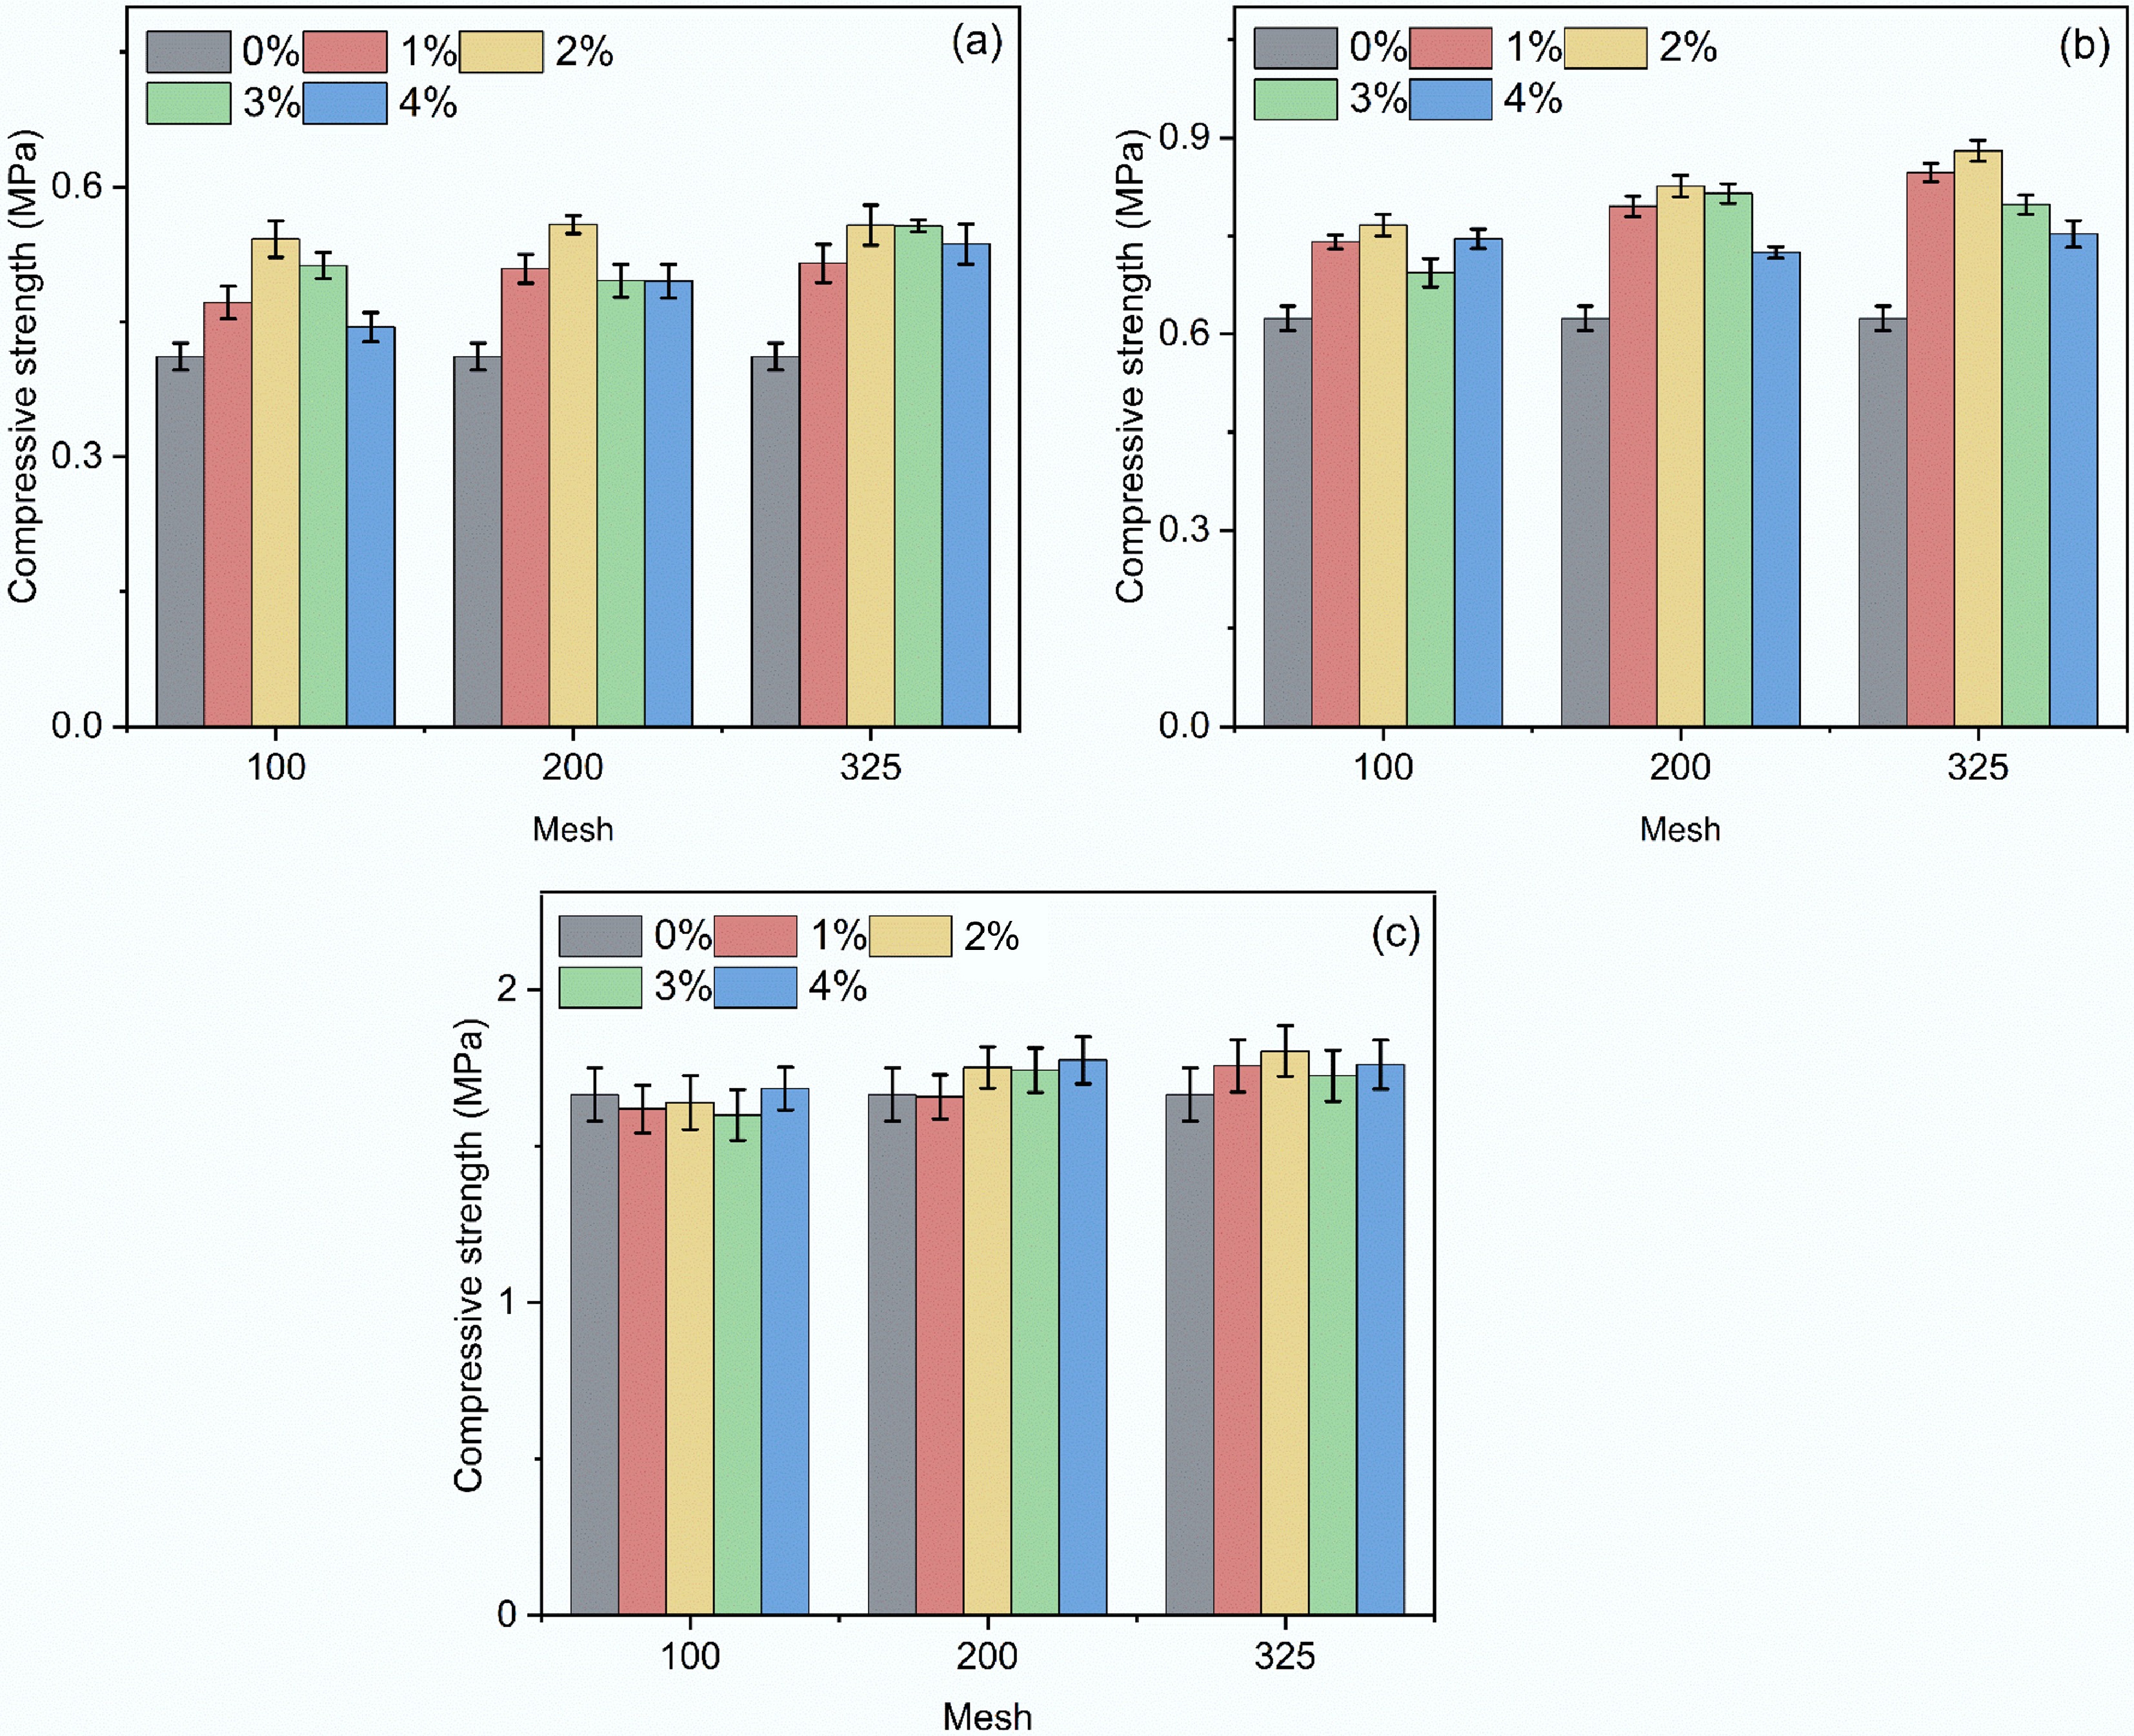
Figure 4.
Compressive strength of biochar-modified NHL composites: (a) 3 d; (b)7 d; (c) 28 d.
-
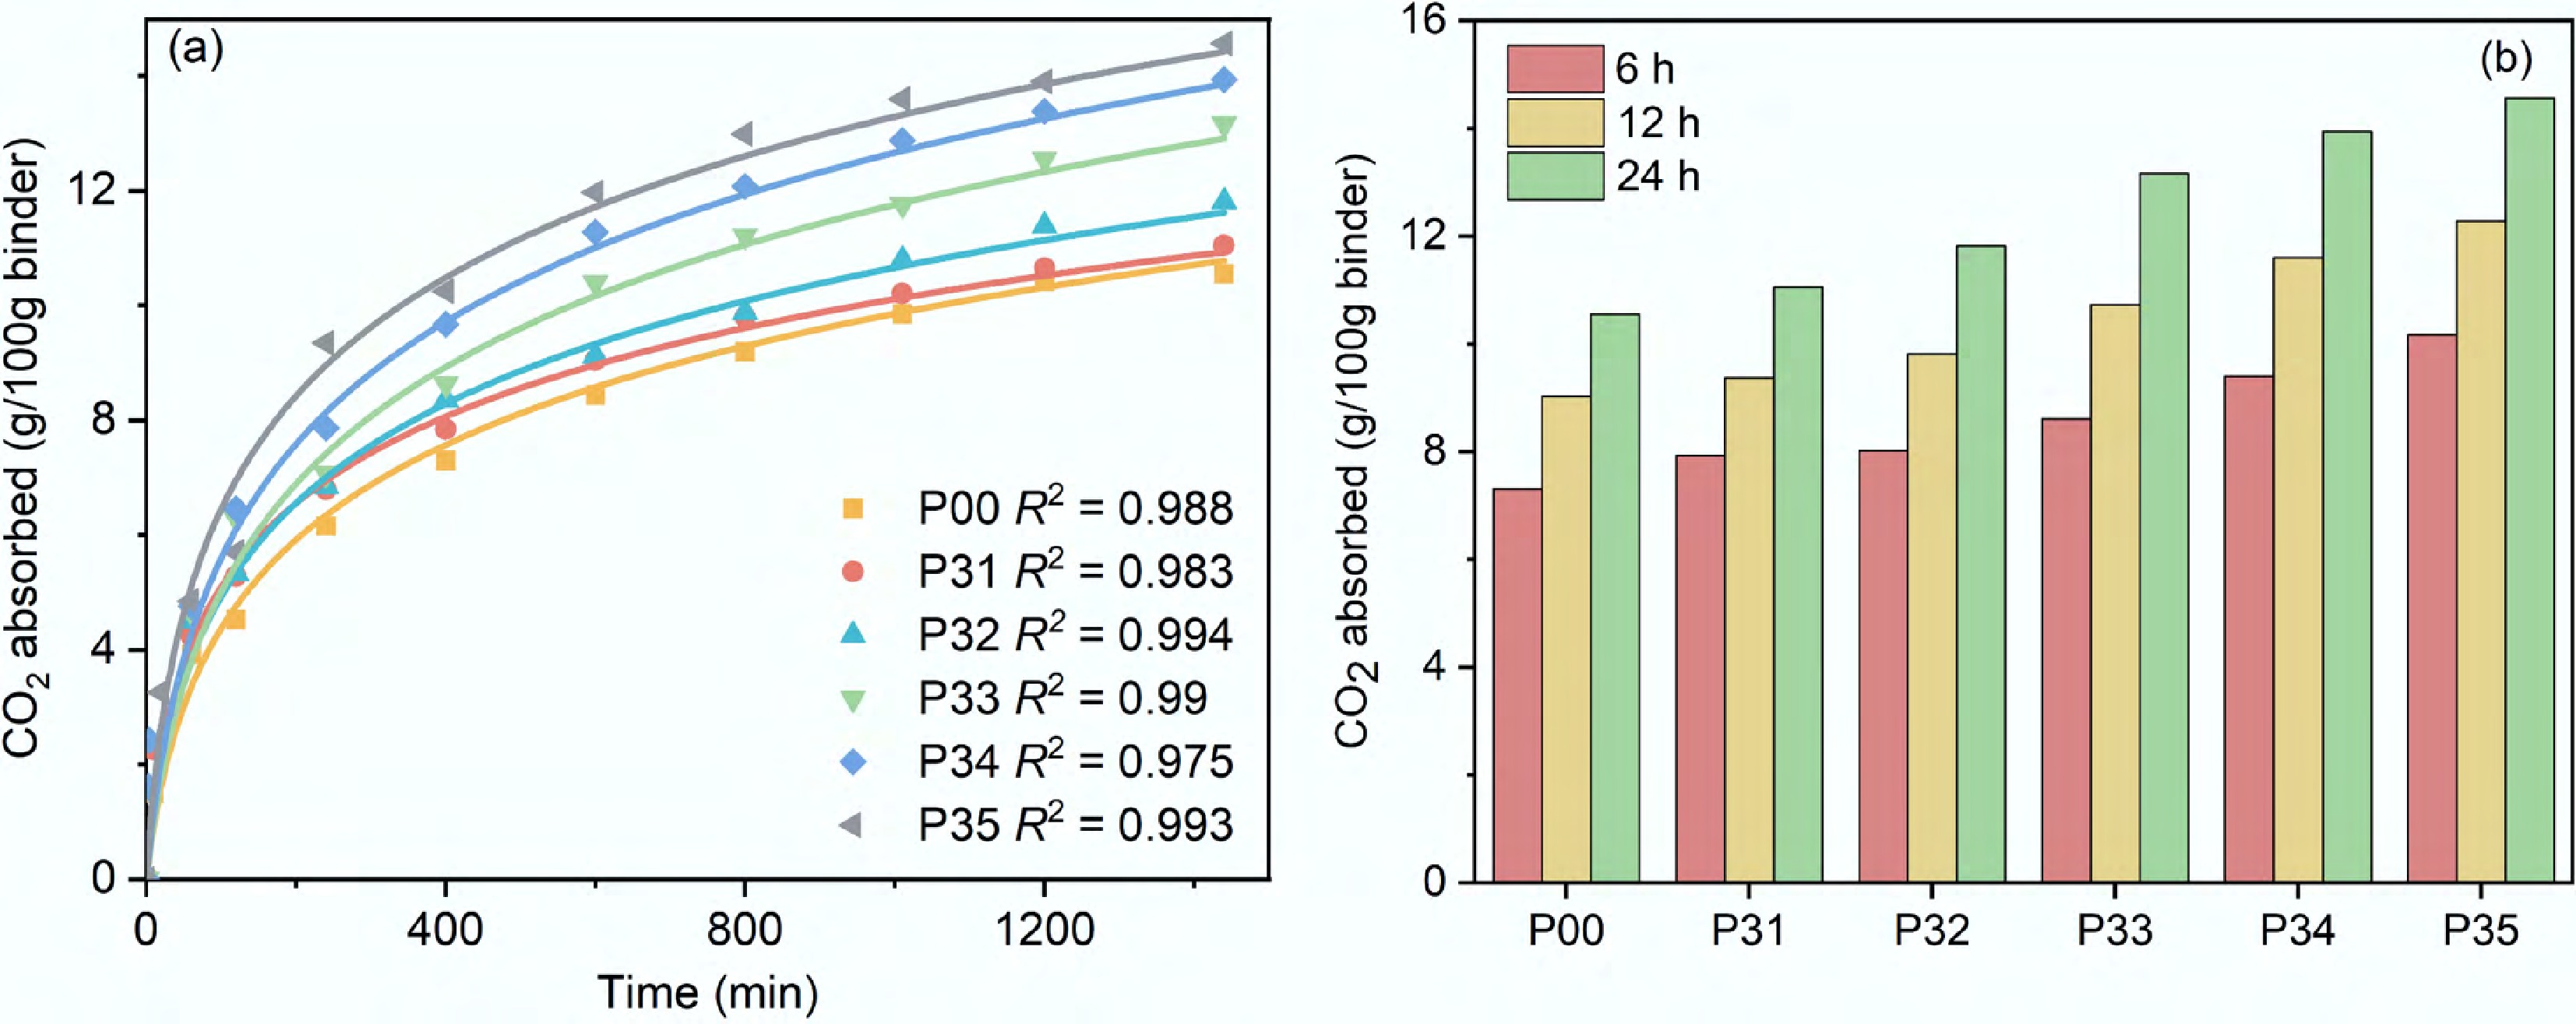
Figure 5.
Effect of biochar dosage on the CO2 uptake performance of the specimens: (a) carbonation kinetics; (b) CO2 uptake.
-
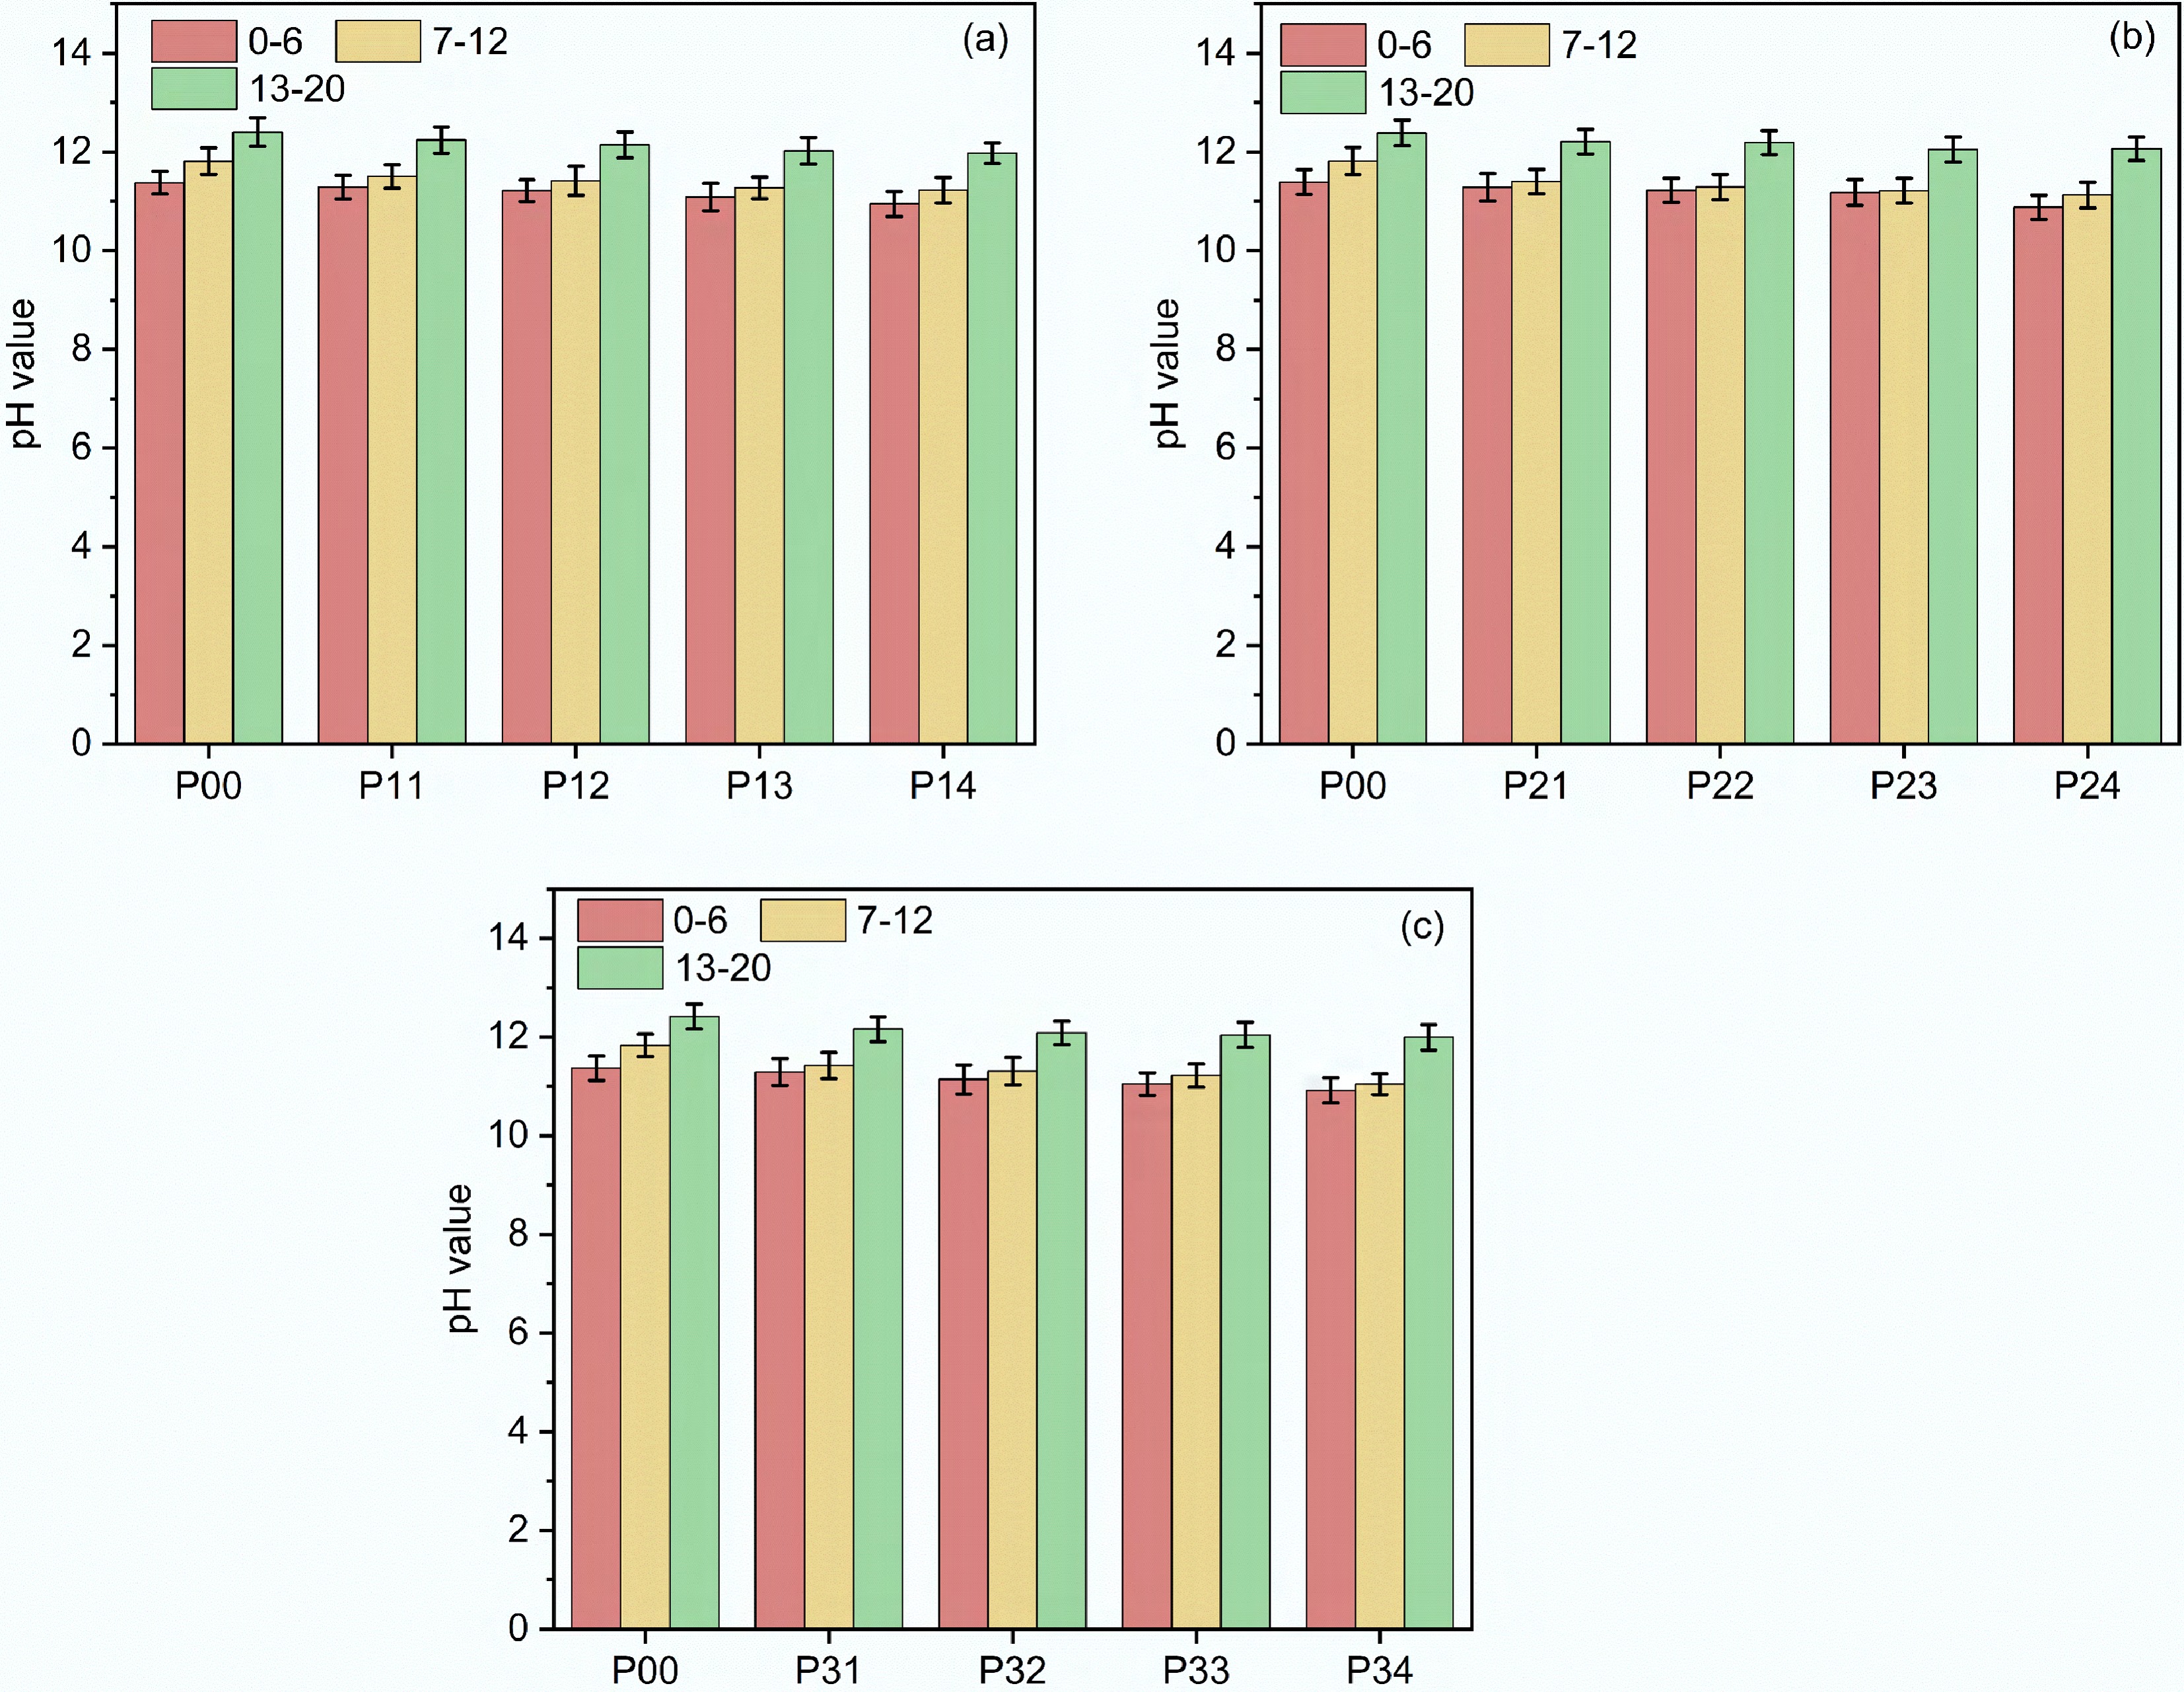
Figure 6.
Effect of biochar particle size and dosage on the pH value of the specimens: (a) 100 mesh; (b) 200 mesh; (c) 325 mesh.
-
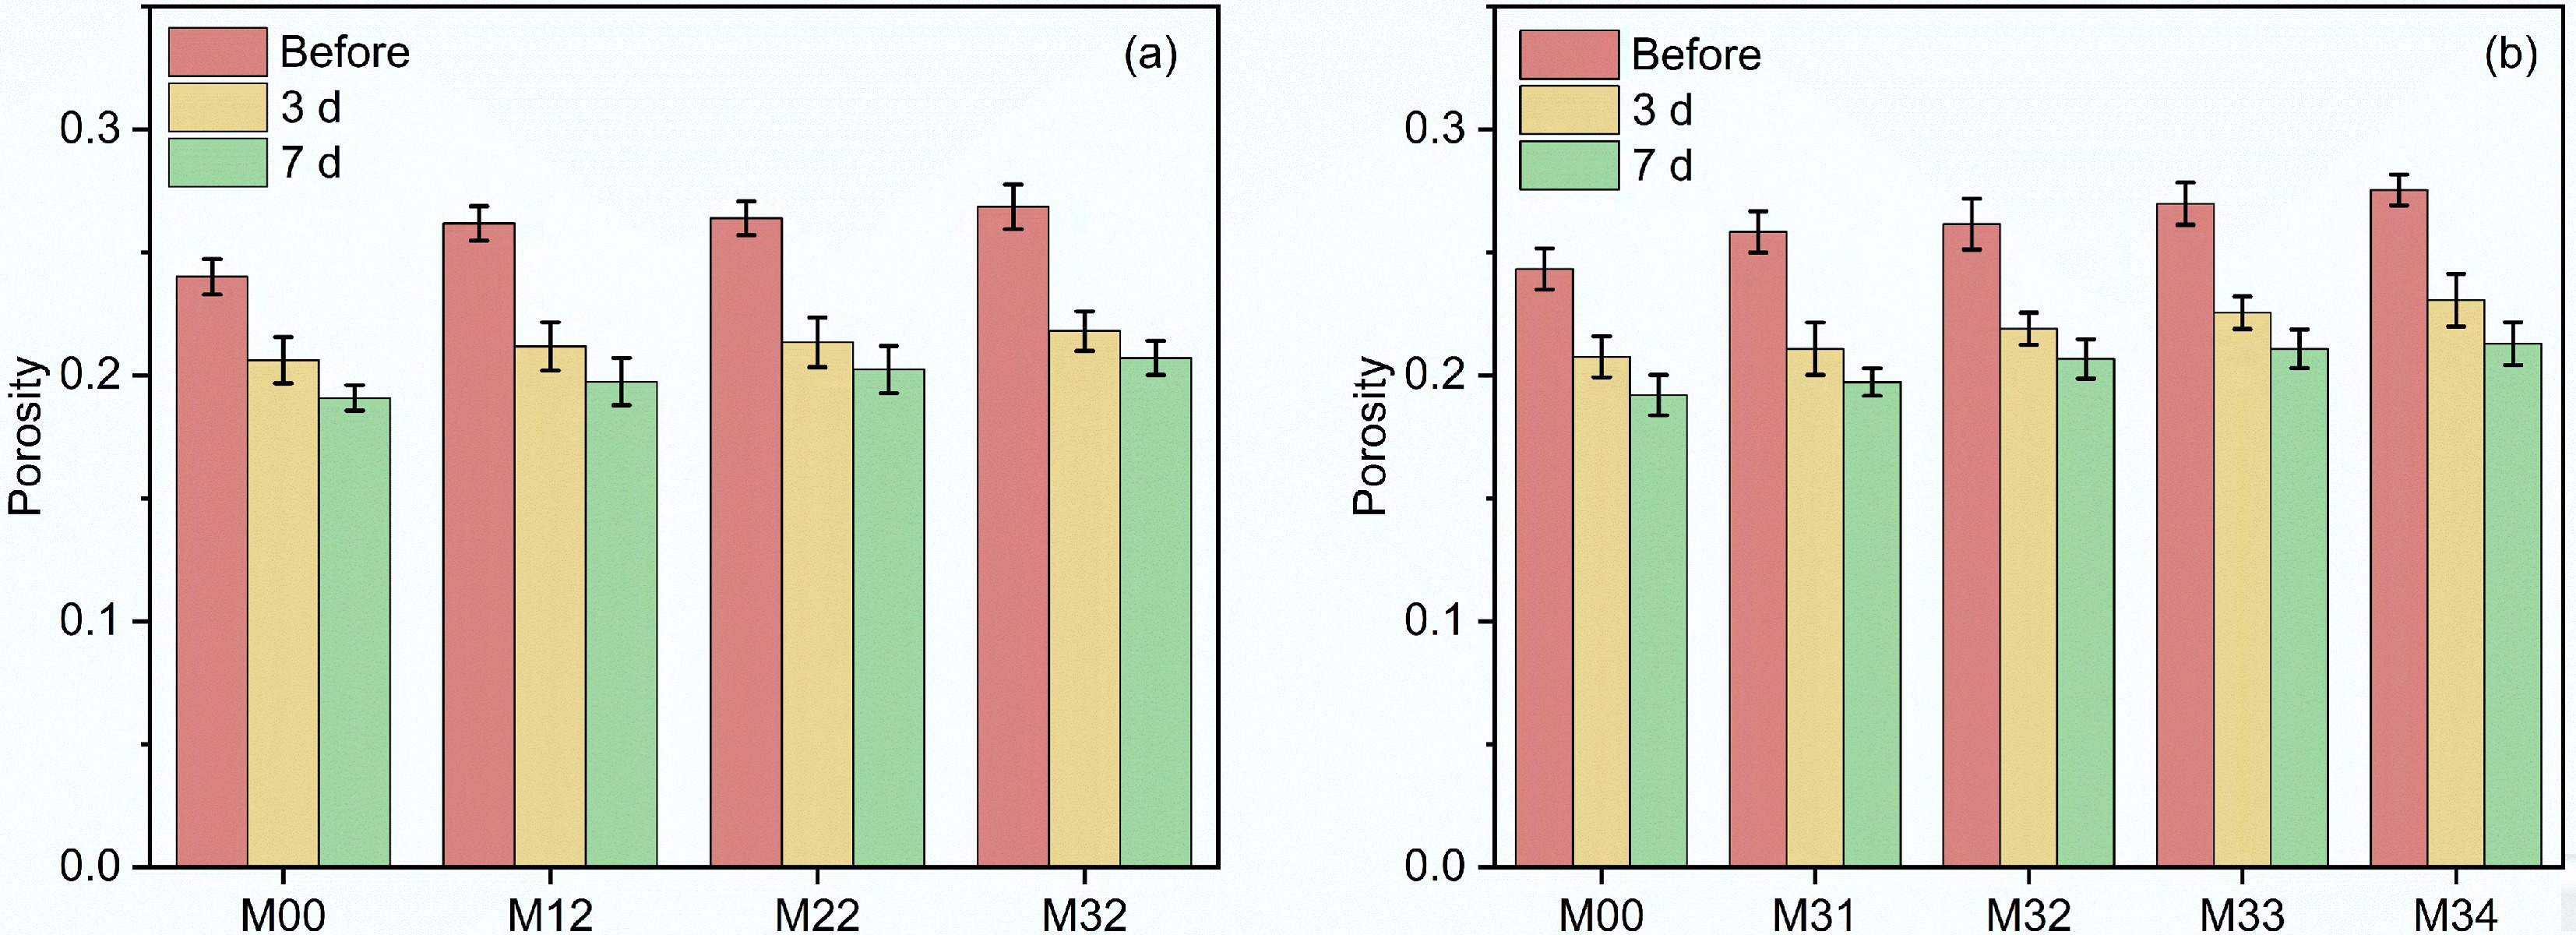
Figure 7.
Porosity of biochar-modified NHL composites: (a) effect of biochar particle size on porosity; (b) effect of biochar dosage on porosity.
-
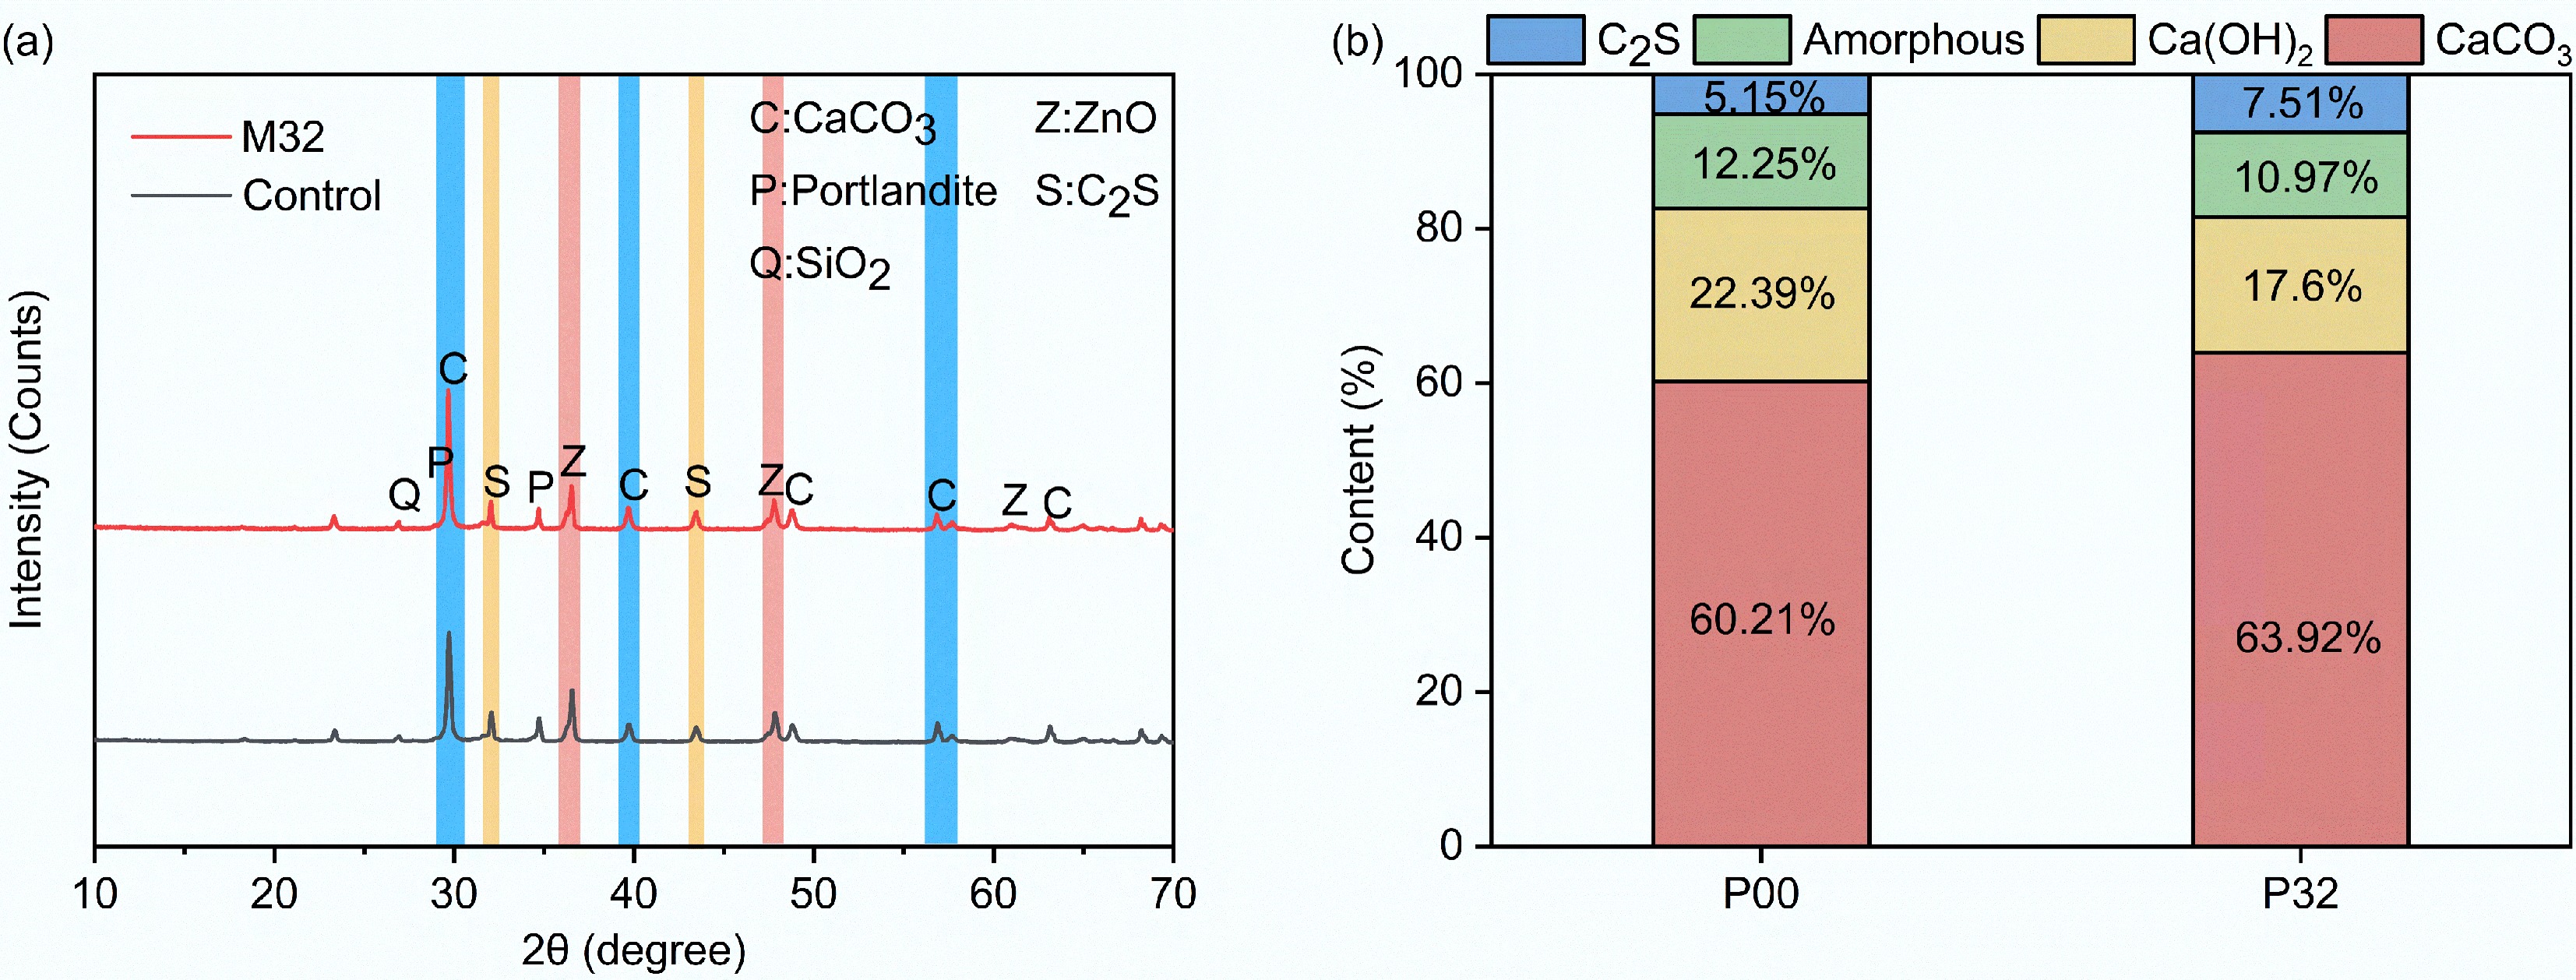
Figure 8.
XRD patterns of biochar-modified NHL composites: (a) XRD patterns; (b) phase assemblage diagram.
-
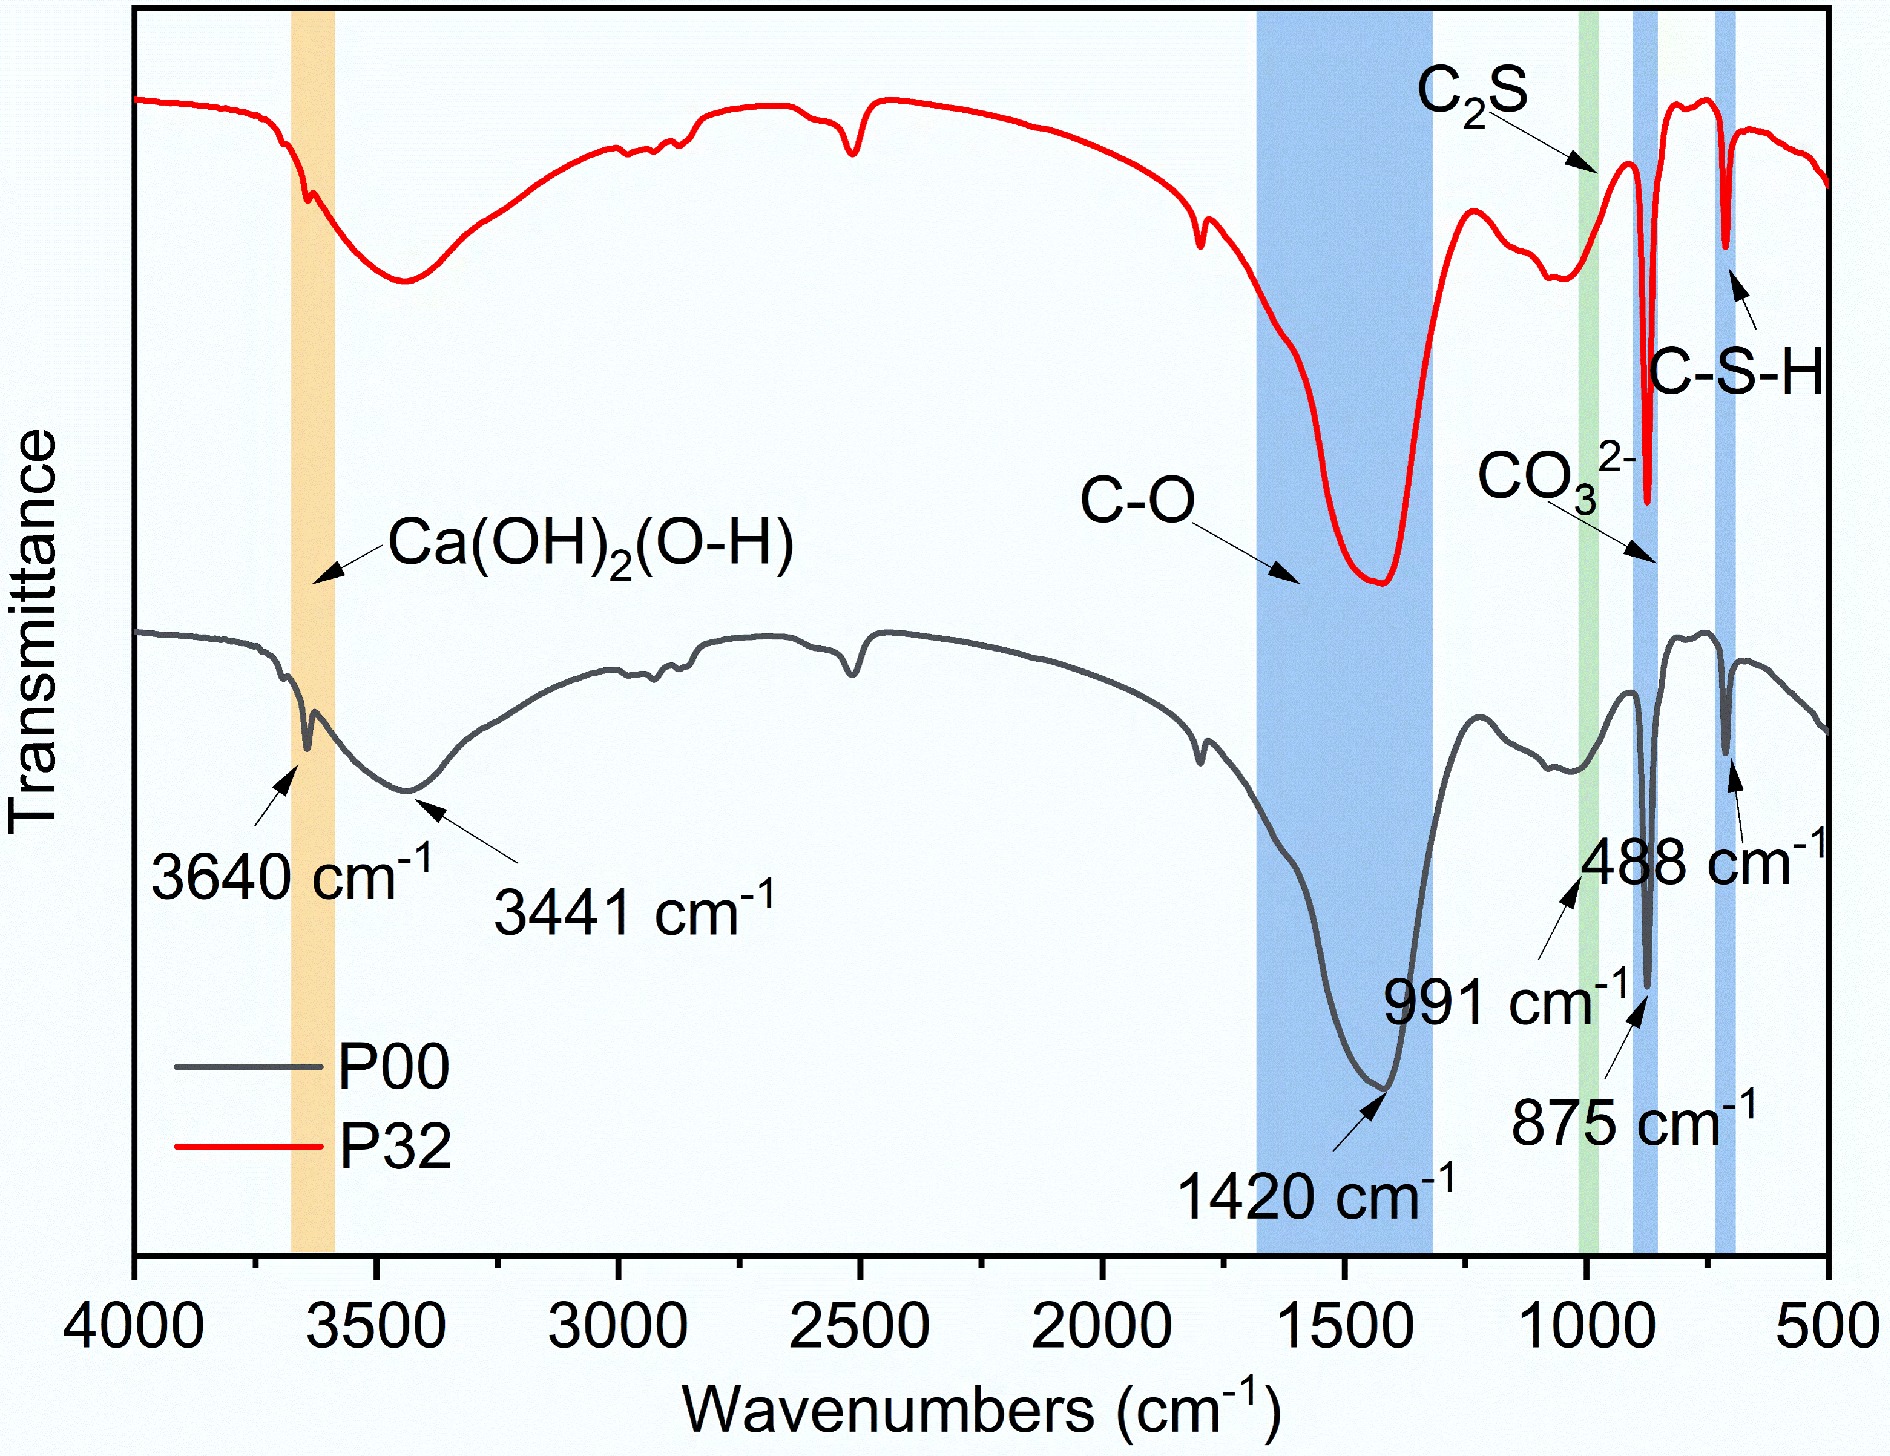
Figure 9.
FTIR spectra of biochar-modified NHL composites.
-
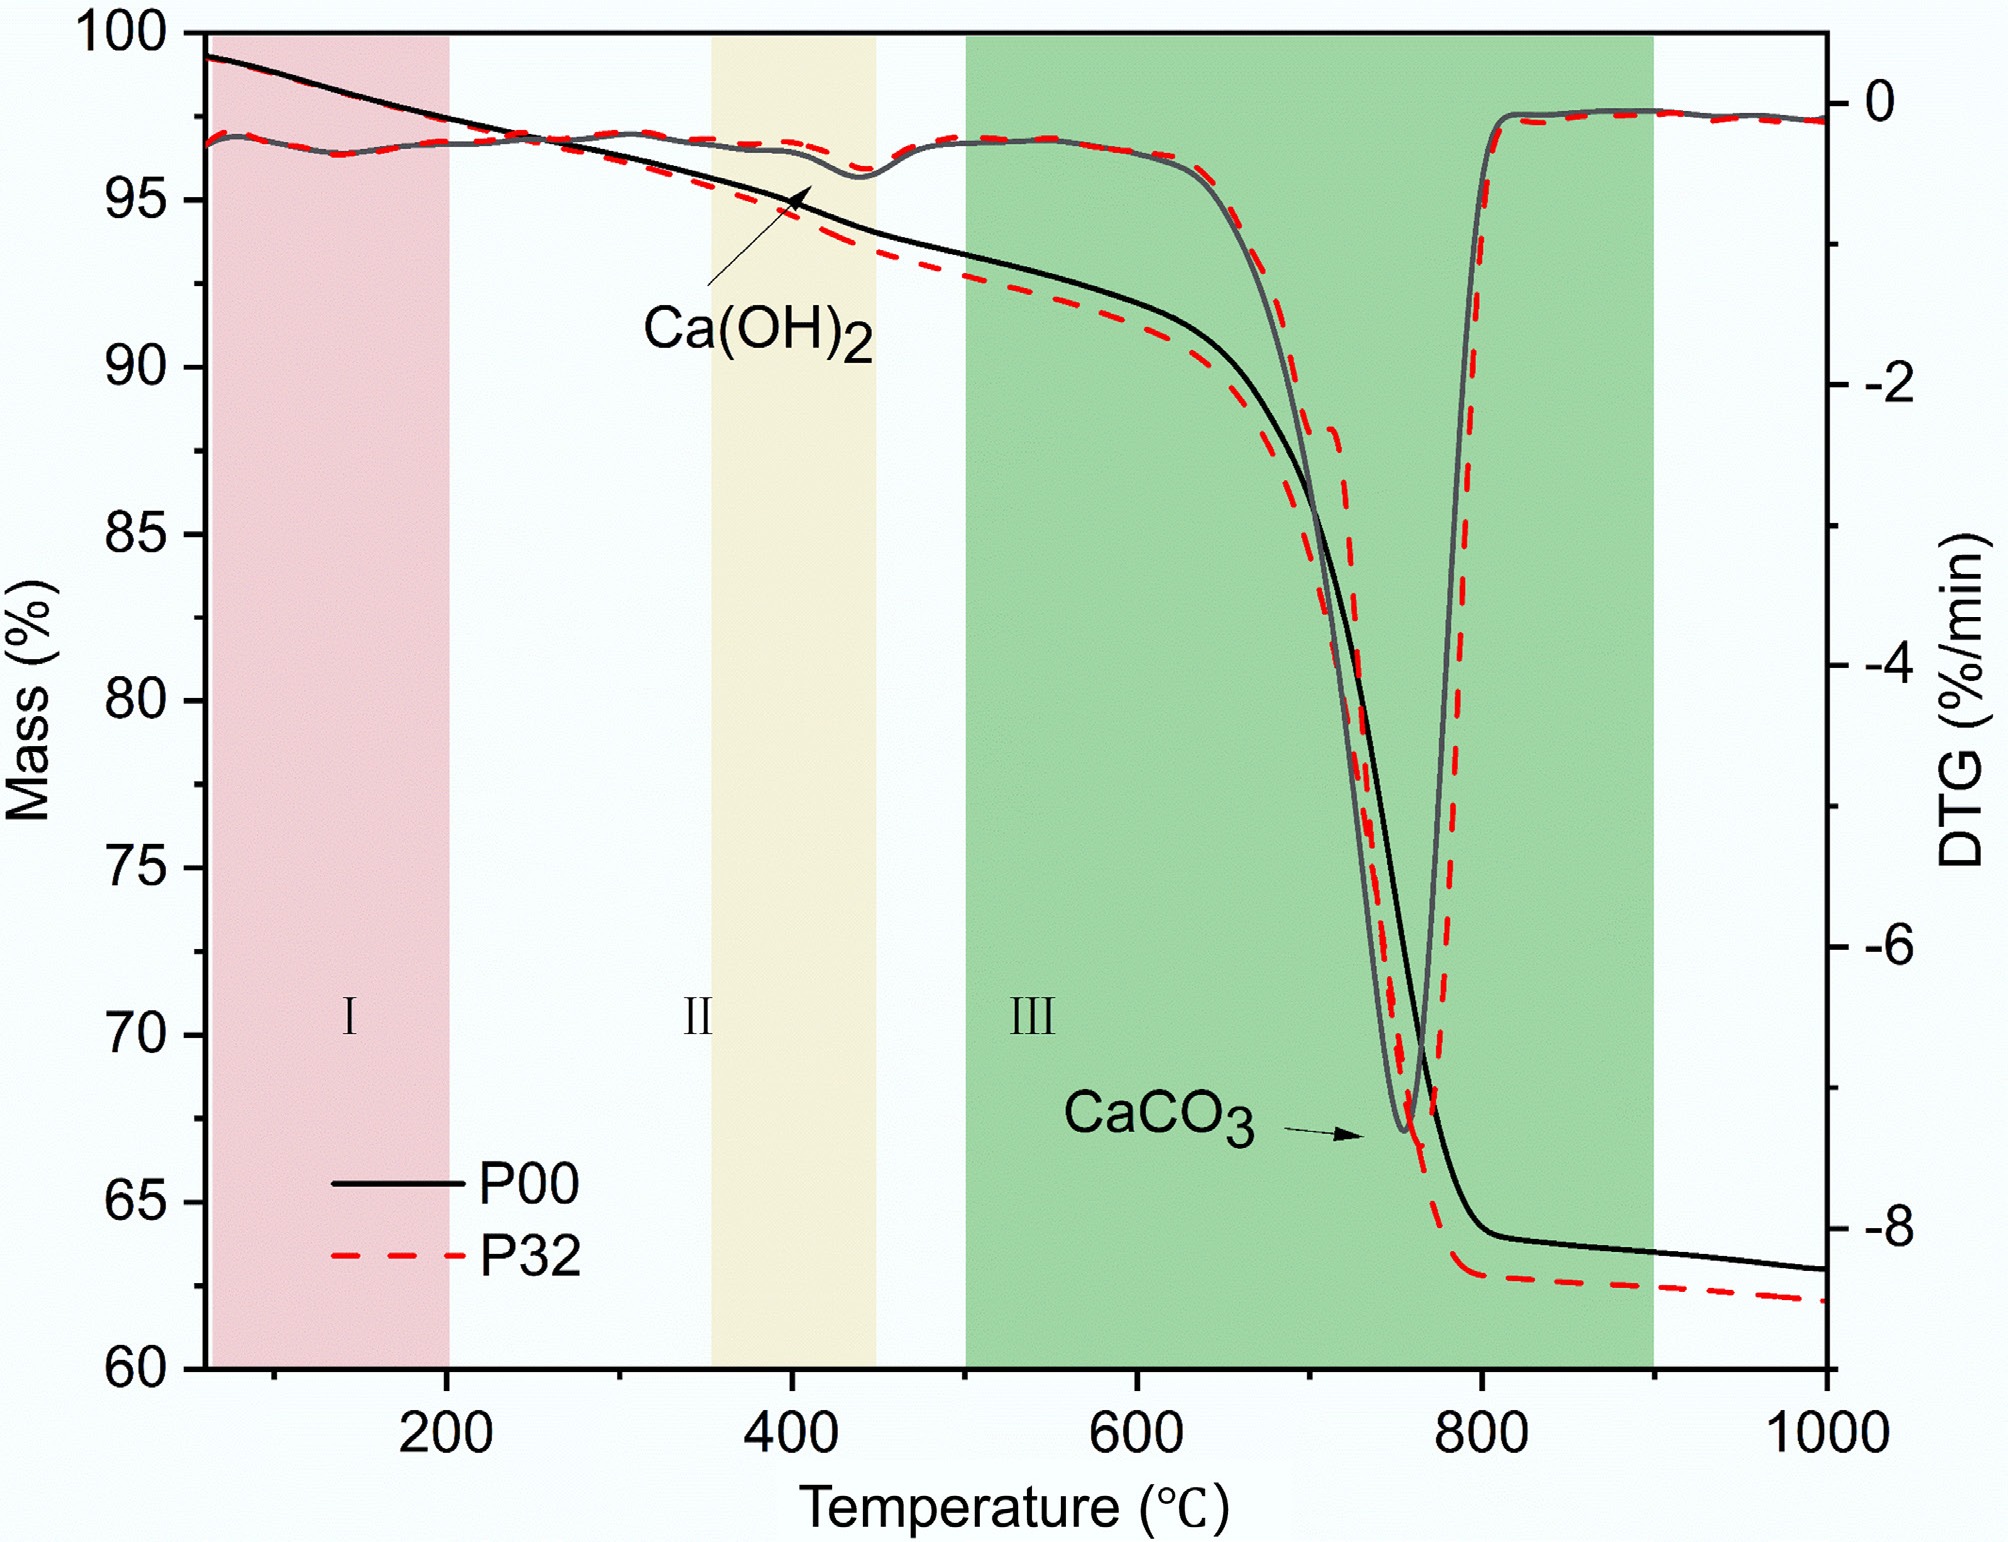
Figure 10.
TG-DTG curves of biochar-modified NHL composites.
-
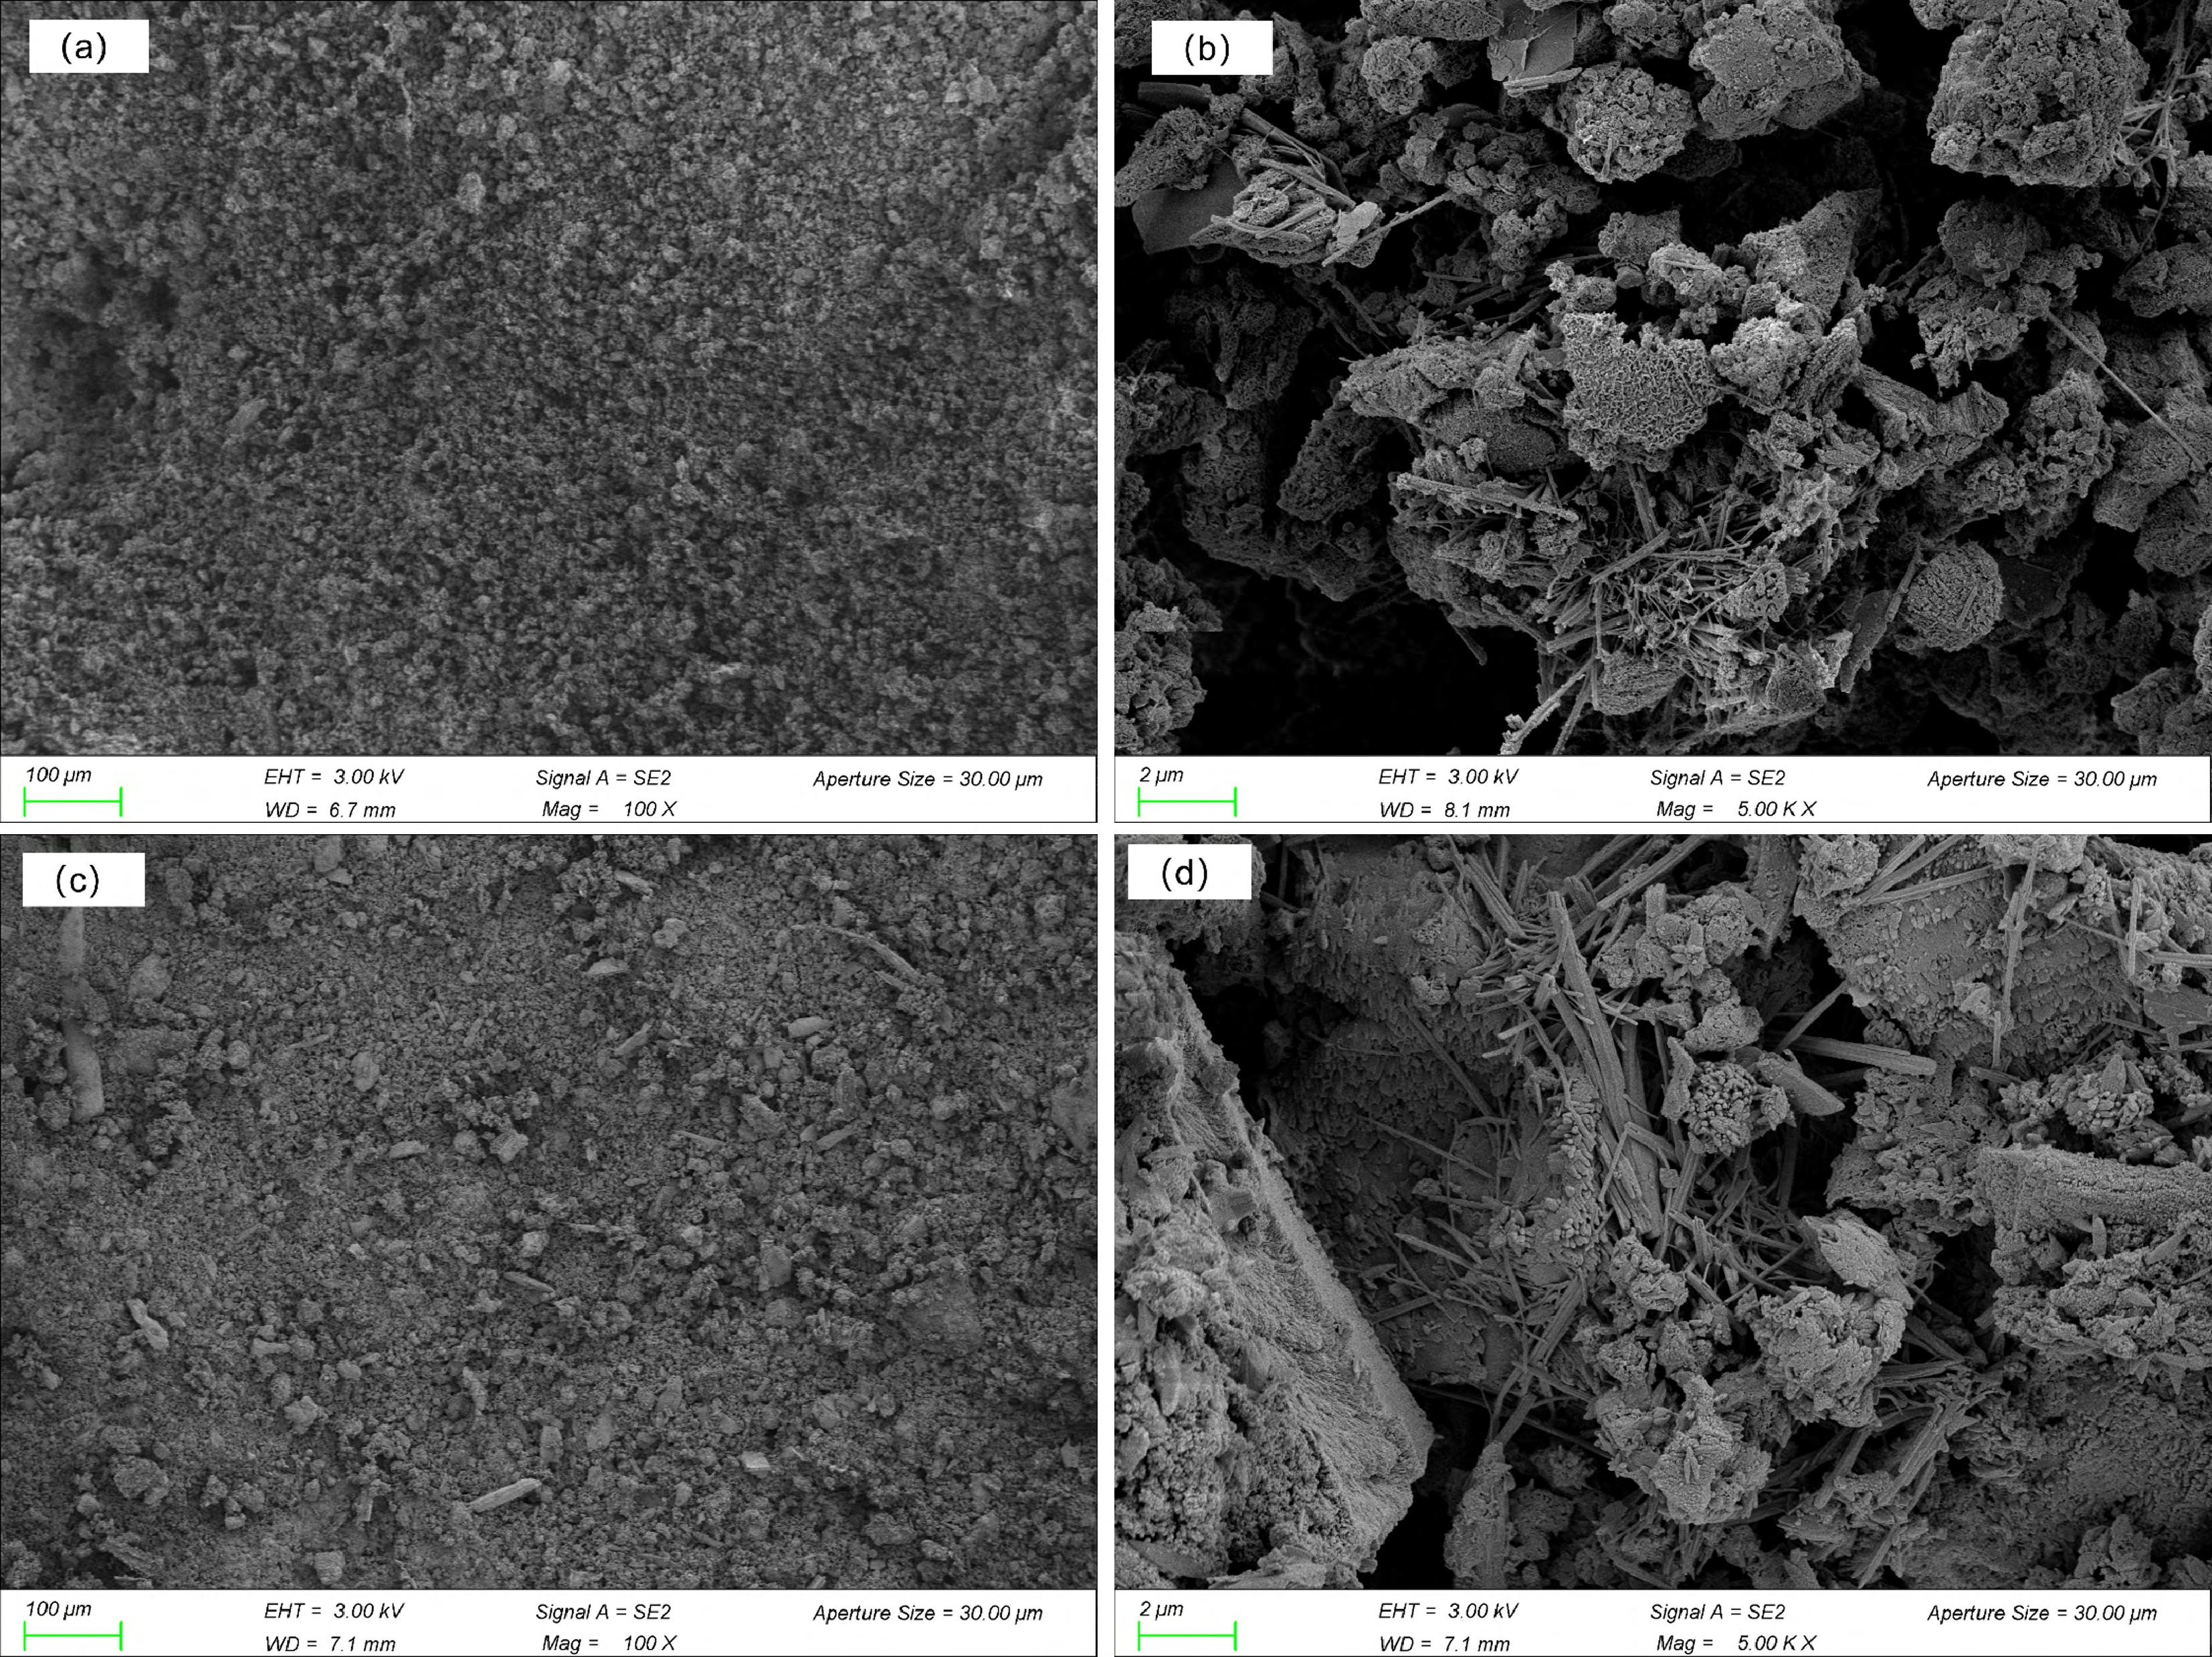
Figure 11.
SEM images of biochar-modified NHL composites: (a) P00 ×100; (b) P00 × 5,000; (c) P32 × 100; and (d) P32 × 5,000.
-
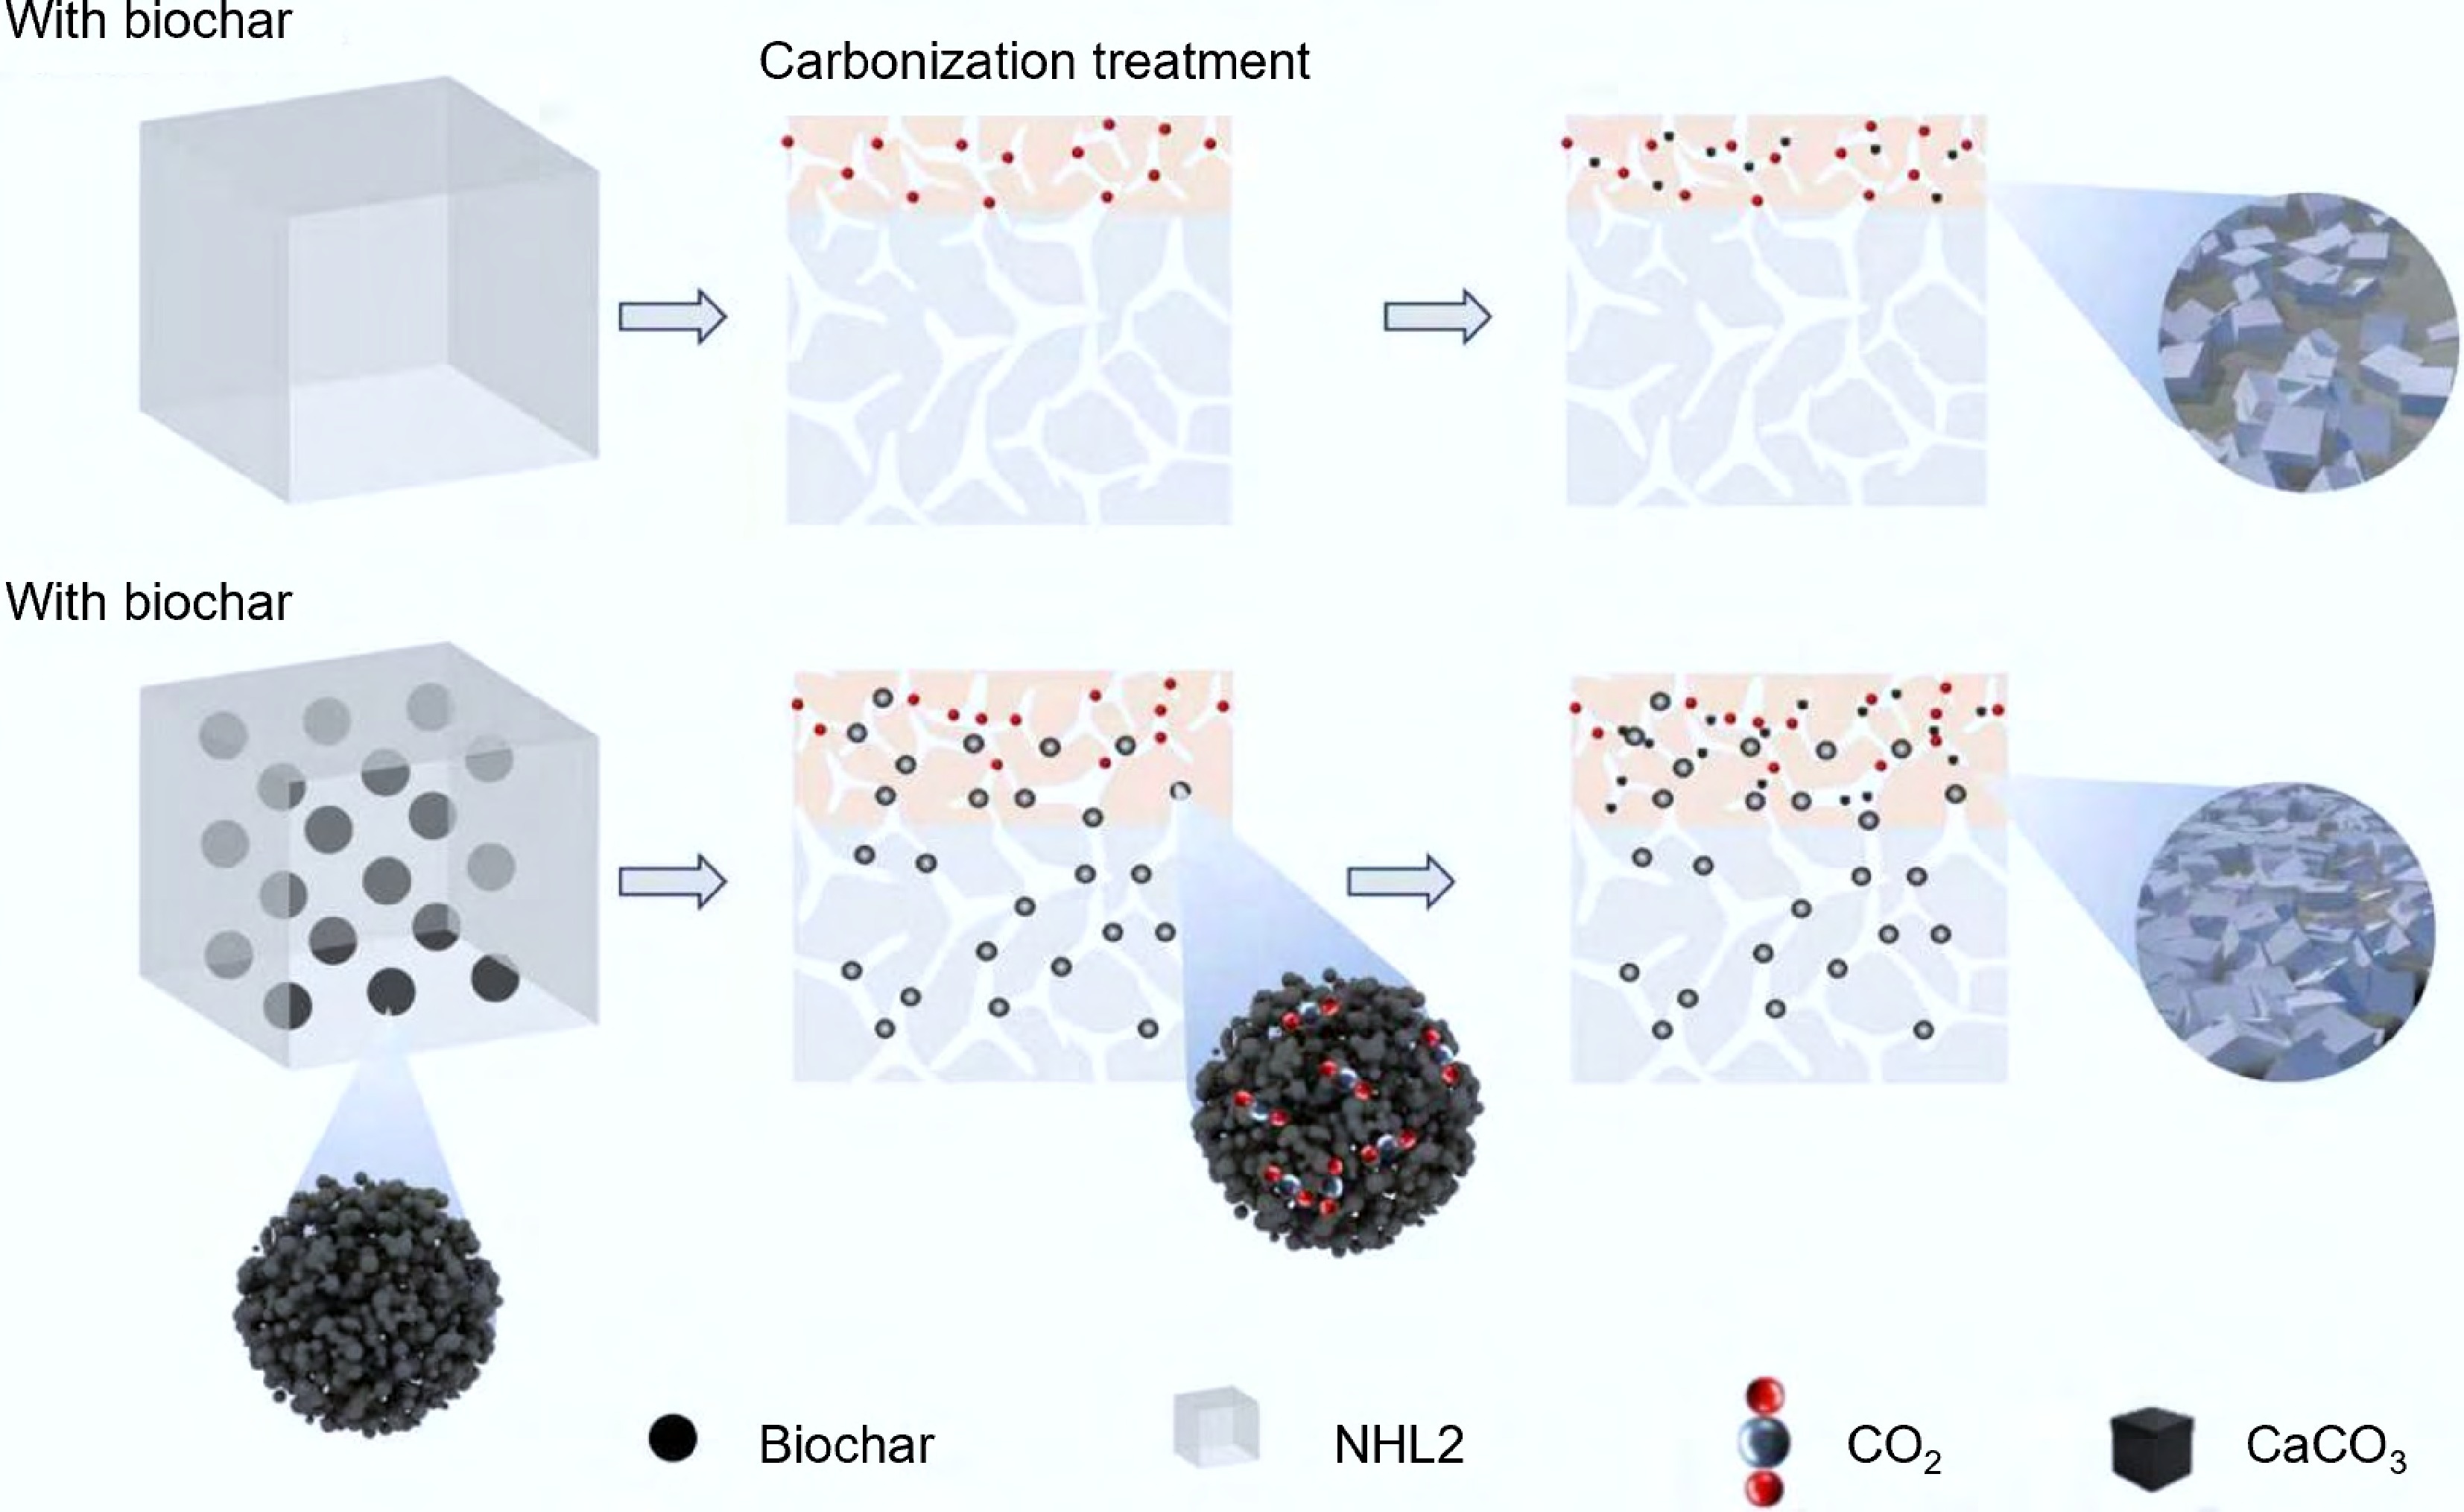
Figure 12.
Schematic diagram of the mechanism of biochar on the CO2 uptake behavior of NHL.
-
ID Mesh Biochar (g) NHL2 (g) W/B P00 − − 100 0.6 P11 100 1 99 0.6 P12 100 2 98 0.6 P13 100 3 97 0.6 P14 100 4 96 0.6 P21 200 1 99 0.6 P22 200 2 98 0.6 P23 200 3 97 0.6 P24 200 4 96 0.6 P31 325 1 99 0.6 P32 325 2 98 0.6 P33 325 3 97 0.6 P34 325 4 96 0.6 P35 325 5 95 0.6 Table 1.
Mix proportions of biochar-modified NHL paste mixtures
-
ID Mesh Biochar (g) NHL2 (g) Sand (g) W/B M00 − − 100 300 0.6 M11 100 1 99 300 0.6 M12 100 2 98 300 0.6 M13 100 3 97 300 0.6 M14 100 4 96 300 0.6 M21 200 1 99 300 0.6 M22 200 2 98 300 0.6 M23 200 3 97 300 0.6 M24 200 4 96 300 0.6 M31 325 1 99 300 0.6 M32 325 2 98 300 0.6 M33 325 3 97 300 0.6 M34 325 4 96 300 0.6 Table 2.
Mix proportions of biochar-modified NHL mortar specimens
-
ID A B R2 P00 0.115 2.584 0.988 P31 0.191 2.278 0.983 P32 0.142 2.667 0.994 P33 0.121 3.226 0.991 P34 0.146 3.344 0.975 Table 3.
Fitted parameters of carbonation kinetics for the specimens
-
ID II mass
loss (%)Ca(OH)2
content (%)III mass
loss (%)CaCO3
content (%)P00 1.2 4.9 29.9 67.8 P32 1.5 6.1 30.2 68.7 Table 4.
Mineral composition calculated from TG analysis (%)
Figures
(12)
Tables
(4)