


-
Carbon capture, utilization, and storage (CCUS) is an important technological pathway for mitigating climate change[1,2] and has gradually become a driving force for the low-carbon development of building materials. Beyond meeting mechanical performance, durability, and adaptability requirements, the carbon sequestration capacity of building materials has also become a key indicator of their sustainability. Although cement-based materials exhibit good mechanical performance, their production is associated with high carbon emissions, and carbonation reactions may induce performance deterioration[3−6], which limits their application in the conservation and restoration of historic buildings.
Natural hydraulic lime (NHL) has attracted increasing attention in recent years due to its favorable CO2 uptake capacity and high compatibility with historic building materials[7,8]. NHL mainly consists of C2S and Ca(OH)2 and is typically produced at temperatures ranging from 800 to 1,200 °C[9−11]. According to the European standard[12], NHL is classified into NHL2, NHL3.5, and NHL5 based on the 28-d compressive strength of NHL mortars. During carbonation, NHL absorbs atmospheric CO2 and converts it into a stable calcite structure[13−15], thereby simultaneously enhancing the material's mechanical strength and durability while contributing to carbon sequestration. Studies have shown that lime-based materials exhibit low carbon emissions during production and strong environmental compatibility, making them an ideal choice for sustainable building materials.
In recent years, NHL has received considerable attention because of its excellent performance in the field of heritage conservation. Barr et al.[16] comparatively investigated the bonding performance of NHL mortars and cement mortars in masonry structures. The results showed that the bonding strength between masonry units was positively correlated with the degree of binder hydration. Silva et al.[17] explored the effect of incorporating NHL into air lime mortars. Their study showed that as NHL content increased, mortar porosity gradually decreased, while water absorption and moisture evaporation rates decreased correspondingly. Such blended mortars are therefore more suitable for the repair of historic buildings. Lanas et al.[18] systematically investigated the mechanical properties of NHL mortars, with particular emphasis on the effects of binder-to-aggregate ratio, aggregate characteristics, and pore structure on mortar performance. The results indicated that increasing the binder content and adopting properly graded aggregates could significantly improve mortar strength. In addition, the particle shape of the aggregate played a key role in microstructure development. Rounded aggregates tended to increase porosity and weaken the mechanical properties, whereas angular aggregates promoted the formation of a denser microstructure and effectively enhanced mortar strength. These studies and practical applications have demonstrated that NHL, while ensuring satisfactory material performance, also exhibits excellent carbonation behavior and environmental adaptability, rendering it a preferred alternative to cement for the conservation of historic buildings[19]. In addition, although NHL shows better corrosion resistance than cement, gypsum- and ettringite-like corrosion products may still form under acid rain exposure, leading to surface expansion and spalling of the mortar; however, the corrosion process is relatively slow, and its influence on long-term performance remains comparatively controllable[20,21]. Overall, these studies indicate that NHL combines good mechanical properties, durability, and CO2 uptake capacity and represents an important development direction for green heritage repair materials.
Biochar is a carbon-rich material produced by the pyrolysis of biomass. Its carbon-negative character stems from the stable sequestration of biomass-derived carbon within the material matrix, which not only mitigates carbon emissions but also forms a long-term carbon sink[22,23]. In addition, biochar possesses porous structures and high adsorption capacities[24−26]. When incorporated into NHL, biochar can promote the carbonation reaction by providing additional CO2 transport pathways and adsorption sites, thereby improving CO2 capture efficiency[27,28], and enhancing the mechanical properties of the material[29]. This innovative approach provides a new solution for achieving the dual carbon goals and developing green building materials[30,31].
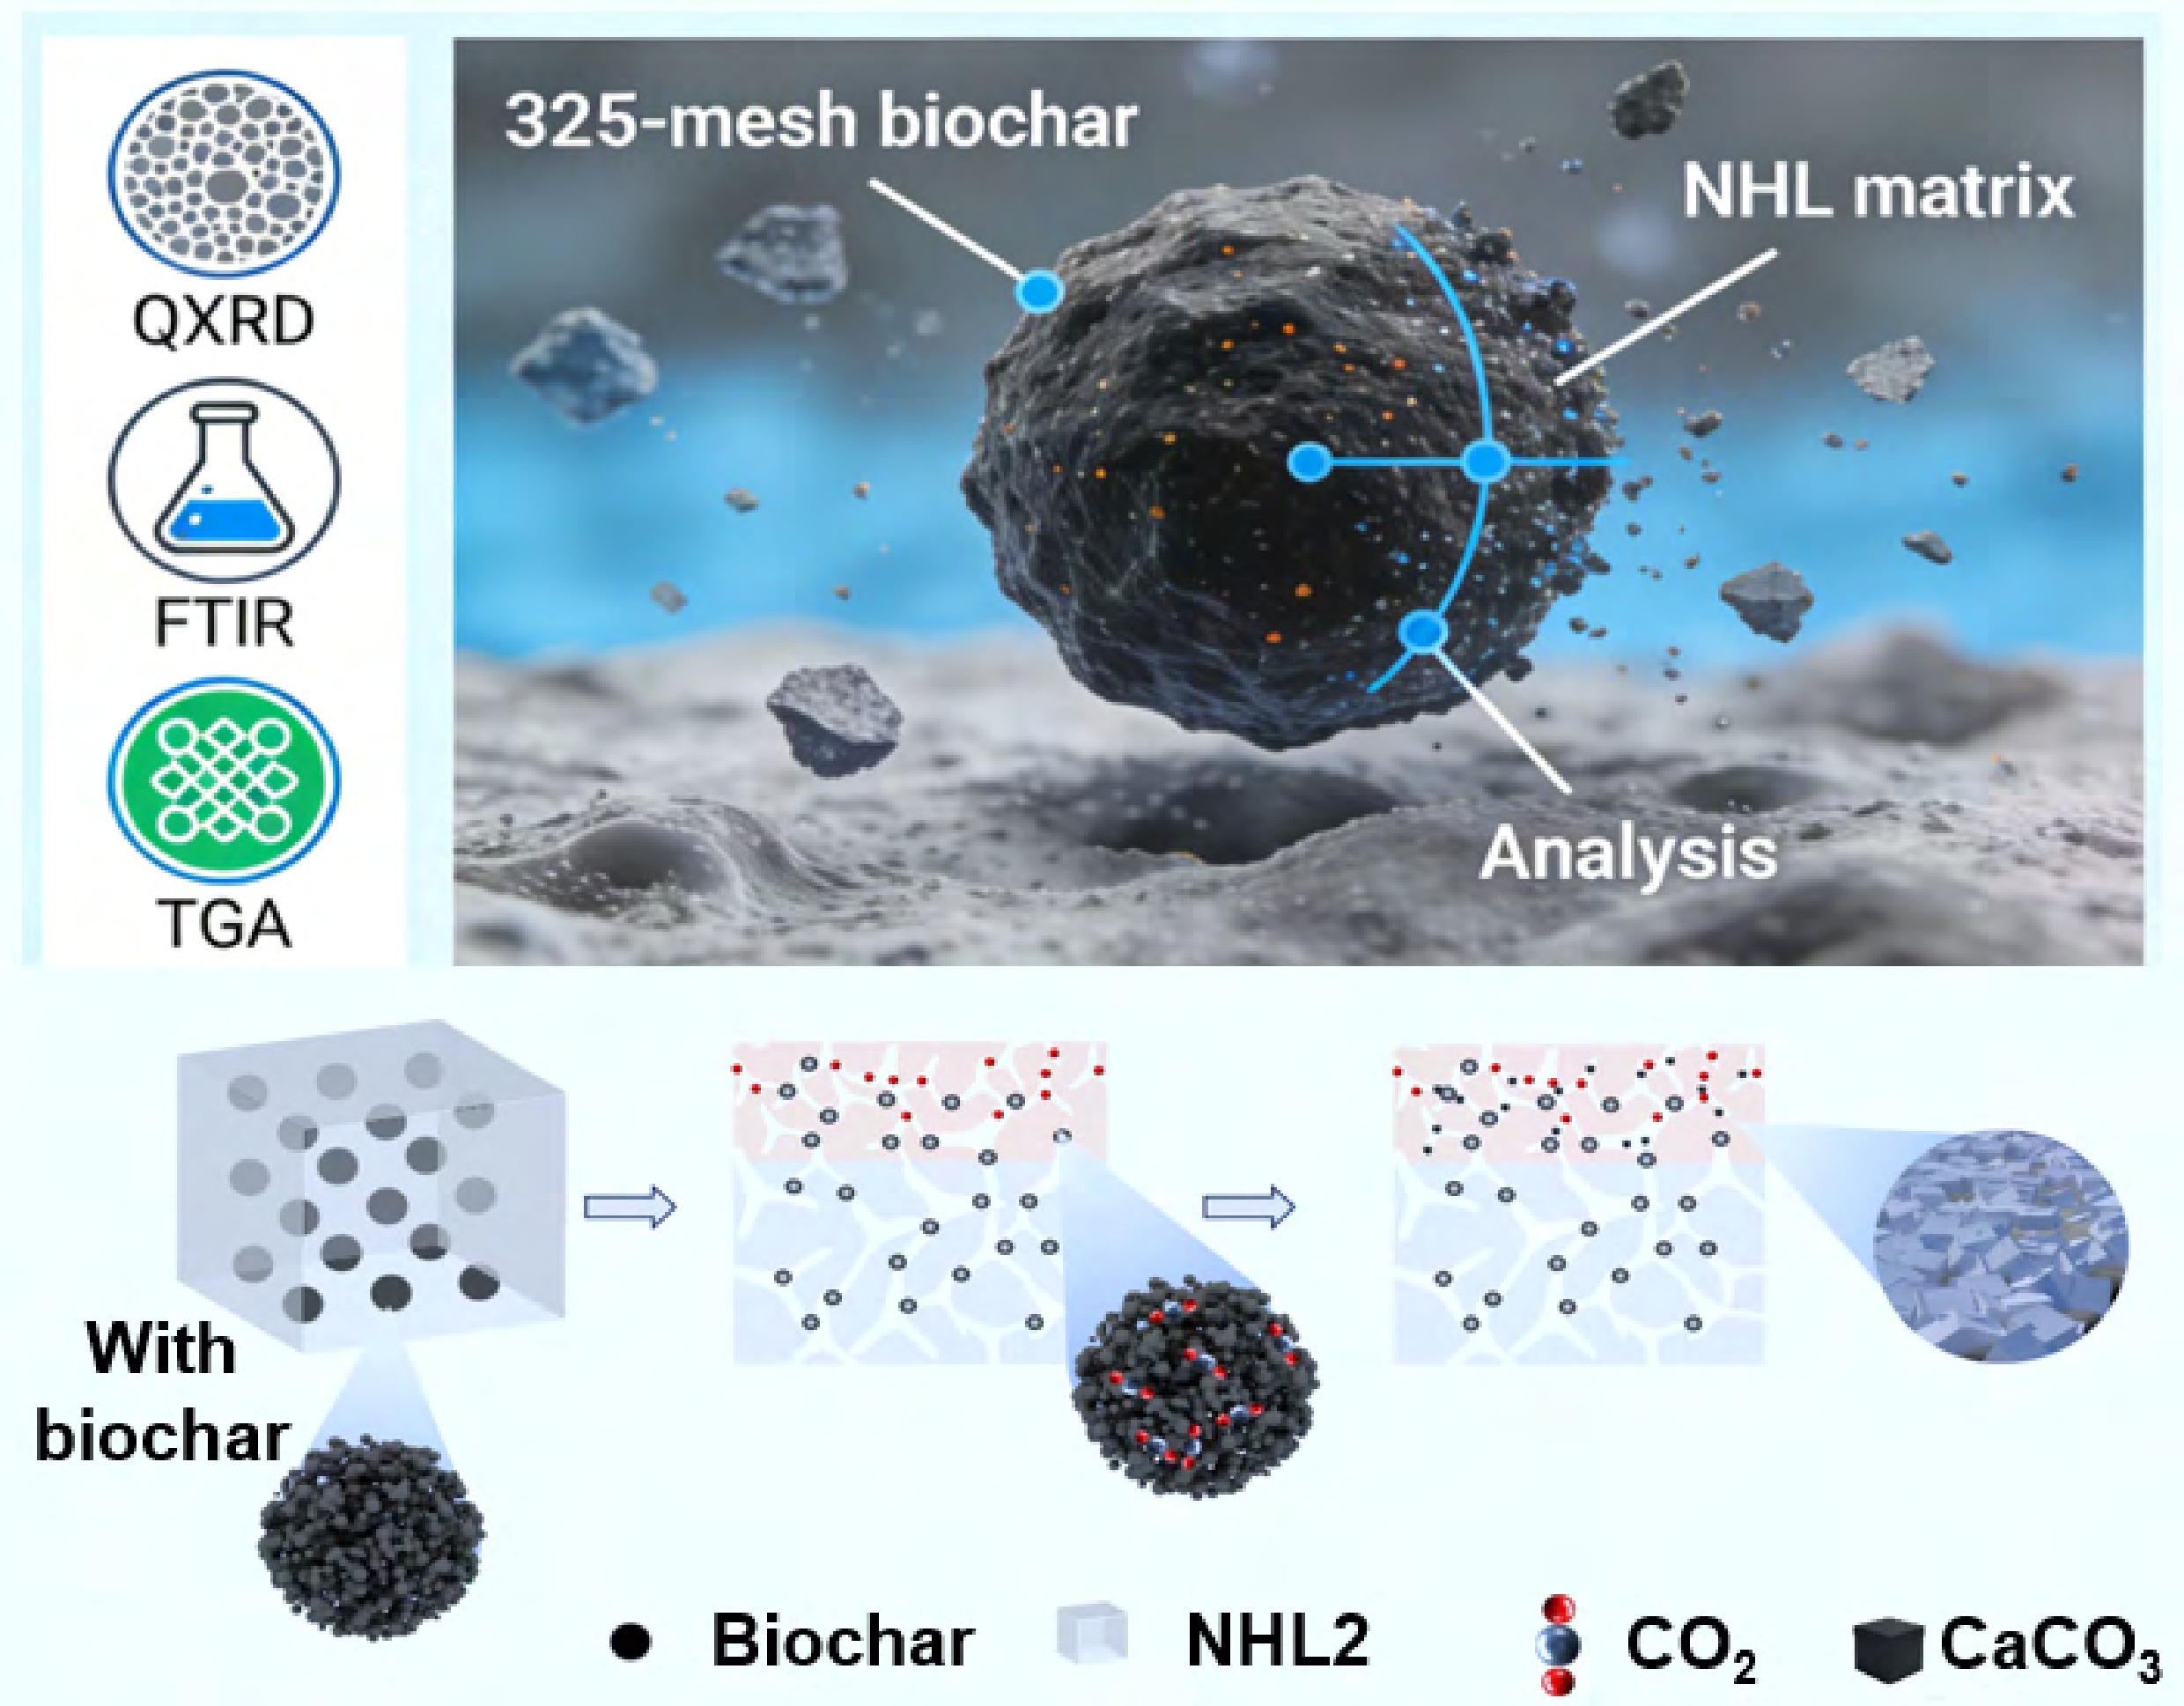
To the best of our knowledge, studies on biochar-modified hydraulic lime materials remain limited, and the underlying mechanisms governing their influence on carbonation and mechanical performance remain to be elucidated. In this study, biochar with varying particle sizes and dosages was incorporated into NHL to systematically investigate its effects on mechanical properties and CO2 uptake performance. Additionally, microscopic analyses, including QXRD, FTIR, and TGA, were employed to further elucidate the regulatory effects of biochar on the microstructure of NHL.
-
Hydraulic lime, biochar, and fine aggregate were used in this study. The hydraulic lime was NHL2, supplied by Shanghai DESAIBAO Building Materials Co., Ltd. It had a surface density of 2.21 g/cm3. Its main oxide components were CaO (62.5%), SiO2 (11.2%), MgO (1.44%), and Al2O3 (1.3%). The biochar was supplied by Henan Tanernuo New Material Co., Ltd. Three particle sizes, namely 100, 200, and 325 mesh, were selected. The morphology of 325-mesh biochar is shown in Fig. 1. The biochar was produced from coconut shells by high-temperature pyrolysis. The fine aggregate was supplied by Xiamen ISO Standard Sand Co., Ltd, and consisted of Chinese ISO standard sand with a particle size range of 0.5–1.0 mm.
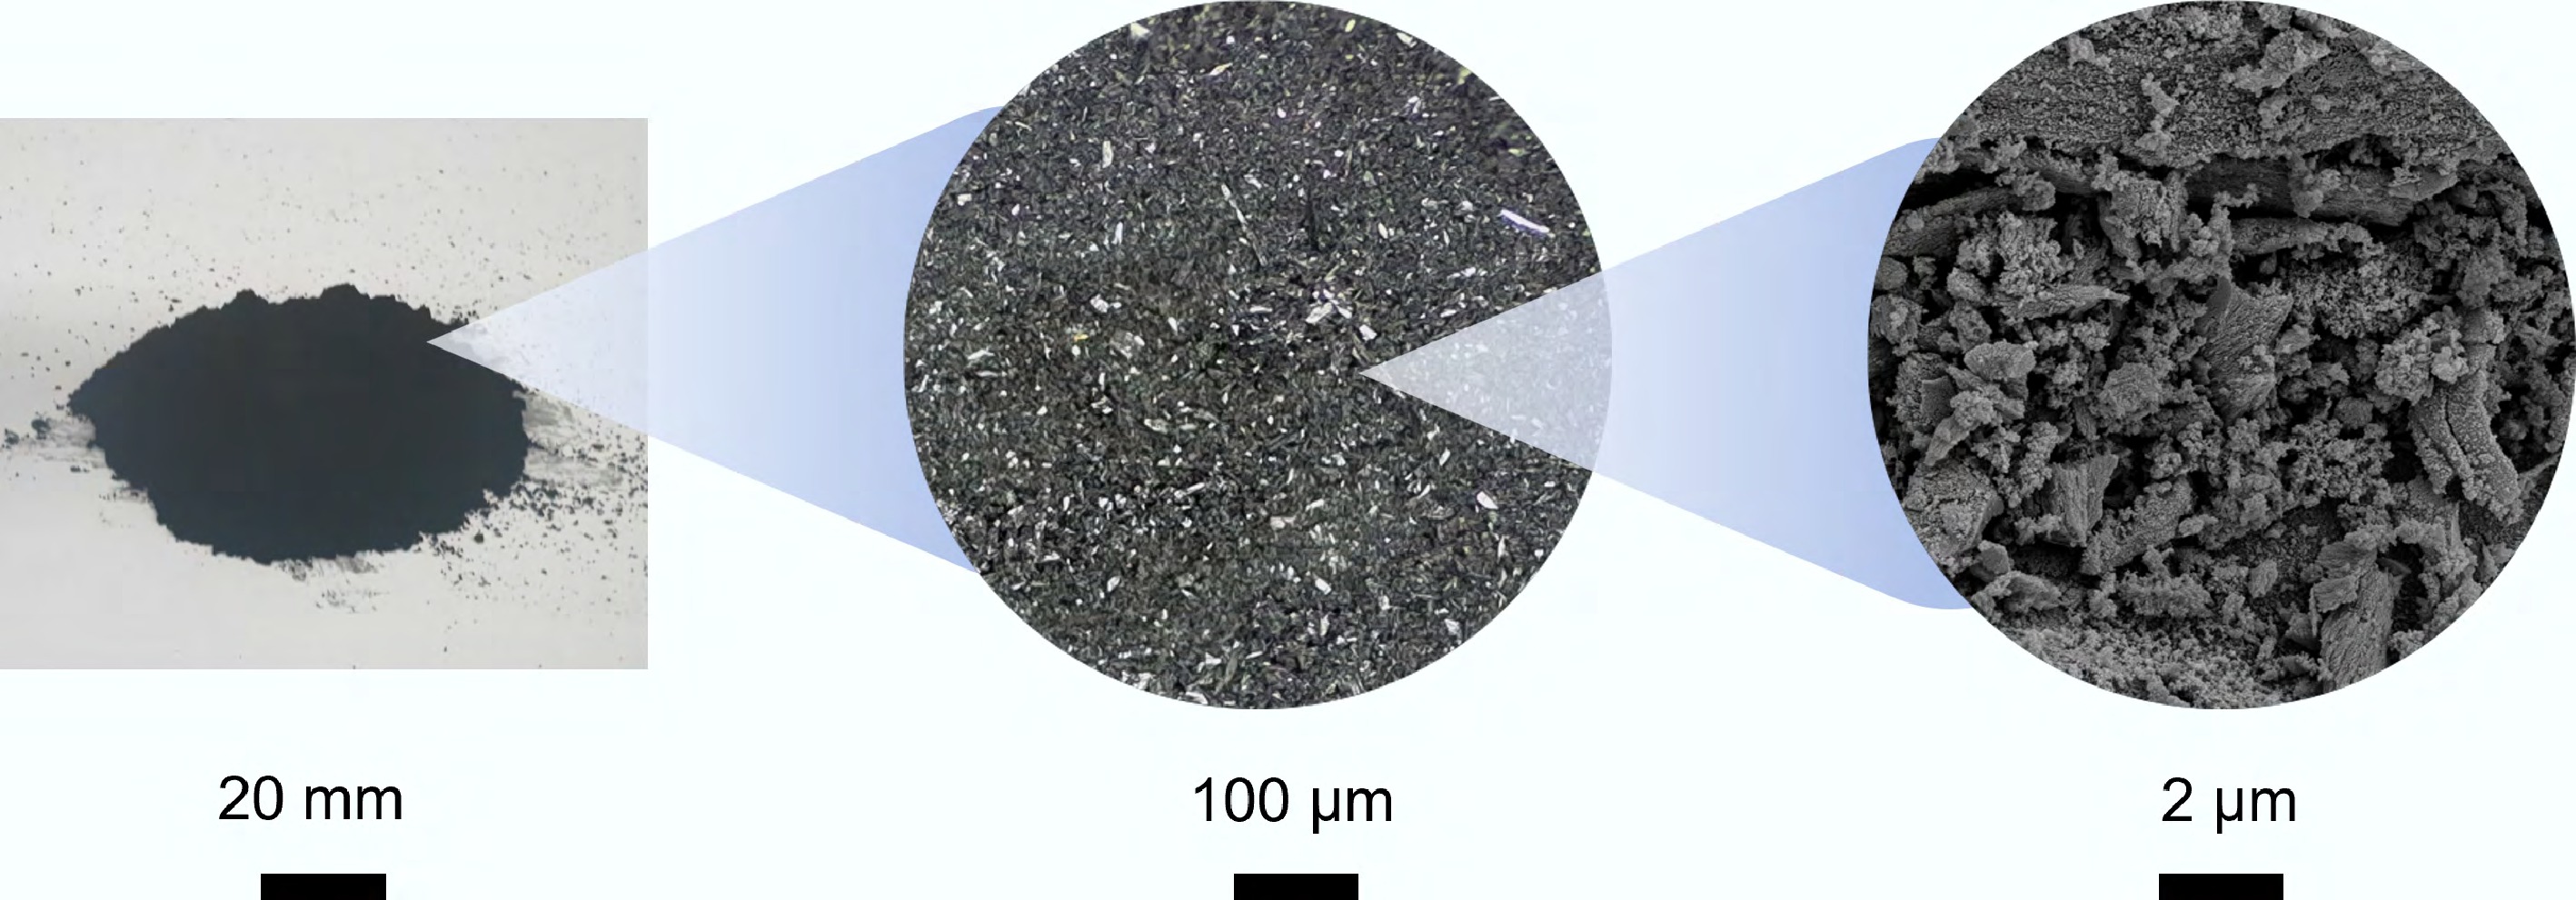
Figure 1.
The morphology of biochar at different magnifications.
The CO2 used in this study was commercial-grade, supplied by Nanjing Changyuan Industrial Gas Co., Ltd., with a CO2 purity of 99.9%.
Sample preparation
-
To evaluate the effects of biochar particle size and dosage on the properties of NHL, paste specimens and mortar specimens were prepared. The mortar specimens were used for compressive strength, pH, and saturated water porosity tests, while the paste specimens were used for CO2 uptake and microstructural characterization. As shown in Fig. 2, the mix proportions and designations of the paste specimens are detailed in Table 1, and those of the mortar specimens are presented in Table 2.
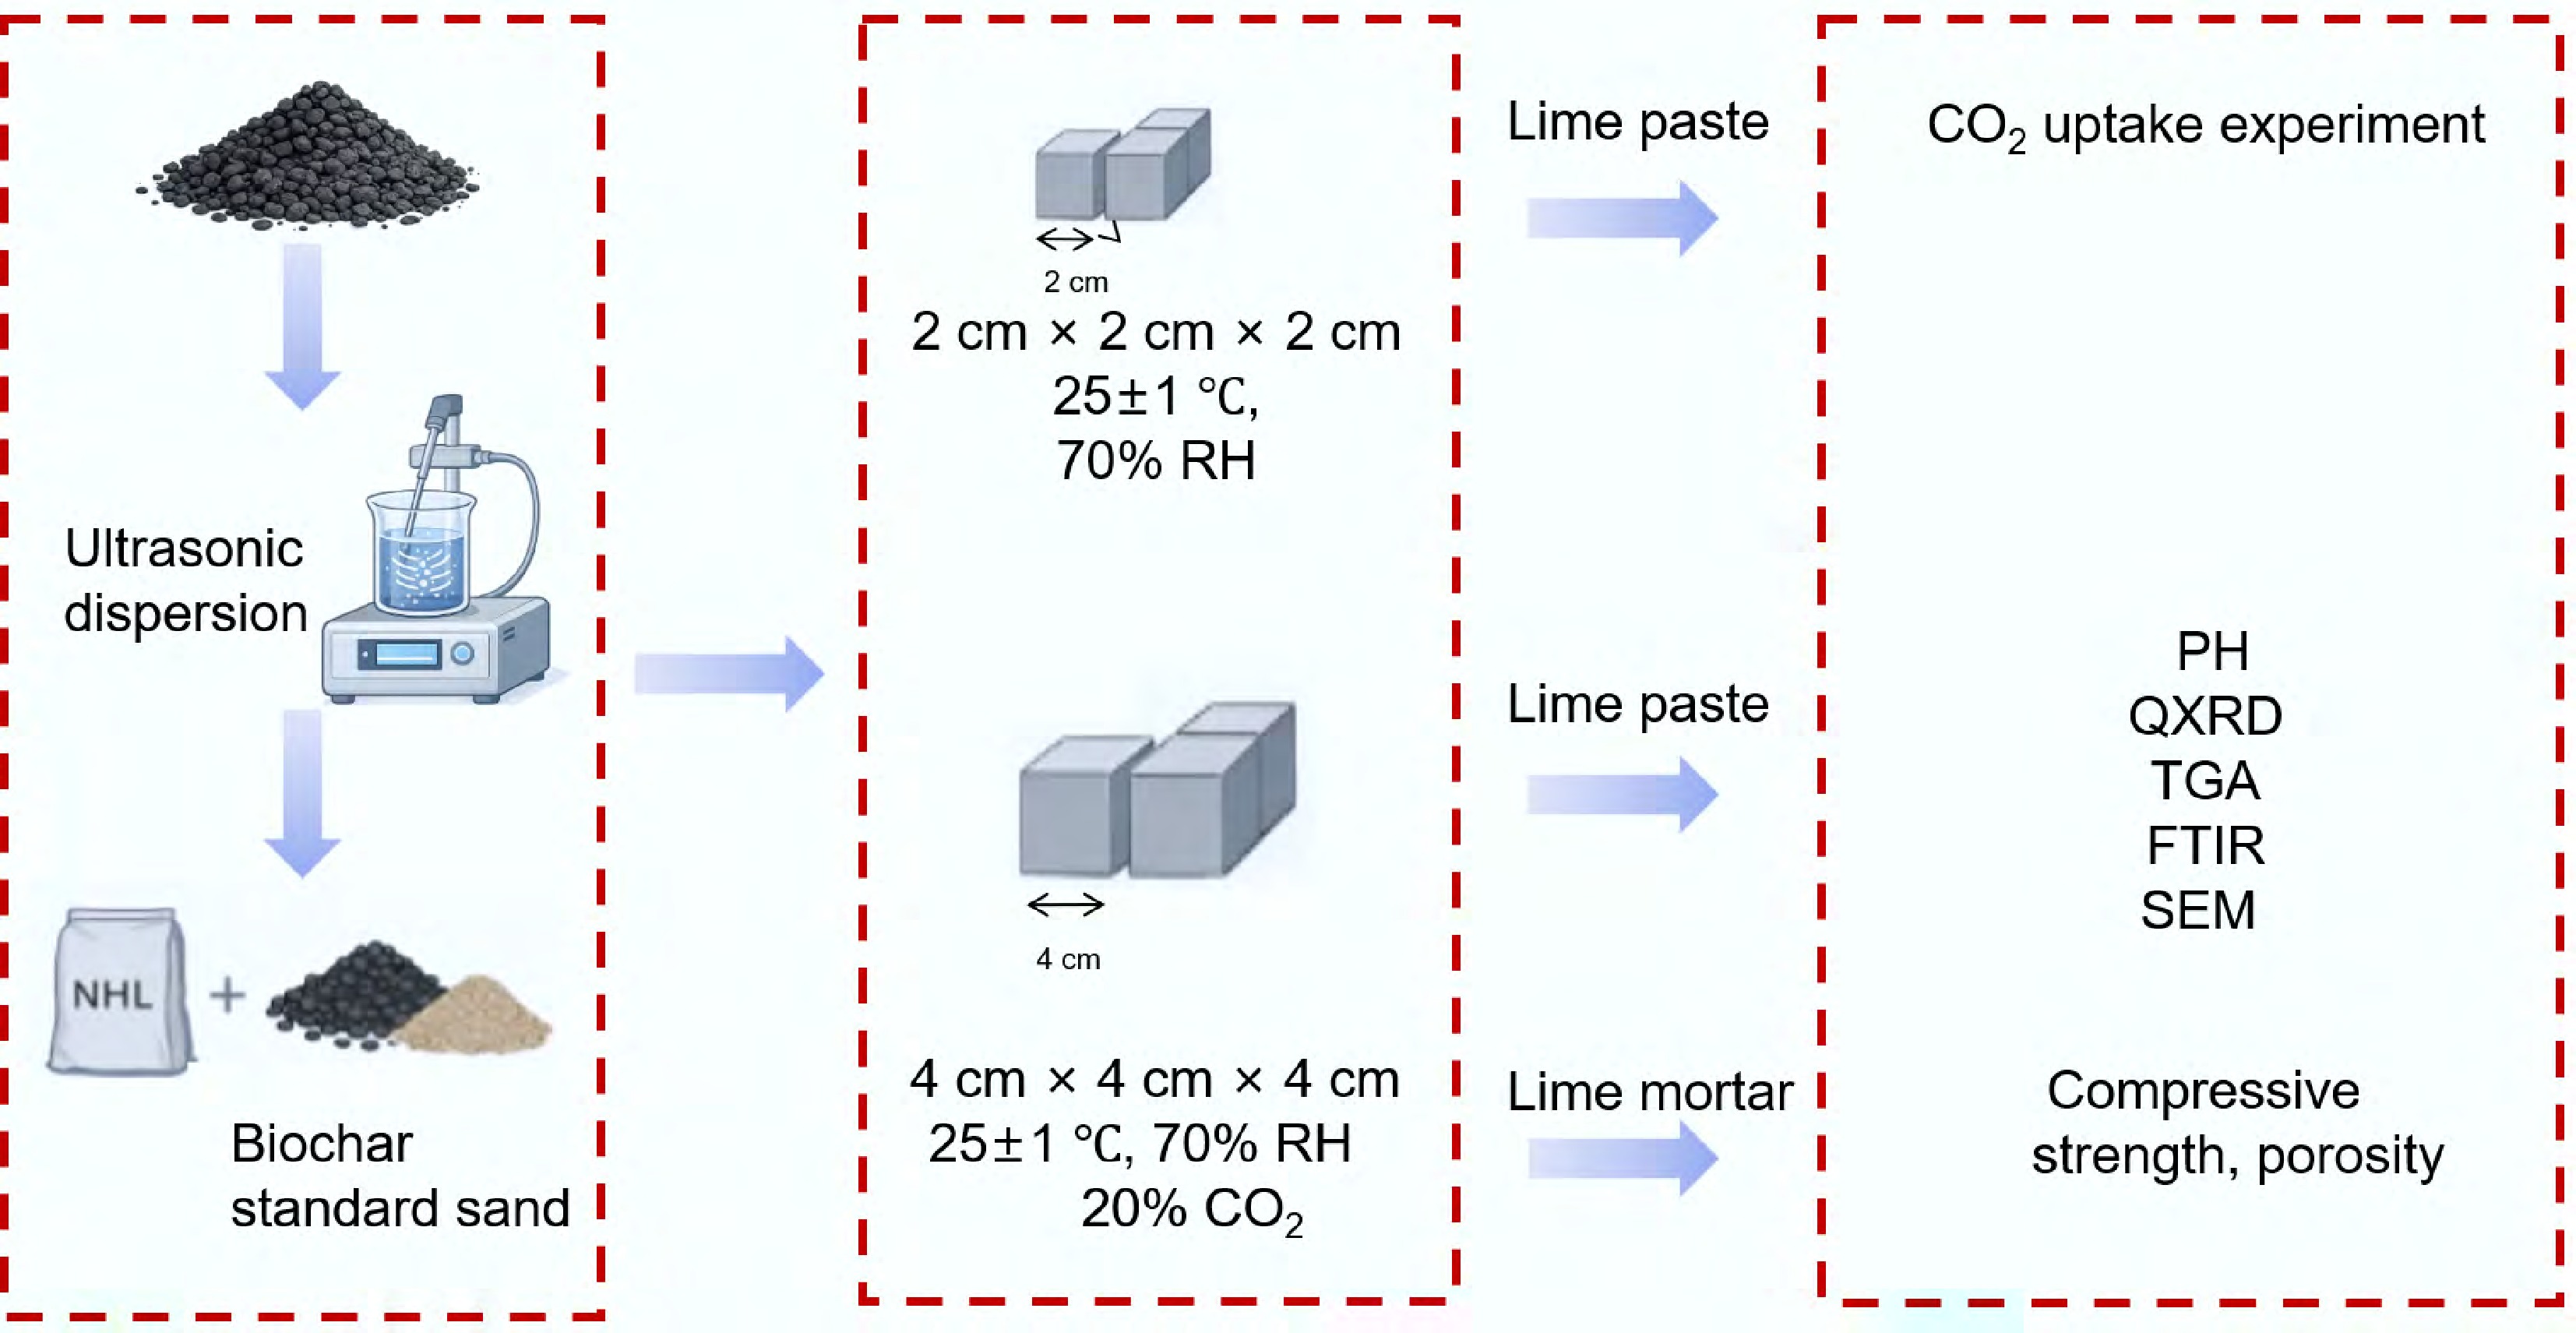
Figure 2.
Experimental preparation process.
Table 1. Mix proportions of biochar-modified NHL paste mixtures
ID Mesh Biochar (g) NHL2 (g) W/B P00 − − 100 0.6 P11 100 1 99 0.6 P12 100 2 98 0.6 P13 100 3 97 0.6 P14 100 4 96 0.6 P21 200 1 99 0.6 P22 200 2 98 0.6 P23 200 3 97 0.6 P24 200 4 96 0.6 P31 325 1 99 0.6 P32 325 2 98 0.6 P33 325 3 97 0.6 P34 325 4 96 0.6 P35 325 5 95 0.6 Table 2. Mix proportions of biochar-modified NHL mortar specimens
ID Mesh Biochar (g) NHL2 (g) Sand (g) W/B M00 − − 100 300 0.6 M11 100 1 99 300 0.6 M12 100 2 98 300 0.6 M13 100 3 97 300 0.6 M14 100 4 96 300 0.6 M21 200 1 99 300 0.6 M22 200 2 98 300 0.6 M23 200 3 97 300 0.6 M24 200 4 96 300 0.6 M31 325 1 99 300 0.6 M32 325 2 98 300 0.6 M33 325 3 97 300 0.6 M34 325 4 96 300 0.6 During the preparation of the paste specimens, biochar was first dispersed in water, then mechanically stirred for 30 min and ultrasonically dispersed for 1 h. Then, the NHL powder was added to the biochar suspension and mixed for 5 min to obtain a homogeneous paste. The prepared paste was cast into 20 mm × 20 mm × 20 mm molds and then cured under plastic film at 25 ± 2 °C for 24 h before demolding. The preparation procedure of the mortar specimens was similar to that of the paste specimens, except that the standard sand and NHL were first mixed for 2 min. The prepared mortar was then cast into 40 mm × 40 mm × 40 mm molds and cured under plastic film at 25 ± 2 °C for 24 h before demolding.
CO2 carbonation curing was carried out in a concrete carbonation chamber. After demolding, the specimens were immediately placed in the carbonation chamber, where curing conditions were controlled at 20 ± 2 °C, 70% ± 5% relative humidity, and 20% ± 2% CO2. After 24 h of CO2 carbonation curing, the specimens were removed and then further cured at 20 ± 2 °C for 3, 7, and 28 d, followed by compressive strength testing.
Methods
Compressive strength test
-
Compressive strength was measured using a universal testing machine (MTS-E45). The mortar specimens were tested after curing for 3, 7, and 28 d, with a loading rate of 1 mm/s.
CO2 uptake test
-
The CO2 uptake test apparatus used in this study was designed with reference to that reported by Oh et al.[32], as shown in Fig. 3. The core of the apparatus consists of a highly airtight sample container and a glass or resin bottle with a uniform cross-section, in which the liquid level of the vacuum pump oil can move in response to pressure changes.
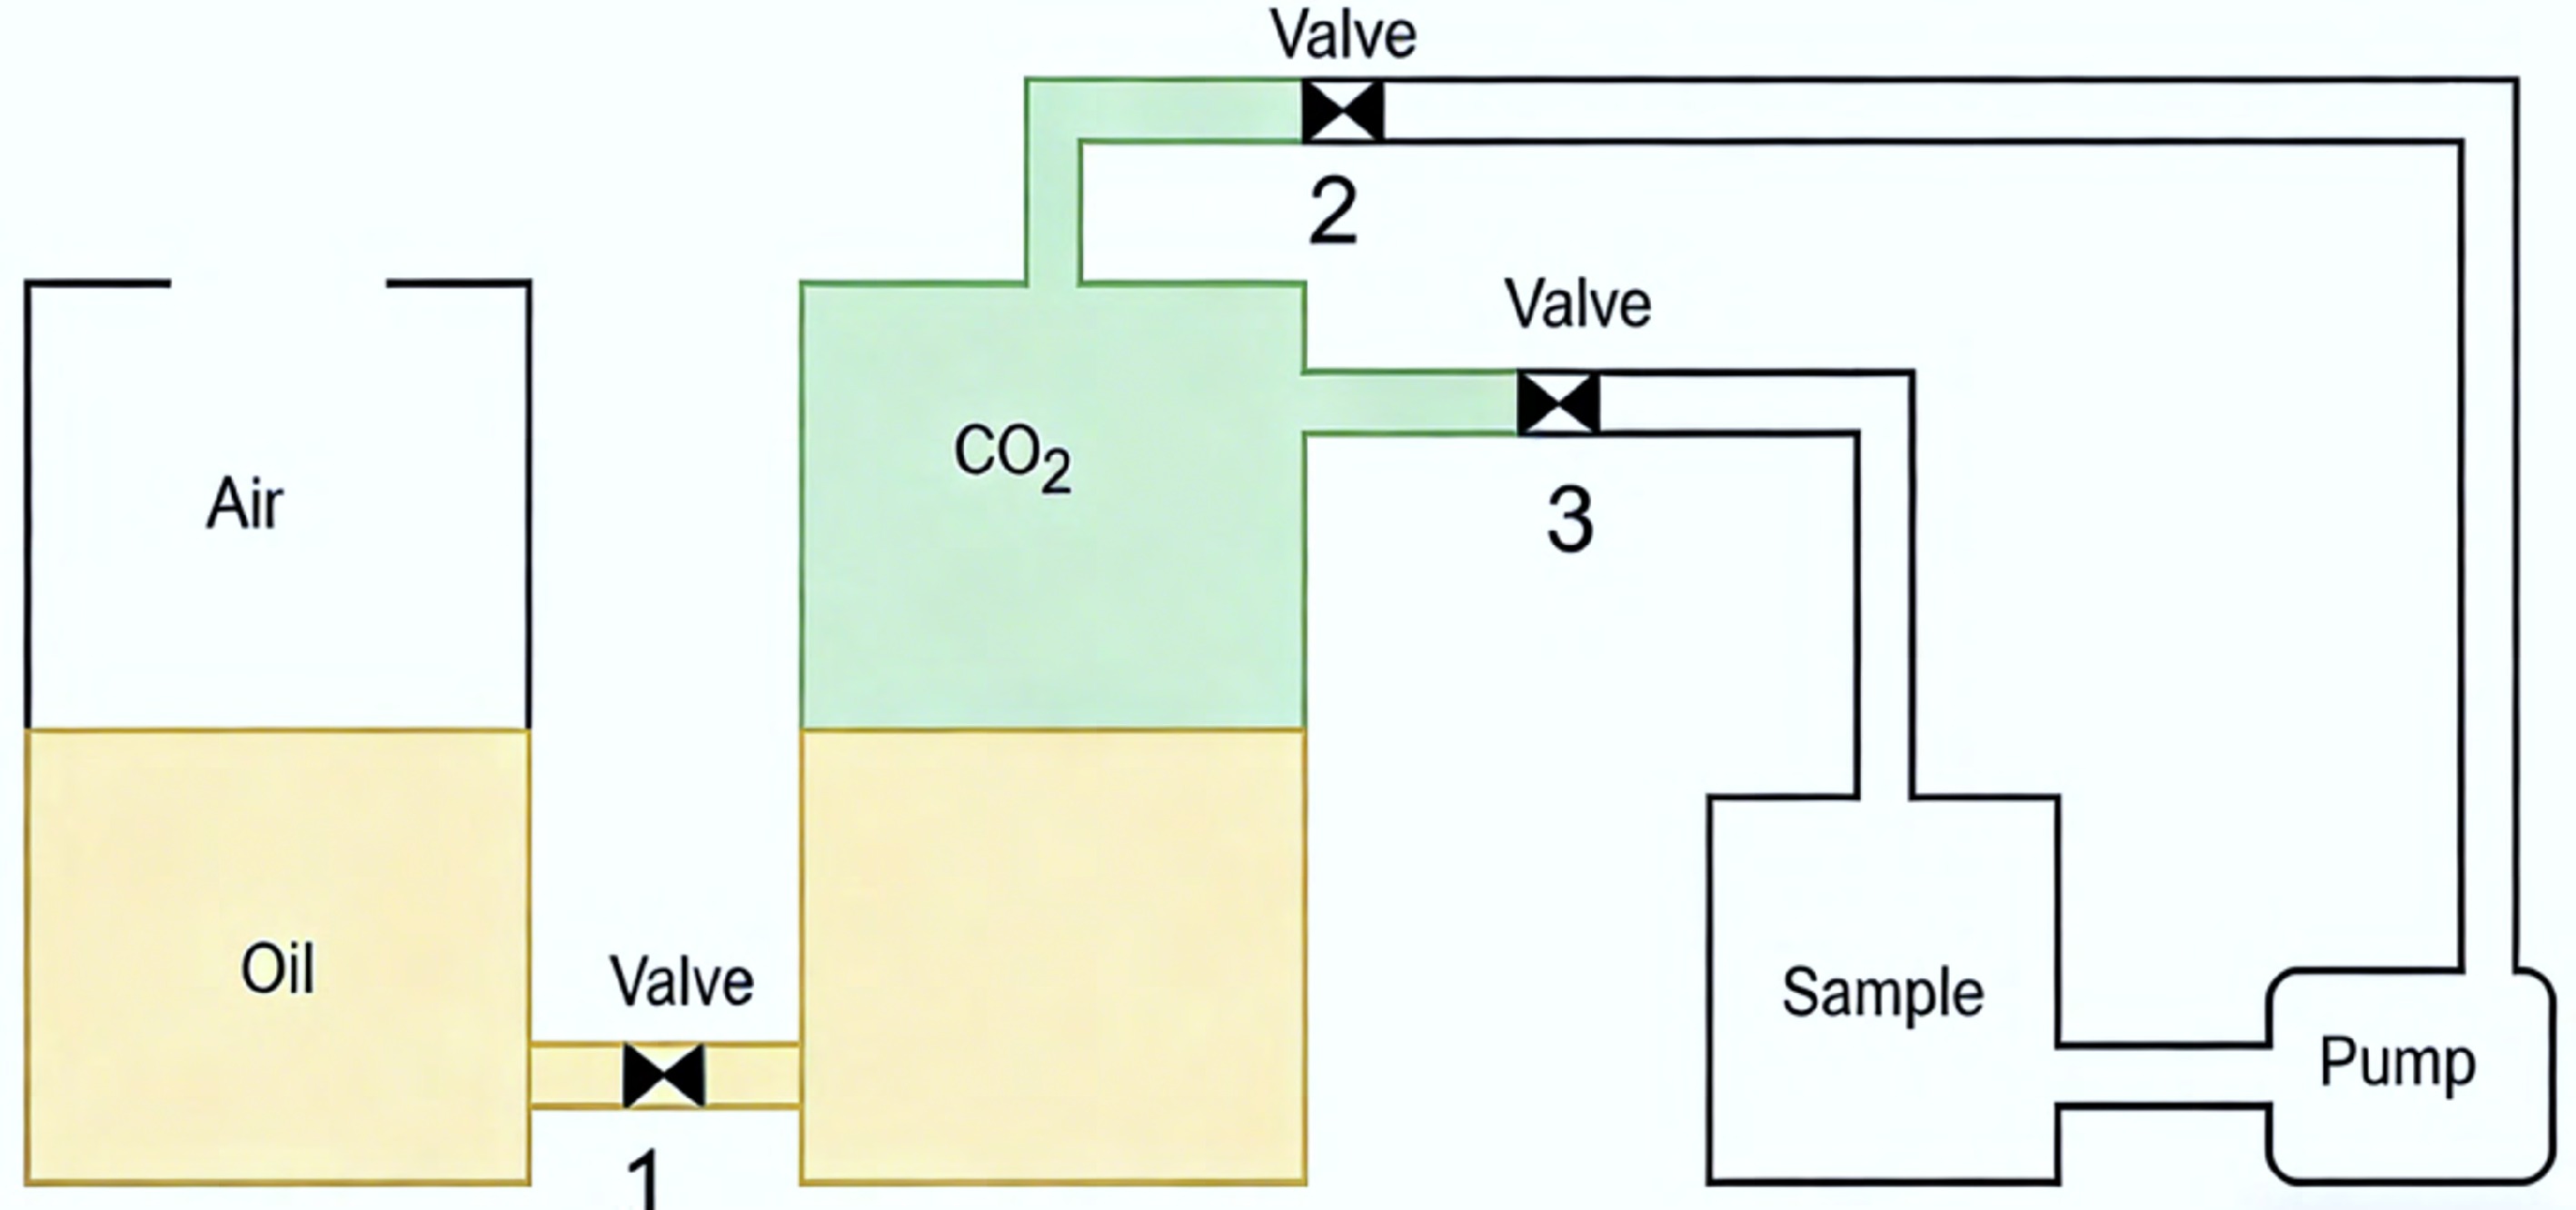
Figure 3.
Schematic diagram of the CO2 uptake evaluation apparatus.
The test procedure was as follows. The sample was placed in a well-sealed container to ensure that the system remained stable. After the apparatus was left standing, Valve 1 was closed, while Valves 2 and 3 were opened, which allowed CO2 from the gas cylinder to be introduced into the system, thereby displacing the air originally present in the container. After the space in the bottle was essentially filled with CO2, Valves 2 and 3 were closed in sequence, and the valve system was then switched to connect to the container holding the sample. Subsequently, the pump was started, and Valves 1, 2, and 3 were opened simultaneously, enabling continuous CO2 delivery into the sample container. The primary function of the pump was to improve gas-delivery efficiency and ensure that CO2 from the cylinder entered the sample container steadily and uniformly, thus reducing the possibility of residual air during the purging process.
The advantage of this apparatus is that, as CO2 is consumed in the chemical reaction, the process can be observed through a change in the liquid level difference, allowing the absorption process to be visualized intuitively. Even non-specialists can therefore gain a direct understanding of the CO2 uptake process. In addition, the liquid-level difference can be used to evaluate the uptake rate of each sample.
In this study, the sealed container had a volume of 145 mL, and 500 mL of vacuum pump oil was filled into a 1 L container with a diameter of 0.094 m. A paste specimen measuring 20 mm × 20 mm × 20 mm was placed into the container, which was then sealed. CO2 was supplied at a flow rate of 5 L/min for 3 min. After this 3 min period, the valves were closed and subsequently connected to the container holding the sample. Then, the pump and valves were opened. The movement of the liquid level was then observed.
pH test of leachate
-
The pH value was measured using the suspension method, which has been widely adopted in previous studies. After the carbonation depth test, samples were taken from the carbonated region identified in the phenolphthalein test. The selected samples were immersed in ethanol for 24 h to stop hydration and prevent air carbonation. Thereafter, the samples were dried in a vacuum oven at 60 °C for 24 h. The dried samples were ground into powder and sieved through a 0.08 mm sieve. The powder was then mixed with distilled water at a 1:10 ratio, thoroughly stirred, and left to stand for 24 h. The supernatant was obtained by vacuum filtration. The pH of the supernatant was promptly measured using a pH meter (Leici DZS-708-A, Shanghai INESA Scientific Instrument Co., Ltd). Three samples were tested to obtain the average value for each group.
Water absorption test
-
Water absorption was used as an indicator of the specimens' porosity, and the test method followed ASTM C642. The dry mass (A), saturated mass after immersion (B), Porosity (p), and apparent immersed mass (C) were measured sequentially, and the porosity was calculated using Eq. (1):
$ p=\dfrac{B-A}{B-C}\times 100{\text{%}} $ (1) X-ray diffraction (XRD)
-
Powder samples taken from the center of the specimens were analyzed by XRD using a Rigaku SmartLab SE diffractometer (Cu-Kα radiation, 40 kV/40 mA) over a 2θ range of 5°–90° at a scanning rate of 5°/min. Quantitative phase analysis (QXRD) was performed using the RIR method in Jade 6.0 software, with 10 wt% ZnO added as an internal standard.
Fourier transform infrared spectroscopy (FTIR)
-
FTIR can help analyze the degree of polymerization of hydration products and the CaCO3 polymorphs formed during carbonation. The samples for FTIR analysis were prepared using the KBr pellet method. The powder samples used for XRD analysis were mixed with KBr at a 1:100 ratio. FTIR was used to identify the chemical bonding characteristics of the materials. The FTIR measurements were performed on a Thermo Scientific Nicolet iS20 spectrometer over the range 400–4,000 cm−1 with a resolution of 4 cm−1. The same powder samples used for XRD and FTIR analyses were also used for thermogravimetric analysis.
Thermogravimetric analysis (TGA)
-
TGA was performed using a Netzsch STA 449F5 analyzer (30–1,000 °C, heating rate 20 °C/min, N2 flow 50 mL/min). The contents of Ca(OH)2 and CaCO3 were quantified from the respective mass-loss stages using Eqs (2) and (3):
$ {\text{Ca}\left(\text{OH}\right)}_{2}\left({\text{%}}\right)=\dfrac{{\text{W}}_{380}-{\text{W}}_{450}}{{\text{W}}_{\text{sample}}}\times \dfrac{74.09}{18.01}\times 100{\text{%}} $ (2) $ {\text{CaCO}}_{3}\left({\text{%}}\right)=\dfrac{{\text{W}}_{500}-{\text{W}}_{900}}{{\text{W}}_{\text{sample}}}\times \dfrac{100.09}{44.01}\times 100{\text{%}} $ (3) where, W380, W450, W500, and W800 are the masses of the powder sample measured by TGA at 380, 450, 500, and 800 °C, respectively.
-
Figure 4 shows the compressive strength of biochar-modified NHL specimens at different curing ages. Figure 4a presents the compressive strength results after 3 d of curing. At a biochar dosage of 2%, the early strength of the mortar was significantly improved as the biochar particle size increased from 100 to 325 mesh. Compared with the control group, the compressive strength of the specimens containing 100-, 200-, and 325-mesh biochar increased by 28.5%, 33.3%, and 35.7%, respectively. Figure 4b shows the results after 7 d of curing. At 2% dosage, the strength enhancement trend became more pronounced, and the compressive strength of the specimens containing 100-, 200-, and 325-mesh biochar increased by 22.2%, 32.6%, and 42.1%, respectively, compared with the control group. Figure 4c shows the results after 28 d of curing. Although the strength gain at the later age was lower than that at the early stage, a certain strengthening effect was still maintained at the 2% dosage, with strength increases of 1.1%, 7.5%, and 10.9% for the three particle sizes, respectively. Overall, the incorporation of biochar had a more pronounced effect on early strength enhancement, while still providing some improvement at later ages. Among all mixtures, biochar with a 325-mesh particle size at a dosage of 2% showed the greatest improvement in the mechanical properties of NHL.
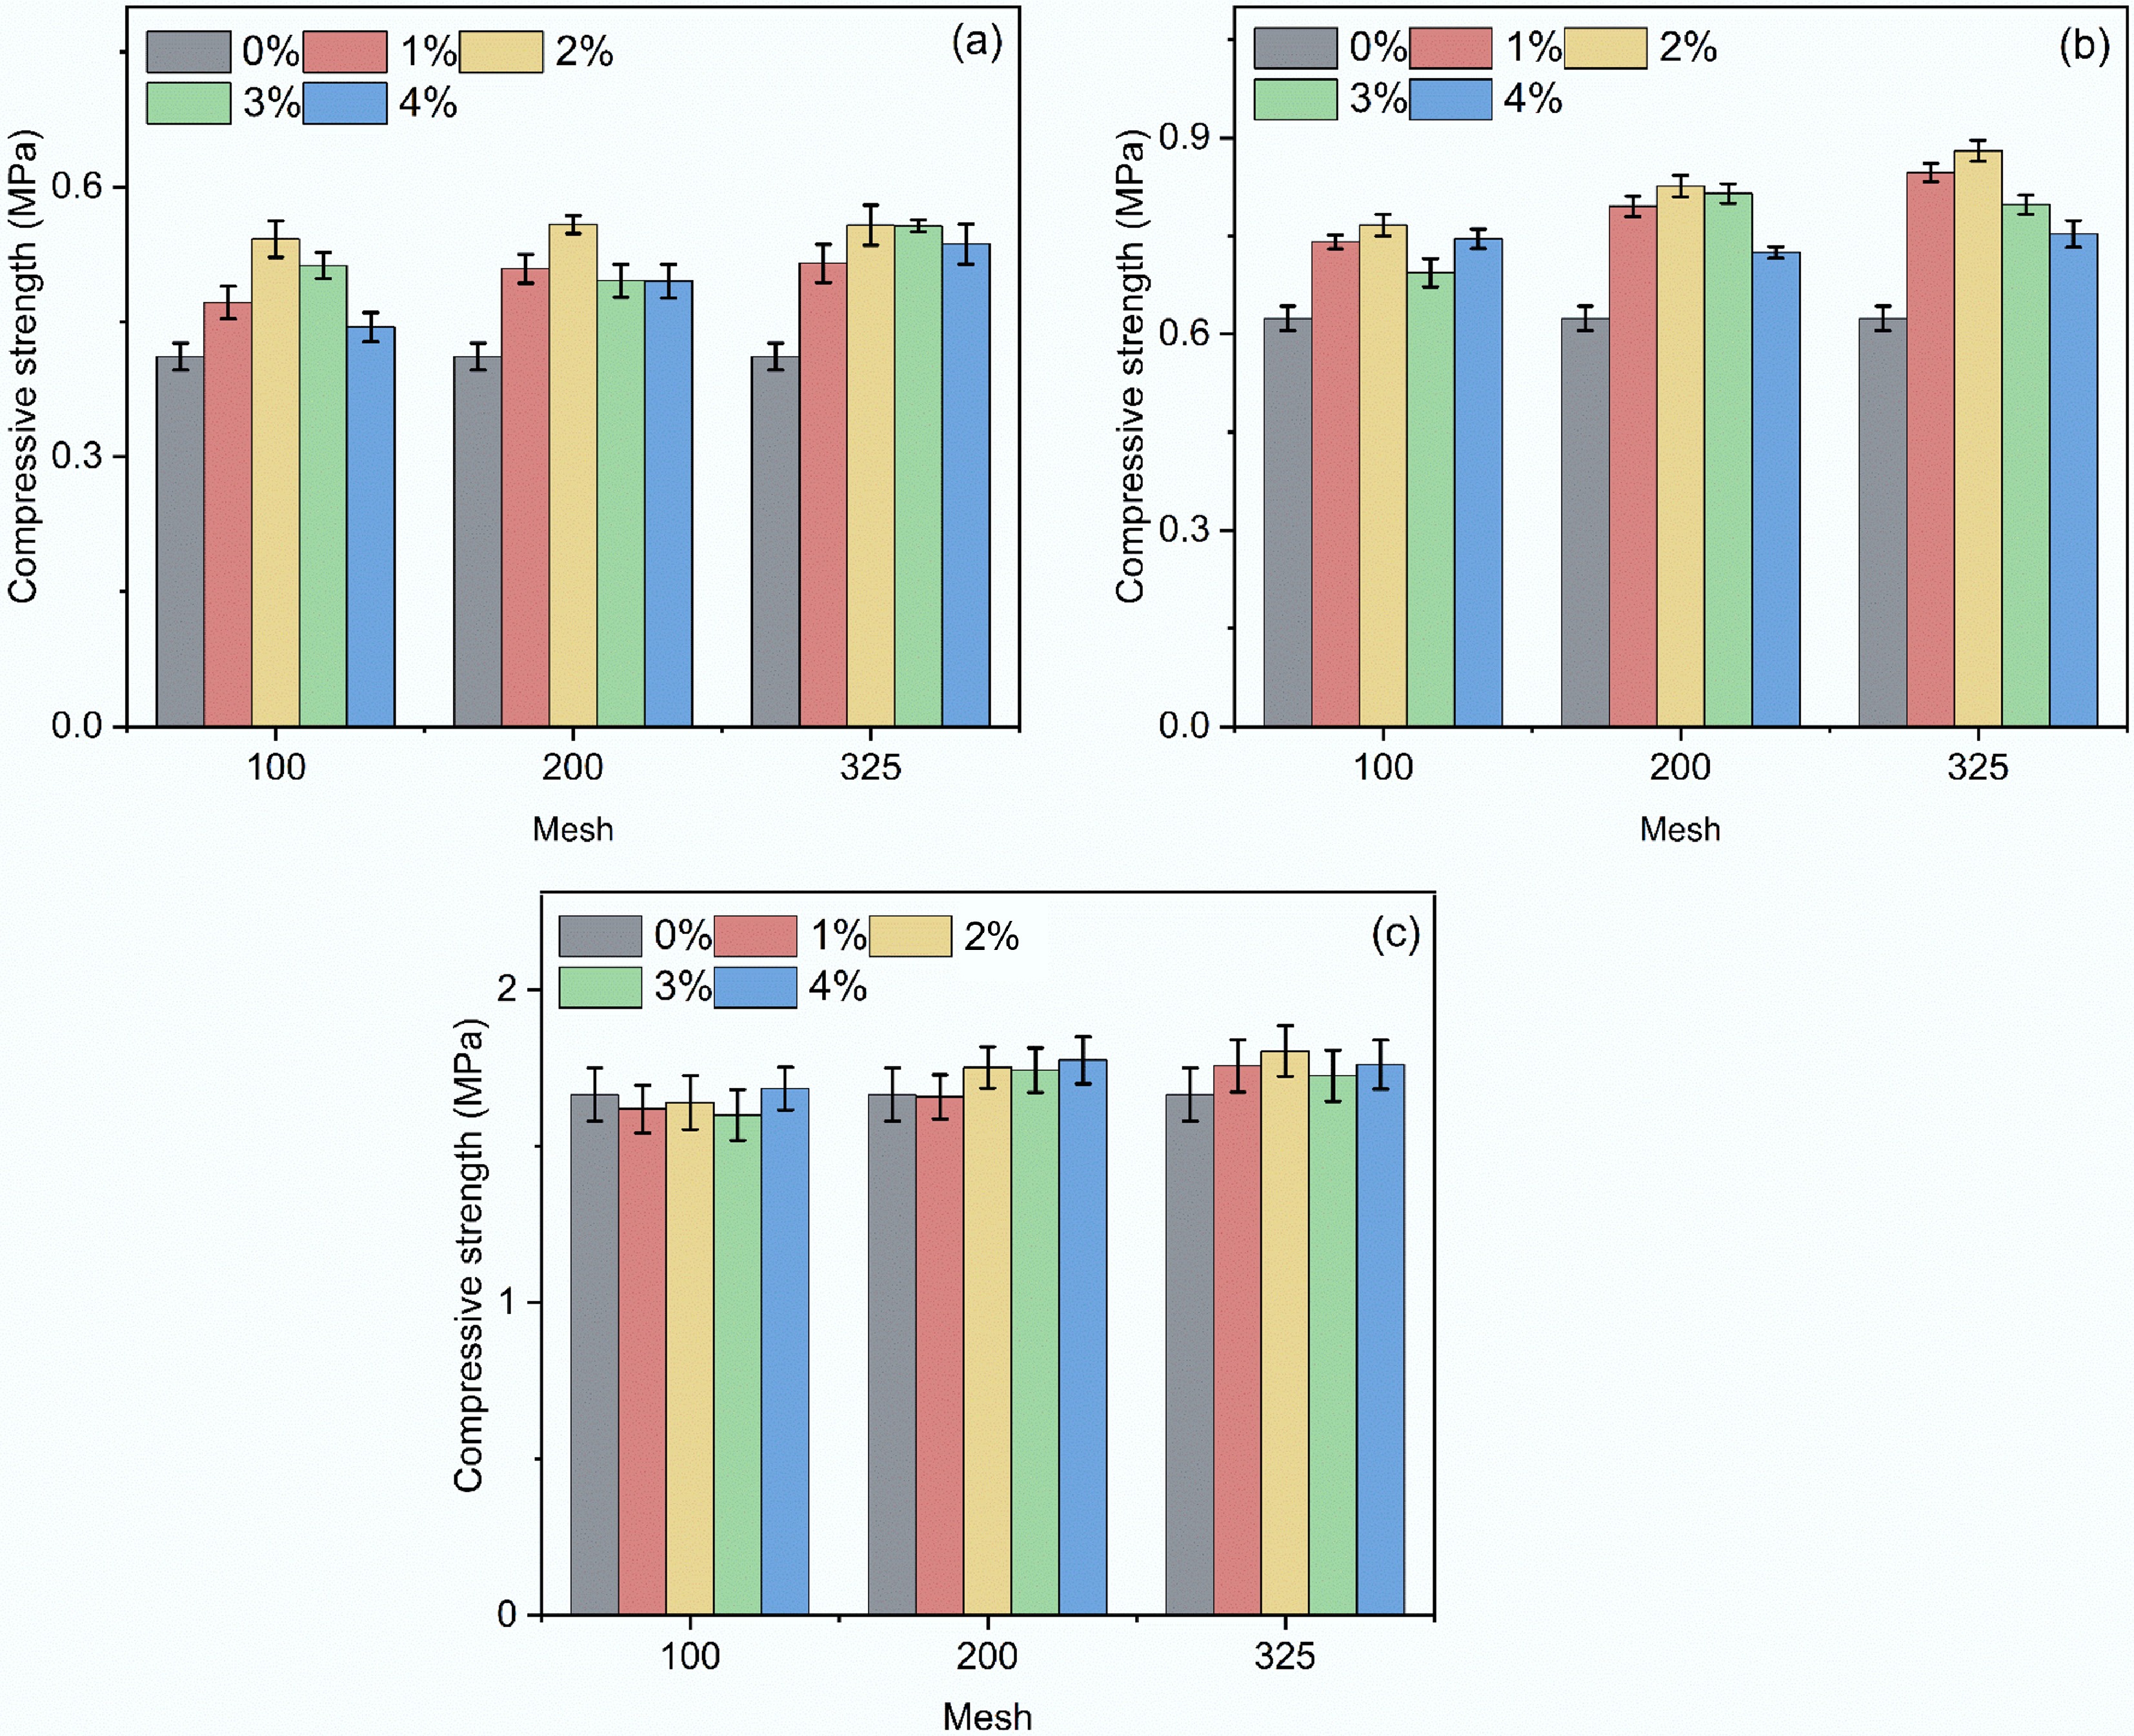
Figure 4.
Compressive strength of biochar-modified NHL composites: (a) 3 d; (b)7 d; (c) 28 d.
Owing to its finer particle size and correspondingly larger specific surface area, the 325-mesh biochar exhibited stronger CO2 adsorption capacity and a more pronounced pore-filling effect. These characteristics facilitated CO2 diffusion and fixation during carbonation, promoted densification of the lime paste microstructure, and consequently contributed to the improvement in mechanical properties. During carbonation, Ca(OH)2 reacted with CO2 to form CaCO3, which then filled the pores, significantly increasing the material's compactness. With increasing biochar dosage, the compressive strength of the specimens first increased and then decreased, indicating an initial enhancement followed by deterioration. The compressive strength reached its maximum at a dosage of 2%, showing a clear improvement compared with the control group without biochar. However, when the dosage exceeded 2%, the compressive strength declined. This phenomenon indicates that an appropriate amount of biochar can improve pore structure, promote carbonation, and increase compactness, thereby enhancing mechanical performance. However, when the biochar dosage exceeded 2%, excessive incorporation led to increased porosity and disrupted the continuity and compactness of NHL, resulting in a looser internal structure and ultimately reducing its load-bearing capacity. In particular, at a dosage of 4%, the inherently porous and loose structure of biochar further increased the overall porosity of the material and limited the formation of dense hydration and carbonation products, thereby becoming an unfavorable factor for strength development. Therefore, from the perspective of mechanical performance, the optimal dosage of 325-mesh biochar was 2%. Under this proportion, the enhancement of the carbonation reaction and the control of pore structure could be balanced, leading to a significant improvement in the compressive performance of the lime-based material.
CO2 uptake performance
-
Since the specimens incorporating 325-mesh biochar exhibited the best mechanical performance, the effect of 325-mesh biochar at different dosages on the CO2 uptake performance of the specimens was further investigated, and the results are shown in Fig. 5. As can be seen from Fig. 5a, the CO2 uptake of the specimens increased with time, with a relatively rapid increase within the first 6 h, followed by a gradual slowdown. The experimental data were fitted using the Elovich equation[33], as shown in Eq. (4), where A and B are model parameters, t is the carbonation time (min), and Y is the growth rate of CO2 uptake by the specimens during carbonation (%).
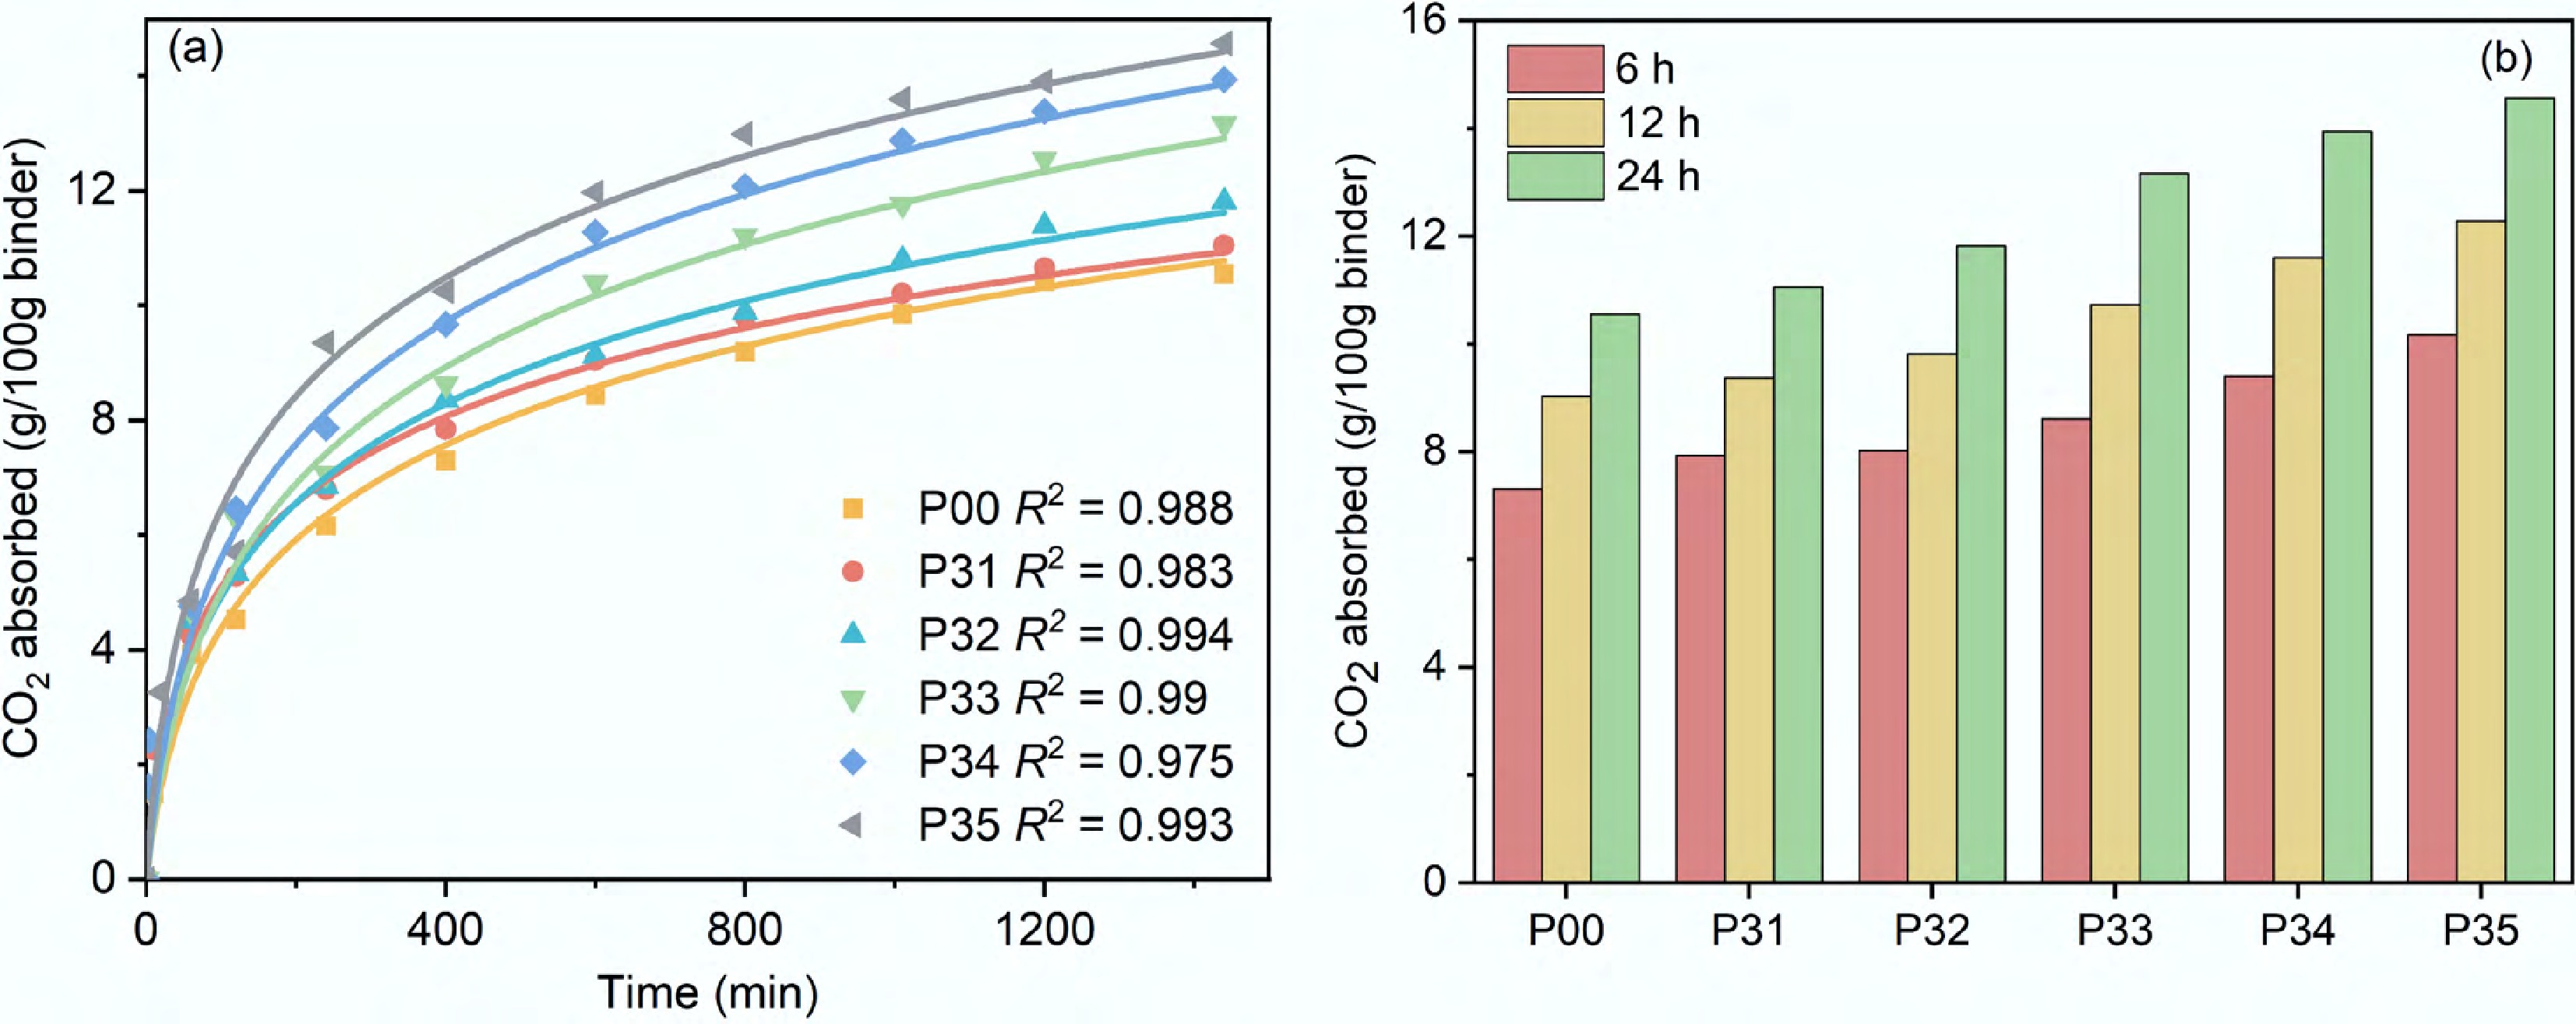
Figure 5.
Effect of biochar dosage on the CO2 uptake performance of the specimens: (a) carbonation kinetics; (b) CO2 uptake.
$ {Y} = {A} + {B} \times \ln {t} $ (4) Here, Y is the CO2 uptake (g/100 g), B represents the apparent uptake rate, and A is a characteristic constant representing the initial uptake capacity. The fitted parameters are listed in Table 3.
Table 3. Fitted parameters of carbonation kinetics for the specimens
ID A B R2 P00 0.115 2.584 0.988 P31 0.191 2.278 0.983 P32 0.142 2.667 0.994 P33 0.121 3.226 0.991 P34 0.146 3.344 0.975 As shown in Table 3, relative to the control group, the apparent carbonation rate (parameter B) of the specimen with 1% biochar decreased by 11.8%, suggesting that insufficient biochar content may impede rather than promote CO2 uptake. In contrast, specimens containing 2%–4% biochar exhibited increases in carbonation rate of 3.2%, 24.8%, and 29.4%, respectively, indicating a dosage-dependent enhancement effect.
As the carbonation time increased, the volume expansion associated with calcite-type calcium carbonate formation reduced the specimens' internal porosity, thereby slowing further contact between calcium hydroxide and CO2. Meanwhile, the carbonation reaction between CO2 and calcium hydroxide requires the participation of water. As the thickness of the calcium carbonate layer increased, the porosity decreased further, limiting contact between the internal calcium hydroxide and water and ultimately reducing CO2 uptake efficiency.
The CO2 uptake values of the specimens at different times were further extracted, as shown in Fig. 5b. In general, higher biochar dosages resulted in greater CO2 uptake. At a dosage of 2%, specimen P32 showed CO2 uptake increases of 14.6%, 7.4%, and 11.9% at 6, 12, and 24 h, respectively, compared with the control group. Although higher dosages (3% and 4%) further increased CO2 uptake, the inherently loose and porous skeletal structure of biochar at elevated dosages may undermine the mechanical integrity of the matrix, such that the densification effect from enhanced carbonation product formation may not sufficiently compensate for the increased porosity.
pH value
-
Figure 6 shows the pH value distribution of different specimens after 24 h of carbonation. Figure 6a–c correspond to specimens containing 100-, 200-, and 325-mesh biochar, respectively. During testing, the specimens were divided from the surface to the interior into three layers: the surface layer (0–6 mm), the middle layer (7–12 mm), and the core layer (13–20 mm). As shown in the figure, all specimens underwent varying degrees of carbonation under the CO2 curing environment. In particular, specimens with higher biochar dosages and finer biochar particle sizes showed a more pronounced decrease in pH, indicating greater carbonation.
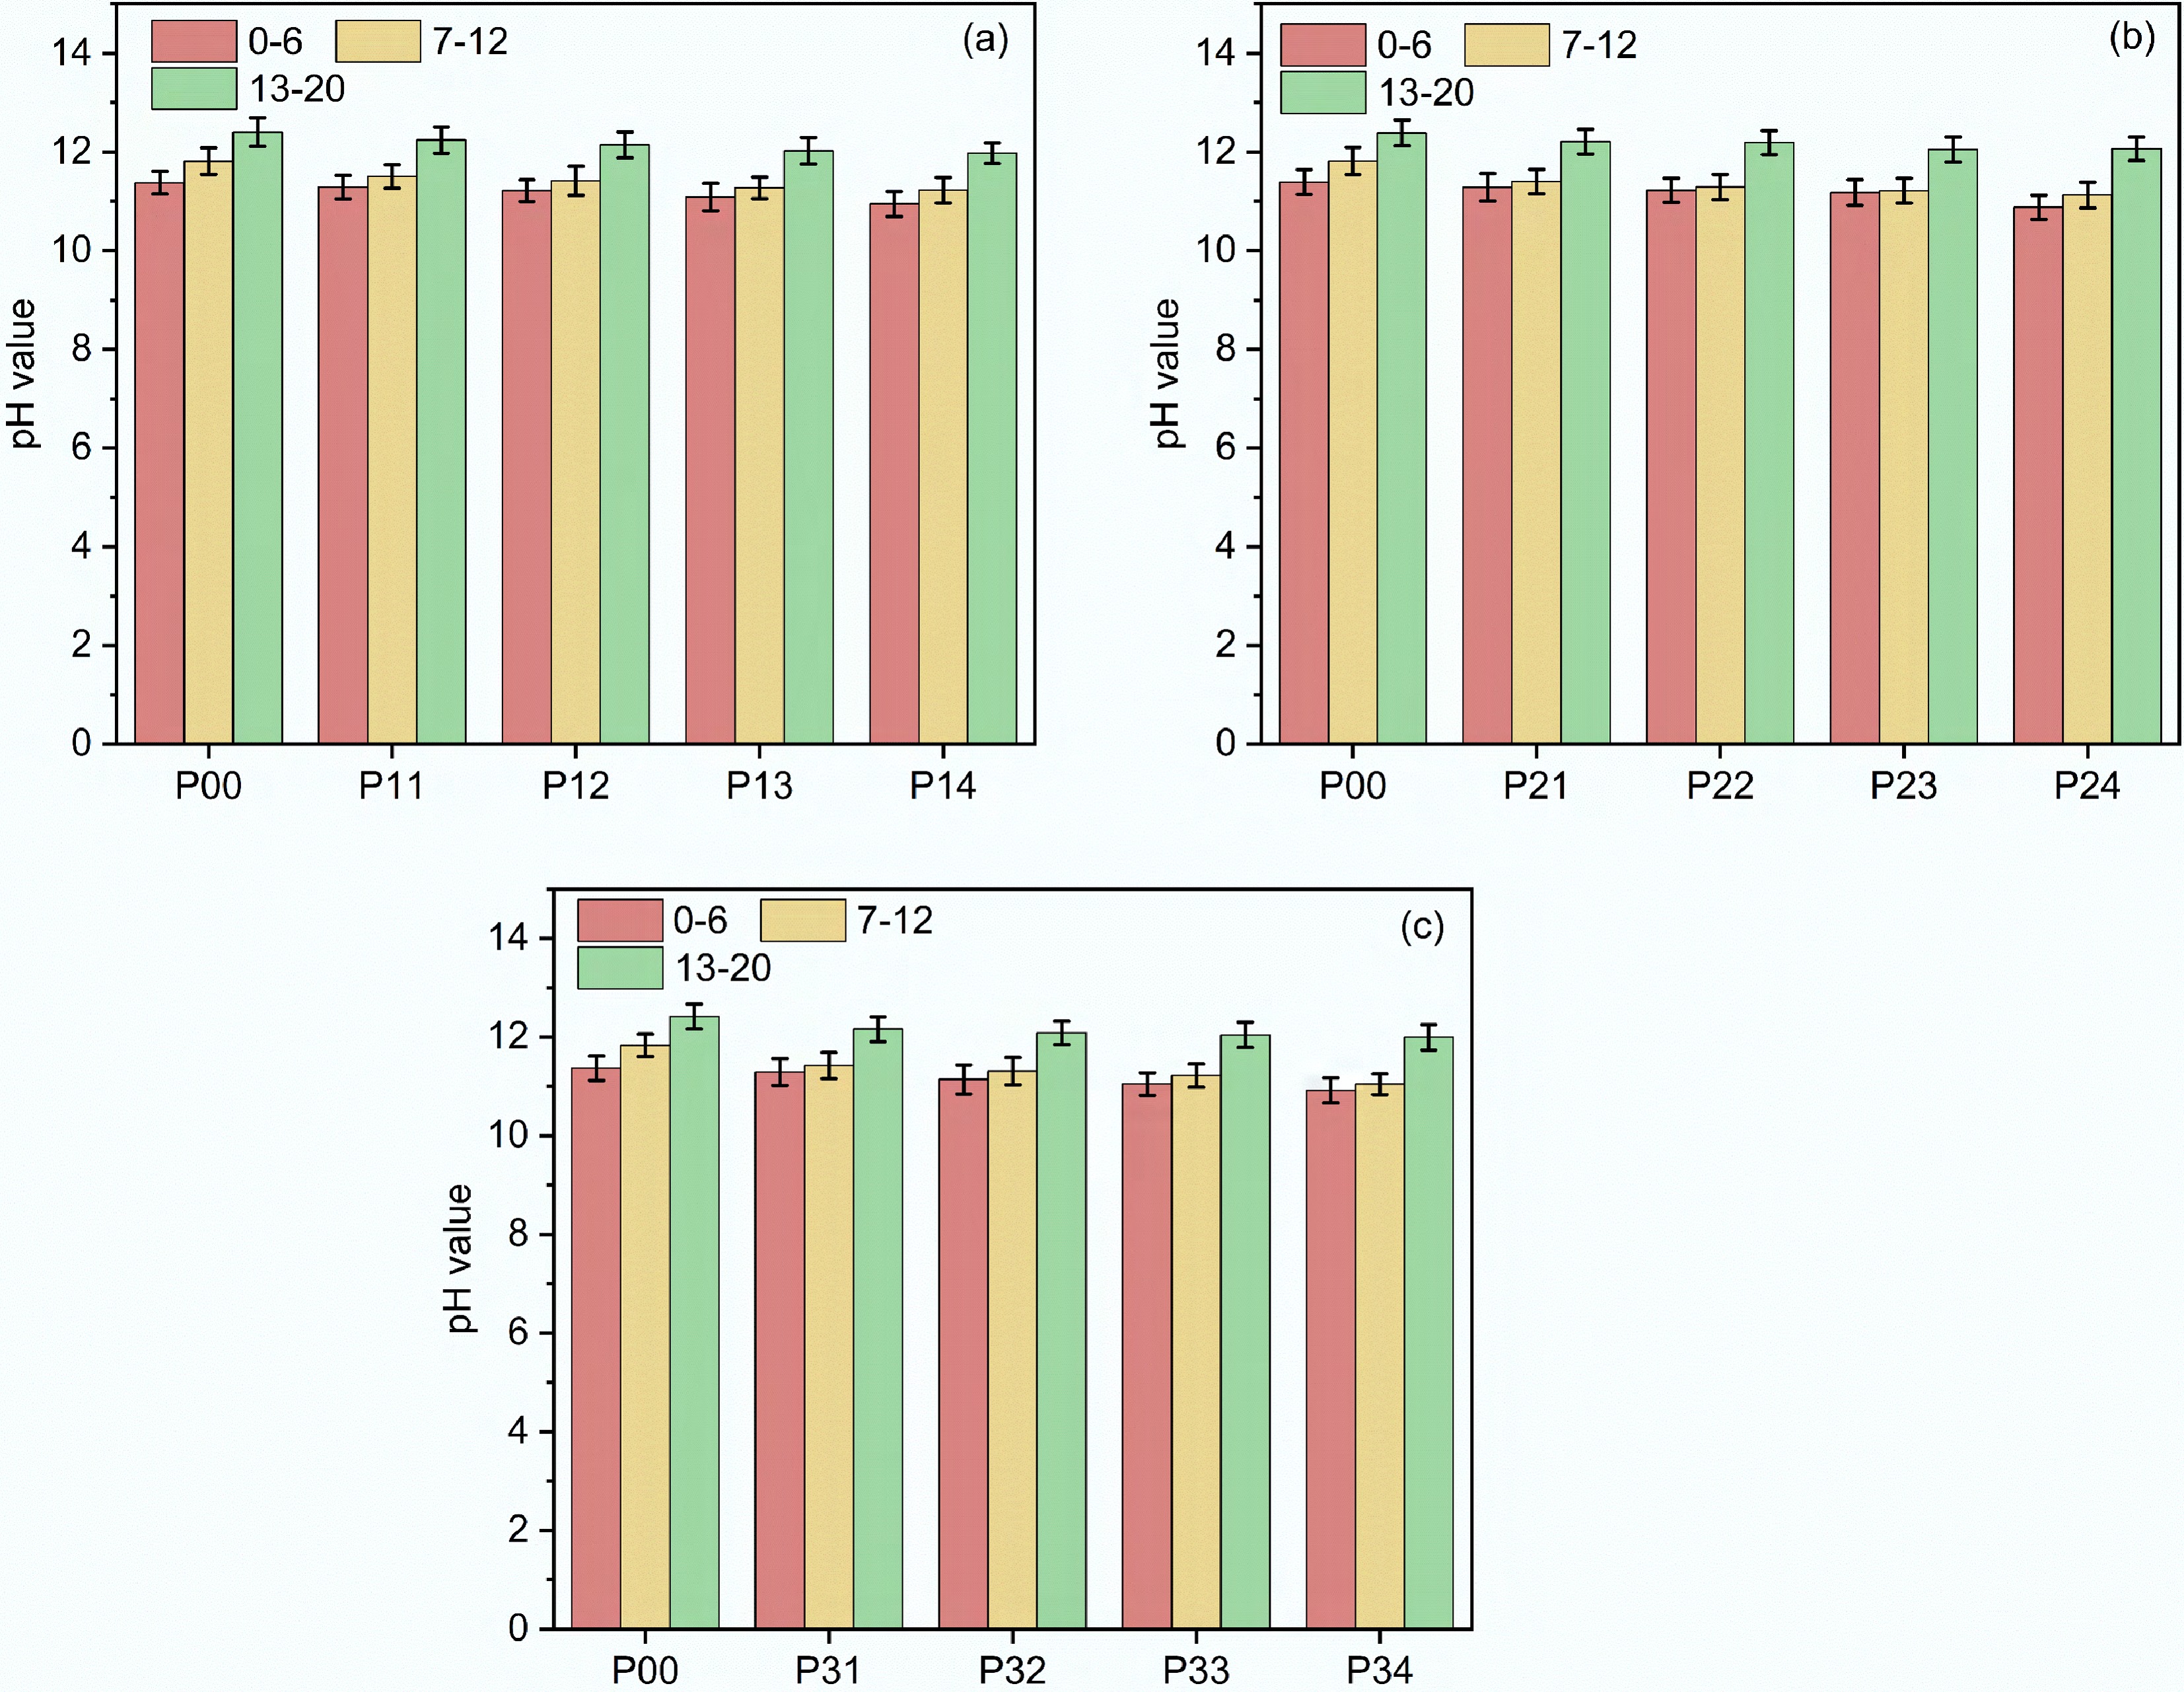
Figure 6.
Effect of biochar particle size and dosage on the pH value of the specimens: (a) 100 mesh; (b) 200 mesh; (c) 325 mesh.
From the pH distribution across the different layers of the specimens, an overall trend was observed: the surface layer had a lower pH than the middle and core layers. This is consistent with the carbonation path of CO2 diffusion from the exterior to the interior. The control group without biochar showed higher pH values across all layers than the biochar-containing specimens, indicating that biochar incorporation promoted carbonation. In particular, the P34 specimen showed the greatest decrease in pH value.
In addition, at the same dosage, the pH value continuously decreased as the biochar particle size increased from 100 to 325 mesh. This indicates that finer biochar, owing to its larger specific surface area, enhanced the physical adsorption capacity for CO2, thereby increasing the local CO2 concentration and strengthening the driving force for carbonation, which accelerated the conversion of Ca(OH)2. By providing additional diffusion pathways and adsorption sites, biochar promoted local CO2 enrichment, making it easier for CO2 to react with hydration products and ultimately form CaCO3, thereby resulting in a continuous decrease in pH.
The trend in pH value in the core region is also noteworthy. In the specimens with a high dosage of 4%, the core pH value was lower than that of the control group, indicating that a high biochar dosage not only accelerated surface carbonation but also promoted the diffusion and reaction of CO2 within the internal structure. This further confirms that biochar can improve pore structure and enhance CO2 diffusion efficiency, thereby achieving deeper carbonation.
In summary, the incorporation of biochar significantly enhanced the CO2 uptake capacity of NHL, with the effect more pronounced at higher dosage and finer particle size. The carbonation-promoting mechanisms of biochar include increasing CO2 adsorption capacity, enhancing the reactivity of hydration products, improving pore structure, and promoting the conversion of Ca(OH)2 to CaCO3, ultimately resulting in a systematic decrease in pH across all layers.
Porosity
-
Figure 7 shows the variation in porosity of the specimens before carbonation and after 3 d and 7 d of carbonation curing. Overall, the porosity of all specimens decreased with increasing curing time, indicating the gradual densification of the material structure.
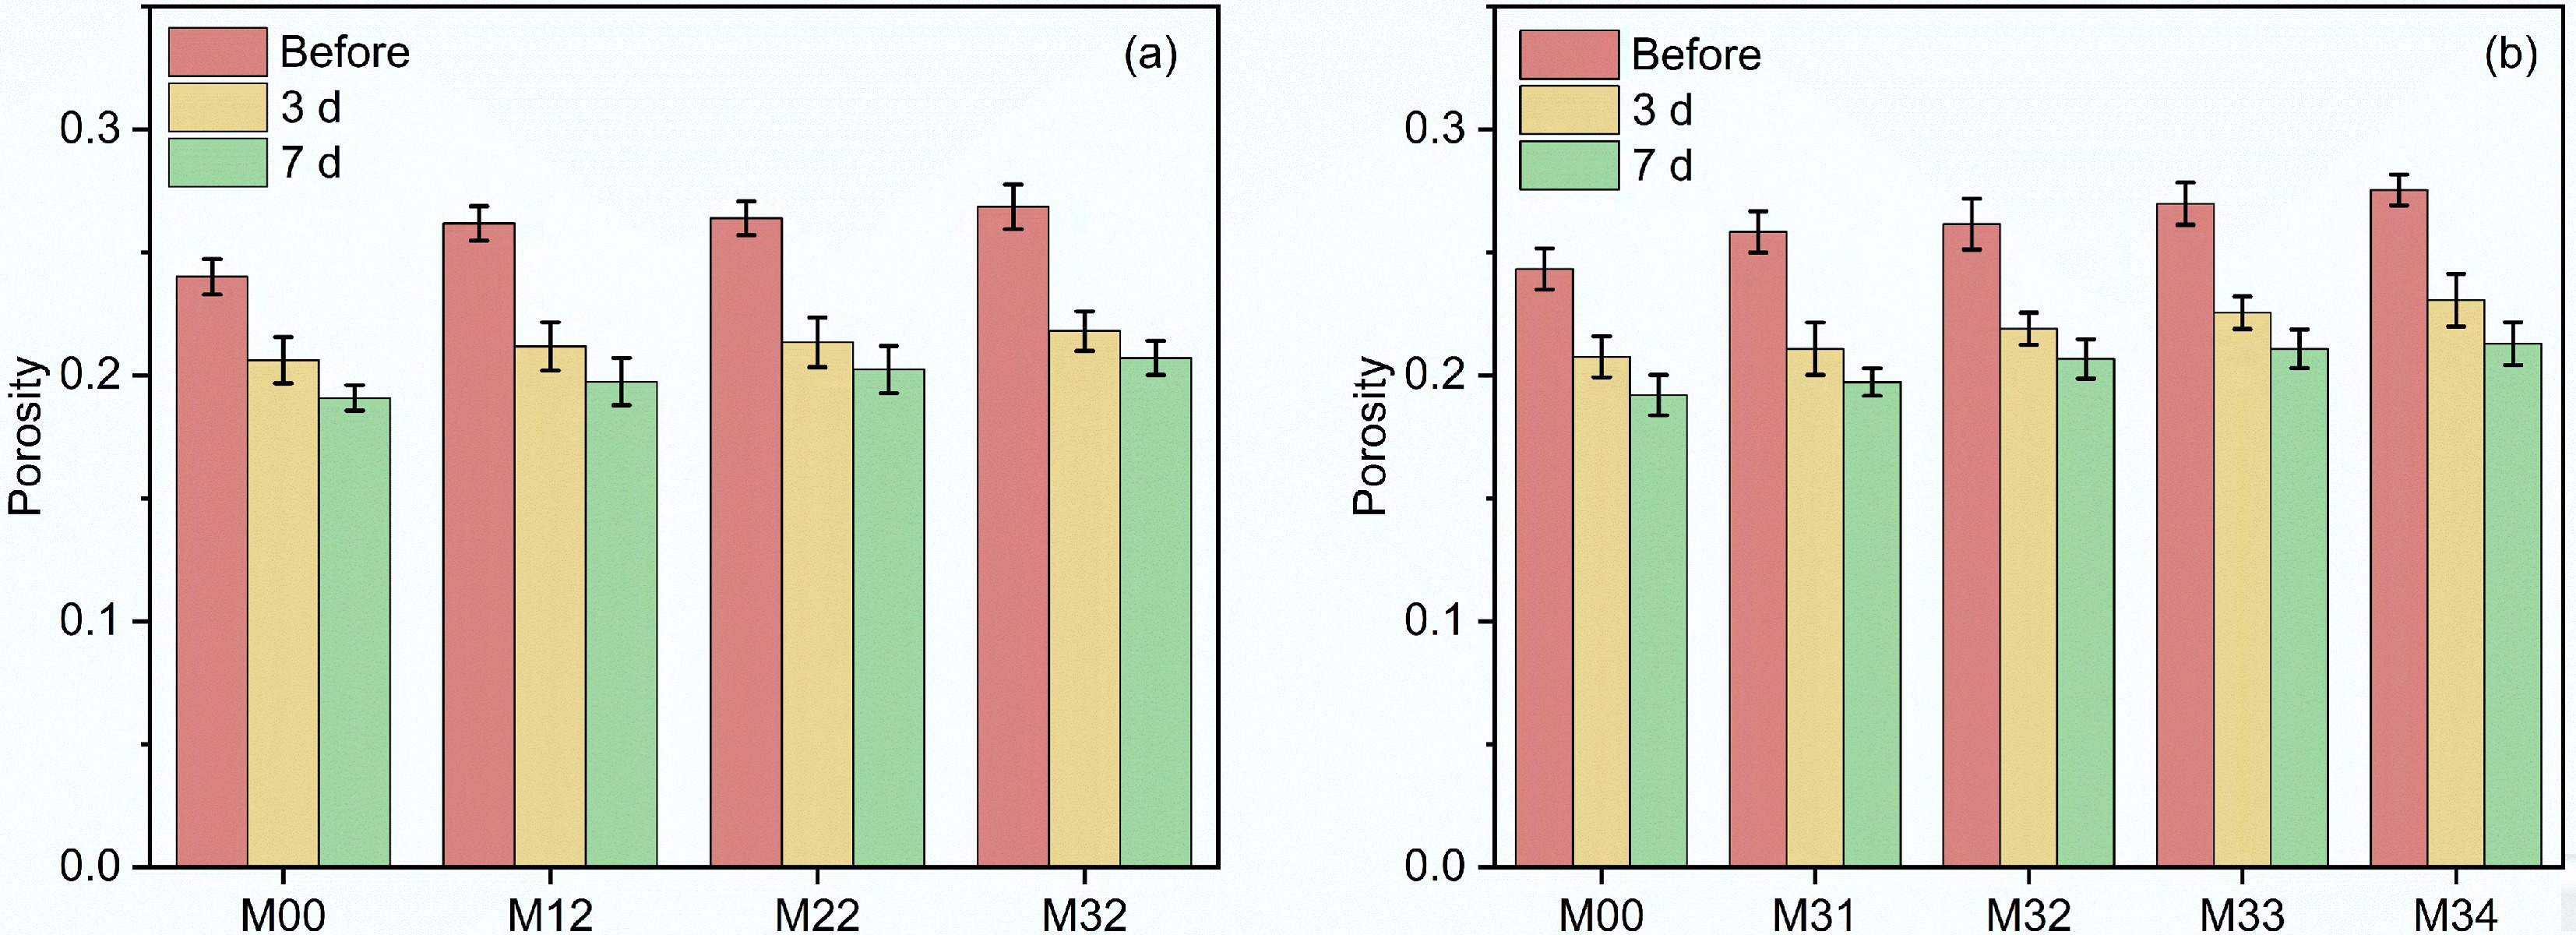
Figure 7.
Porosity of biochar-modified NHL composites: (a) effect of biochar particle size on porosity; (b) effect of biochar dosage on porosity.
Figure 7a illustrates the effect of biochar particle size on porosity. As the biochar particle size increased, the porosity of the specimens before carbonation and after 3 and 7 d of curing increased by up to 10.3%, 6.8%, and 9.1%, respectively, compared with the control group. Meanwhile, from before carbonation to 7 d of curing, the porosity of the specimens containing biochar with the finest particle size decreased by 5.9%, which was clearly higher than the 5.1% decrease observed in the control group, indicating that finer biochar could more effectively promote carbonation. Figure 7b shows the effect of biochar dosage on porosity. As the dosage increased, the porosity of the specimens before carbonation and after 3 and 7 d of curing increased by up to 13.7%, 12.3%, and 12.1%, respectively, relative to the control group. At the same time, from before carbonation to 7 d of curing, the porosity of the specimens with the highest biochar dosage decreased by 6.1%, which was also significantly higher than the 5.1% decrease in the control group. This further indicates that increasing the biochar dosage accelerates carbonation. The incorporation of biochar increased the porosity of the mortar to a certain extent, which may be related to the porous structure of biochar itself and the interfacial transition zone formed between biochar and the natural hydraulic lime matrix, resulting in a relatively looser pore structure[2].
Although increased porosity may adversely affect the long-term mechanical properties and durability of the material, it simultaneously provides more accessible pathways for CO2 diffusion, thereby promoting carbonation—particularly during the early curing stage. This trade-off between porosity and densification underscores the importance of optimizing biochar dosage and particle size. In summary, biochar particle size and dosage had significant regulatory effects on the pore structure of NHL mortar, and their dual influence on densification and mechanical performance should be carefully balanced during performance optimization.
Phase changes of the CO2 uptake cementitious materials after carbonation curing
XRD analysis
-
The XRD patterns and QXRD quantitative analysis results for NHL with different biochar dosages are shown in Fig. 8. Zinc oxide was used as the internal standard for QXRD, with a mass fraction of 10%. Figure 8a presents the XRD results. Initially, the main components in the system included Ca(OH)2, C2S, the amorphous phase, and a small amount of CaCO3. The amorphous phase mainly consisted of calcium silicate hydrate gel (C-S-H gel) formed during the hydration of C2S, together with a small amount of incompletely crystallized Ca(OH)2 and CaCO3. According to the XRD patterns, the carbonation product CaCO3 was mainly present in the form of calcite, and no other crystalline phases were detected. The diffraction peak of the potentially carbonatable phase Ca(OH)2 was located at 2θ = 34.1°, while the diffraction peaks of C2S were located between 32° and 33°, and the main diffraction peaks of the carbonation product calcite appeared at 2θ = 29.4° and 39.4°. As the carbonation reaction proceeded, Ca(OH)2 reacted with CO2 to form calcite, and the diffraction peak corresponding to Ca(OH)2 gradually weakened. At the same time, the intensities of the diffraction peaks of Ca(OH)2 and C2S decreased, whereas the intensity of the calcite diffraction peaks continuously increased.
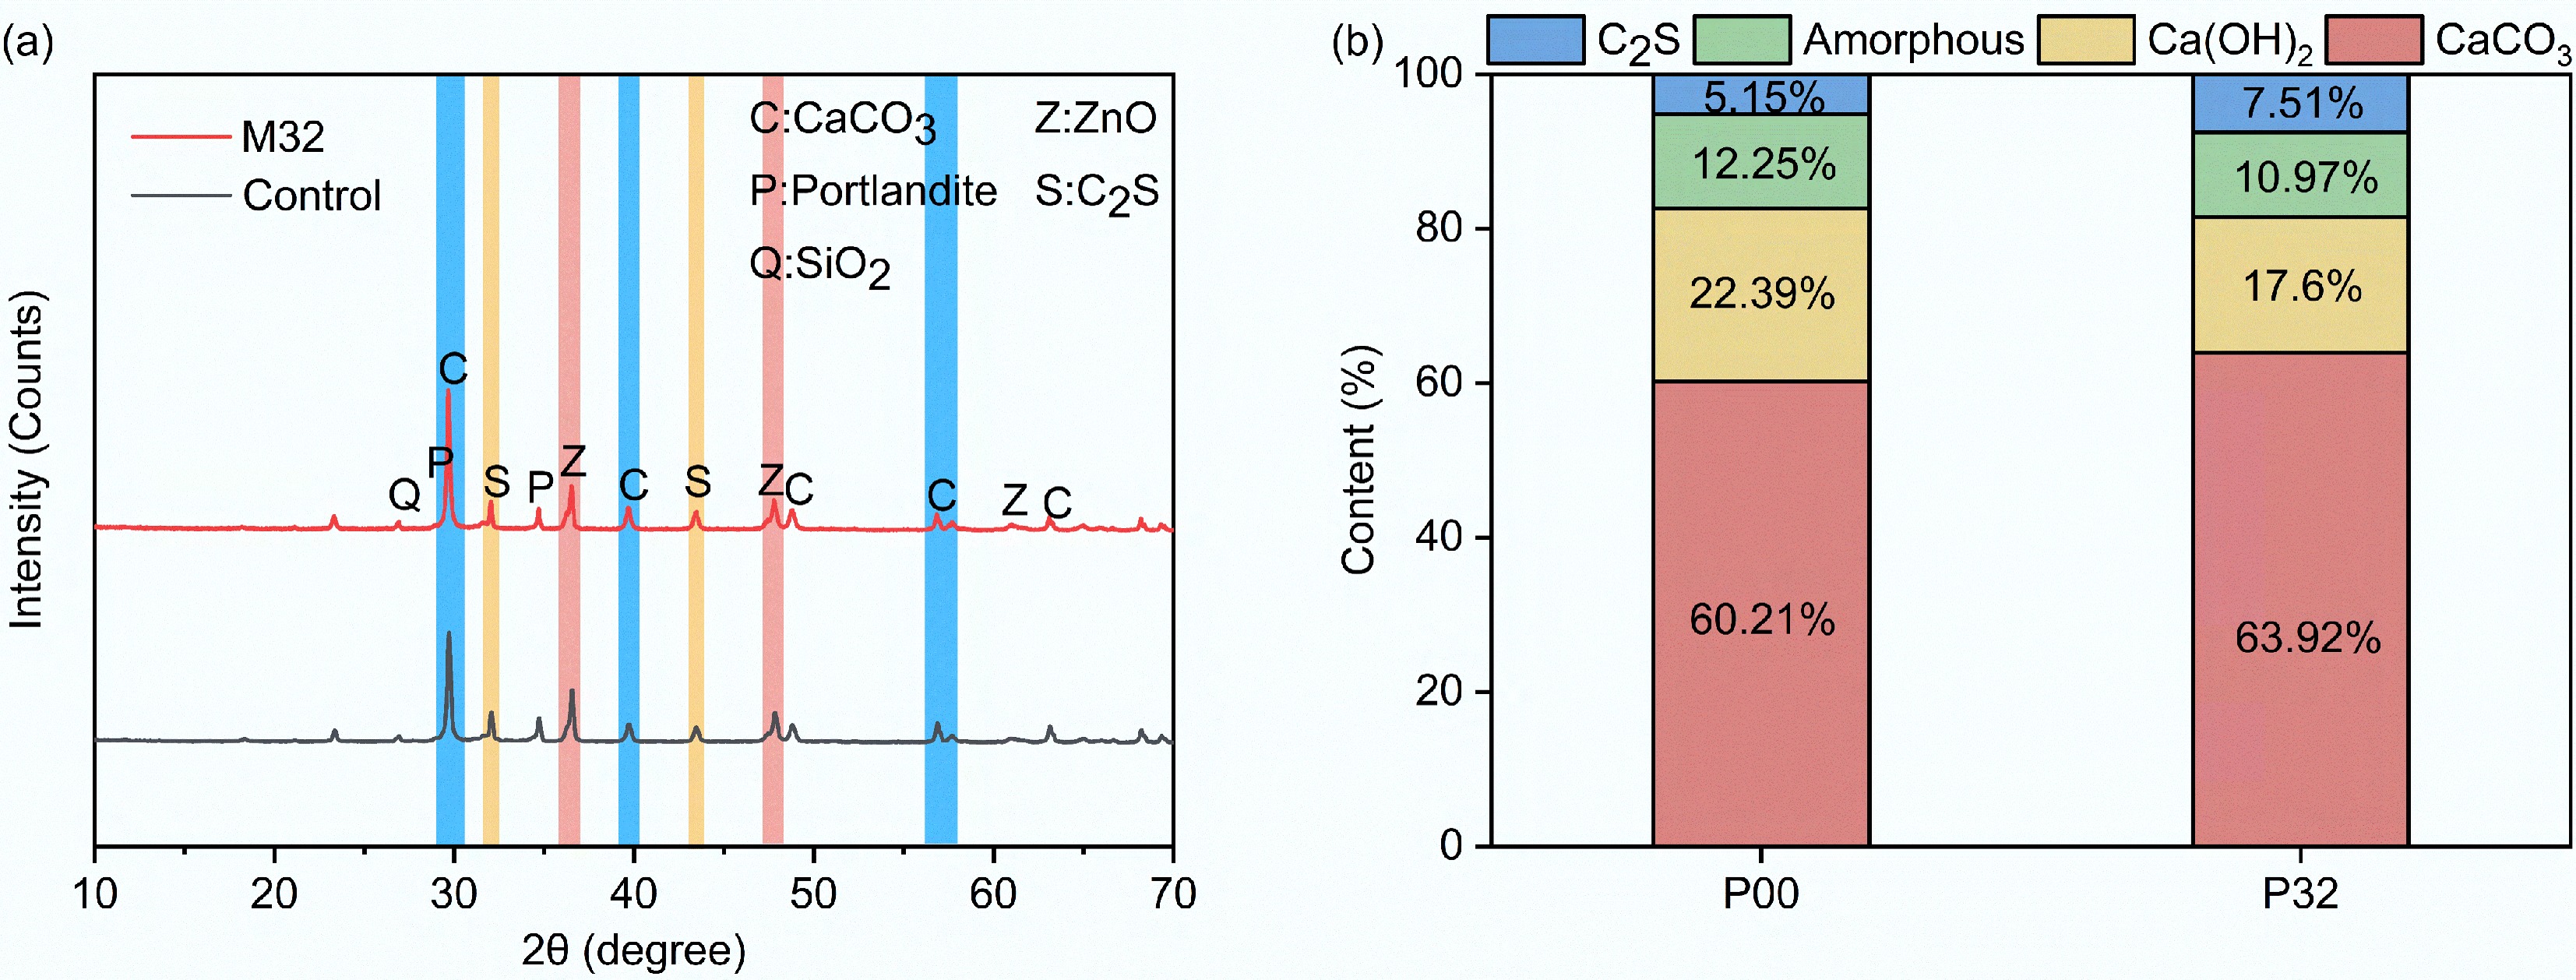
Figure 8.
XRD patterns of biochar-modified NHL composites: (a) XRD patterns; (b) phase assemblage diagram.
Figure 8b shows the quantitative QXRD results. With the addition of 2% biochar at 325 mesh, the CaCO3 content increased from 60.2% to 63.9%. The carbonation of Ca(OH)2, C2S, and calcium silicate hydrate gel in the system was accelerated by the incorporation of biochar, leading to greater CaCO3 formation. This indicates that the addition of biochar effectively enhanced CO2 adsorption and diffusion, thereby improving the carbonation efficiency and CO2 uptake capacity of NHL.
FTIR analysis
-
Figure 9 shows the FTIR spectra of the specimens containing 325-mesh biochar at 0% and 2% dosages after 24 h of carbonation. This analysis investigated the stretching vibrations of C–O bonds in calcium carbonate with different crystalline forms, as well as those of C–S–H and Si–O bonds in silica gel. As shown in the figure, both groups of specimens exhibited distinct characteristic absorption bands at 3,640, 3,441, 1,420, 991, and 875 cm−1, and in the low-wavenumber region. The absorption peak near 3,640 cm−1 can be assigned to the O–H stretching vibration in Ca(OH)2. The broad band near 3,441 cm−1 is mainly related to the O–H stretching vibration of adsorbed water or chemically bound water in the specimens. The characteristic absorption bands near 1,420, 875, and 712 cm−1 correspond to the asymmetric stretching vibration, out-of-plane bending vibration, and in-plane bending vibration of CO32−, respectively, which are typical characteristic absorption peaks of CaCO3[22]. The absorption peak near 991 cm−1 can be attributed to the Si–O stretching vibration, which is usually associated with silicate hydration products[34−36].
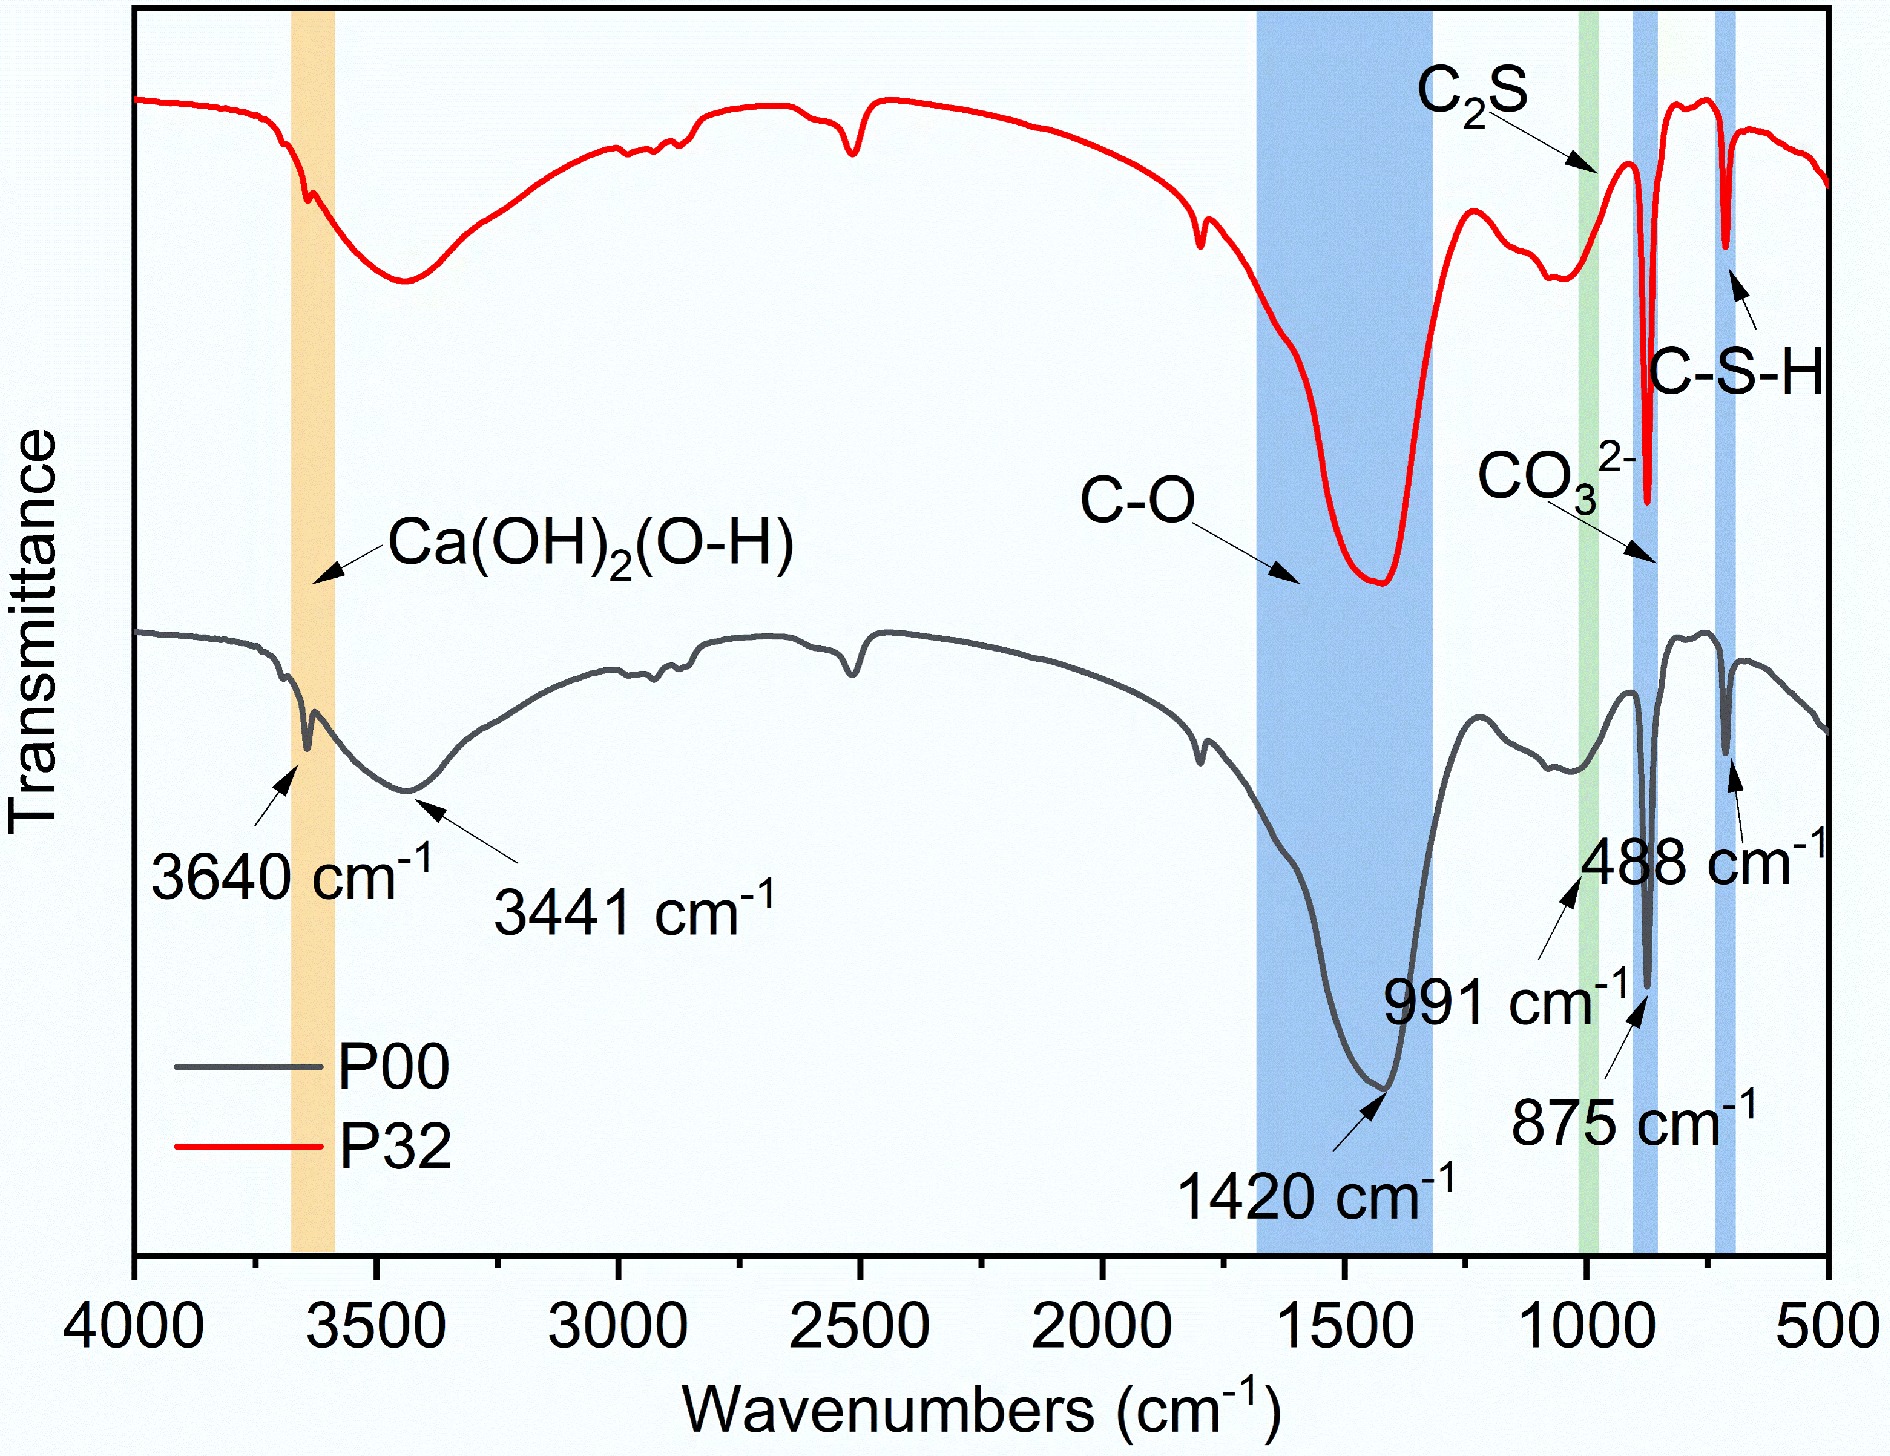
Figure 9.
FTIR spectra of biochar-modified NHL composites.
Compared with the control group, the P32 specimen containing 2% biochar at 325 mesh showed more obvious differences in spectral characteristics. First, the characteristic O–H absorption peak of Ca(OH)2 at 3,640 cm−1 was significantly weakened, indicating that the detectable calcium hydroxide content in the specimen decreased. Meanwhile, the carbonate characteristic peak near 1,420 cm−1 became stronger and more distinct, and the absorption peak near 875 cm−1 also showed an increasing trend. These changes indicate that the content of CaCO3-related products increased after biochar incorporation and that the carbonation reaction became more complete. Overall spectral changes indicated that the addition of biochar promoted the conversion of Ca(OH)2 to CaCO3, consistent with the XRD results.
In addition, near 991 cm−1, the absorption band of the P32 group was clearer than that of the control group, indicating a stronger vibrational response of Si–O bonds in this region. This peak is usually associated with C-S-H gel or other silicate-related structures[37], suggesting that, after the incorporation of an appropriate amount of biochar, not only did the generation of carbonate products increase, but the structures related to silicate hydration products inside the specimens may also have undergone certain changes. Combined with the changes in the characteristic absorption bands in the low-wavenumber region, it can be seen that while the carbonate peaks of the P32 group were enhanced, there was no obvious weakening of structural signals. This indicates that biochar at a dosage of 2% and a particle size of 325 mesh can promote the formation of carbonation products while still maintaining the internal structure of the material. From the FTIR perspective, this further demonstrates that biochar at this dosage improved the CO2 uptake capacity of natural hydraulic lime specimens, consistent with the results for mechanical performance improvement.
TGA analysis
-
The TG-DTG curves of the carbonated specimens are shown in Fig. 10. As can be seen, the TG-DTG curves exhibited three distinct mass-loss stages within the temperature range of 60–900 °C, corresponding to the decomposition or removal of different types of substances.
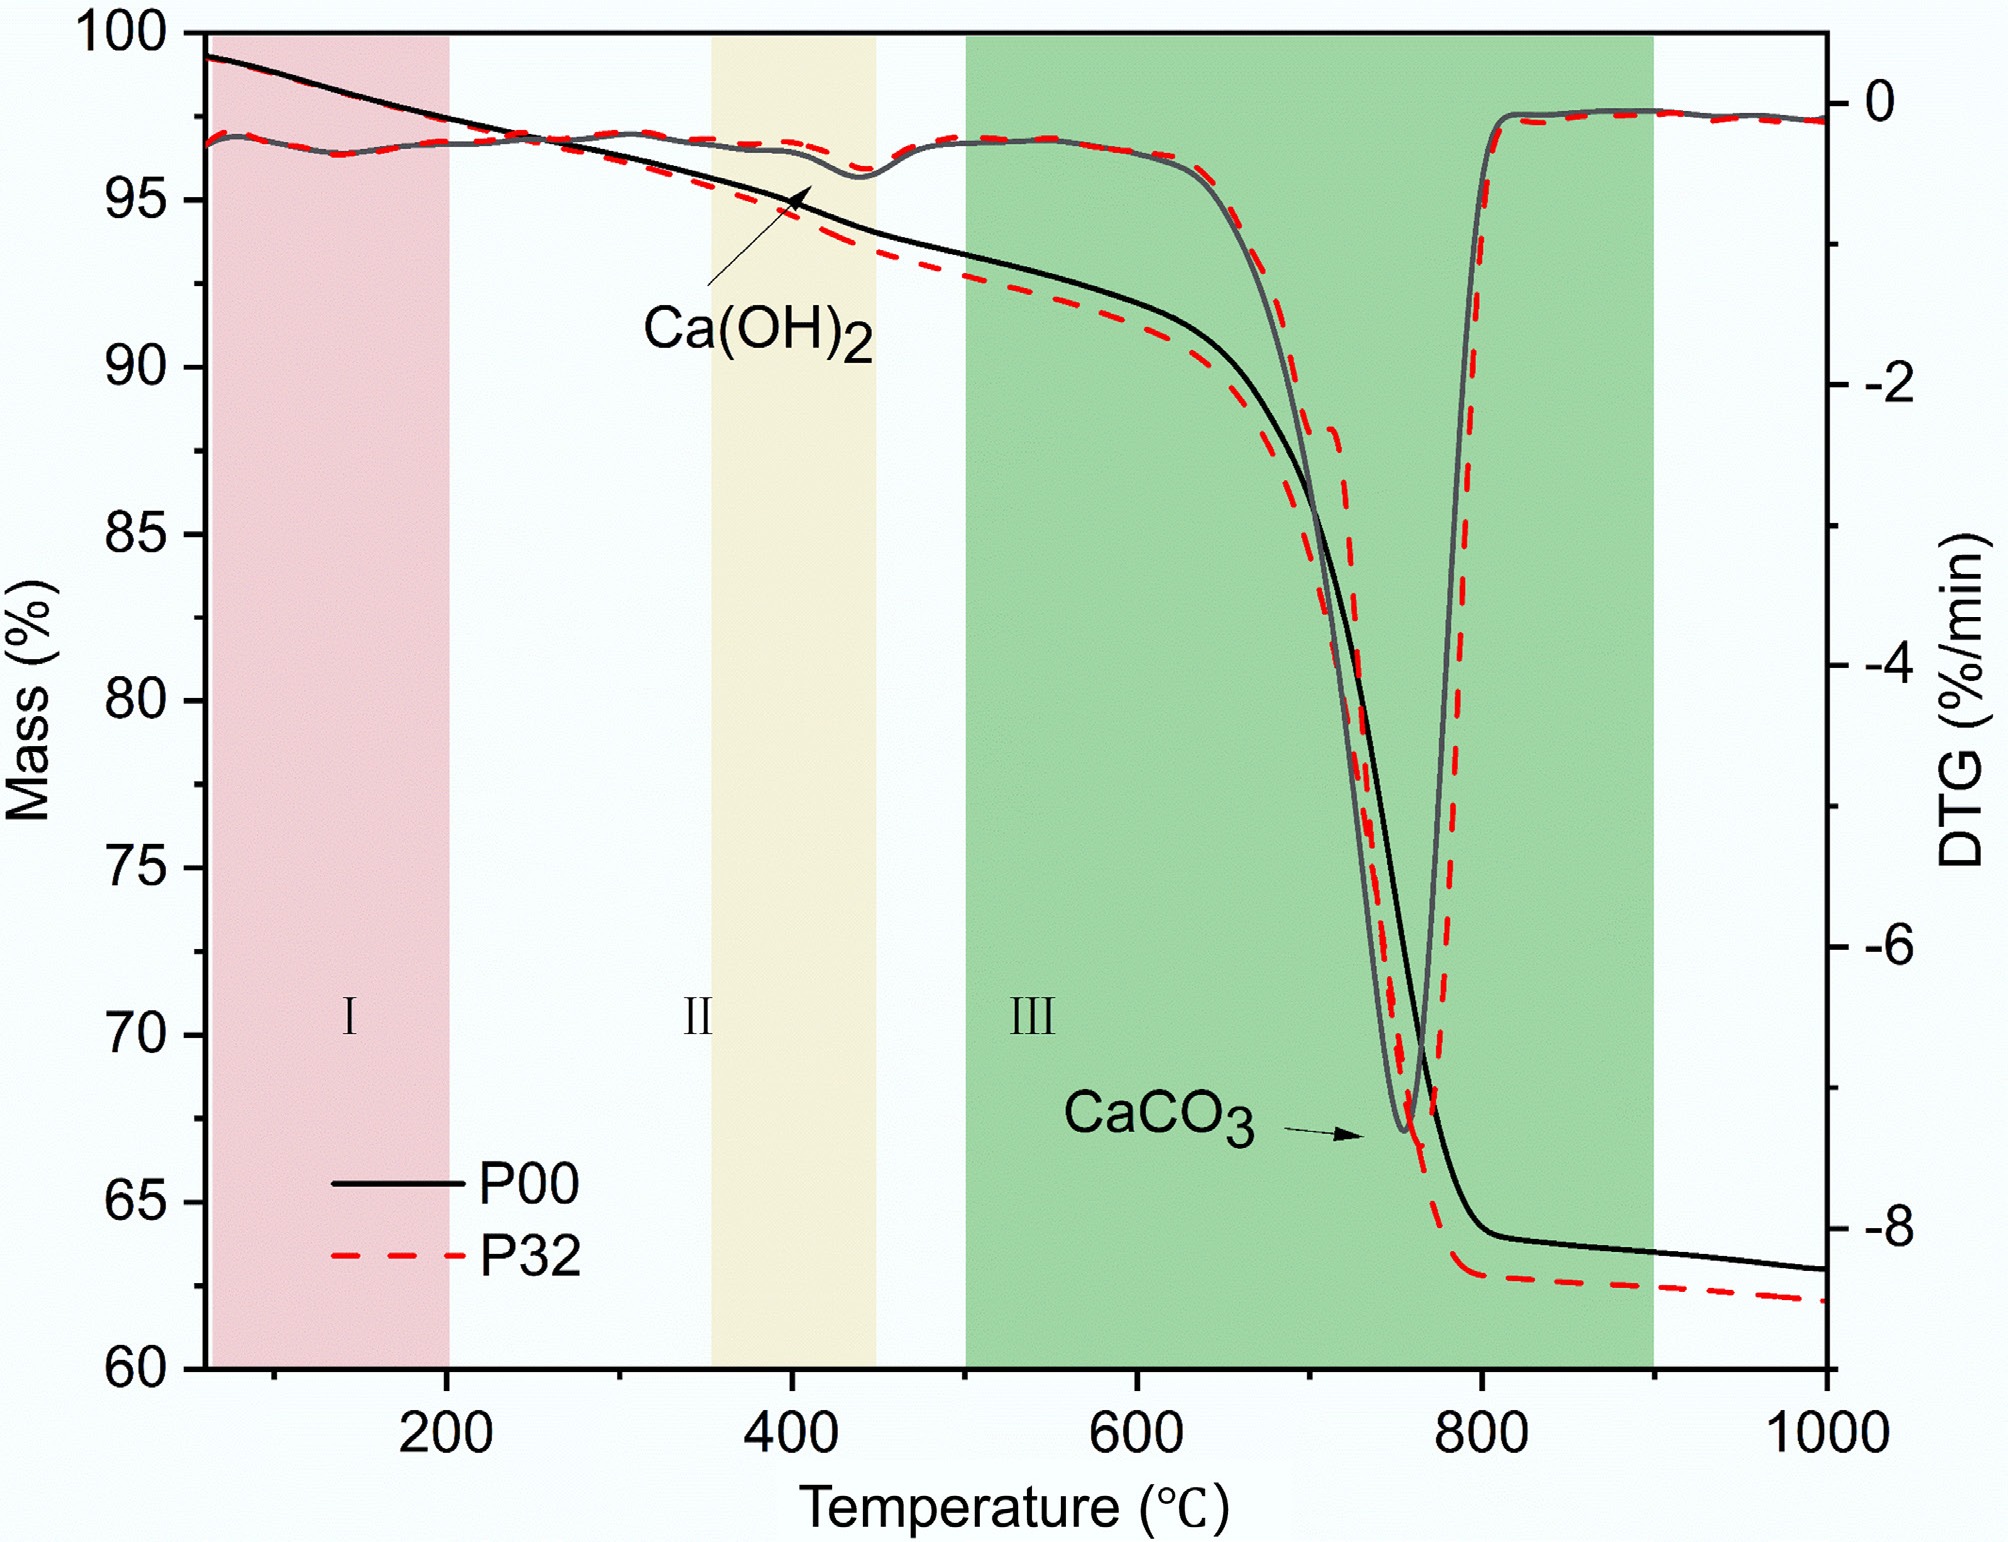
Figure 10.
TG-DTG curves of biochar-modified NHL composites.
The three characteristic mass-loss-rate peaks observed in the DTG curves indicate that the paste components underwent three major physical or chemical changes: (1) the mass loss in the range of 60–200 °C was mainly attributed to the evaporation of free water and the removal of adsorbed water and part of the bound water in hydration products such as C-S-H gel; (2) a distinct mass-loss-rate peak appeared in the range of 380–450 °C, corresponding to the dehydration decomposition of Ca(OH)2; and (3) the range of 500–900 °C corresponded to the thermal decomposition of CaCO3, among which 680–780 °C was associated with the decomposition of metastable calcium carbonate phases such as aragonite and vaterite, while 780–900 °C mainly corresponded to the decomposition of highly crystalline calcite, releasing CO2 and forming CaO. This was the most significant mass-loss stage.
The quantitative analysis results are listed in Table 4. Within the corresponding decomposition interval, the mass loss of sample P00 was 29.9%, corresponding to a CaCO3 content of 66.8%, whereas the mass loss of P32 further increased to 30.2%, with the CaCO3 content reaching 68.9%. The CaCO3 content of P32 was 3.1% higher than that of P00. At the same time, the Ca(OH)2 content of P32 was 24.4% higher than that of P00. These results indicate that, after incorporation of 2% 325-mesh biochar, both the hydration and carbonation reactions of the specimens were promoted to a certain extent, thereby favoring the formation and accumulation of CaCO3.
Table 4. Mineral composition calculated from TG analysis (%)
ID II mass
loss (%)Ca(OH)2
content (%)III mass
loss (%)CaCO3
content (%)P00 1.2 4.9 29.9 67.8 P32 1.5 6.1 30.2 68.7 It should be noted that there was a certain difference between the quantitative results obtained by QXRD and TG, which was mainly related to the different testing principles of the two methods[38]. QXRD quantifies crystalline phases based on diffraction peak intensities and is relatively limited in identifying amorphous and low-crystallinity phases. In contrast, TG is calculated from the mass loss of the sample within specific temperature ranges and can reflect the overall thermal decomposition characteristics of crystalline phases, as well as components with low crystallinity or amorphous decomposition. Therefore, for carbonates and hydration products with different degrees of crystallinity in this system, it is reasonable that some differences appeared between the values obtained by the two methods. However, the overall variation trends were consistent, and the two methods could mutually verify the phase evolution in the specimens.
Microstructural morphology analysis
-
The SEM results of the specimens are shown in Fig. 11. Figure 11a and b present the microstructural morphology of sample P00 after 3 d of carbonation, while Fig. 11c and d show the SEM-EDS characterization results of the specimen containing 325-mesh biochar at a dosage of 2%. Among the observed products, the plate-like phases can be identified as Ca(OH)2, the granular phases as CaCO3, and the needle- or rod-like phases as C-S-H gel. During carbonation curing, part of the hydration products and clinker particles reacted with CO2. The carbonation of clinker particles (C2S) and the hydration products (Ca[OH]2 and C-S-H gel) led to volume expansion, resulting in a significant reduction in the volume of large pores. Meanwhile, the newly formed CaCO3 particles with smaller sizes could more effectively fill the microvoids, thereby significantly promoting the densification and refinement of the pore structure. As expected, Fig. 11b shows that more plate-like Ca(OH)2 was present in the paste of the control group, whereas more CaCO3 was formed in the biochar-containing specimen, as shown in Fig. 11d. The paste in Fig. 11d exhibits a noticeably denser microstructure compared with that in Fig. 11b, indicating a higher degree of carbonation in the biochar-containing specimen. This is consistent with the greater CaCO3 content quantified by QXRD and TGA. Since CaCO3 has a larger molar volume than Ca(OH)2, its formation during carbonation contributes to pore filling and microstructural densification, which aligns with the improved compressive strength observed at the macroscopic scale.
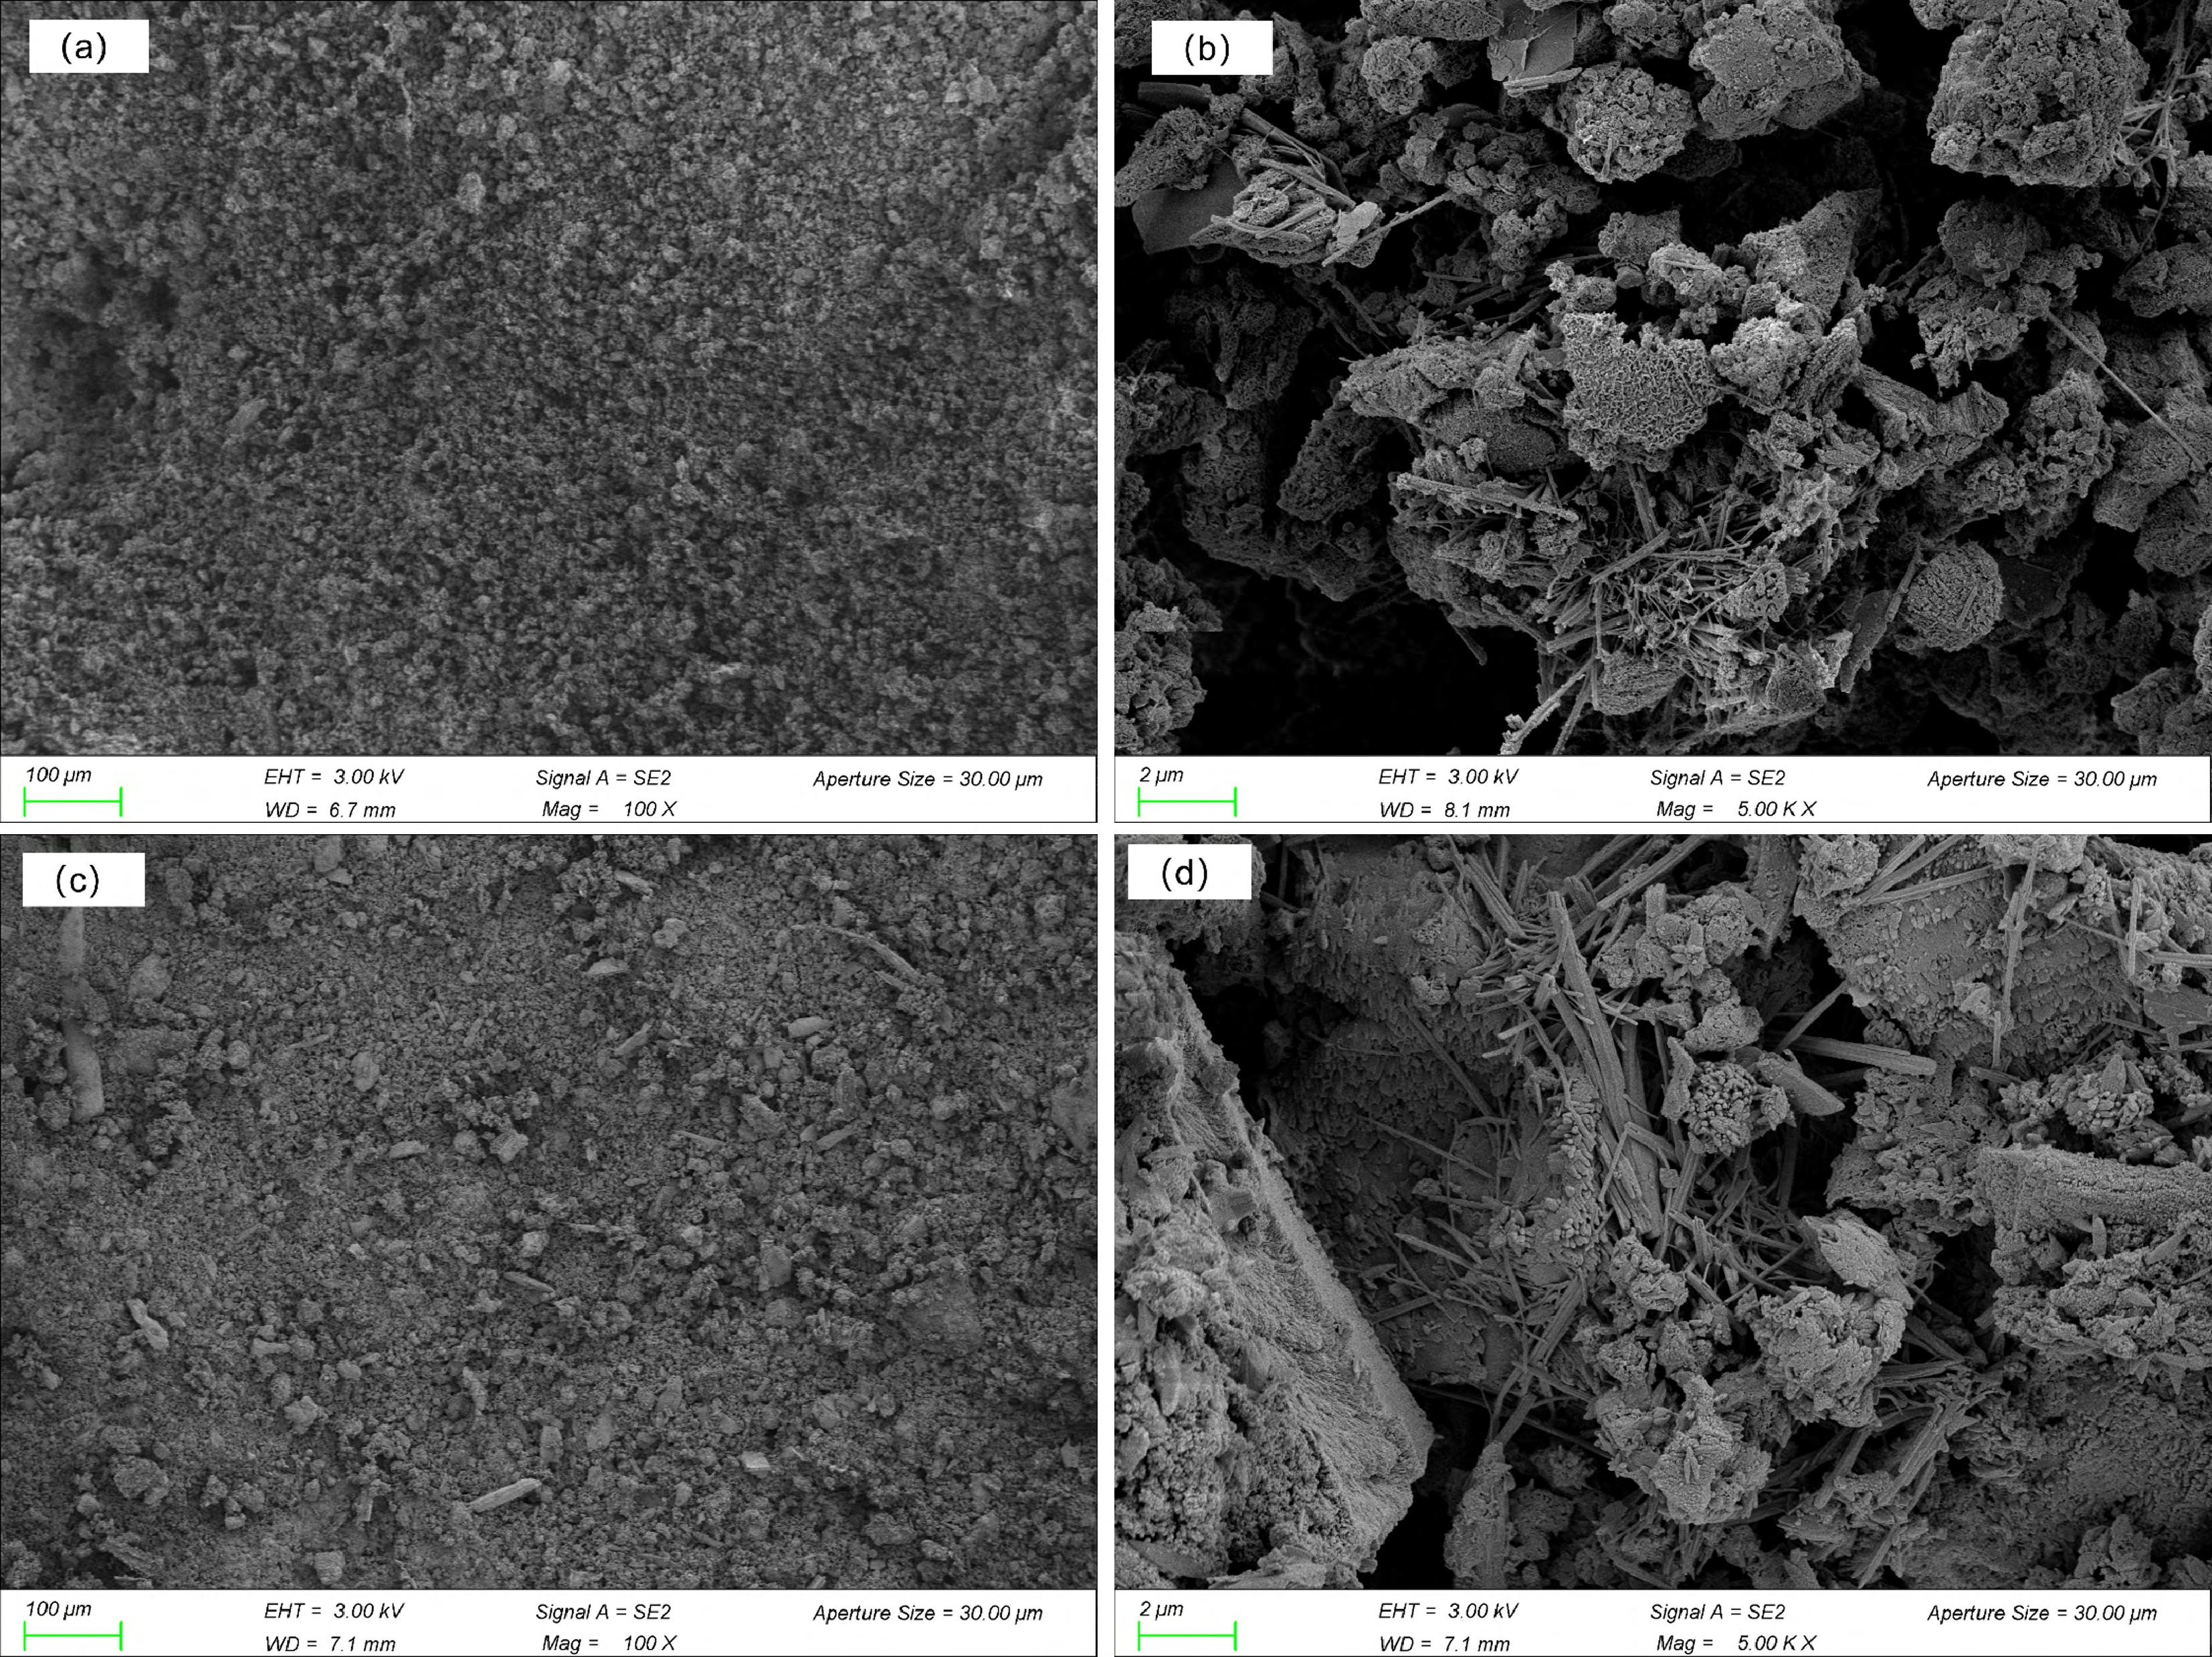
Figure 11.
SEM images of biochar-modified NHL composites: (a) P00 ×100; (b) P00 × 5,000; (c) P32 × 100; and (d) P32 × 5,000.
Figure 12 illustrates the mechanism by which biochar influences the CO2 uptake behavior of NHL. The incorporation of biochar mainly affects the transport and reaction of CO2 within the specimens during the early stage of carbonation. The possible mechanisms can be summarized as follows. (1) Accelerating internal CO2 enrichment. Due to its large specific surface area and loose pore structure, biochar can exert physical adsorption on CO2 during the early curing stage, facilitating the formation of a relatively CO2-enriched environment within the specimens[39]. (2) Enhancing transport pathways. Its porous structure provides pathways for gas diffusion and, to a certain extent, for the migration of reaction media, and can connect with capillary pores or larger pores in the NHL system, thereby promoting pore connectivity and facilitating the transport of CO2 into the interior of the specimens[30]. (3) Regulating carbonation kinetics. Because incorporating biochar increases the contact opportunities between the carbonatable reactants and CO2, the carbonation reaction is accelerated, promoting rapid CaCO3 formation at the early stage. As CaCO3 particles continue to form, their pore-filling effect becomes increasingly pronounced, accompanied by a volumetric effect that densifies the material's internal structure. This process is consistent with the increase in CaCO3 content and the densification of the microstructure observed in the SEM results.
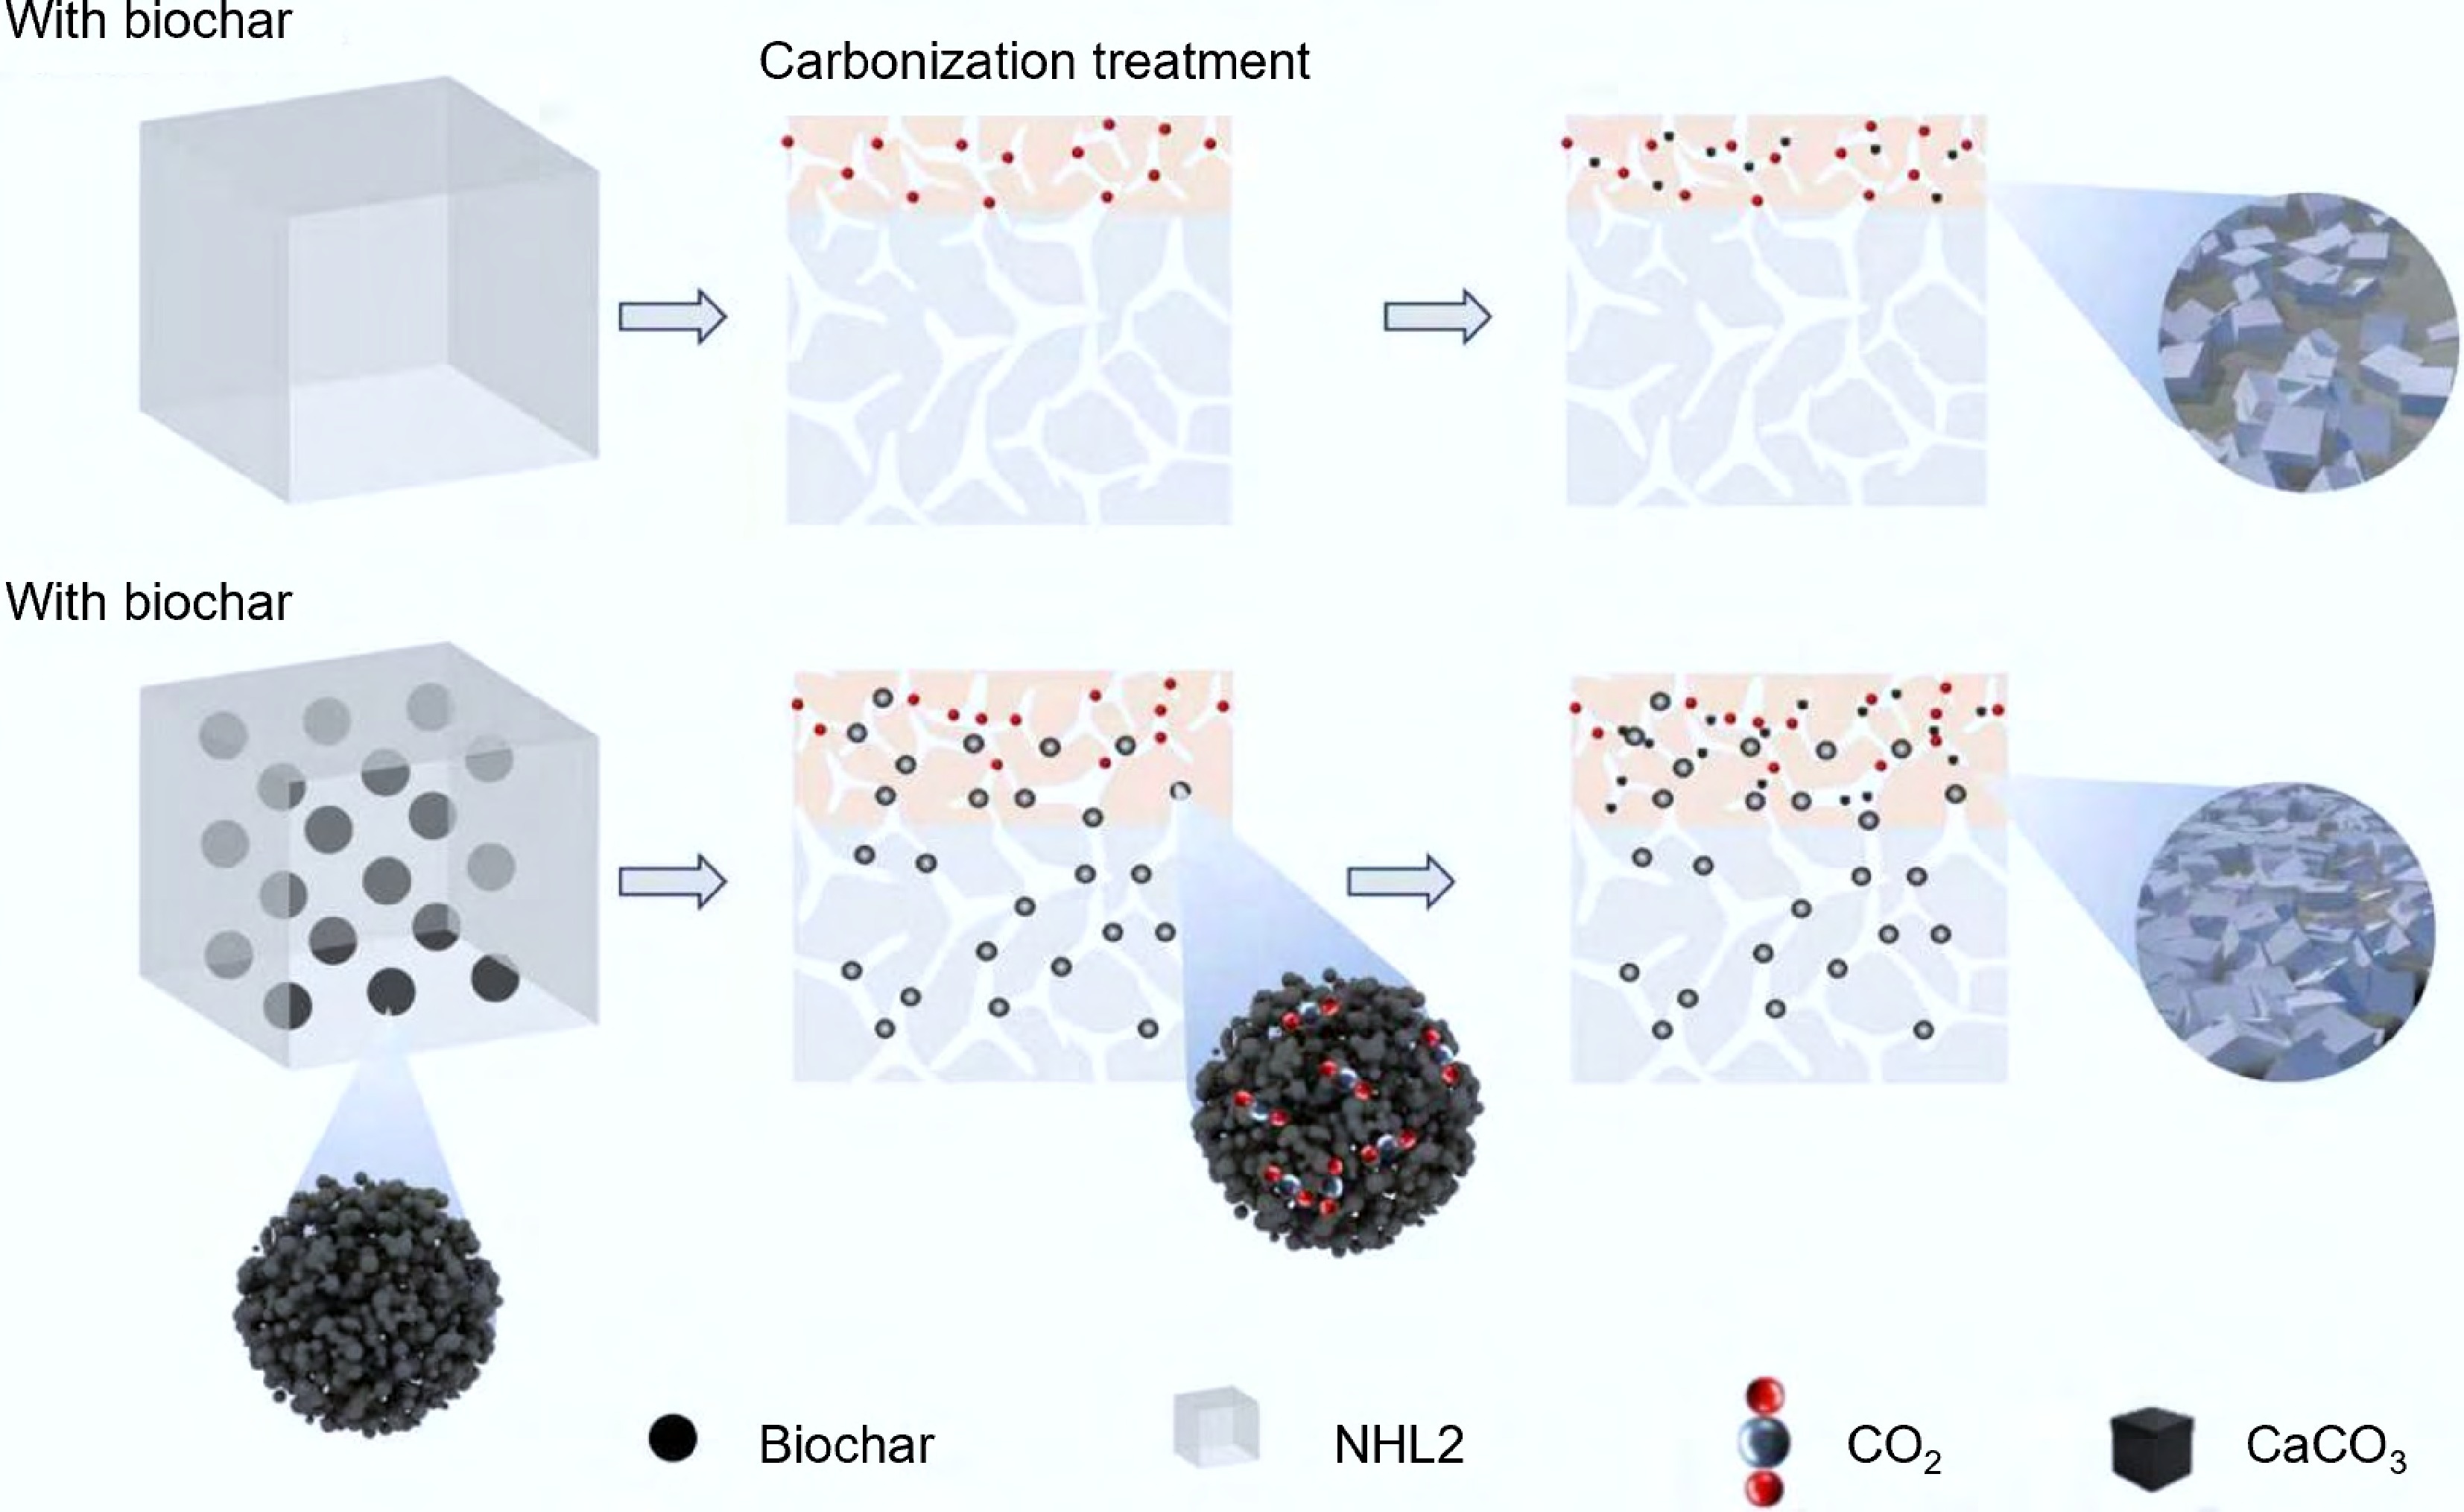
Figure 12.
Schematic diagram of the mechanism of biochar on the CO2 uptake behavior of NHL.
The above regulatory effects may vary with biochar dosage and particle size. An excessively high dosage may enlarge the pore structure and weaken the carbonation's densification effect. Biochar with a relatively coarse particle size may lead to rapid pore filling, thereby reducing the transport effect. These aspects still need to be further clarified in future studies.
-
To further improve the CO2 uptake performance of NHL, biochar with varying dosages and particle sizes was used as an additive in this study, and its effects on CO2 uptake and the mechanical properties of NHL were investigated. The macroscopic properties of NHL were characterized by CO2 uptake kinetics, pH measurement, compressive strength, and saturated water porosity tests. Combined with microstructural characterization methods such as QXRD, TGA, and FTIR, the mechanism of biochar was analyzed from the perspectives of phase composition, apparent morphology, and pore structure. Based on the results of this study, the following conclusions can be drawn:
(1) The particle size and dosage of biochar have significant effects on the mechanical properties of NHL. As the biochar particle size increased, the compressive strength of the NHL specimens gradually increased. At dosages above 2%, the strengthening effect of biochar on mechanical properties gradually decreased. At a particle size of 325 mesh and a dosage of 2%, the compressive strength of the biochar-modified NHL at 3, 7, and 28 d increased by 35.7%, 42.1%, and 10.9%, respectively, compared with the control group.
(2) Biochar can improve the CO2 uptake performance of NHL. As the biochar dosage increased, the CO2 uptake rate and CO2 uptake amount of the modified NHL were significantly enhanced. At a dosage of 2%, the CO2 uptake amount of the modified NHL at 6 and 24 h increased by 14.6% and 11.9%, respectively, while the CO2 uptake rate increased by 3.2%.
(3) Biochar optimizes the interaction between NHL and CO2 by enhancing CO2 transport pathways, accelerating local CO2 enrichment, and regulating carbonation kinetics. Biochar increased the porosity of NHL before carbonation, promoted the formation of calcium carbonate, and densified the microstructure after carbonation.
The results of this study deepen the understanding of the effects of different types of biochar on the hydration and carbonation processes in NHL and provide useful insights for the rational application of biochar in NHL. Since relatively few environmental factors affecting CO2 uptake were considered in this study, further investigation is needed to broaden the understanding of biochar-modified NHL.
-
This work represents the authors' own intellectual contribution, and no AI tool has been used.
-
The authors confirm their contributions to the paper as follows: Hao Zhang: data curation, formal analysis, writing – original draft; Jiangtao Qu: validation, writing – review and editing; Yue Gu: conceptualization, funding acquisition, resources, supervision; Yikun Li: investigation, software; Ao Li: software, validation, visualization; Zhenhua Wei: methodology, writing – review and editing, funding acquisition, resources. All authors have read and agreed to the published version of the manuscript.
-
The datasets generated during and/or analyzed during the current study are available from the corresponding author on reasonable request.
-
This work was supported by the Natural Science Foundation of Jiangsu Province (Grant No. BK20231464) and the National Natural Science Foundation of China (Grant No. 52471288).
-
The authors declare that they have no known competing financial interests or personal relationships that could have influenced the work reported in this paper.
-
Full list of author information is available at the end of the article.
- Copyright: © 2026 by the author(s). Published by Maximum Academic Press, Fayetteville, GA. This article is an open access article distributed under Creative Commons Attribution License (CC BY 4.0), visit https://creativecommons.org/licenses/by/4.0/.
-
About this article
Cite this article
Zhang H, Qu J, Gu Y, Li Y, Li A, et al. 2026. Influence of biochar dosage and particle size on CO2 uptake and mechanical properties of natural hydraulic lime. Biochar X 2: e017 doi: 10.48130/bchax-0026-0017 

Influence of biochar dosage and particle size on CO2 uptake and mechanical properties of natural hydraulic lime
- Received: 28 March 2026
- Revised: 19 May 2026
- Accepted: 29 May 2026
- Published online: 04 June 2026
Abstract: As an environmentally friendly, carbon-negative porous material, biochar has shown potential to improve the CO2 uptake performance of cement-based materials. However, its effectiveness in natural hydraulic lime (NHL) remains unclear. This study investigated the effects of biochar particle size and dosage on the CO2 uptake and mechanical properties of NHL. Combined with microscopic analyses including quantitative X-ray diffraction (QXRD), Fourier-transform infrared spectroscopy (FTIR), and thermogravimetric analysis (TGA), the effects of biochar on the microstructure, phase composition, and morphology of NHL were further elucidated. The results showed that biochar with a particle size of 325 mesh at a dosage of 2% achieved the best overall performance. Compared with the control group, the compressive strength of the modified NHL increased by 35.7% at 3 d and 10.9% at 28 d. The CO2 uptake of the modified NHL increased by 14.6% at 6 h and 11.9% at 24 h, while the CO2 uptake rate increased by 3.2%. Biochar optimized the interaction between NHL and CO2 by enhancing CO2 transport pathways, accelerating local CO2 enrichment, and regulating carbonation kinetics. This study provides new insights into the application of biochar in NHL and enhances NHL's potential for use in heritage building restoration and green, antique-style construction.
-
Key words:
- Biochar /
- Natural hydraulic lime /
- CO2 uptake /
- Heritage building restoration