-
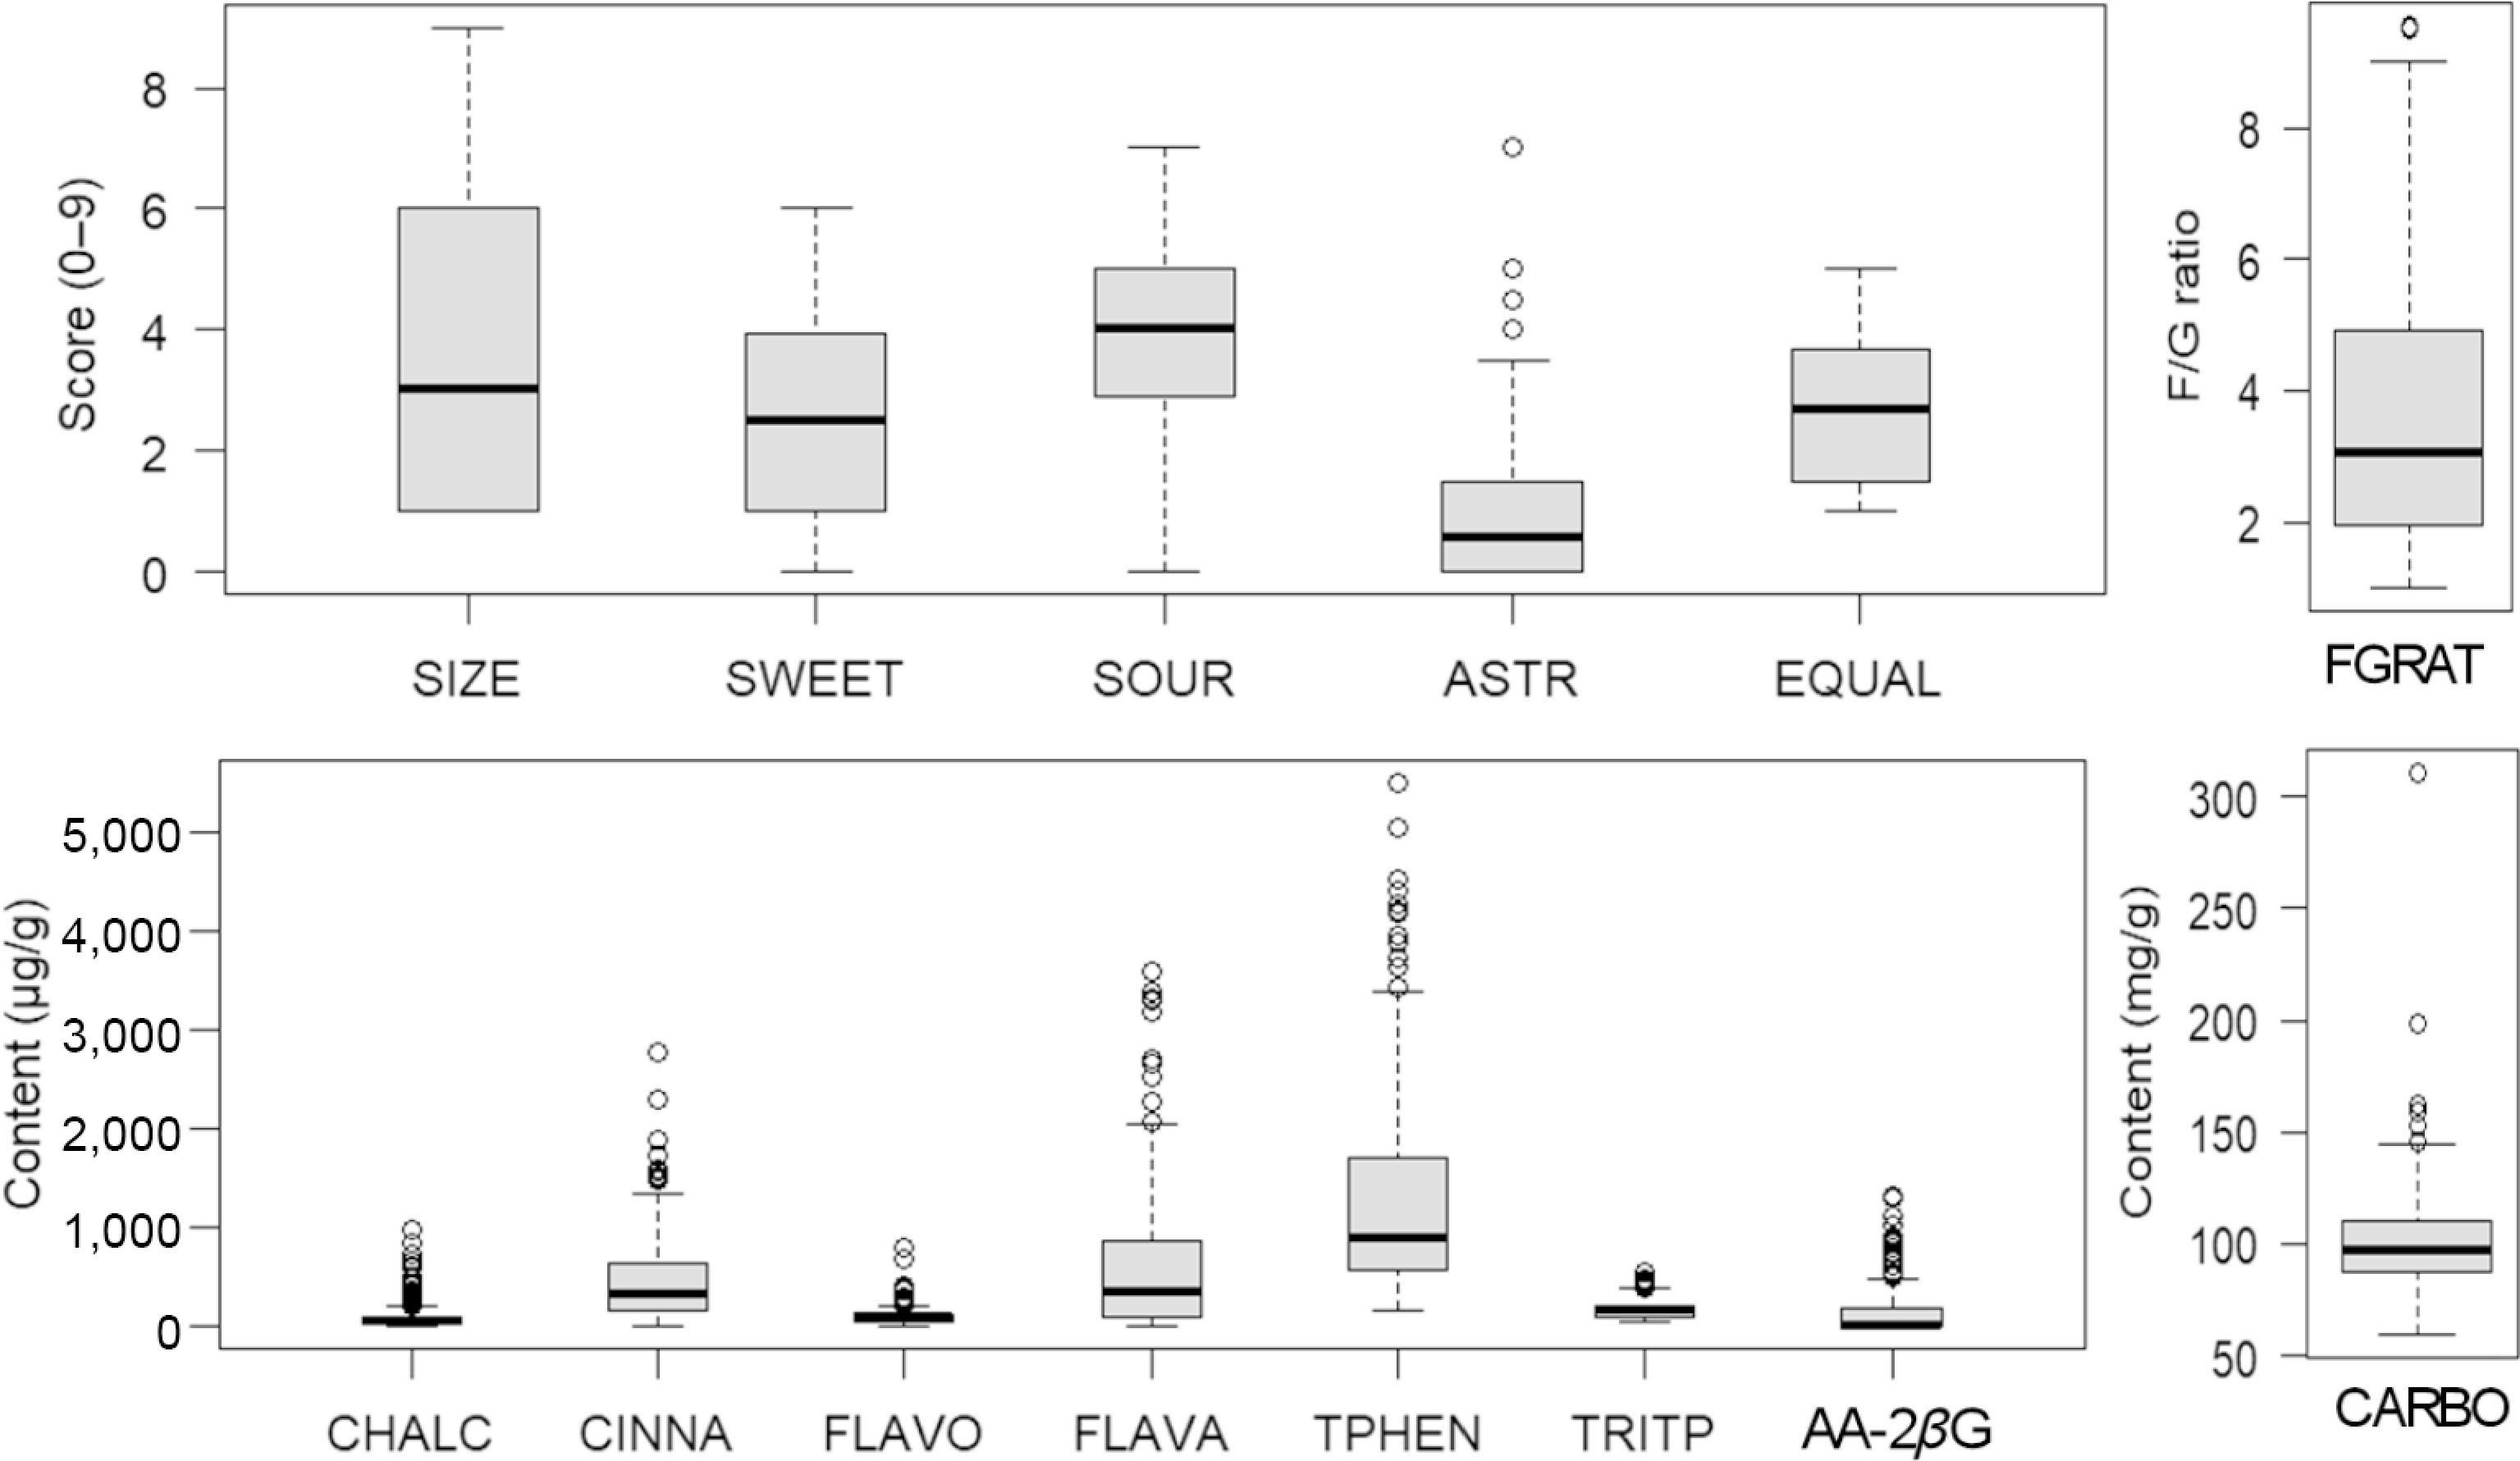
Figure 1.
Range and distribution of the content of phytochemicals (CHALC: chalcones, CINNA: cinnamic acids, FLAVO: flavonols, FLAVA: flavanols, TPHEN: total phenolics, TRITP: triterpenoids, AA-2βG: ascorbic acid 2-beta-glucoside), sensory traits (SIZE: fruit size, SWEET: sweetness, SOUR: sourness, ASTR: astringency, EQUAL: eating quality), and sugars (CARBO: carbohydrates, FGRAT: fructose–glucose ratio) in the fruits from all apple seedlings.
-
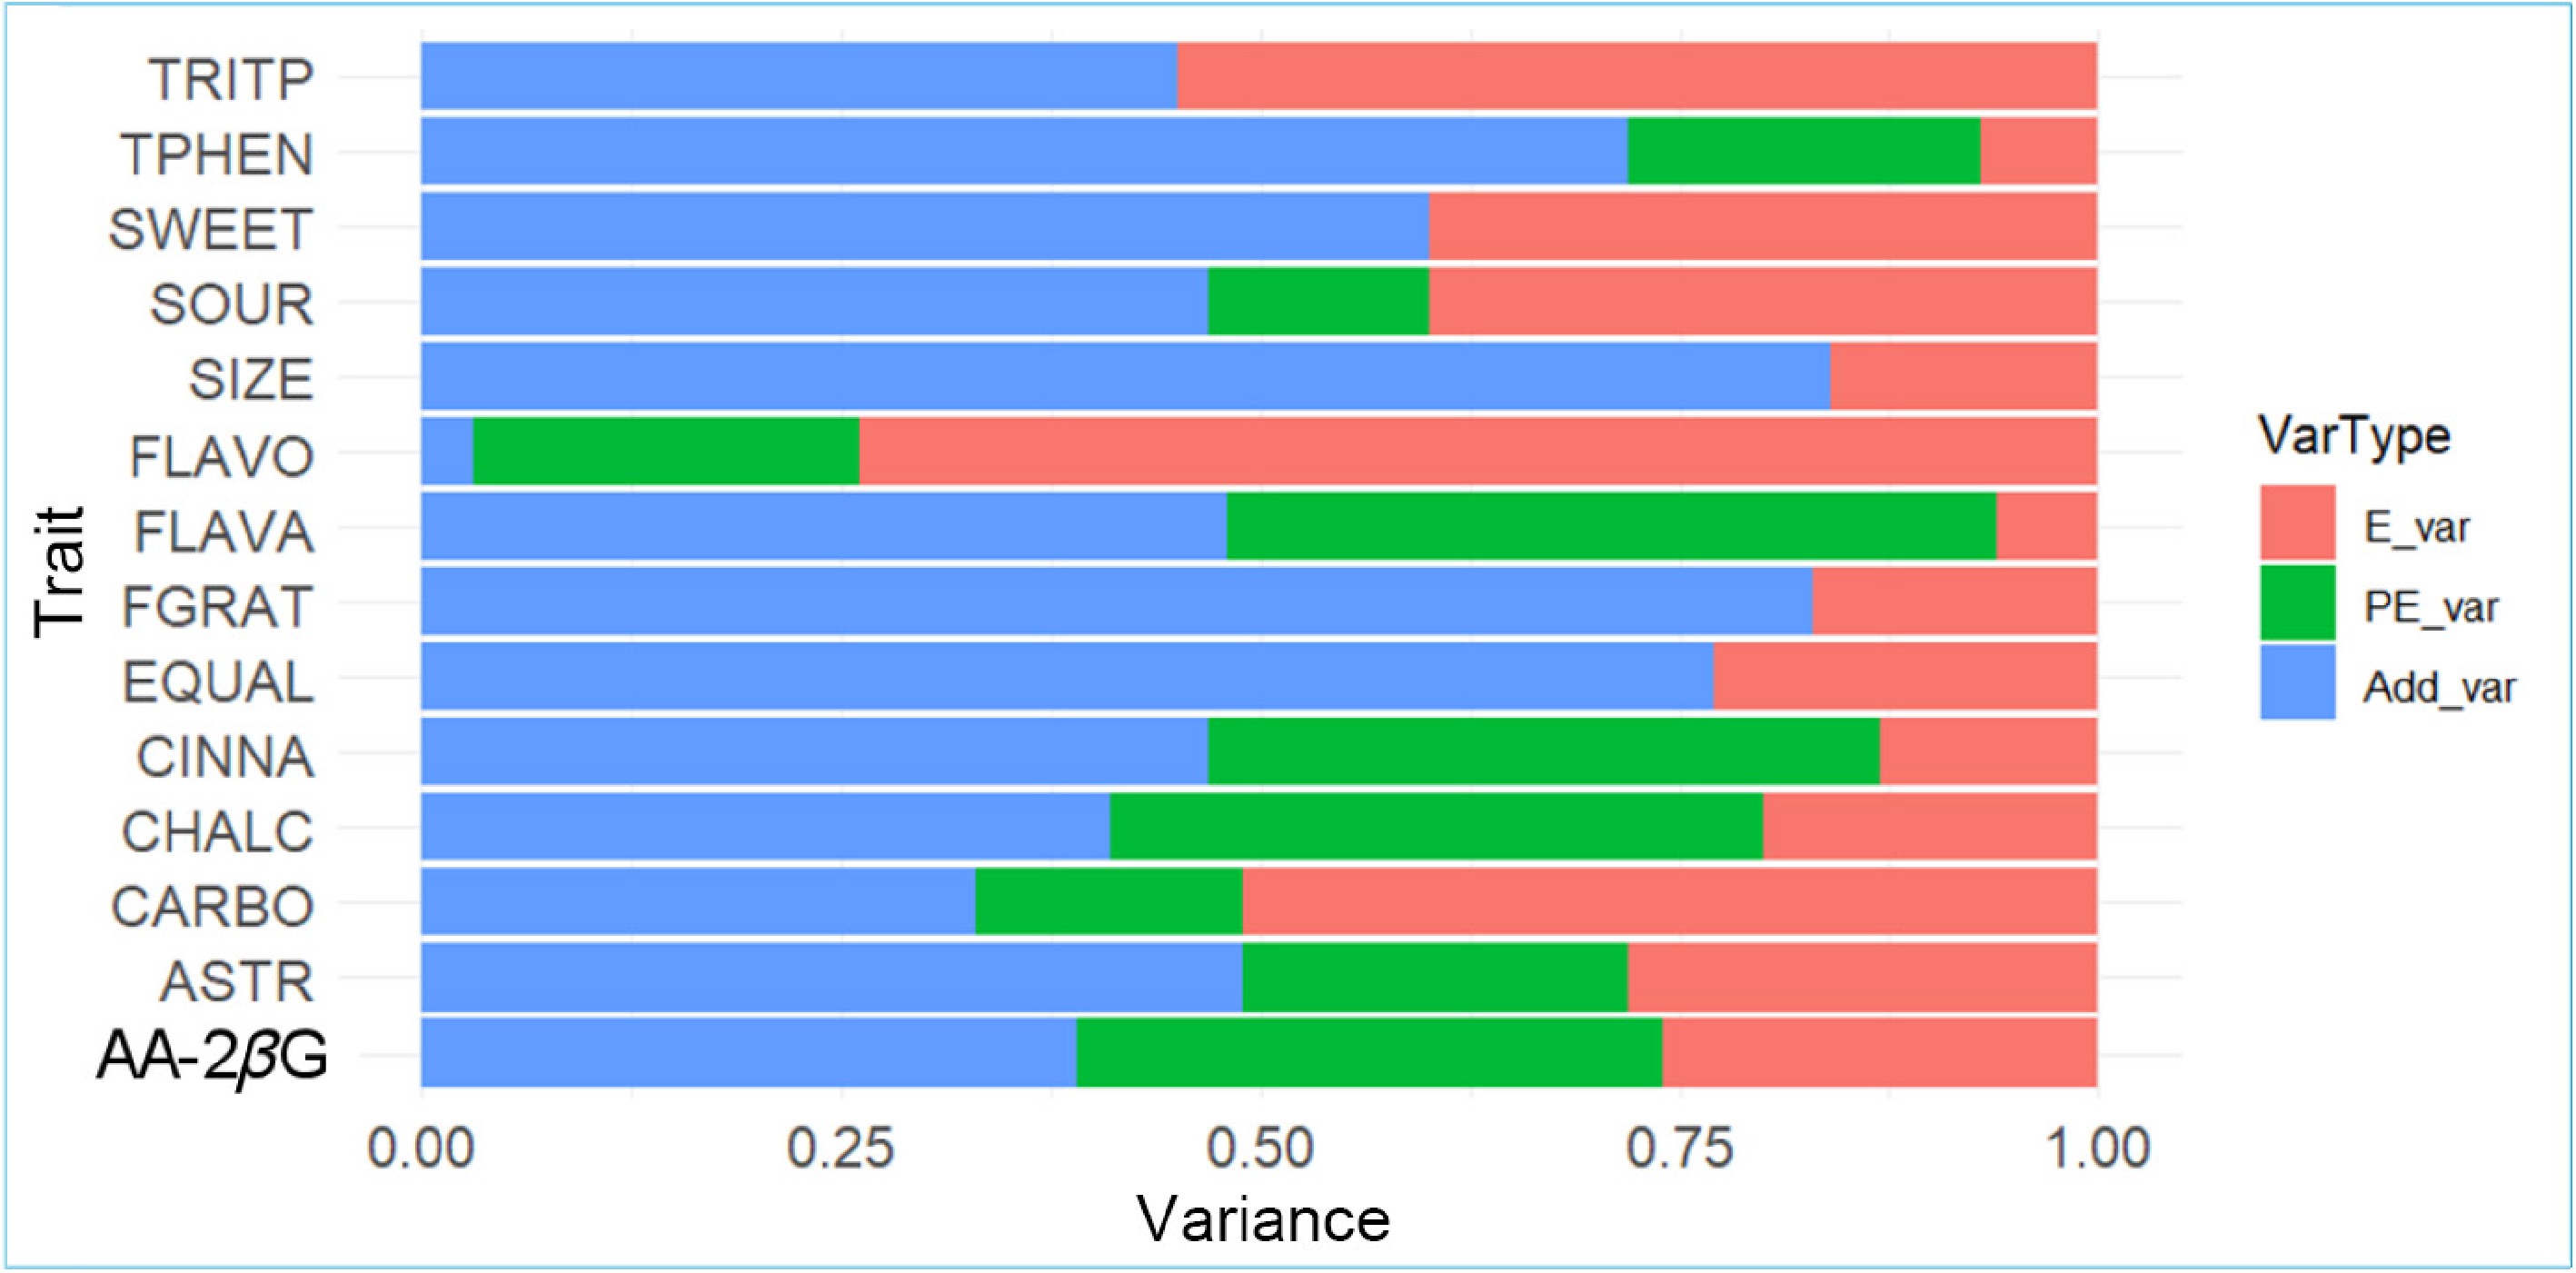
Figure 2.
Estimated proportion of the additive genetic (Add_var), permanent environment (PE_var), and environmental (E_var) variances for different traits (ASTR: astringency, CARBO: carbohydrates, CHALC: chalcones, CINNA: cinnamic acids, EQUAL: eating quality, FGRAT: fructose–glucose ratio, FLAVO: flavonols, FLAVA: flavanols, AA-2βG: ascorbic acid 2-beta-glucoside, SIZE: fruit size, SOUR: sourness, SWEET: sweetness, TRITP: triterpenoids, and TPHEN: total phenolics).
-
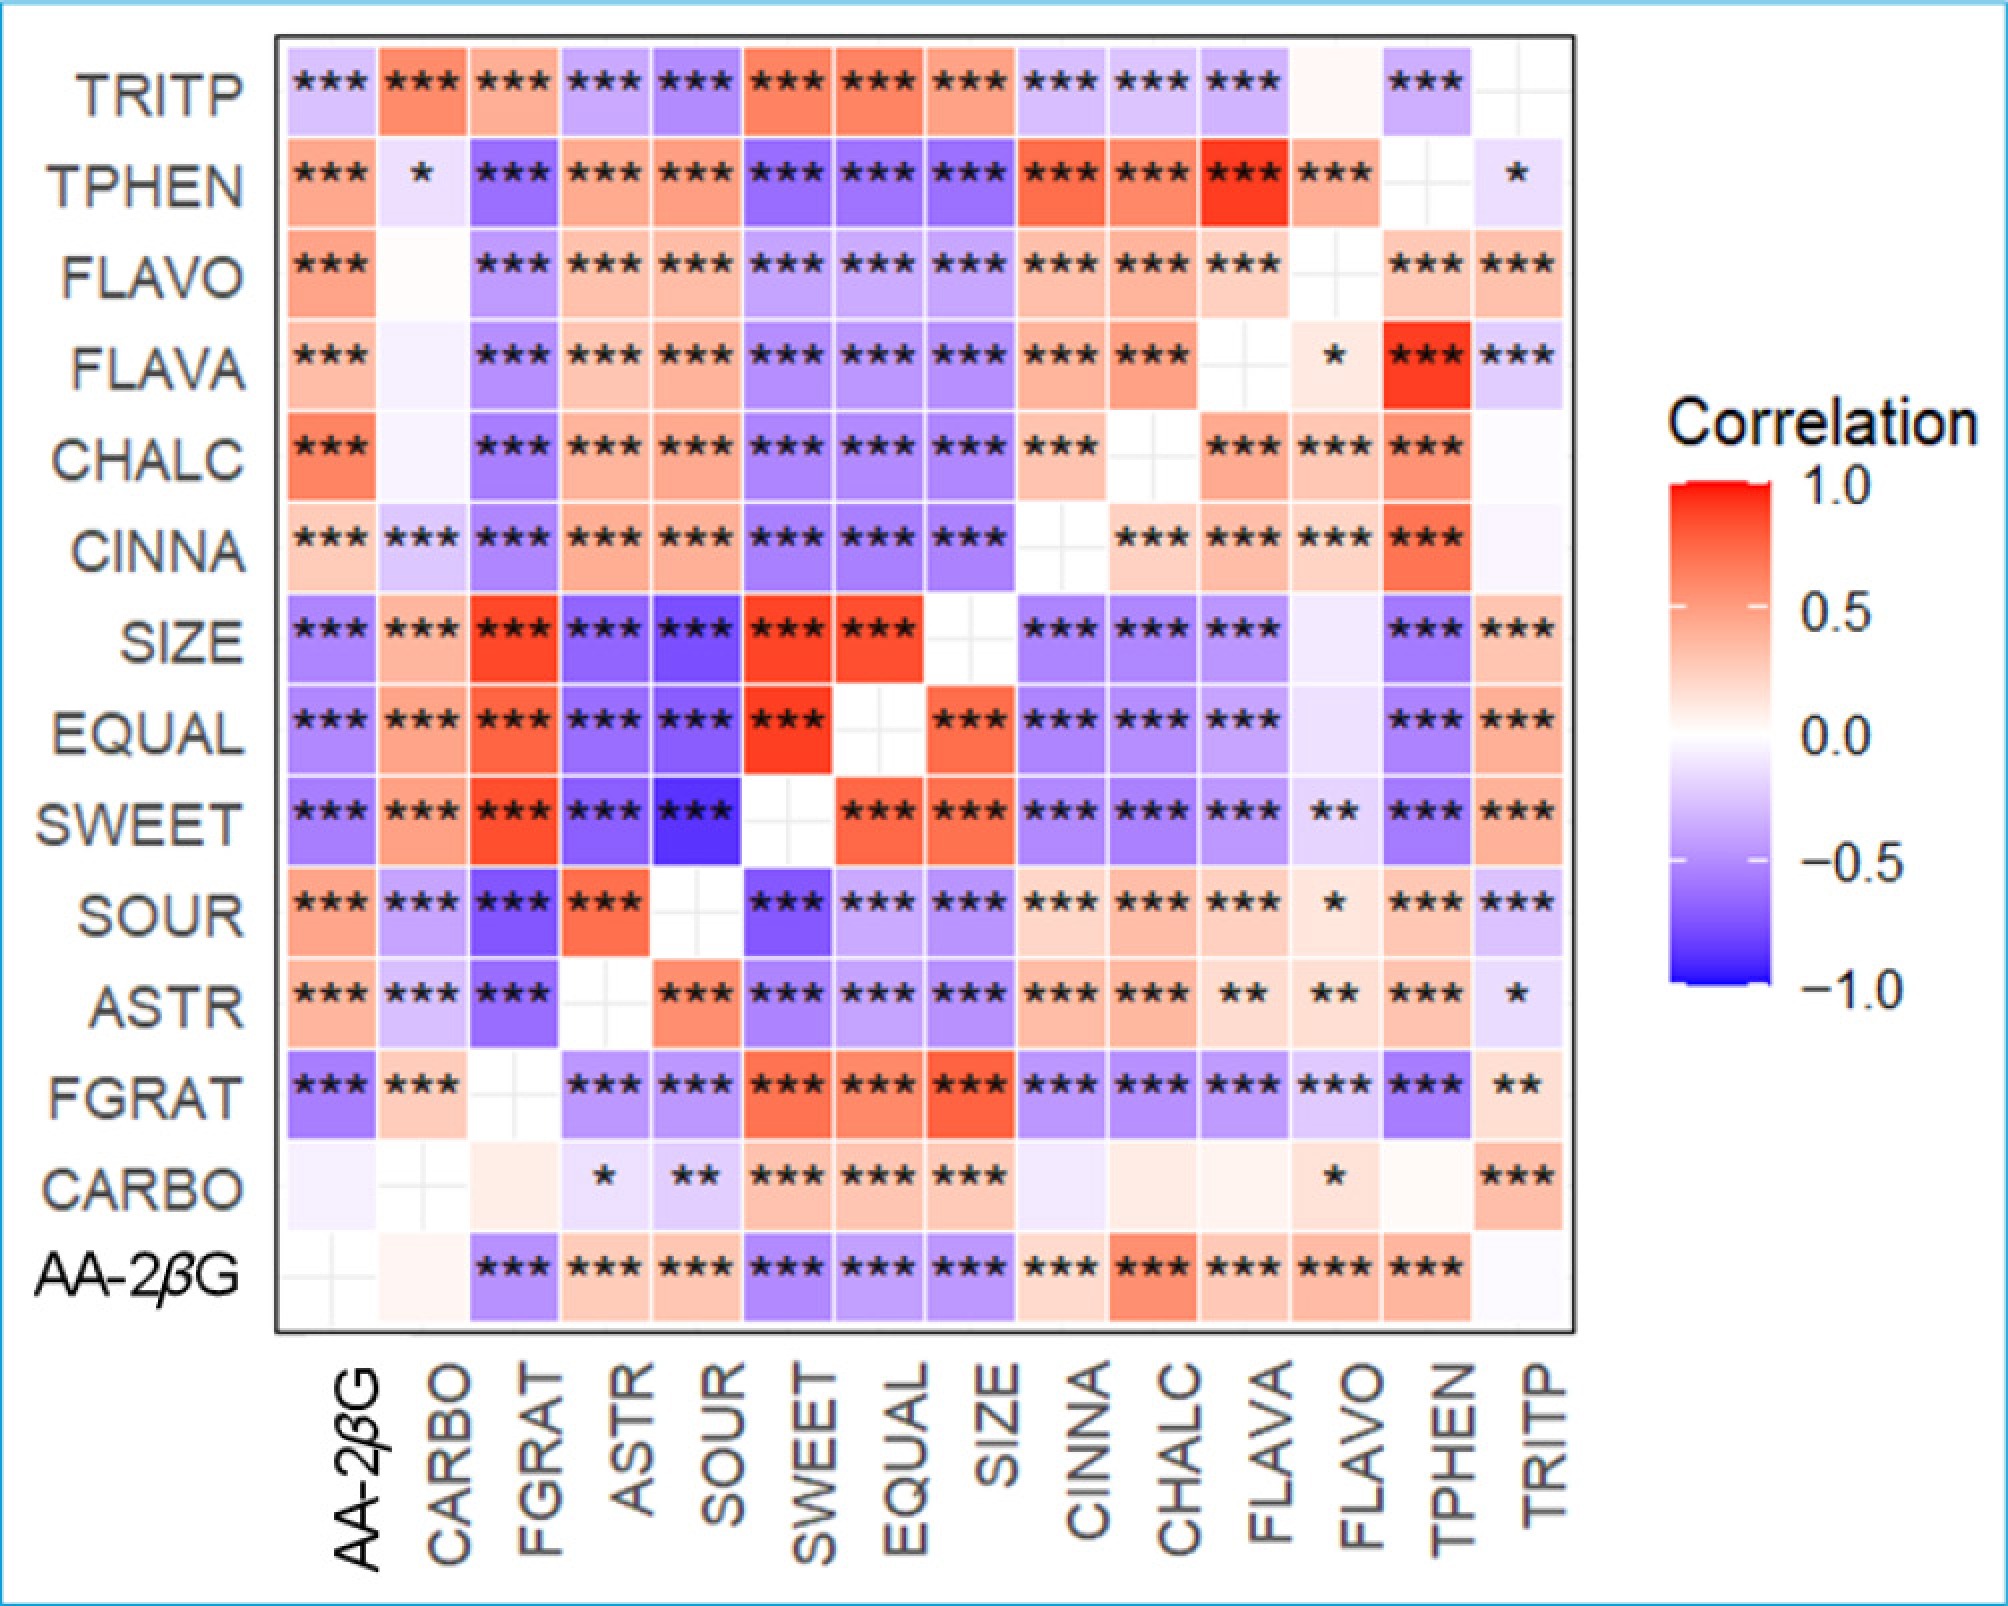
Figure 3.
Genetic (upper-left triangle) and phenotypic (lower-right triangle) correlations between pairs of traits (ASTR: astringency, CARBO: carbohydrates, CHALC: chalcones, CINNA: cinnamic acids, EQUAL: eating quality, FGRAT: fructose–glucose ratio, FLAVO: flavonols, FLAVA: flavanols, AA-2βG: ascorbic acid 2-beta-glucoside, SIZE: fruit size, SOUR: sourness, SWEET: sweetness, TRITP: triterpenoids, and TPHEN: total phenolics) in the seedling population. Significance levels of correlation coefficients: *** p < 0.001; ** p < 0.01, * p < 0.05.
-
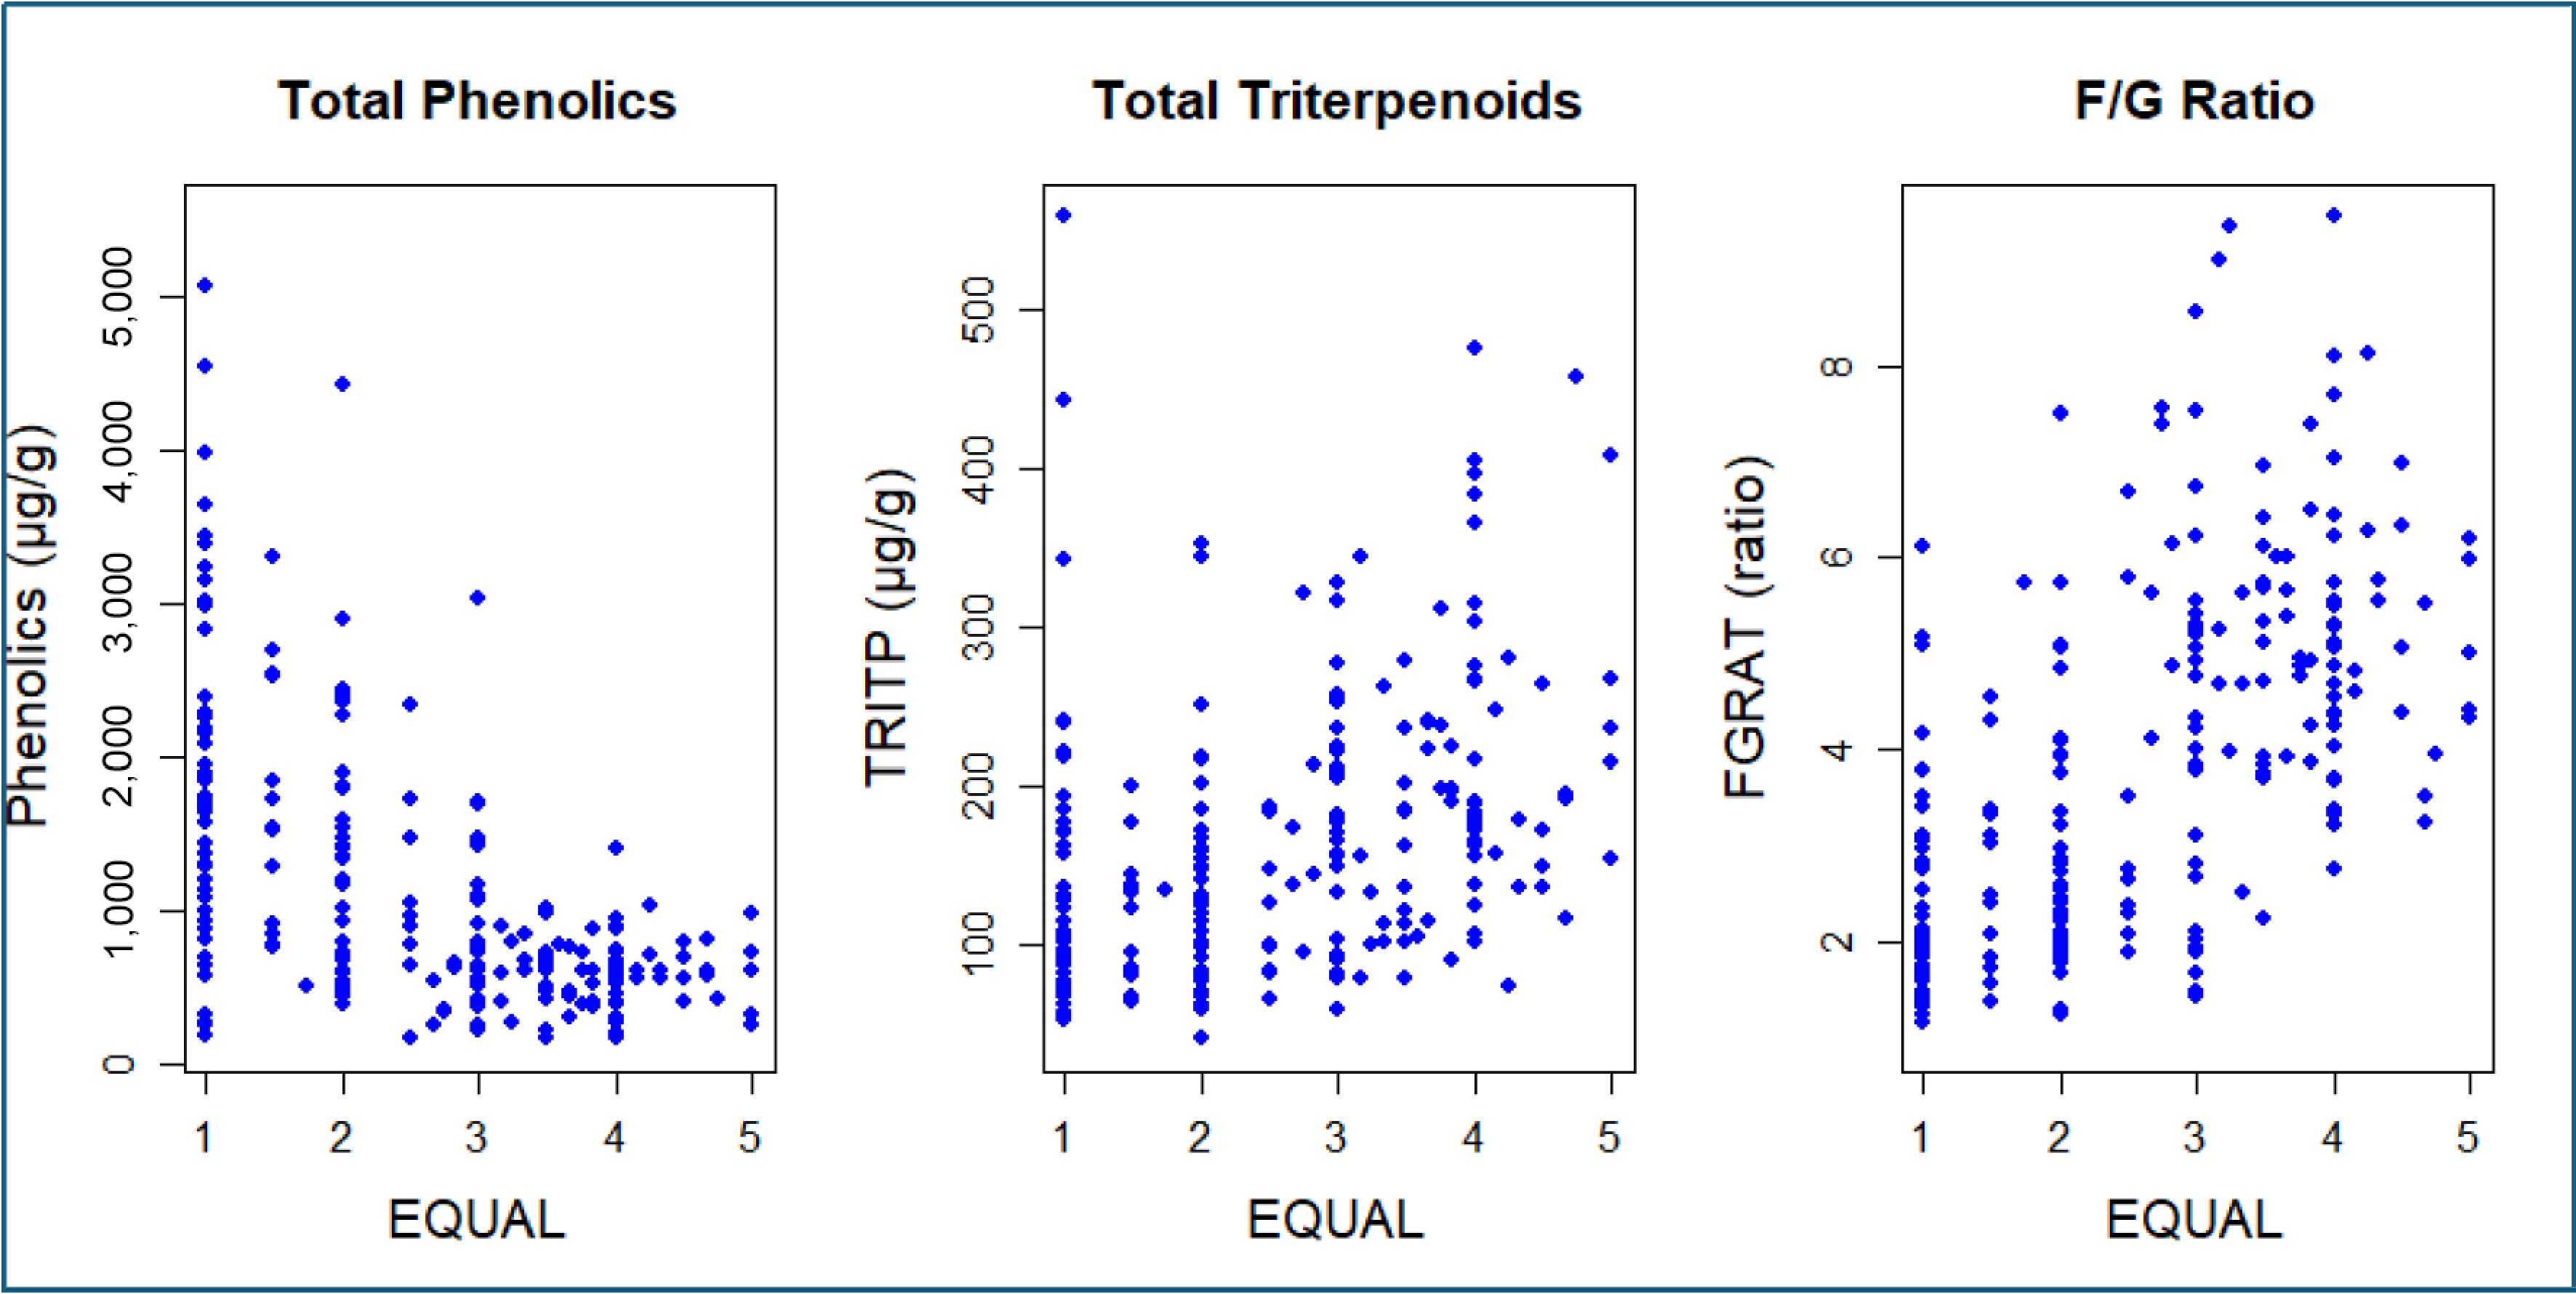
Figure 4.
Phenotypic covariation between the eating quality (EQUAL) and some phytochemicals in the seedling population.
-
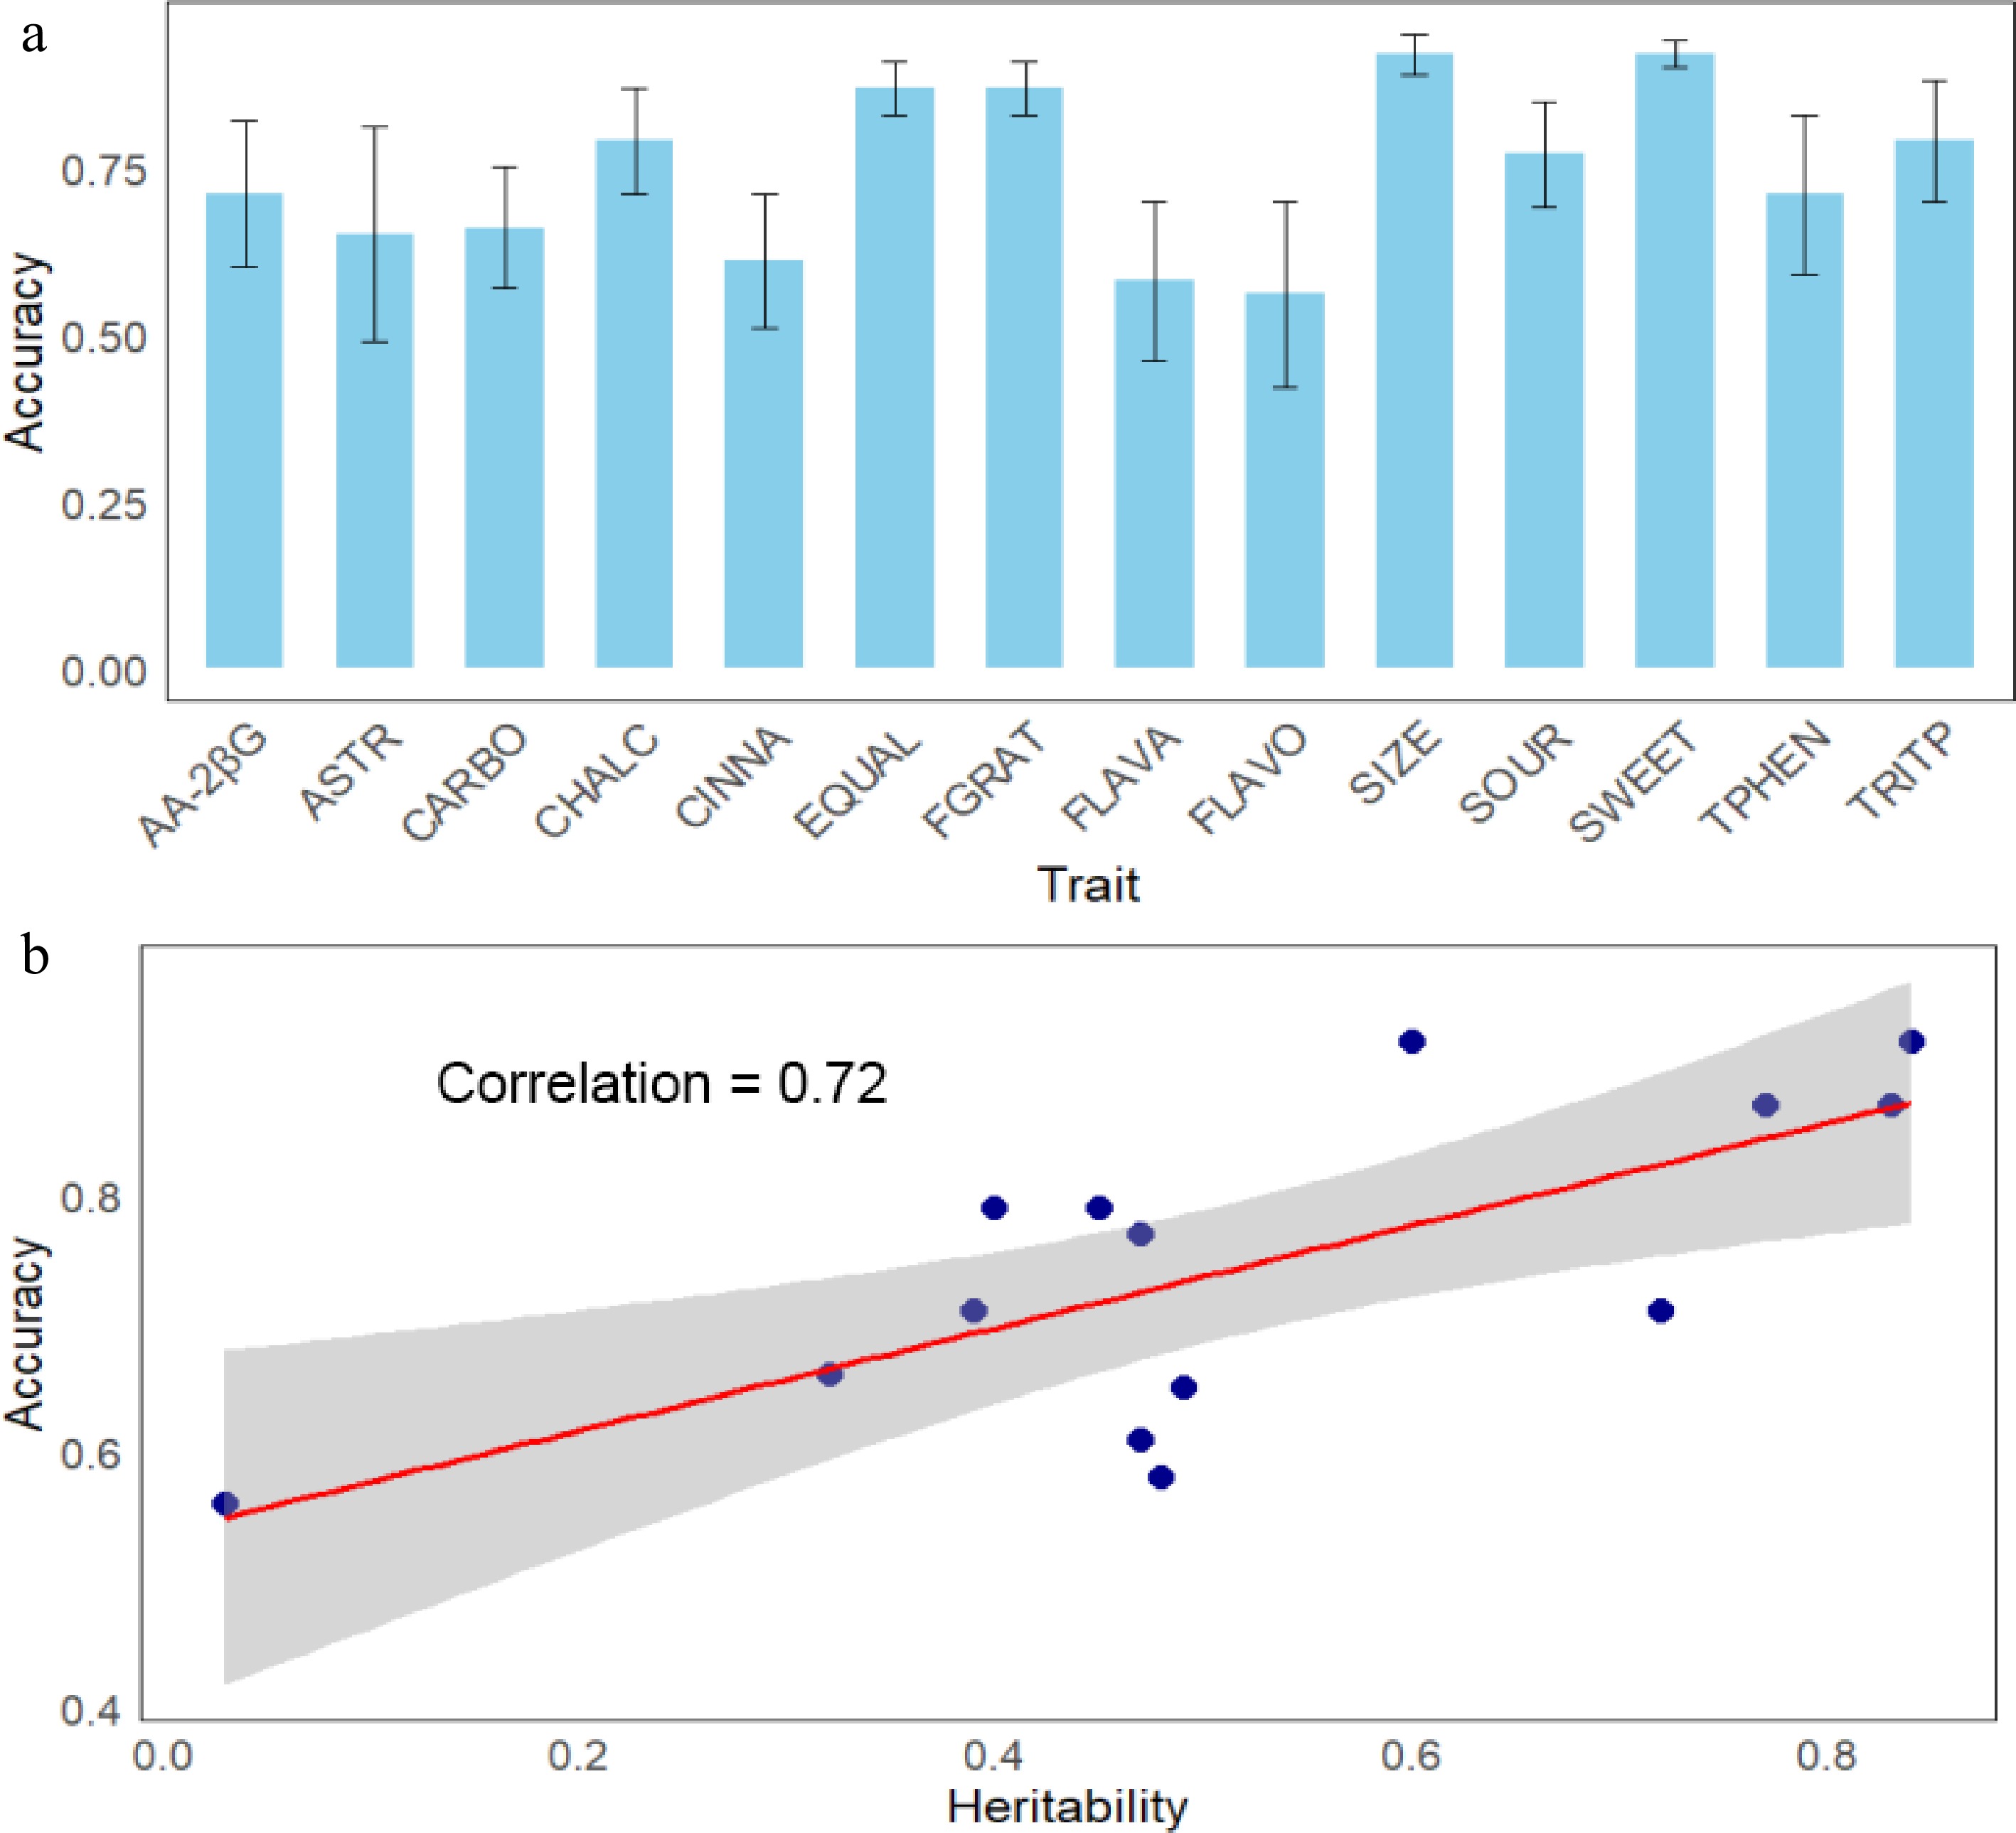
Figure 5.
Genomic prediction accuracies (± standard deviation) for various traits (a). AA-2βG: ascorbic acid 2-beta-glucoside, ASTR: astringency, CARBO: carbohydrates, CHALC: chalcones, CINNA: cinnamic acids, EQUAL: eating quality, FGRAT: fructose–glucose ratio, FLAVO: flavonols, FLAVA: flavanols, SIZE: fruit size, SOUR: sourness, SWEET: sweetness, TRITP: triterpenoids, TPHEN: total phenolics. Relationship between trait heritability and prediction accuracy (b). The grey area in (b) depicts the 95% confidence interval for the linear fit (red line).
-
Compound Group Min. Max. Mean SD Corr. 3-Hydroxyphloretin 2'-xyloglucoside Chalcone 0 39.7 2.5 4.7 0.89 3-Hydroxyphloridzin Chalcone 0 43.2 2.3 4.6 0.91 Phloretin-2'-O-xyloglucoside Chalcone 0 386 43.1 46.1 0.81 Phloridzin Chalcone 1 558.8 38.4 63.8 0.80 Sieboldin Chalcone 0 290 9.3 35.6 0.80 Trilobatin Chalcone 0 107.2 4.2 13.0 0.54 5-Caffeoylshikimic acid Cinnamic acid 0 290 14 31.5 0.70 Chlorogenic acid Cinnamic acid 1.1 2,495.8 389 387.6 0.89 Neochlorogenic acid Cinnamic acid 0 27.6 1.4 3.6 0.85 trans-4-p-Coumaroyl quinic acid Cinnamic acid 0 463.9 32.1 49.3 0.91 trans-5-p-Coumaroyl quinic acid Cinnamic acid 0 276.4 20.8 31.5 0.77 Catechin Flavanol 0 318.2 11 25.0 0.97 Epicatechin Flavanol 1.6 932.1 140.1 154.5 0.95 Procyanidin B1 Flavanol 0 356.5 33.5 45.4 0.92 Procyanidin B2 Flavanol 4 1,358 248.2 282.9 0.93 Procyanidin B5 Flavanol 0.2 148 20.8 24.8 0.96 Procyanidin B7 Flavanol 0 78.2 12 13.5 0.94 Procyanidin C1 Flavanol 2.4 1,056 128.3 171.7 0.96 Quercetin 3-arabinopyranoside Flavonol 4.4 264.2 26.8 21.3 0.30 Quercetin 3-galactoside Flavonol 2.1 341.9 41.3 32.1 0.37 Quercetin 3-glucoside Flavonol 0.9 304 16.4 23.3 0.71 Quercetin 3-rhamnoside Flavonol 4.4 84.8 19 12.0 0.60 Annurcoic acid Triterpenoid 1.5 318 70.9 66.2 0.61 Betulinic acid Triterpenoid 1.3 17.1 4.6 1.8 0.53 Corosolic acid Triterpenoid 2.6 39.9 12.2 5.9 0.63 Euscaphic acid Triterpenoid 0.4 255.8 29.8 33.4 0.58 Maslinic acid Triterpenoid 2.5 44.6 11.2 6.2 0.69 Medicagenic acid Triterpenoid 0 116.3 3.7 10.3 0.17 Pomolic acid Triterpenoid 1.5 35.5 14.9 7.9 0.63 trans-Caffeoylbetulinic acid Triterpenoid 0 22.7 2.8 2.6 0.01 Ursolic acid Triterpenoid 10.6 31.9 18.9 3.8 0.26 Ascorbic acid 2-beta-glucoside Organic acid 0 1,317.5 122.7 236.2 0.87 Sorbitol Carbohydrate 1.1 31.7 8.3 5.2 0.74 Glucose Carbohydrate 3.3 37.3 13.5 6.7 0.77 Sucrose Carbohydrate 2.5 183.1 40.4 14.8 0.69 Fructose Carbohydrate 12.5 92.9 37.7 9.5 0.54 Min. = minimum. Max. = maximum. SD = standard deviation. Corr. = between-season correlation. The content (mg/g) of individual sugars in the fruit is also presented. Table 1.
Across-season distribution of the content (μg/g) of phenolics, triterpenoids, and organic acids in the seedling population.
Figures
(5)
Tables
(1)