-
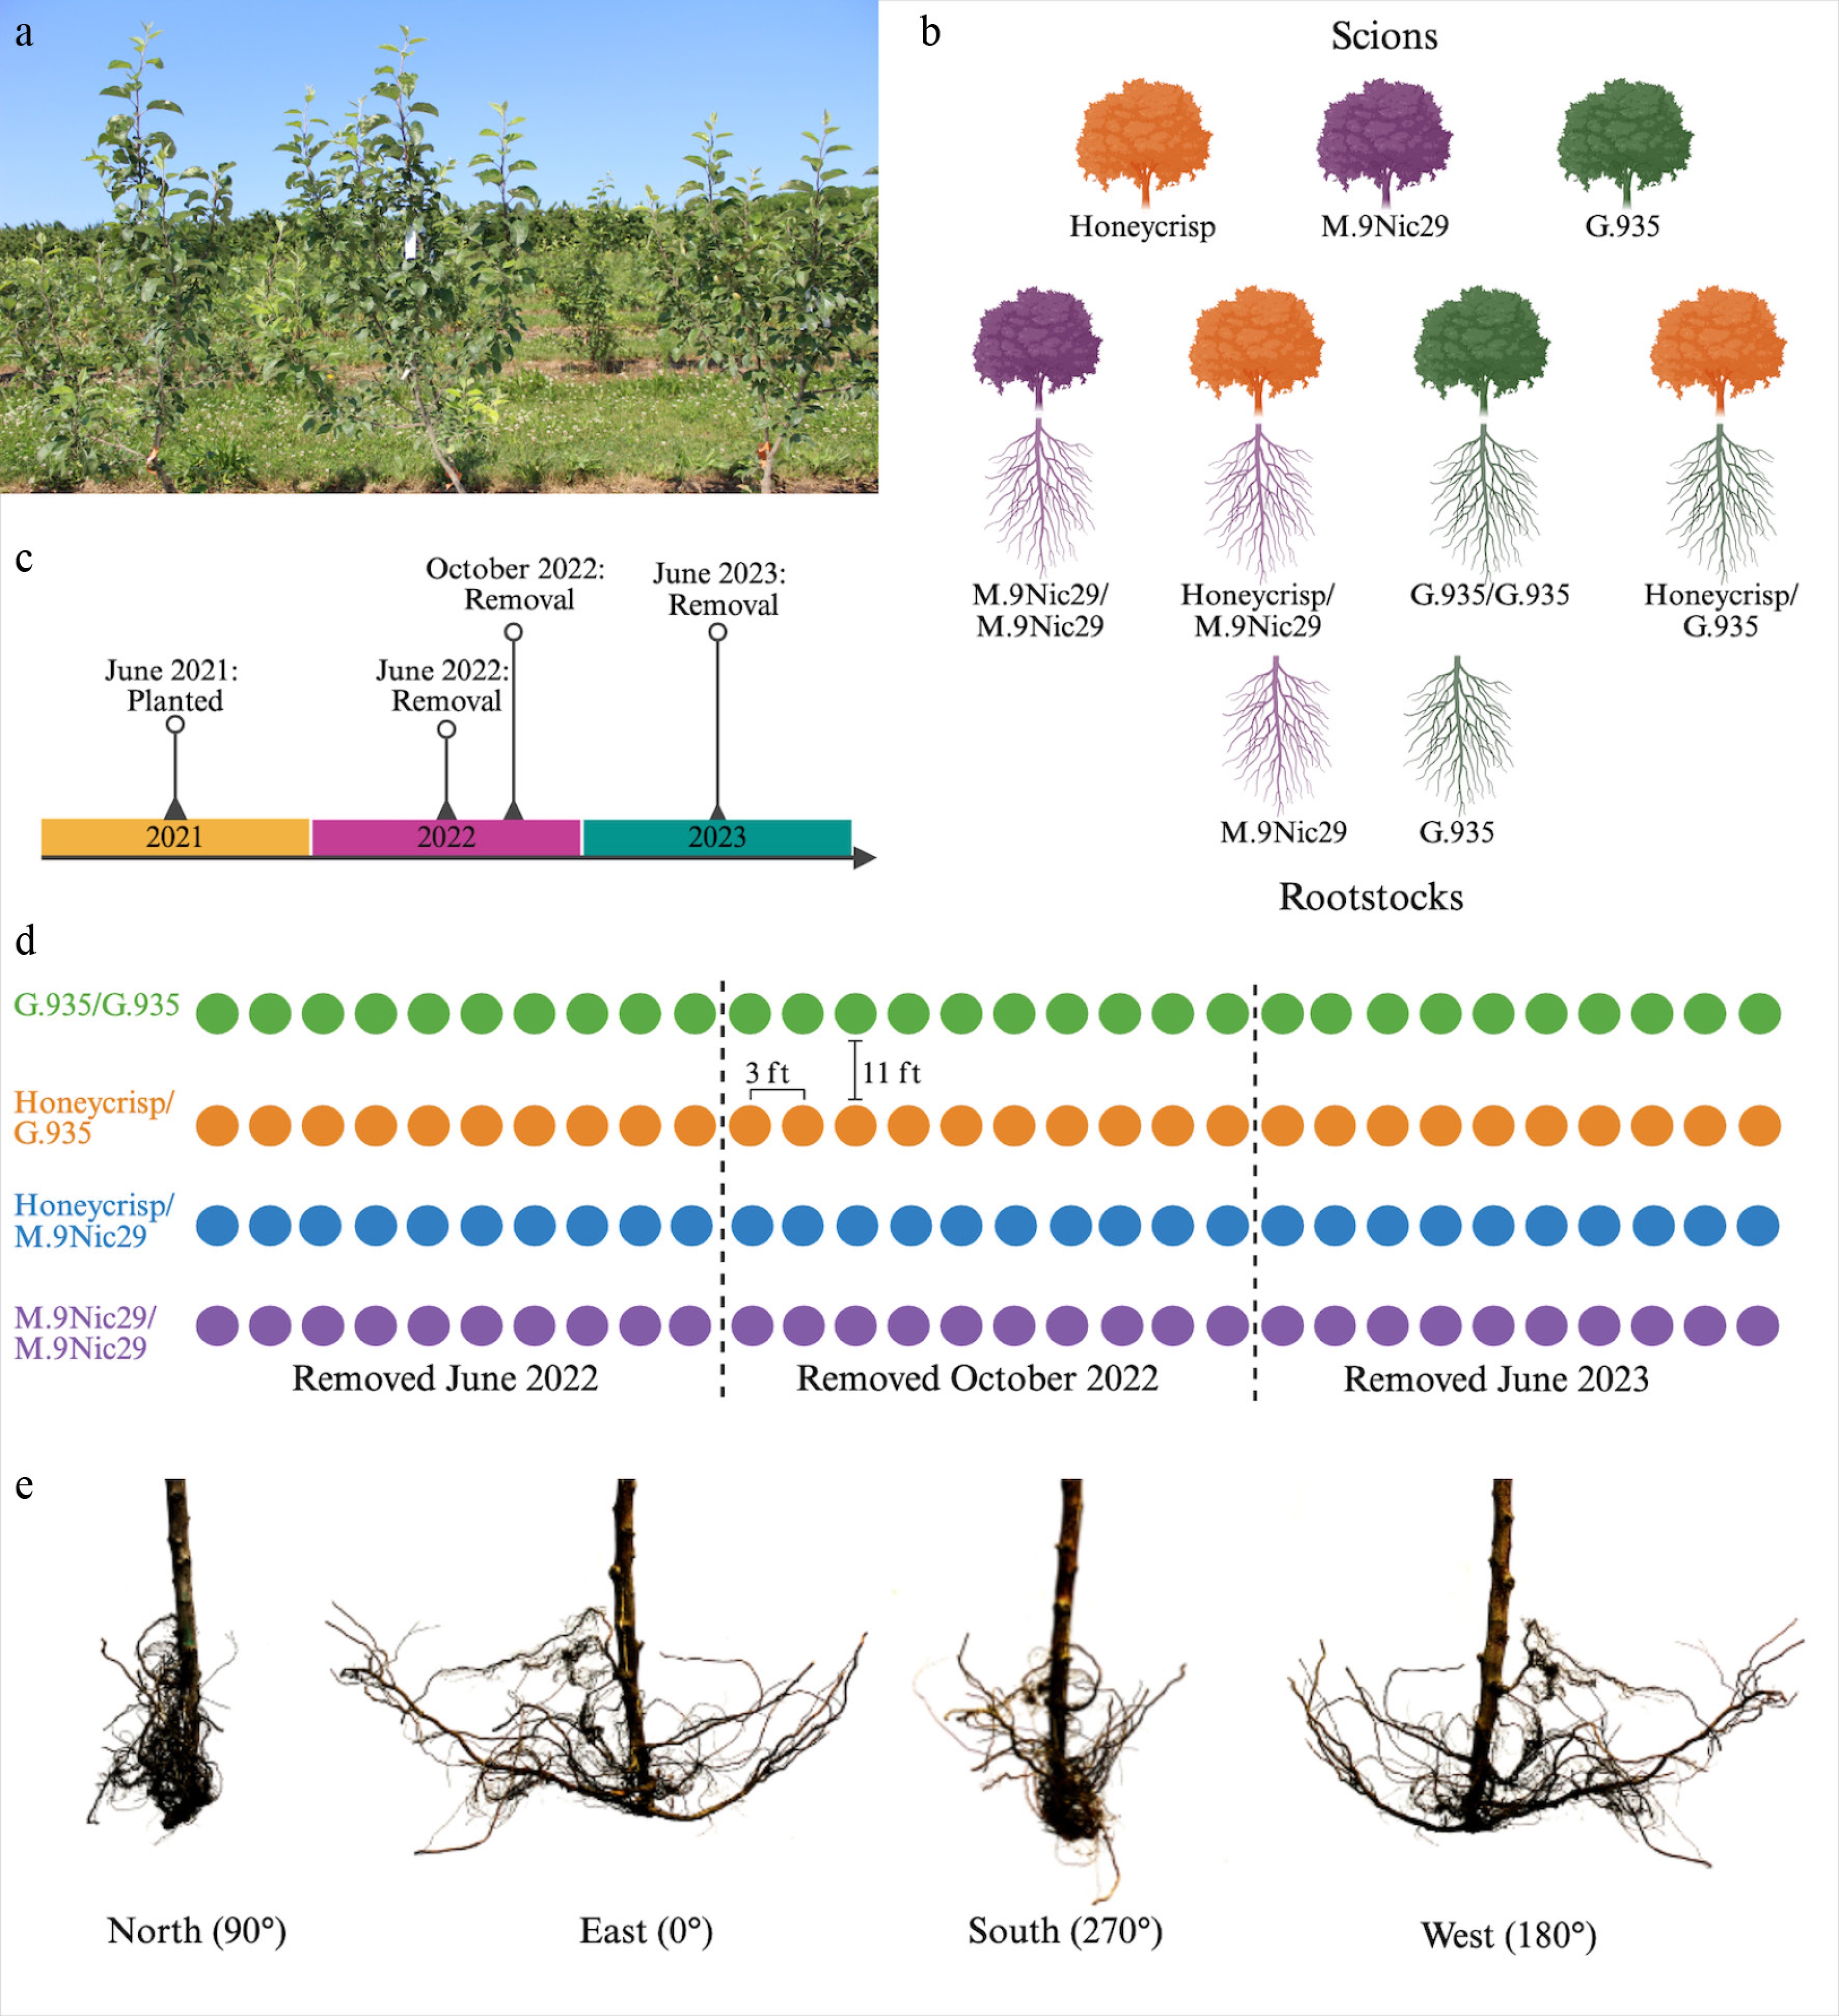
Figure 1.
Experimental design. (a) An image of the experimental orchard. (b) Diagram of the scion–rootstock combinations used in the experiment. (c) Timeline of the experiment. (d) The orchard experimental design. Each row is a row in the orchard, circles represent individual trees, and colors represent scion–rootstock combinations. (e) Images of a Honeycrisp/M.9Nic29 root system at each of the four orientations at which whole-root images were taken. Made with
biorender.com . -
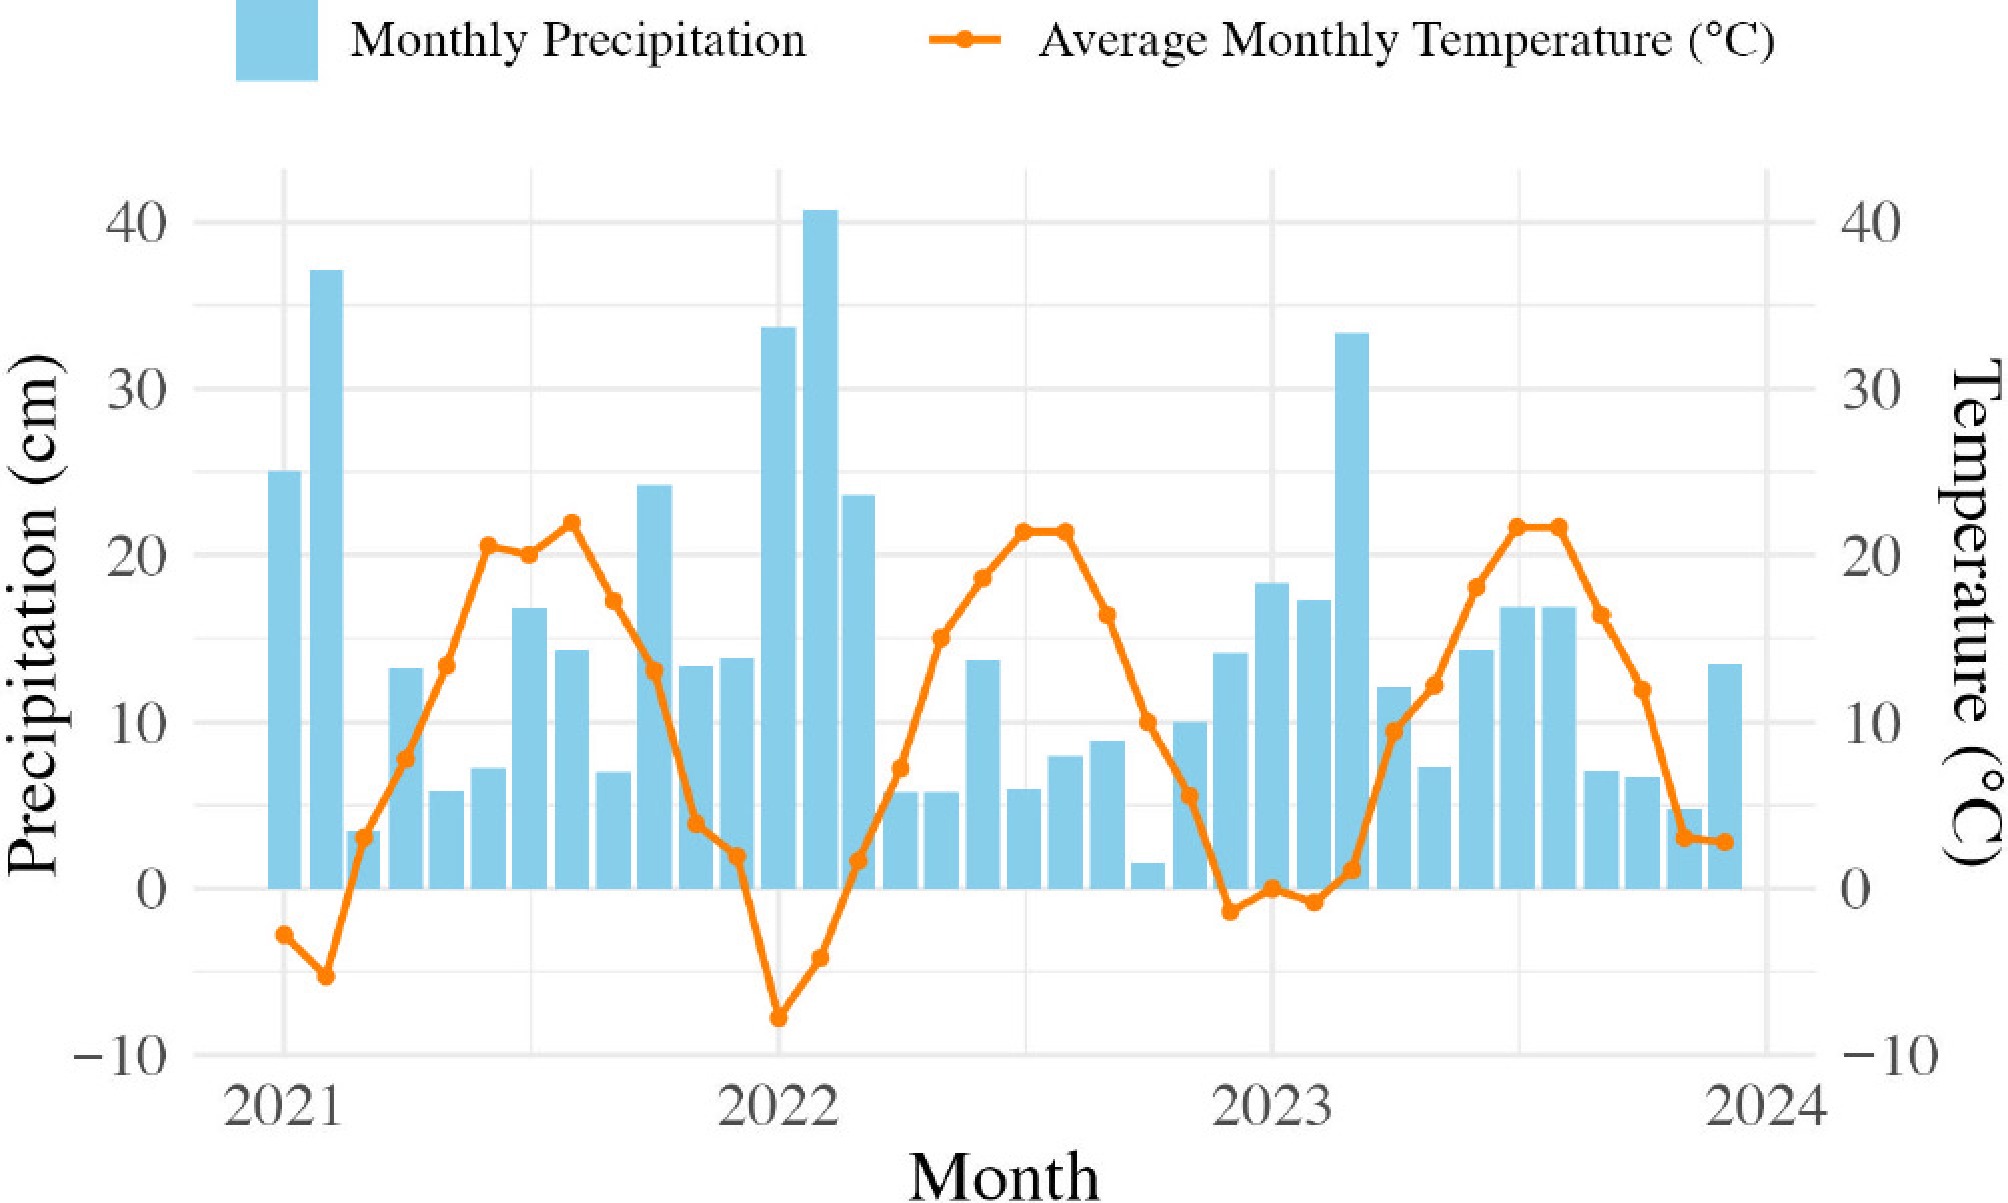
Figure 2.
Average monthly precipitation (cm) and high and low monthly temperatures (°C) in Geneva, NY, USA, between January 2021 and December 2024. Each blue bar represents the total precipitation (rain and snow) for the month, and each orange dot represents the average daily high temperature for the month. Weather information is from the NOAA National Centers for Environmental Information Database (
www.ncei.noaa.gov/cdo-web ). The weather station was at the Geneva research farm (Network ID: GHCND:USC00303184, 42.8766°, −77.0307°). -
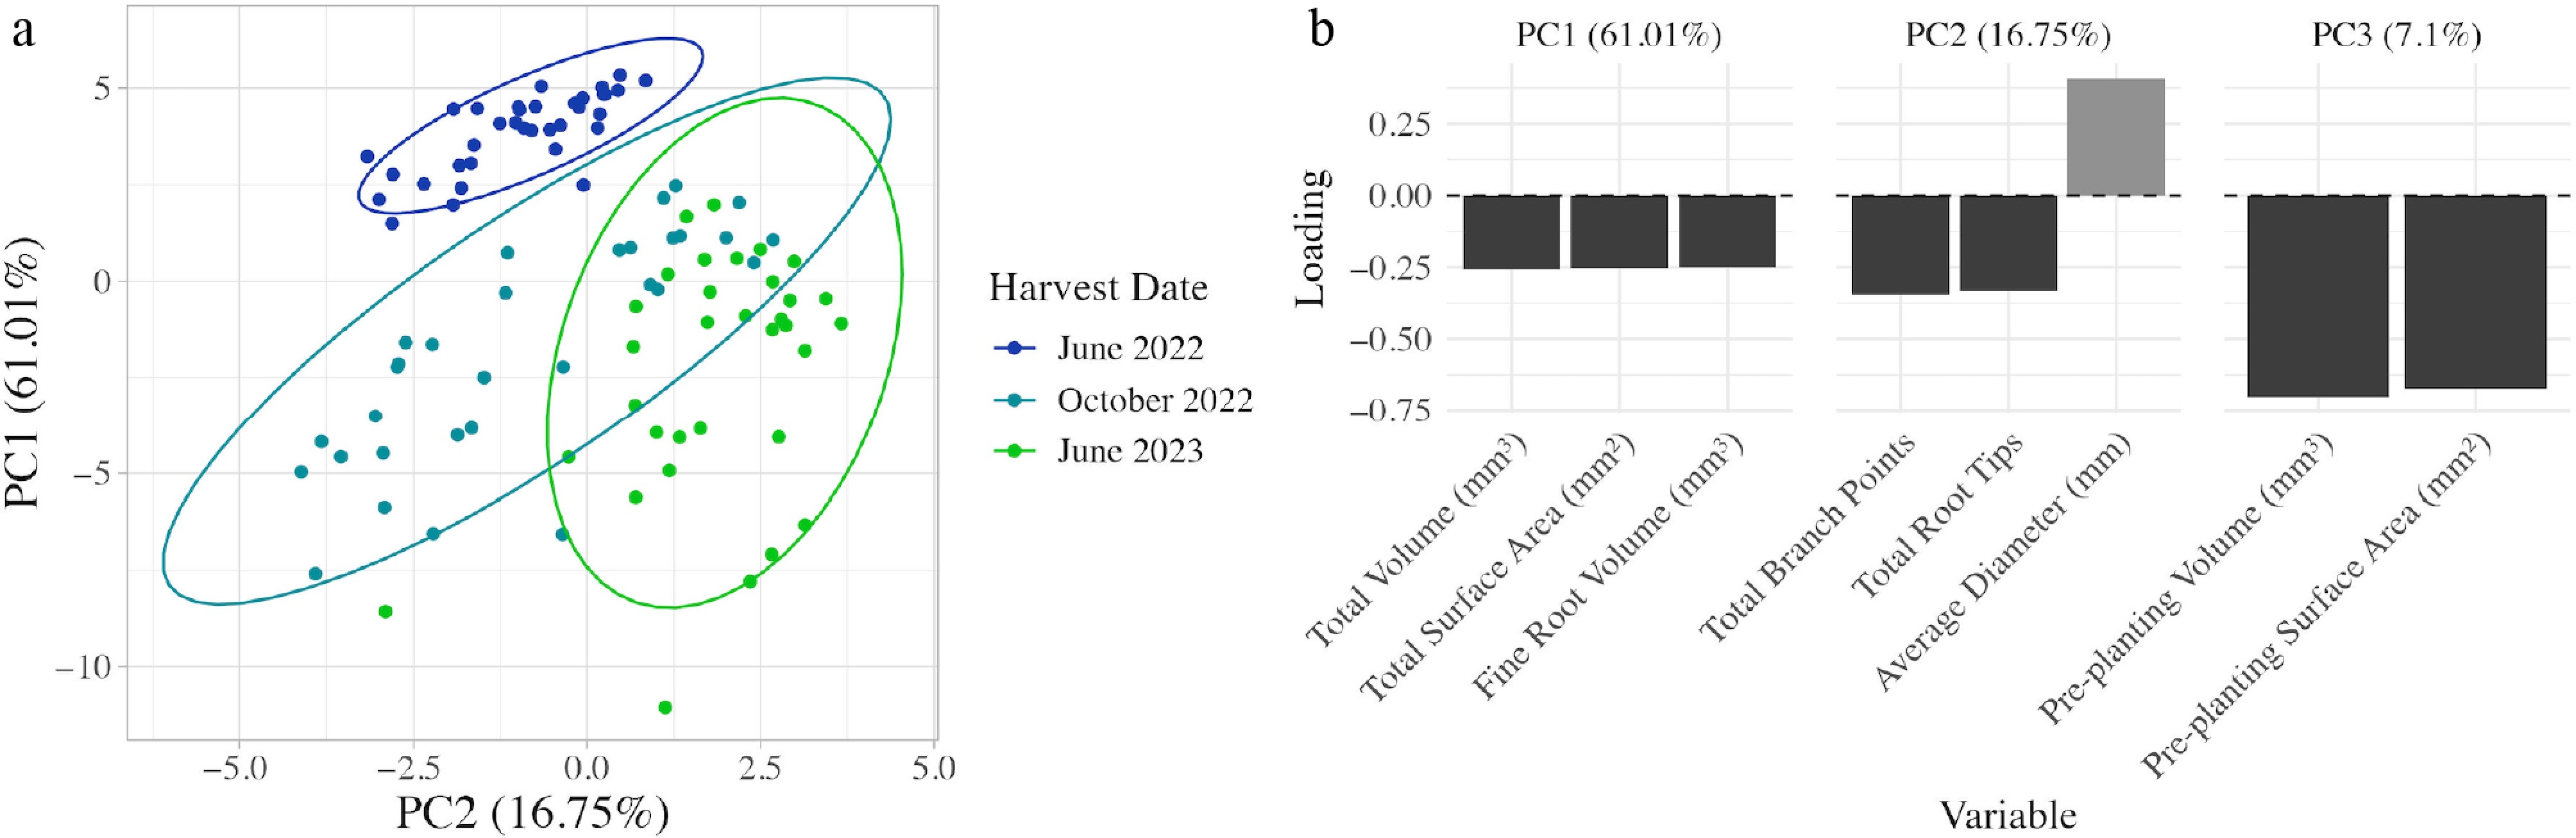
Figure 3.
PCA analysis to describe apple root traits. (a) Biplot of the first two principal components (PC) at the three harvest timepoints for all apple scion–rootstock combinations used in the experiment. Ellipses and colors represent the harvest date of each plant. (b) Bar plot showing the loading values of the top three variables for the first three principal components. Dark grey represents a negative loading, and light grey represents a positive loading. PCA analysis was calculated using rootstock and scion trunk cross sectional area at the time of harvest (mm), the number of root tips, the number of root branch points, branching frequency per mm, average root diameter (mm), maximum root diameter (mm), total, fine, medium, and coarse root system volume (mm3), surface area (mm2), and length (mm), pre-planting volume (mm3), and pre-planting surface area (mm2).
-
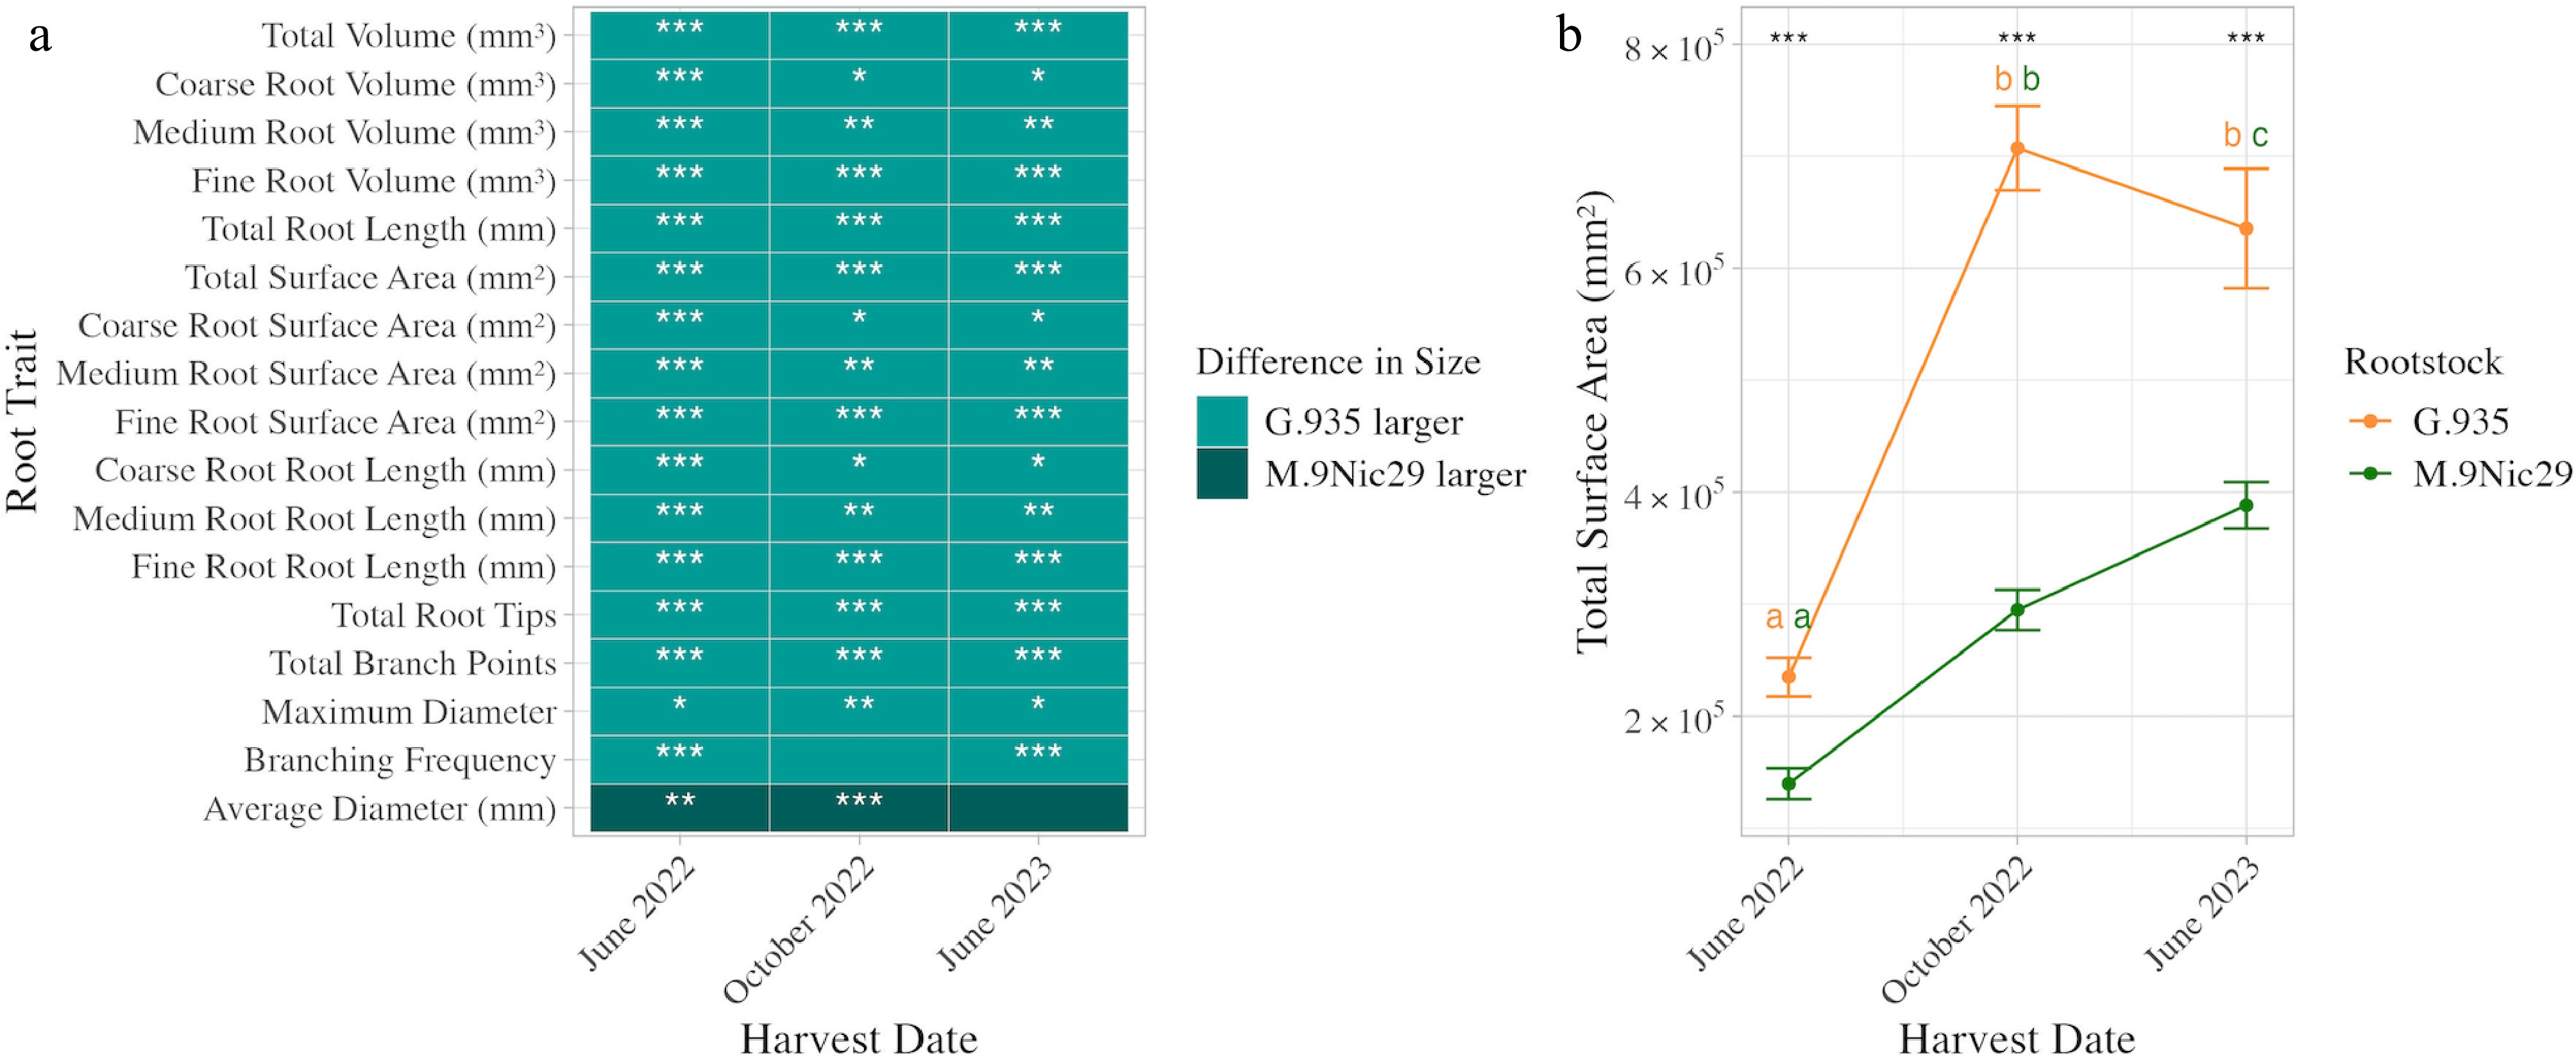
Figure 4.
Size and growth differences between M.9Nic29 and G.935 apple rootstocks. (a) Heatmap showing the difference in root trait size between M.9Nic29 and G.935 apple rootstocks. The light blue color indicates that G.935 has a larger trait value than M.9Nic29, and the dark blue color indicates that M.9Nic29 has a larger trait value than G.935. Stars indicate a significant difference between rootstocks: * p < 0.05, ** p < 0.01, *** p < 0.001. (b) A line graph showing the root surface area (mm2) of the two rootstocks (mean ± SE) over time. Yellow lines and letters represent G.935 rootstocks, and green lines and letters represent M.9Nic29 rootstocks. Letters indicate significant (p < 0.05) differences between time points within each rootstock. Stars indicate significant differences between rootstocks. Significance values are based on post hoc Tukey-adjusted pairwise comparison from a linear model.
-
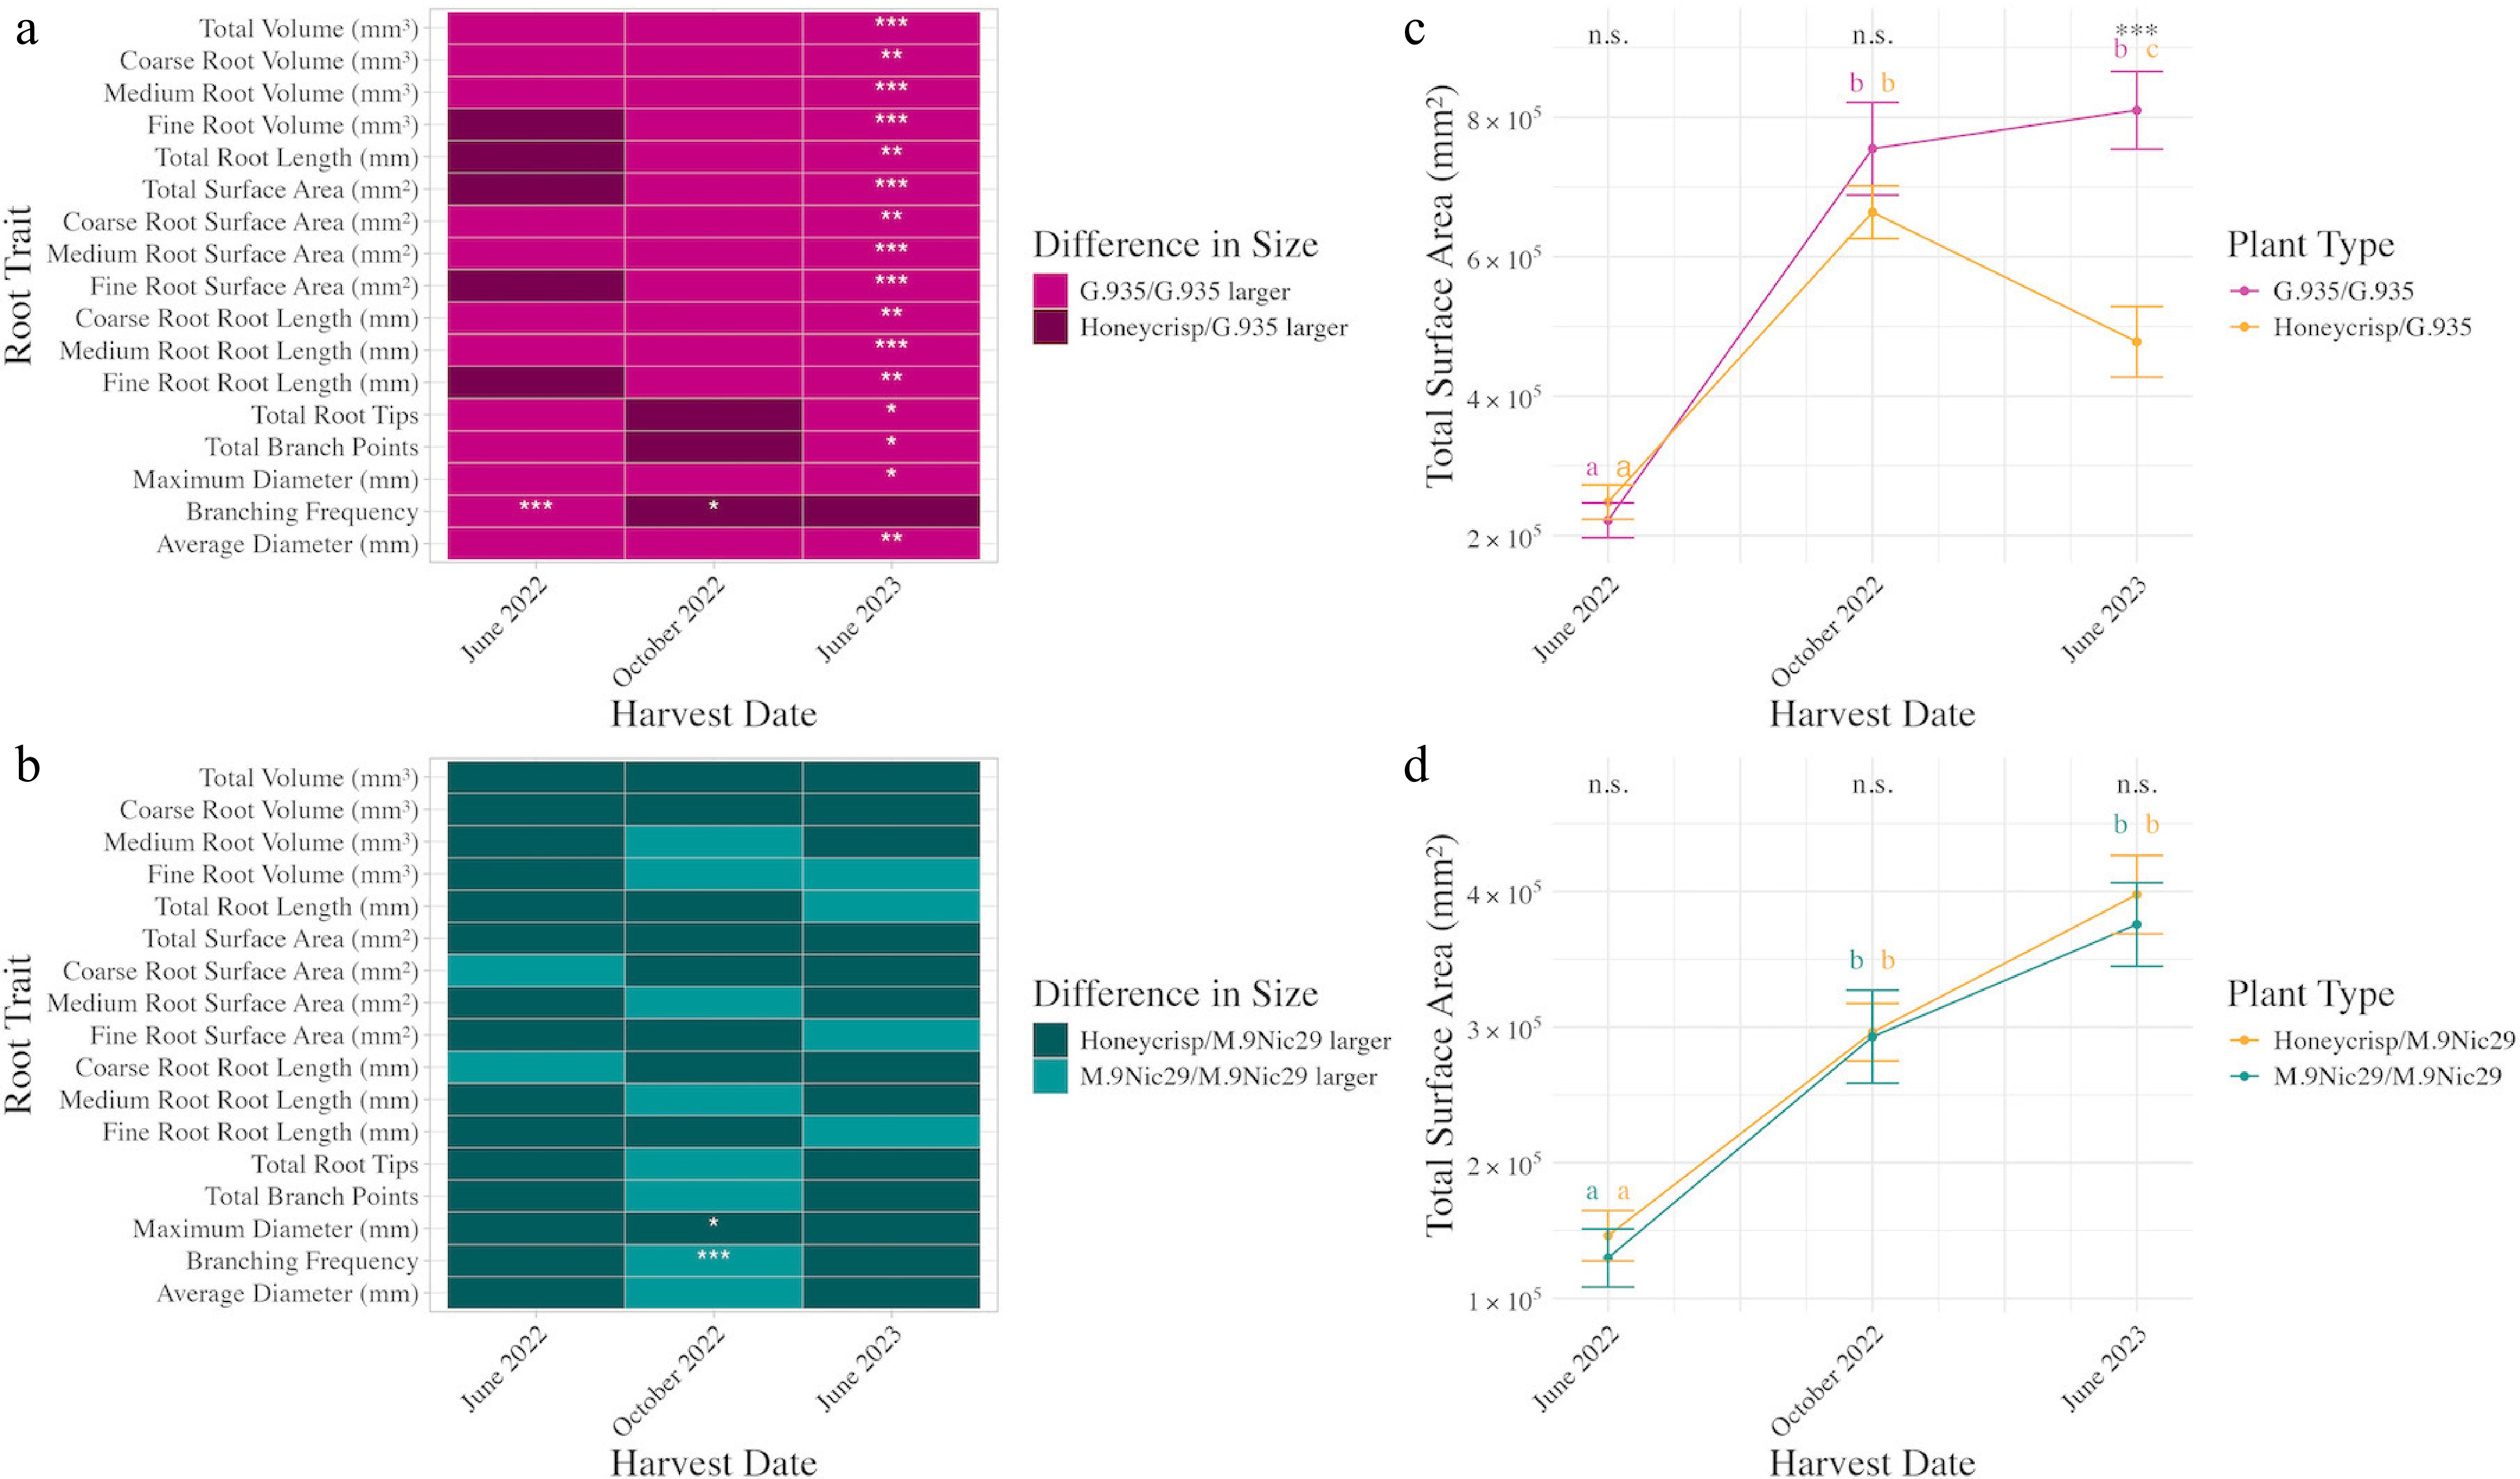
Figure 5.
Impact of scion on size and growth rate of apple rootstocks. (a) Size difference between G.935/G.935 and Honeycrisp/G.935. The lighter color represents G.935/G.935 being numerically larger on average. (b) Size difference between M.9Nic29/M.9Nic29 and Honeycrisp/M.9Nic29. The lighter color represents M.9Nic29/M.9Nic29 being numerically larger on average. (c) Change in the root system surface area (mean ± SE) over time for G.935/G.935 (pink) and Honeycrisp/G.935 (yellow). (d) Change in the root system surface area (mean ± SE) over time for M.9Nic29/M.9Nic29 (blue) and Honeycrisp/M.9Nic29 (yellow). Asterisks represent significant differences in the size of the measured trait of both rootstocks. * p < 0.05, ** p < 0.01, *** p < 0.001. Letters represent significant (p < 0.05) differences between each time point. n.s. means no significance (p > 0.05). The colors of the letters indicate the plant type they are for, as defined above. Significance values are based on post hoc Tukey-adjusted pairwise comparison from a linear model.
-
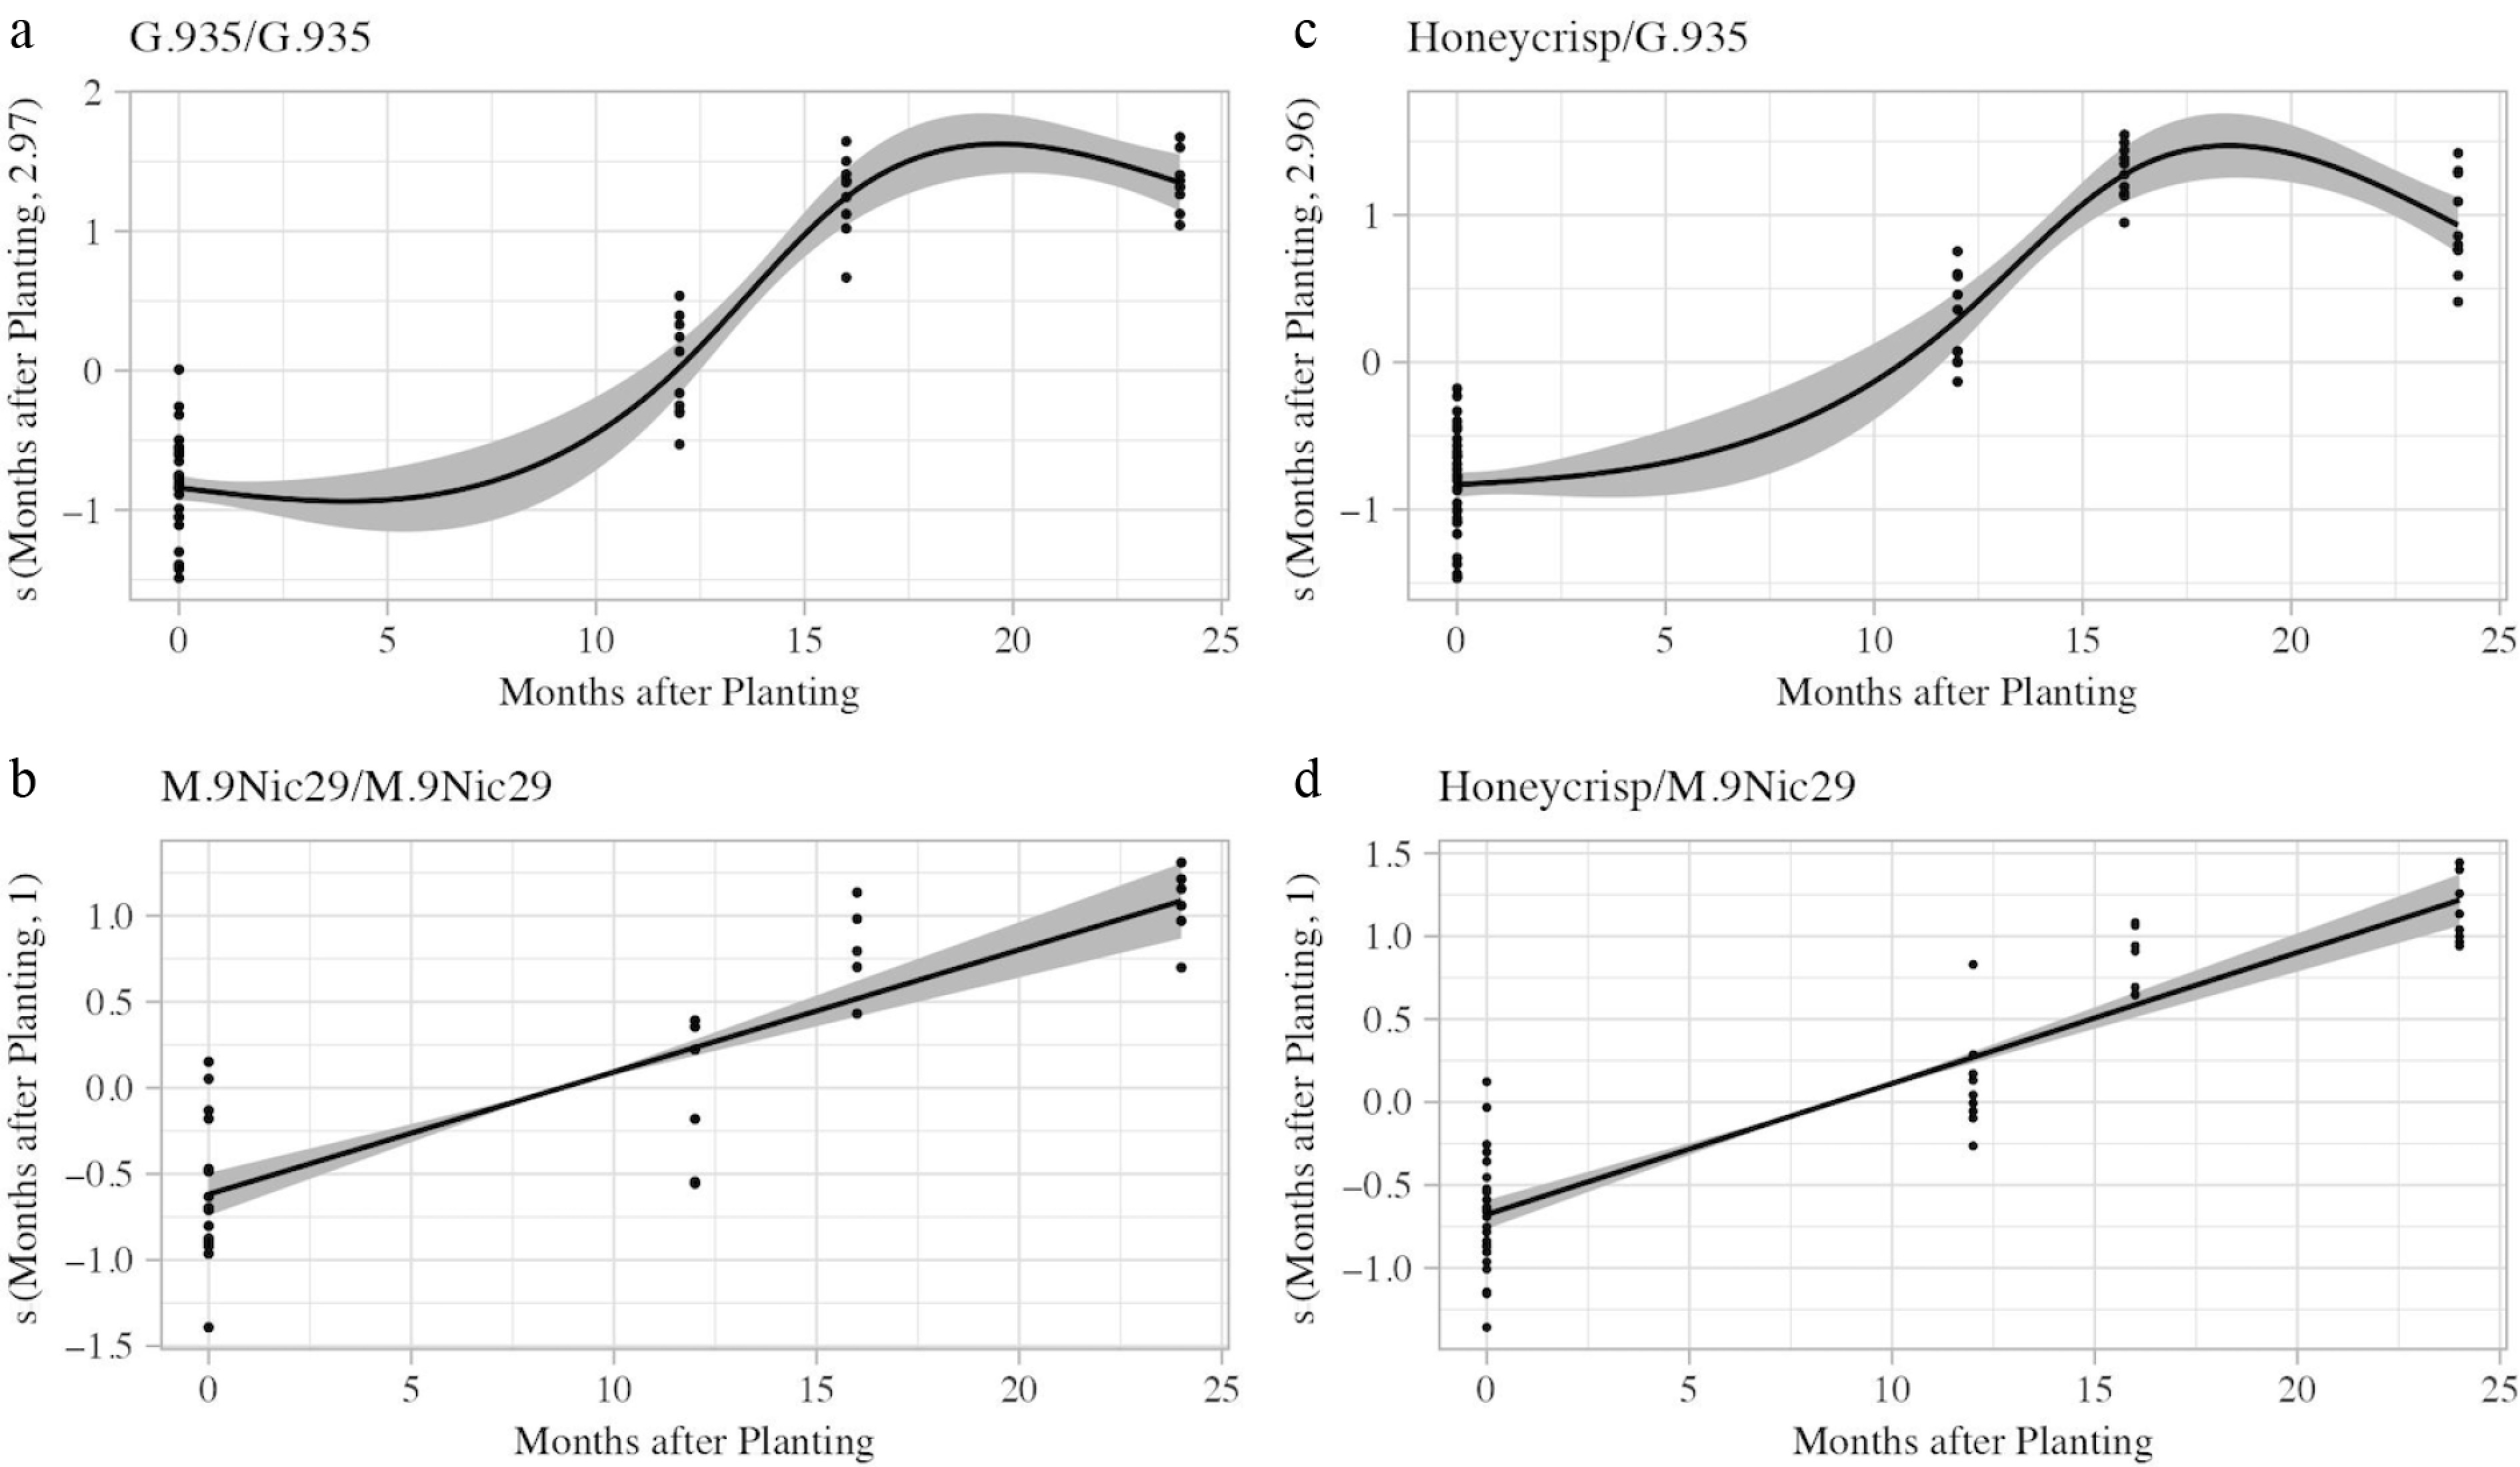
Figure 6.
Estimated smoothness of harvest date (months after planting) on apple root system surface area (mm2) for the four scion–rootstock combinations. (a) G.935/G.935. (b) M.9Nic29/M.9Nic29. (c) Honeycrisp/G.935. (d) Honeycrisp/M.9Nic29. The y-axis is the partial effect of harvest date, the shaded areas are the standard-error confidence intervals, and dots represent individuals.
-
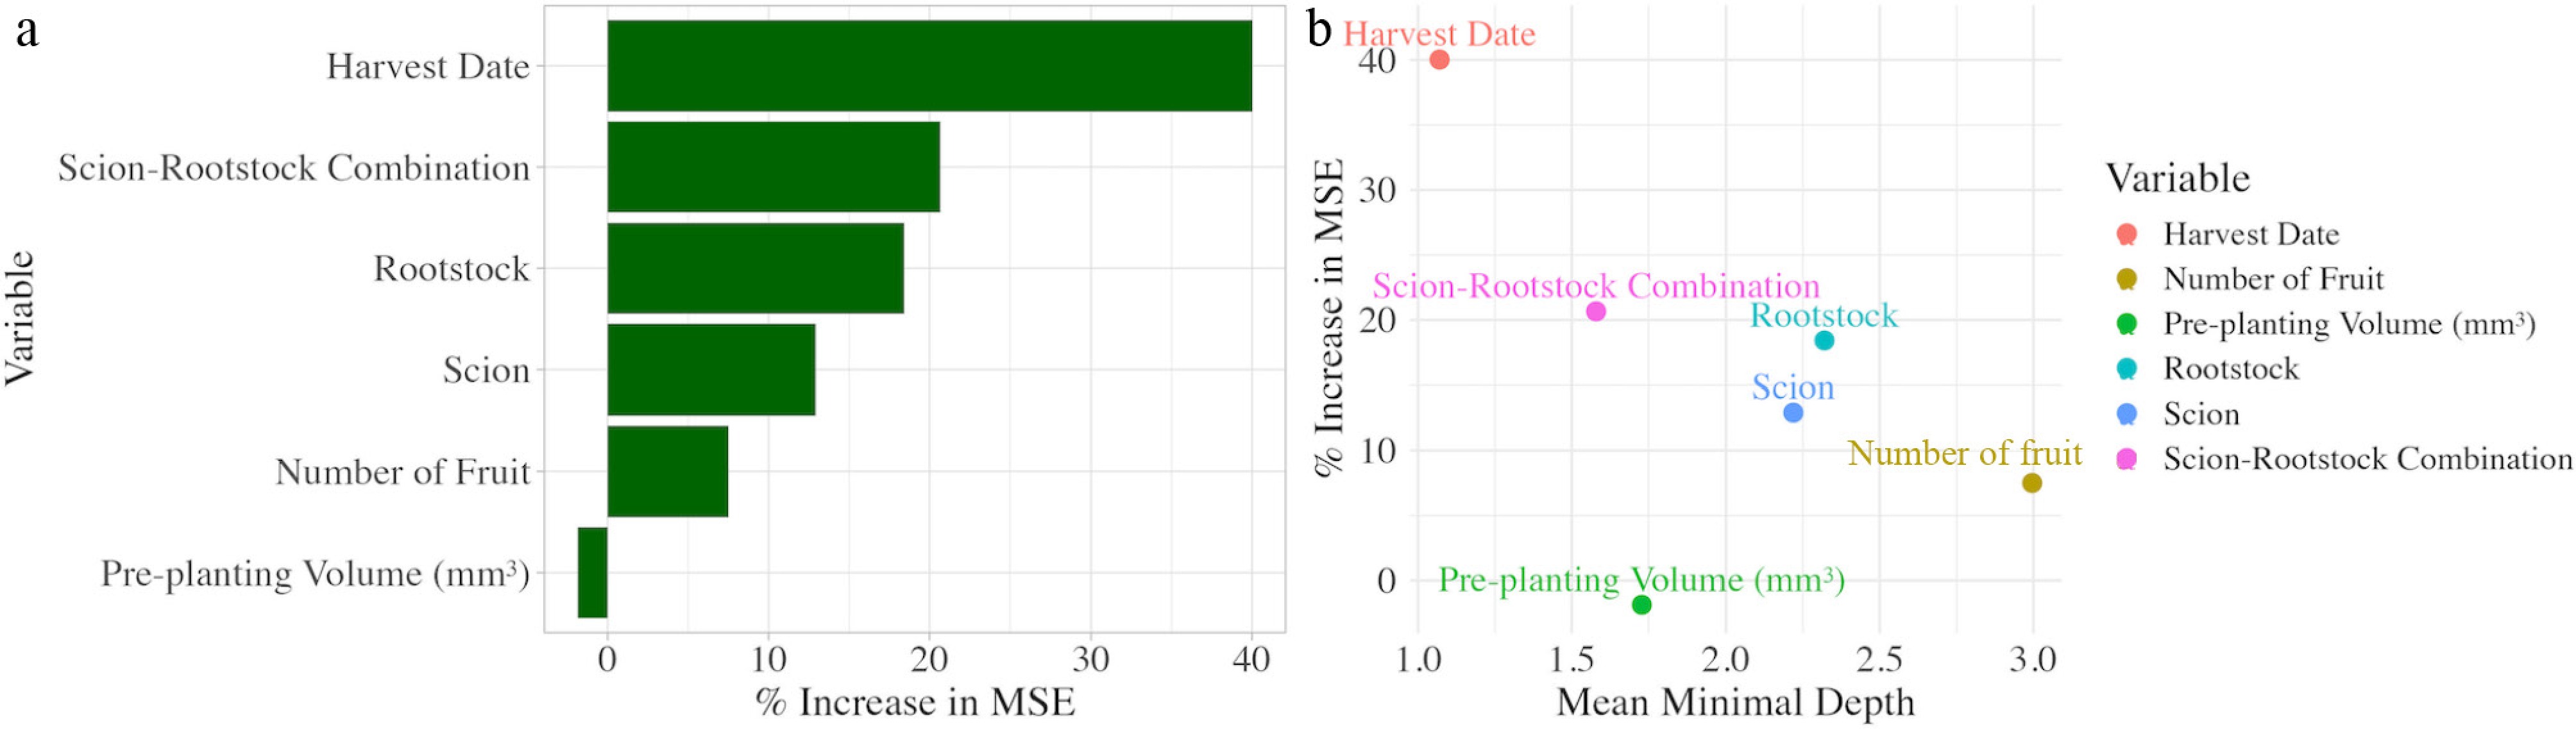
Figure 7.
(a) Percent increase in mean square error of the six predictor variables of apple root system volume (mm3) used in a random forest model. (b) Percent increase in mean square error (MSE) plotted against the mean minimal depth of the six predictor variables used in the model.
-
June 2022 October 2022 June 2023 G.935/G.935 0.31 ± 0.14
[1.03 ± 0.47] a0.68 ± 0.16
[2.23 ± 0.52] b0.47 ± 0.16
[1.55 ± 0.51] cHoneycrisp/G.935 0.33 ± 0.06
[1.08 ± 0.20] a0.58 ± 0.14
[1.90 ± 0.47] b0.37 ± 0.17
[1.21 ± 0.55] aM.9Nic29/M.9Nic29 0.26 ± 0.06
[0.85 ± 0.20] a0.47 ± 0.10
[1.53 ± 0.34] b0.36 ± 0.19
[1.18 ± 0.63] bHoneycrisp/M.9 Nic29 0.30 ± 0.10
[0.99 ± 0.33] a0.48 ± 0.10
[1.57 ± 0.34] b0.41 ± 0.18
[1.36 ± 0.59] bLetters represent significant (p < 0.05) differences in scion–rootstock combinations over time. Significance values are based on post hoc Tukey-adjusted pairwise comparison from a linear model. Table 1.
Average ± standard deviation (meters [feet]) of root system width of four apple scion–rootstock combinations over time.
Figures
(7)
Tables
(1)