


-
Root system architecture, the spatial configuration of roots in the soil, is central to overall plant function. It plays a critical role in soil anchorage, nutrient and water uptake, carbohydrate storage, and interaction with soil microbial communities[1]. In trees and other perennial species, roots are especially important due to their long lifespan and exposure to diverse stresses over many years. For example, in apples, first and second order roots are preferentially colonized by apple replant disease pathogens, while fine roots are associated with increased nutrient and water uptake[2,3]. Despite evidence that roots are vital for biotic and abiotic stress tolerance, their role in plant health remains comparatively understudied, particularly in perennial fruit crops.
Grafting, where a shoot from one plant (scion) is joined with the root system of another (rootstock), is the most common propagation technique for woody perennial fruit crops such as apple, citrus, almond, cherry, and grape. Because these crops are highly heterozygous and not true to seed, grafting allows propagation of clonal genotypes for consistent growth and productivity[4]. Selection of a rootstock is essential due to its direct effects on different scion traits, including tree vigor, precocity, and resistance to biotic and abiotic stresses[4]. In grapes, grafting Vitis vinifera scions onto resistant North American rootstocks is the only way to manage the insect Phylloxera in European grapevine[4]. In kiwifruit, rootstock choice significantly alters physiological pitting due to magnesium deficiency[4]. In the apple industry, dwarfing rootstocks are used to alter scion tree vigor and architecture and are important for soil-borne disease resistance and abiotic stress tolerance. Dwarfing rootstocks produce trees that are smaller and uniform in size and shape, allowing easier management, uniform fruit quality, and maximizing yield per acre[5]. Apple rootstocks are used to confer resistance to soil-borne apple replant disease, phytophthora crown and root rot (Phytophthora spp.), drought and winter injury[6−8].
Apple rootstocks have unique root systems due to clonal propagation; their root systems consist of a central stem with adventitious roots originating from leaf nodes. Dwarf rootstocks have been reported to have lower root length density, total root length, root dry mass, smaller spread, and a shorter lifespan in comparison to vigorous rootstocks[9−12]. Seasonal patterns of apple root growth are variable and are seemingly dependent on scion–rootstock combinations and environmental conditions[12−14]. While rootstock impacts on scion performance are well documented, research on the scion's effect on the rootstock is limited. In apple, scions have been shown to alter the root system architecture and nutrient uptake of rootstocks[15]. In grape, scions alter the root system architecture and gene expression of rootstocks under drought conditions[16,17]. The mechanisms underlying this relationship are unestablished in perennial crops, but in other plant species, proteins, mRNAs, non-coding RNAs, miRNAs, minerals, and phytohormones originating from the scion have been reported to alter the root system of the rootstock[18]. For example, the synthesis of Indole-3-Acetic Acid (IAA) in the shoot and its transport to roots is associated with enhanced root growth in tomato[19,20].
In a dense tree stand such as a high-density orchard, roots can form natural graft connections. This occurs when roots physically connect, after which their vascular systems can either fuse or remain disjointed. These natural root grafts can serve as a mechanism of resource sharing as well as a source of pathogen transmission. Water and carbohydrates have been reported to travel through natural root grafts in trees, potentially serving as a mechanism of cooperation[21,22]. Natural root grafting can also serve as a mechanism of disease spread. For instance, Ophiostoma ulmi and O. novo-ulmi, the causal agents of Dutch Elm Disease, and Bretziella fagacearum, the causal agent of Oak Wilt, primarily spread between trees through natural root grafts[23,24]. Similarly, viral disease transmission in roses and bacterial disease transmission in apples can occur via root grafts[25−27].
Understanding the influence of scion and rootstock-driven differences in root systems is especially important in high-density orchards, where there may be increased plant-plant competition and resource limitations[28]. However, a comprehensive understanding of apple root growth in modern high-density orchards is lacking. We studied the root systems of two commercial rootstocks, Malling 9 (M.9Nic29) and Geneva 935 (G.935), to investigate apple root system architectural features in different scion rootstock combinations in a high-density orchard over two years. These rootstocks represent different size-controlling and disease resistance profiles of scion genotypes. M.9Nic29 is the most widely planted apple rootstock in the world and is fully dwarfing[29]. G.935 is a semi-dwarfing rootstock that is resistant to apple replant disease and fire blight[30,31].
-
One-year-old G.935 and M.9Nic29 apple (Malus × domestica) rootstocks were obtained from TRECO Nursery (Woodland, Oregon). They were either self-grafted (M.9Nic29/M.9Nic29 or G.935/G.935) or grafted to 'Honeycrisp' (Malus × domestica cv. 'Honeycrisp') scions (Honeycrisp/M.9Nic29 or Honeycrisp/G.935) sourced from Red Jacket Orchard (Geneva, NY, USA) using whip-and-tongue bench grafting (Fig. 1b). Grafted plants were healed at 40 °C for six weeks and then planted in a high-density orchard (0.91 m [3 ft] between trees, 3.35 m [11 ft] between rows) at Cornell AgriTech, in Geneva, NY, USA (42.878951−77.006785) in May 2021 (Fig. 1a, c). More than 200 trees per acre is generally considered high density; the planting density in this study has approximately 1,300 trees per acre[32]. The orchard consisted of four rows containing 30 plants of each scion–rootstock combination. Geneva, NY has a warm-summer humid continental climate, characterized by warm, wet summers and cold, snowy winters (Fig. 2). The soil type is considered poorly drained and characterized as fine-silty according to the United States Department of Agriculture (USDA)-Natural Resources Conservation Service Soil Climate Analysis Network (NRCS) (Soil Survey Staff, 2025). The field was leveled before planting, and the plants were rainfed.
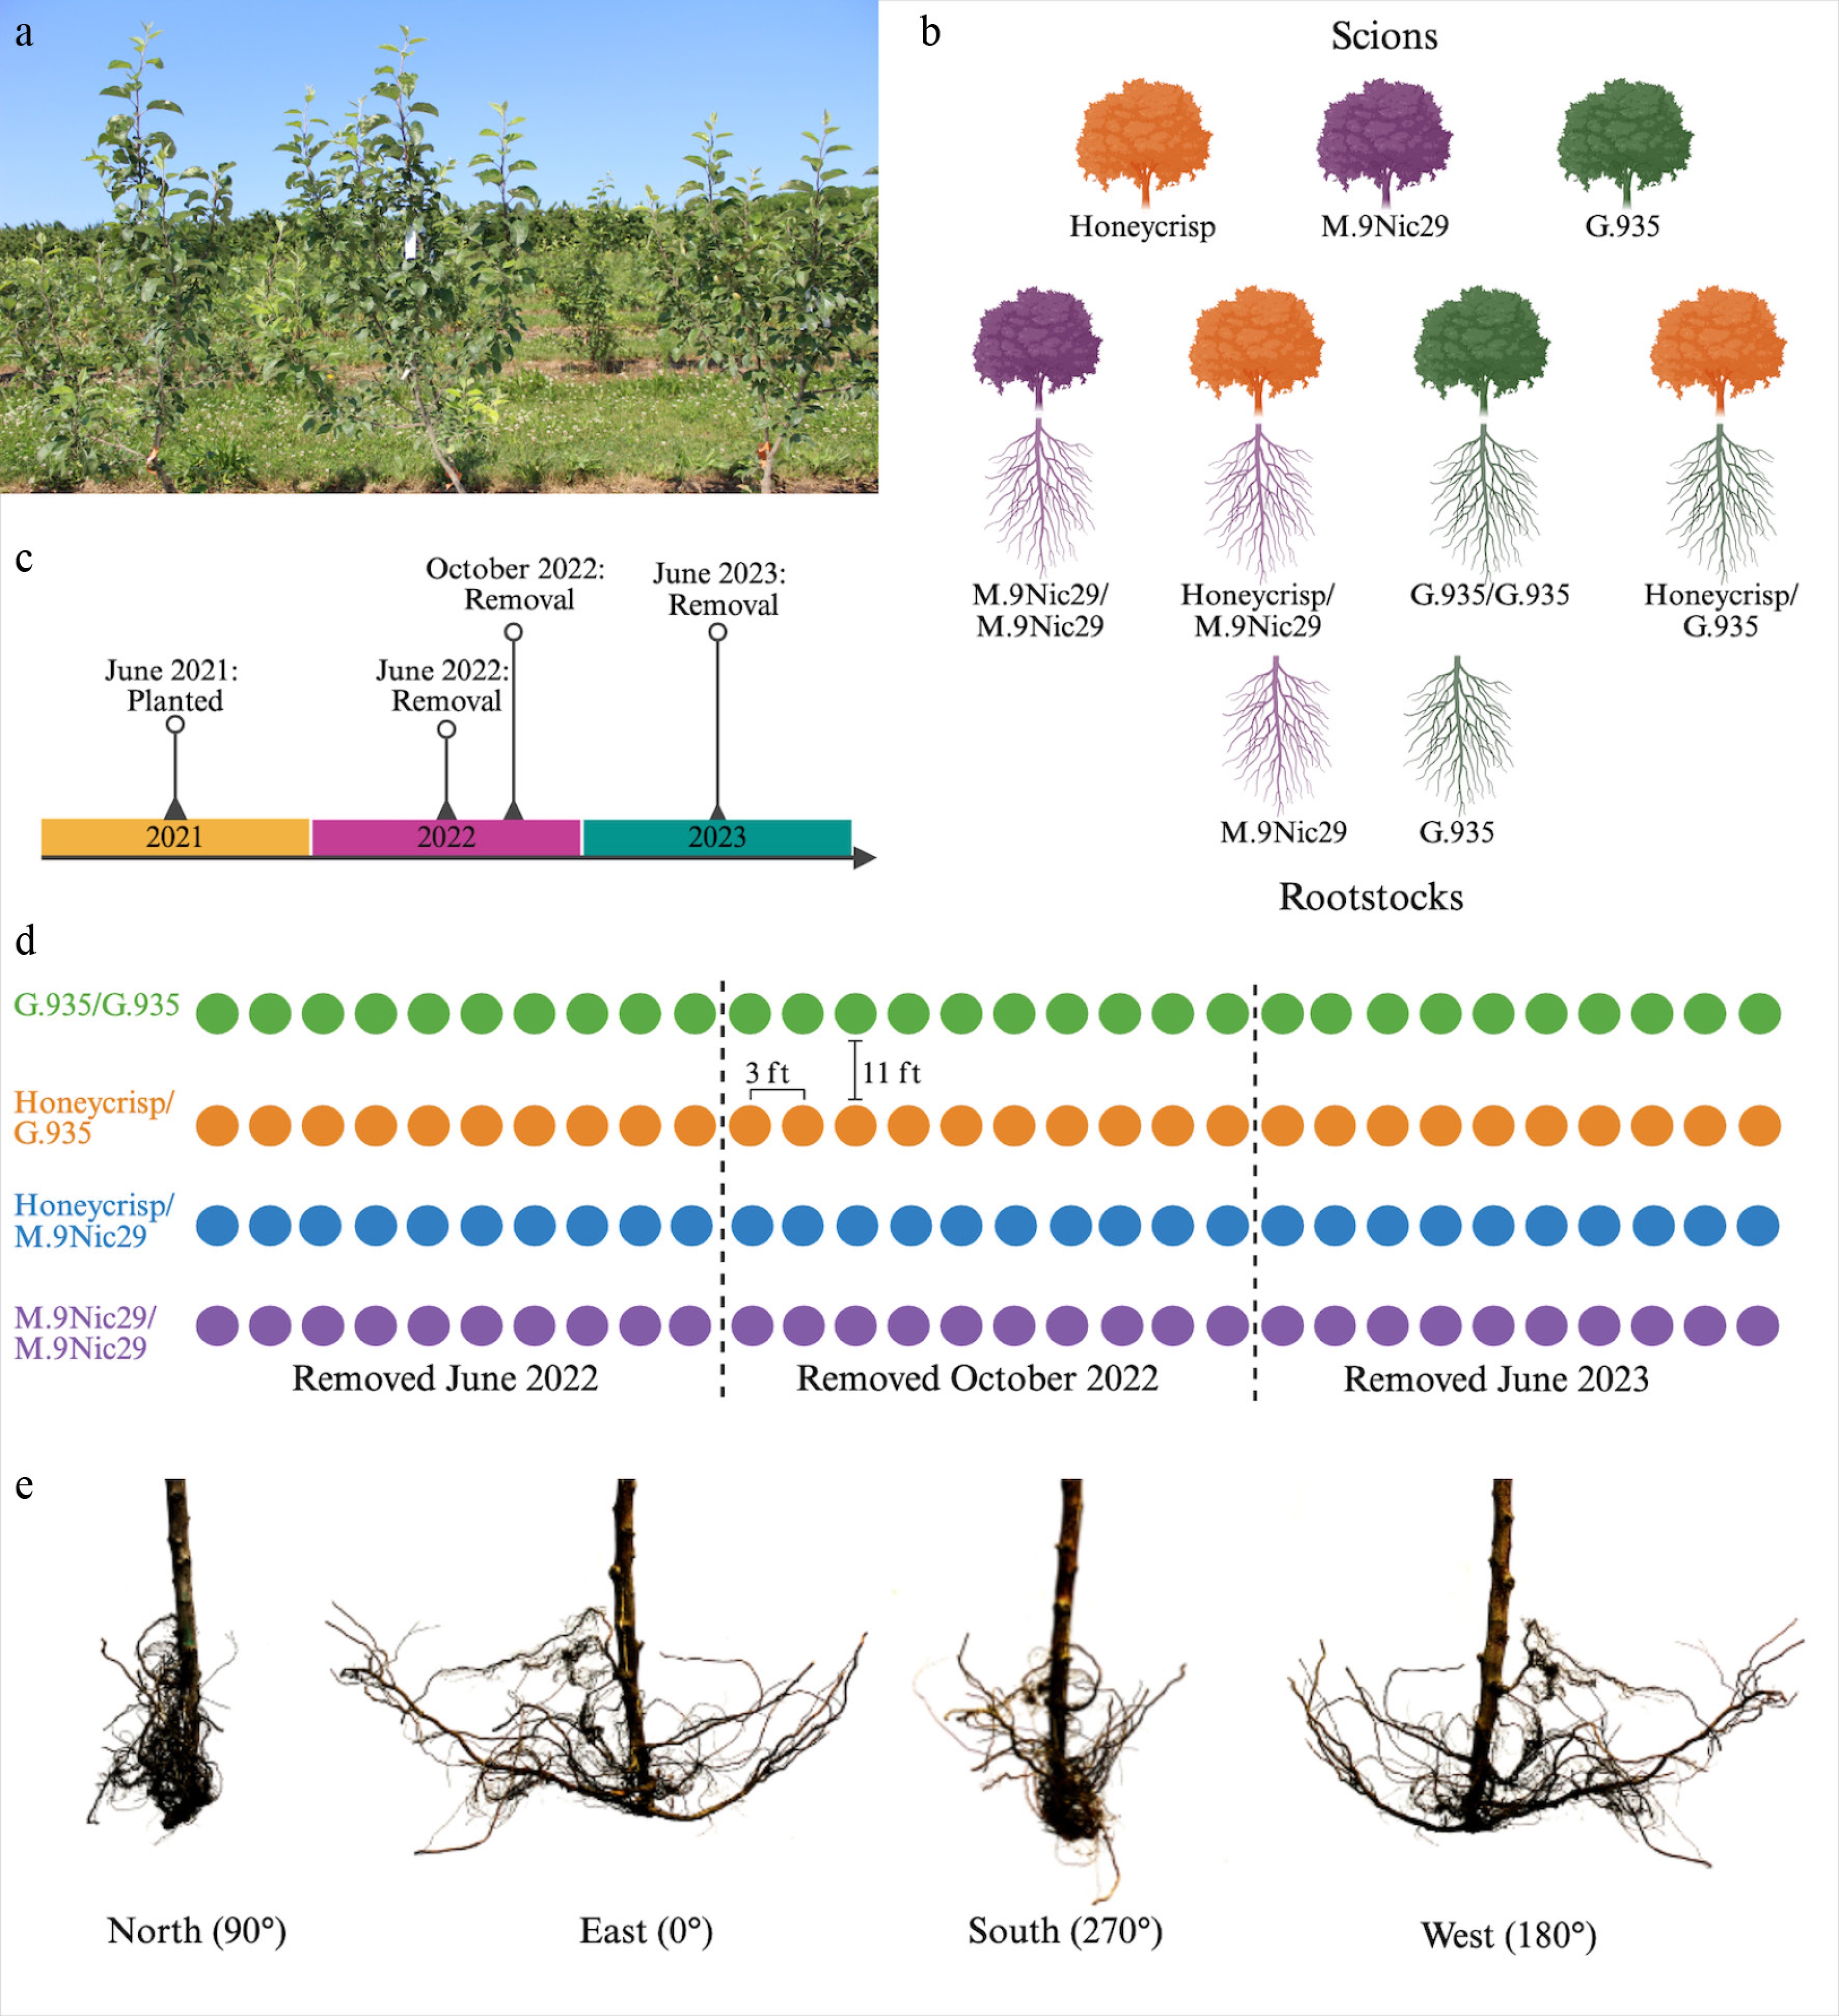
Figure 1.
Experimental design. (a) An image of the experimental orchard. (b) Diagram of the scion–rootstock combinations used in the experiment. (c) Timeline of the experiment. (d) The orchard experimental design. Each row is a row in the orchard, circles represent individual trees, and colors represent scion–rootstock combinations. (e) Images of a Honeycrisp/M.9Nic29 root system at each of the four orientations at which whole-root images were taken. Made with
biorender.com .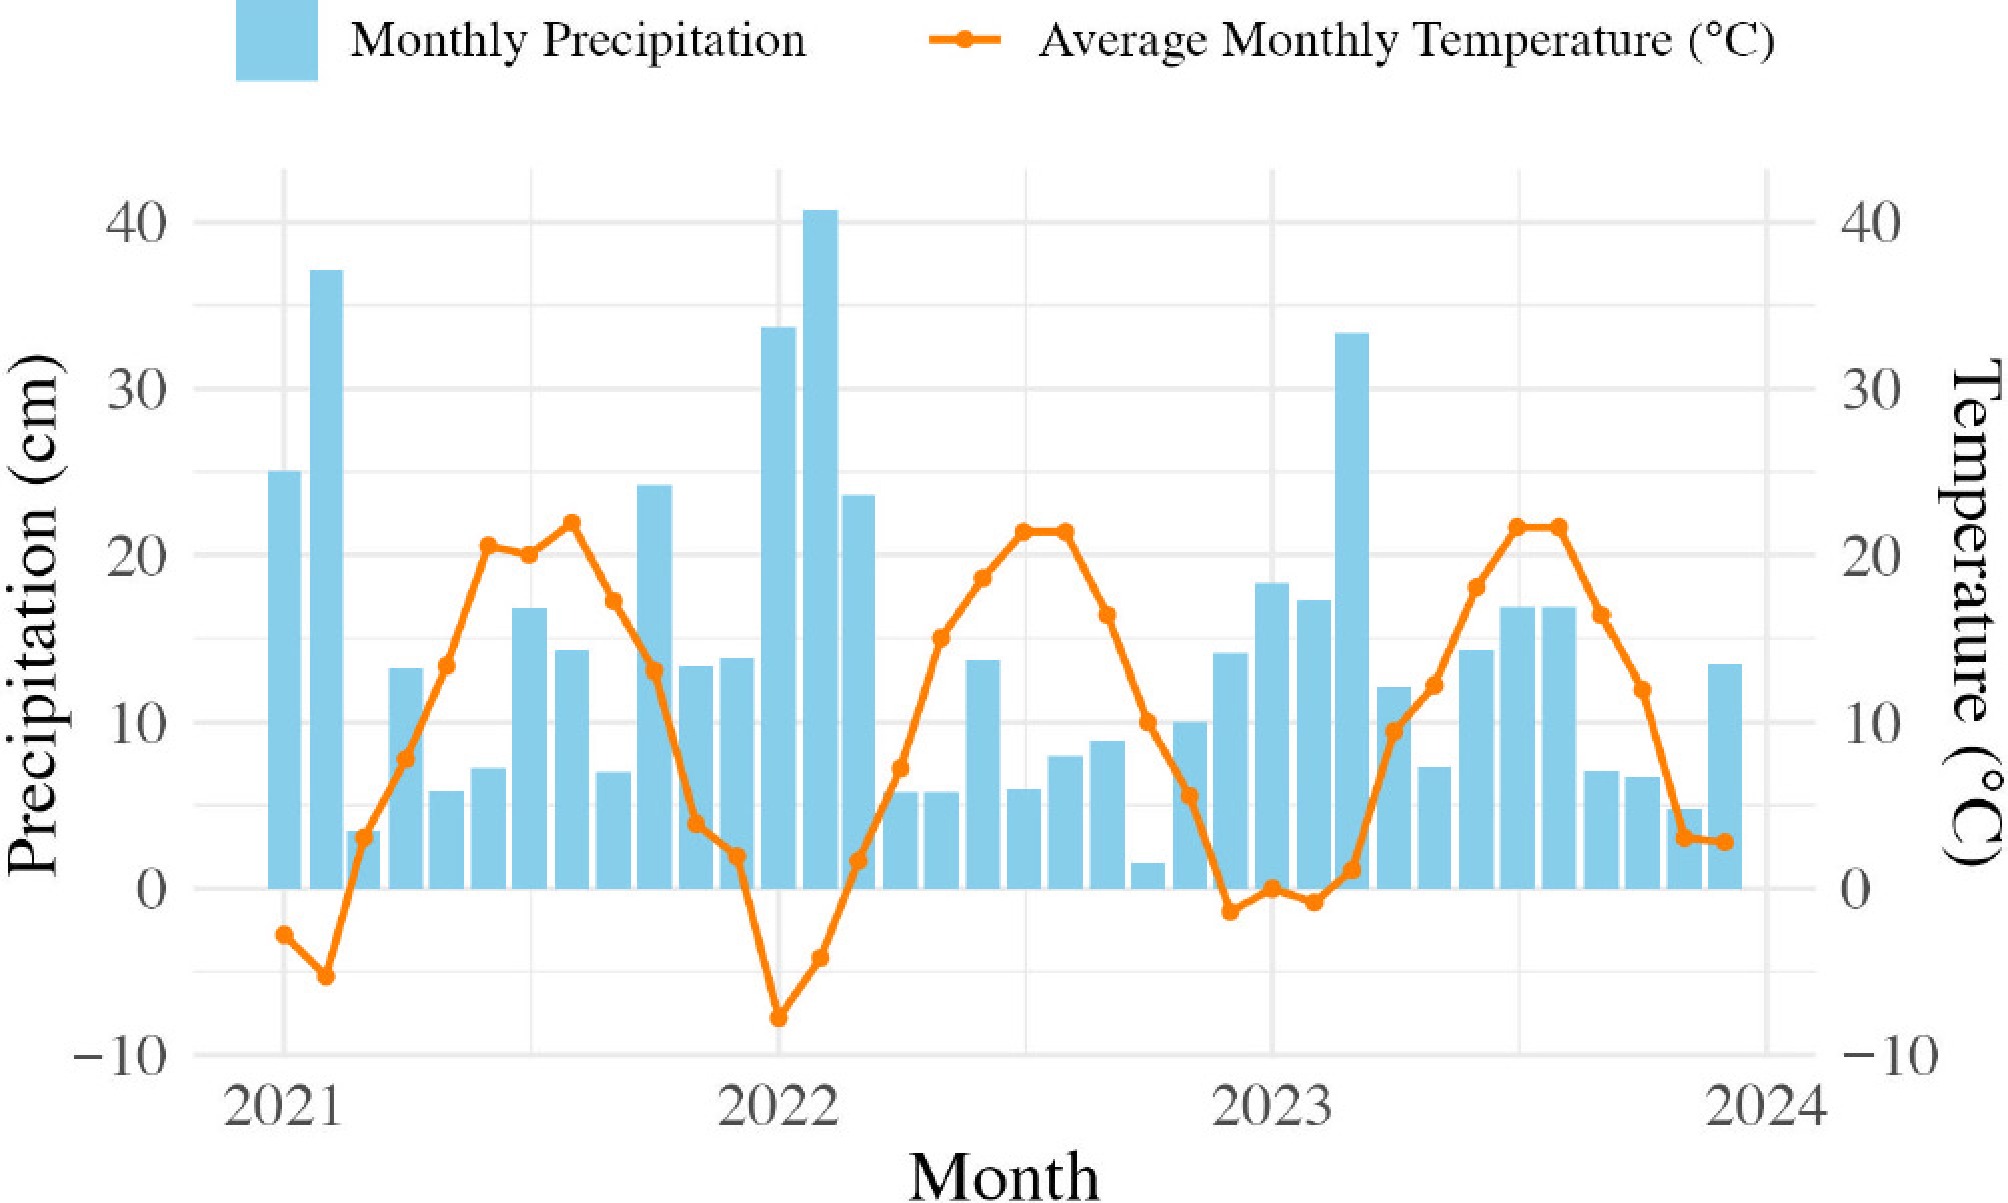
Figure 2.
Average monthly precipitation (cm) and high and low monthly temperatures (°C) in Geneva, NY, USA, between January 2021 and December 2024. Each blue bar represents the total precipitation (rain and snow) for the month, and each orange dot represents the average daily high temperature for the month. Weather information is from the NOAA National Centers for Environmental Information Database (
www.ncei.noaa.gov/cdo-web ). The weather station was at the Geneva research farm (Network ID: GHCND:USC00303184, 42.8766°, −77.0307°).Plant removal
-
Plants were removed from the ground at three time points approximately six months apart, in June 2022, October 2022, and June 2023 (Fig. 1c, d). These dates were chosen to represent the beginning and end of the growing season, starting one year after planting to allow the root system of the plants to establish. Five to ten plants of each scion–rootstock combination were removed at each time point (Fig. 1d). To remove the roots, the root ball and soil surrounding it were initially dug out of the ground using an excavator with a 3-ft bucket. Soil was removed from the roots by hand. All soil and the ground were inspected to collect any roots. All remaining soil was washed off the root system with tap water.
Root and shoot trait measurements
-
Photos of the root systems were taken before planting using a Canon EOS Rebel camera with a ruler placed in the image for scale. Before tree removal, photos of the tree canopy were taken from the front and the top of the tree, and whether or not the tree was fruiting (yes/no) was recorded. Rootstock and scion diameters one inch above and below the graft union were measured using a caliper. Trees harvested in October had already defoliated, so no canopy images were recorded at that time. Tree canopy images were preprocessed (background removed) using ImageJ[33], and then traits were measured (canopy surface area, canopy height, and canopy width) using a custom PlantCV[34] script that is available at the following link:
https://github.com/KhanLab-AppleDiseases/Canopy-Analysis .After washing, the roots were imaged and analyzed following the methods in Sabety et al.[35]. Briefly, intact root systems were hung from a horizontal bar, and images were taken every 90° (Fig. 1e). To track the orientation of the root system in the orchard, the north side of each tree was marked before the trees were removed. This allowed the images to capture the same spatial orientation of the root system (north/south/east/west) for each tree (Fig. 1e). Roots were then shaved off the central stem and imaged using a flatbed scanner (Epson Expression 12000XL). All images were processed with RhizoVision Explorer (v2.0.3)[36] with the settings detailed in Sabety et al. Fine roots were defined as roots less than 2 mm in diameter, medium roots were defined as roots between 2 and 5 mm in diameter, and coarse roots were defined as roots with a diameter greater than 5 mm. Pre-planting root images were processed in ImageJ (background objects removed and converted to black and white), and the scale was measured (px/mm) using ImageJ[33]. Scale was converted to dpi by dividing the px/mm value by the conversion unit from inches to mm (25.4). These images were then processed with RhizoVision Explorer (v2.0.3) in whole roots mode[36].
Data analysis
-
All data analysis was performed using R v4.5.0 (R Core Team, 2024). Linear mixed-effects models were fit using the 'lmerTest' package (v3.1.3)[37]. Pairwise comparisons of factorial, mixed-effects linear models were calculated using estimated marginal means using the 'emmeans' package (v1.11.1) with Tukey's adjustment for multiple comparisons[38]. Unless otherwise stated the analyzed root traits were the number of root tips, the number of root branch points, root branching frequency per mm, average root diameter (mm), maximum root diameter (mm), total root system volume (mm3), total root surface area (mm2), and total root length (mm), fine root volume (mm3), fine root surface area (mm2), and fine root length (mm), medium root volume (mm3), medium root surface area (mm2), and medium root length (mm), coarse root volume (mm3), coarse root surface area (mm2), and coarse root length (mm).
Rooting patterns
-
Rooting patterns were assessed using principal component analysis (PCA). PCA was performed using the 'prcomp' function from the base R 'stats' package with scaled data (R Core Team, 2024). Root trait data from all time points and scion–rootstock combinations, scion and root trunk cross-sectional area at the time of harvest (mm), location in the field, harvest date, pre-planting volume (mm3), and pre-planting surface area (mm2) were included in the analysis. Canopy traits were not included in the PCA analysis because plants harvested in October 2022 had defoliated.
Influence of scion, rootstock, space, pre-planting traits, canopy, and time on root system traits
-
To evaluate the influence of scion, rootstock, scion–rootstock combination, and time on the measured root traits, a 2 (scion) × 2 (rootstock) × 3 (harvest dates) full factorial fixed-effect linear model was fit with scion, rootstock, and harvest date: model = lm(log[Root Trait] ~ Scion * Rootstock * Harvest Date). This analysis was conducted separately for each root trait and was followed by pairwise comparisons. Traits were log-transformed to meet model assumptions. Assumptions of homoscedasticity and normality of residuals were checked by visual inspection of residual vs. fitted and QQ plots generated with the 'plot' function in R v4.5.0 (R Core Team, 2024).
To evaluate whether tree root systems grew wider in one direction, a linear mixed effects model with width as the response variable, root system orientation as a fixed effect, and scion–rootstock combination as a random effect was fit. Assumptions of homoscedasticity and normality of residuals were checked by visual inspection of residual vs fitted and QQ plots generated with the 'plot' function in R v4.5.0 (R Core Team, 2024).
To evaluate whether canopy area was correlated with root surface area, a linear model was fitted with root surface area as the response variable, canopy area as the fixed effect, and harvest date and scion–rootstock combination as random effects. This model tested whether canopy area was correlated with root surface area: model = lmer(log[Root Surface Area] ~ Log[Canopy Area] + [1/Harvest Date] + [1/Scion–Rootstock Combination]).
To determine the relationship between pre-planting root traits and post-harvest root traits, a linear model was fitted with post-harvest root traits as the response variable, pre-harvest surface area or volume as fixed effects, and harvest date and scion–rootstock combination as random effects: model =lmer(log[post-harvest root traits] ~ log[pre-harvest surface area or volume] + [1/Harvest Date] + [1/Scion–Rootstock Combination]).
Modeling root growth over time
-
Generalized additive models were used to model the total root surface area of the root system over time. Total root surface area data were log-transformed to meet assumptions. Total surface area at the time of planting was included. The total root surface area was chosen to track root growth because it explained the majority of the variation in root system architecture, as shown by PCA analysis. Models were created using the 'mgcv' package (v1.9.3)[39] with k = 4. Models with k = 4 were compared to models with k = 0 to evaluate the goodness of fit of the model. Goodness of fit was determined by comparing AIC values, effective degrees of freedom, p-value, adjusted R2, and percent variance explained.
Ranking of trait importance
-
The importance of traits was assessed and ranked using a random forest model. The models were created using the 'randomForest' package (v4.7.1.2)[40] in R v4.5.0 (R Core Team, 2024), and 500 trees were created. Percent mean square error (%IncMSE) increase was used to rank the traits. Mean minimum depth was used to further understand how the traits explained variance. The predictor variables used were harvest date, rootstock–scion combination, rootstock, scion, number of fruit, and original root system size. A generalized additive model (GAM) from the 'mgcv' package (v1.9.3)[39] was then used to determine the variance explained by each trait.
-
PCA identified the most important root traits at the three harvest timepoints for all plants. The first, second, and third PCs explained 61.01%, 16.75%, and 7% of the variance, respectively (Fig. 3a). The first PC's top three variables by loading were total root volume (−0.257), total root surface area (−0.254), and fine root volume (−0.249) (Fig. 3b). The second PC's top three variables by loading were average root diameter (0.405), number of root branch points (−0.346), and number of root tips (−0.332) (Fig. 3b). The third PC's two significant variables were pre-harvest root volume (−0.703) and pre-harvest root surface area (−0.671) (Fig. 3b). The only clear grouping of traits was by date, with June 2022 plants distinctly clustering from plants harvested in October 2022 and June 2023 (Fig. 3a).
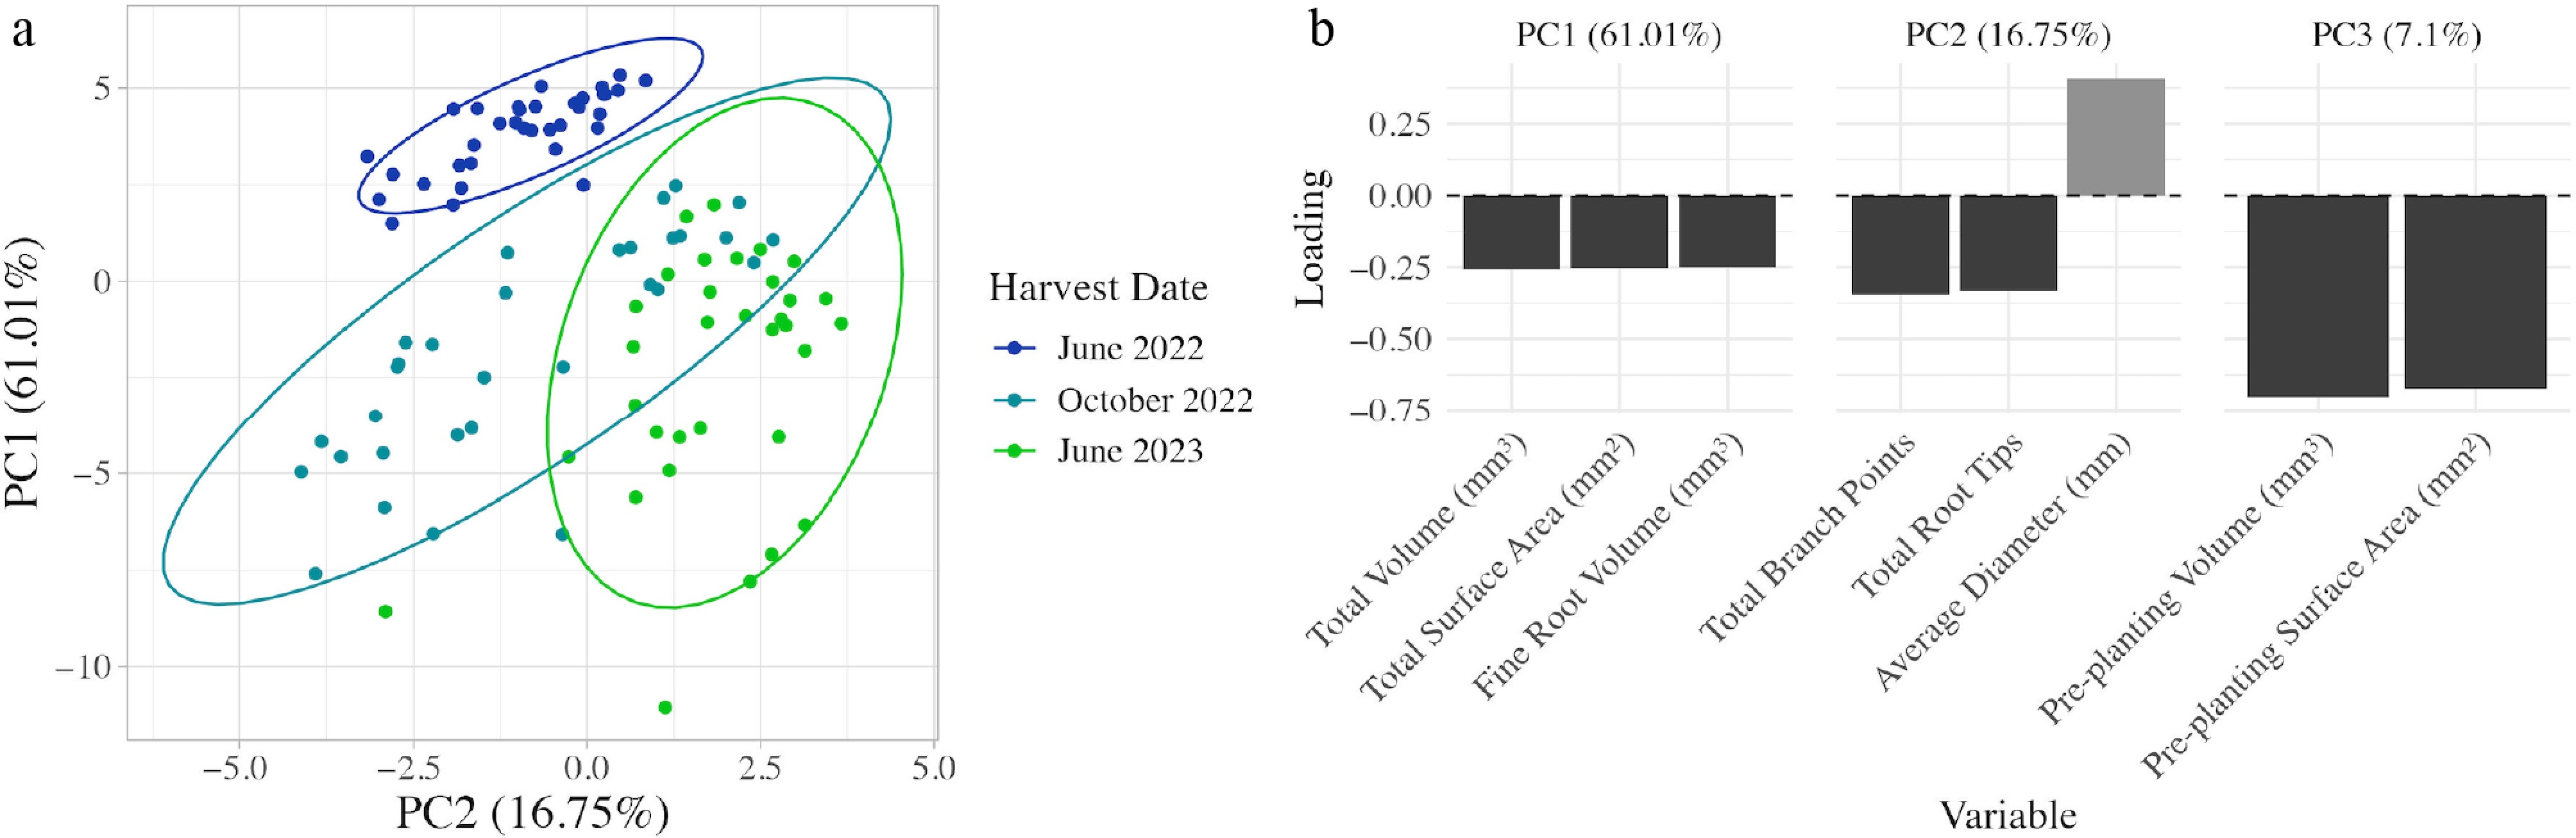
Figure 3.
PCA analysis to describe apple root traits. (a) Biplot of the first two principal components (PC) at the three harvest timepoints for all apple scion–rootstock combinations used in the experiment. Ellipses and colors represent the harvest date of each plant. (b) Bar plot showing the loading values of the top three variables for the first three principal components. Dark grey represents a negative loading, and light grey represents a positive loading. PCA analysis was calculated using rootstock and scion trunk cross sectional area at the time of harvest (mm), the number of root tips, the number of root branch points, branching frequency per mm, average root diameter (mm), maximum root diameter (mm), total, fine, medium, and coarse root system volume (mm3), surface area (mm2), and length (mm), pre-planting volume (mm3), and pre-planting surface area (mm2).
Influence of scion and rootstock on root trait size and growth over time
M.9Nic29 and G.935
-
All root traits were significantly different between each rootstock at each time point when controlled for grafted scion cultivar (p < 0.05, Tukey-adjusted), except branching frequency in October 2022, average diameter in June 2022, and width at all time points (p > 0.05, Tukey-adjusted). G.935 had significantly (p < 0.05, Tukey-adjusted) higher trait values than M.9Nic29 for all traits except average root diameter (Fig. 4a).
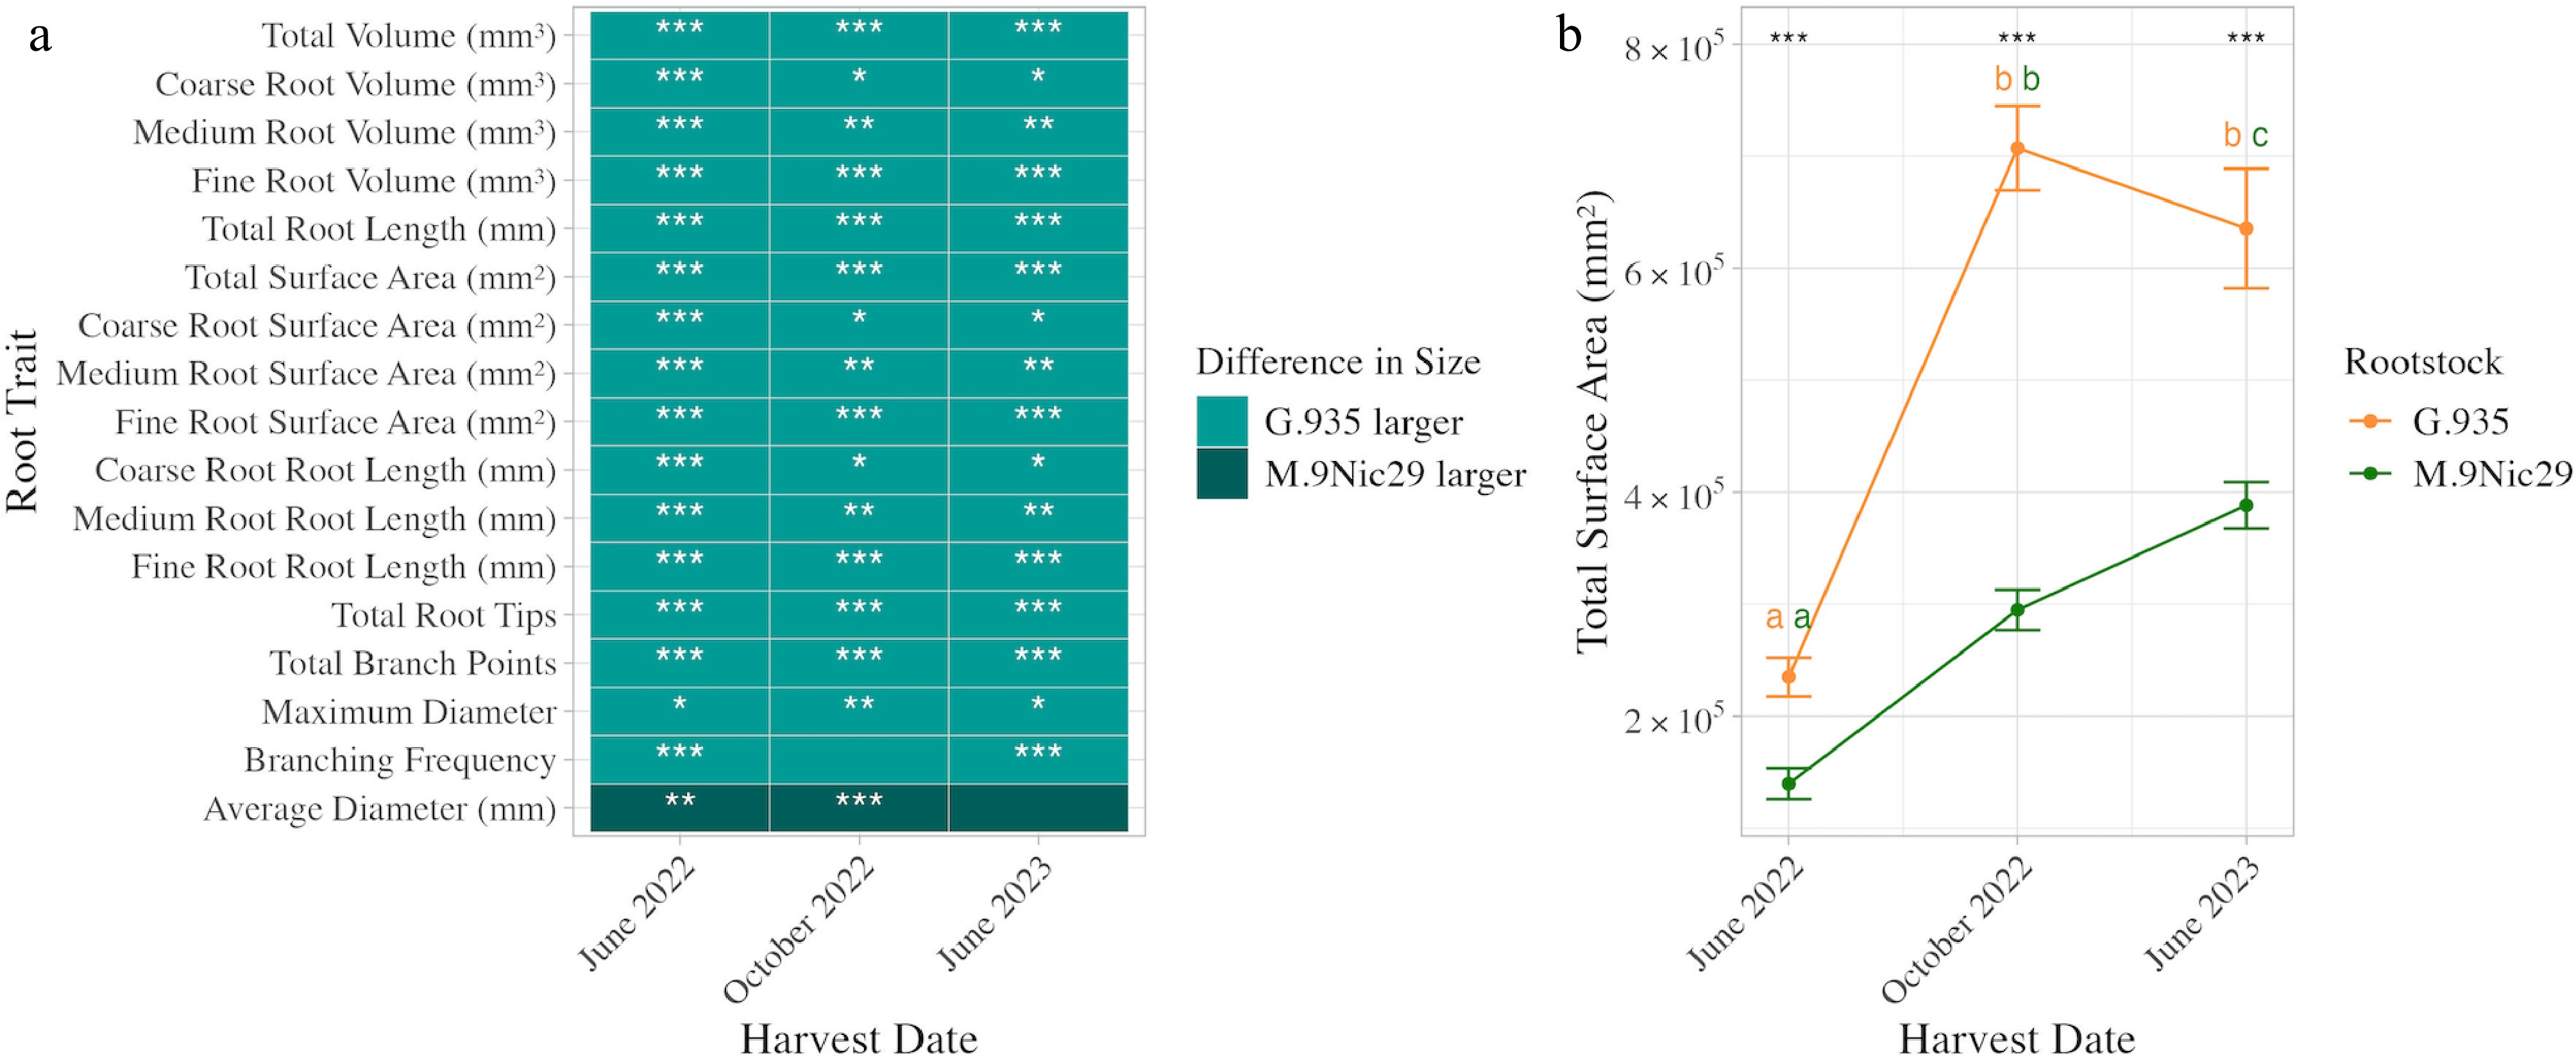
Figure 4.
Size and growth differences between M.9Nic29 and G.935 apple rootstocks. (a) Heatmap showing the difference in root trait size between M.9Nic29 and G.935 apple rootstocks. The light blue color indicates that G.935 has a larger trait value than M.9Nic29, and the dark blue color indicates that M.9Nic29 has a larger trait value than G.935. Stars indicate a significant difference between rootstocks: * p < 0.05, ** p < 0.01, *** p < 0.001. (b) A line graph showing the root surface area (mm2) of the two rootstocks (mean ± SE) over time. Yellow lines and letters represent G.935 rootstocks, and green lines and letters represent M.9Nic29 rootstocks. Letters indicate significant (p < 0.05) differences between time points within each rootstock. Stars indicate significant differences between rootstocks. Significance values are based on post hoc Tukey-adjusted pairwise comparison from a linear model.
When controlled for scion, M.9Nic29 and G.935 root systems have a significant (p < 0.05, Tukey-adjusted) increase in all measured root traits between June 2022 and October 2022, although G.935 rootstocks generally grew much more during this time period (Fig. 4b). The exception to this is root branching frequency in G.935 rootstocks, which shows a significant decrease (p = 2.3 × 10⁻⁶, Tukey-adjusted) between these time points. The majority of root traits of M.9Nic29 rootstocks did not show a significant (p > 0.05, Tukey-adjusted) difference in size between October 2022 and June 2023. Root branching frequency decreased (p = 9.78 × 10⁻⁵, Tukey-adjusted), fine root surface area (p = 0.45, Tukey-adjusted), total root surface area (p = 0.0097, Tukey-adjusted), and fine root volume increased (p = 0.0025, Tukey-adjusted) (Fig. 4b). Root traits of G.935 rootstocks were much more variable between October 2022 and June 2023. Average root diameter (p = 3.09 × 10⁻¹⁰, Tukey-adjusted), medium root length (p = 0.017, Tukey-adjusted), and medium root surface area (p = 0.029, Tukey-adjusted) significantly increased. Root branching frequency, the number of root branch points, the number of root tips, fine root surface area, fine root length, and total root length all significantly decreased during this time (p < 0.05, Tukey-adjusted) (Fig. 4b). G.935 rootstocks show a significant increase in width between all time points (p < 0.0025, Tukey-adjusted). M.9Nic29 rootstocks show an increase in root system width between June 2022 and October 2022 and no significant increase in root system width between October 2022 and June 2023 (p < 0.0001 and 0.1246, respectively, Tukey-adjusted).
Honeycrisp/G.935 and G.935/G.935
-
Many root traits differ between Honeycrisp/G.935 and G.935/G.935 plants throughout the experiment (Fig. 5a). Initially, in June 2022, G.935/G.935 plants had significantly (p = 1.1 × 10⁻⁷, Tukey-adjusted) higher root branching frequency than Honeycrisp/G.935. In October 2022, Honeycrisp/G.935 had significantly (p = 0.026, Tukey-adjusted) higher root branching frequency. In June 2023, G.935/G.935 plants had significantly (p < 0.05, Tukey-adjusted) larger values than Honeycrisp/G.935 in every measured root trait, except for root branching frequency (Fig. 5a). These temporal shifts and final differences underscore the strong influence of the scion on the G.935 root system's development.
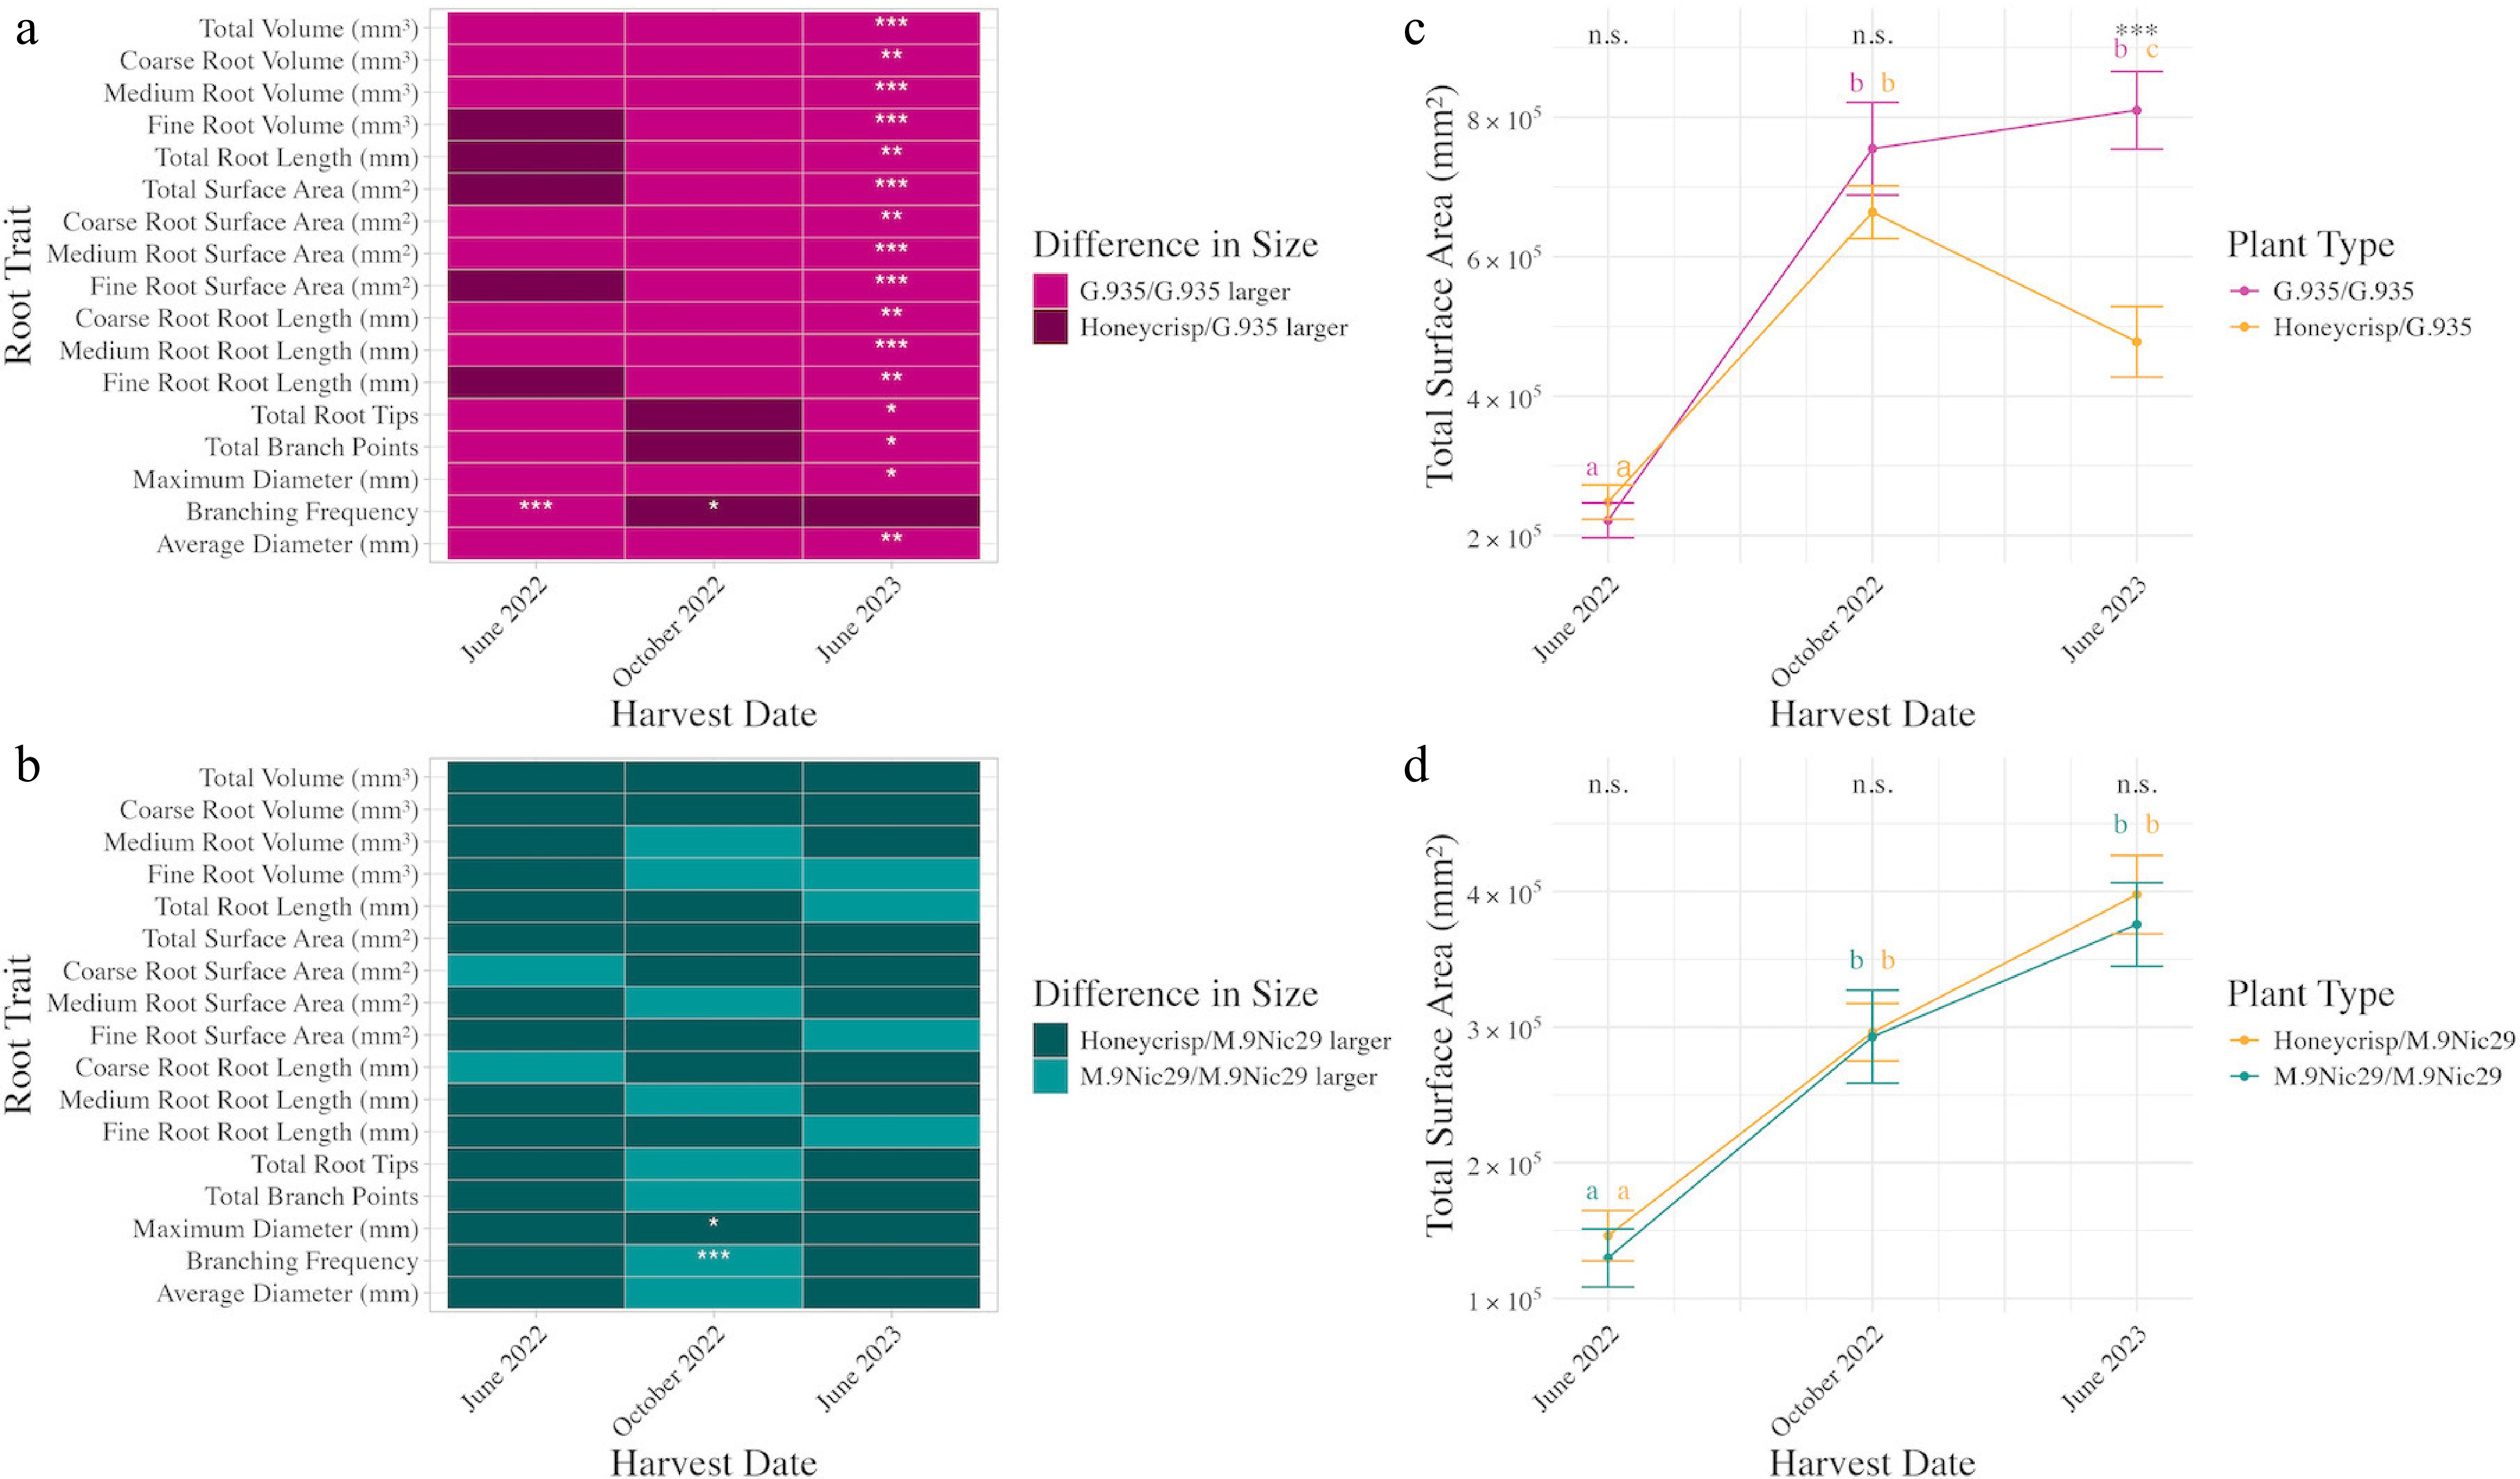
Figure 5.
Impact of scion on size and growth rate of apple rootstocks. (a) Size difference between G.935/G.935 and Honeycrisp/G.935. The lighter color represents G.935/G.935 being numerically larger on average. (b) Size difference between M.9Nic29/M.9Nic29 and Honeycrisp/M.9Nic29. The lighter color represents M.9Nic29/M.9Nic29 being numerically larger on average. (c) Change in the root system surface area (mean ± SE) over time for G.935/G.935 (pink) and Honeycrisp/G.935 (yellow). (d) Change in the root system surface area (mean ± SE) over time for M.9Nic29/M.9Nic29 (blue) and Honeycrisp/M.9Nic29 (yellow). Asterisks represent significant differences in the size of the measured trait of both rootstocks. * p < 0.05, ** p < 0.01, *** p < 0.001. Letters represent significant (p < 0.05) differences between each time point. n.s. means no significance (p > 0.05). The colors of the letters indicate the plant type they are for, as defined above. Significance values are based on post hoc Tukey-adjusted pairwise comparison from a linear model.
Specifically, scion choice (self-grafted or Honeycrisp) altered the growth patterns of G.935 root systems. Maximum diameter, number of root tips, fine root traits (surface area, volume), medium root traits (surface area, volume, length), and coarse root traits (surface area, volume, length), total root traits (surface area, volume, length) had different growth patterns depending on the scion (Supplementary Fig. S1). Generally, the root traits of both plant types significantly (p < 0.05) increased in size between June 2022 and October 2022, and then the growth patterns diverged and generally resulted in Honeycrisp/G.935 having a smaller root system (Fig. 5a, c, Supplementary Fig. S1). Average root diameter, the number of branch points, and fine root length did not have different growth patterns between the grafting combinations (Supplementary Fig. S1).
Honeycrisp/M.9Nic29 and M.9Nic29/M.9Nic29
-
Honeycrisp/M.9Nic29 and M.9Nic29/M.9Nic29 plants generally do not differ in root system size at different time points (Fig. 5b). The exceptions are that M.9Nic29/M.9Nic29 plants have significantly higher root branching frequency in October 2022, and Honeycrisp/M.9 Nic29 plants have significantly larger maximum root diameter in October 2022 (p = 7.3 × 10⁻⁷ and 0.042, respectively, Tukey-adjusted). Scion choice (self-grafted or Honeycrisp) did not impact the temporal dynamics of most measured M.9Nic29 root traits (Fig. 5d, Supplementary Fig. S1). Medium root length and surface area, branching frequency, number of root tips, and fine root volume are the only root traits with different growth patterns between grafting combinations (Supplementary Fig. S1).
Honeycrisp/G.935 and Honeycrisp/M.9Nic29
-
Honeycrisp/G.935 has significantly (p < 0.05, Tukey-adjusted) higher values in all root traits than Honeycrisp/M.9Nic29, except for maximum root diameter, average root diameter, and medium root traits (surface area, volume, and length) in June 2022 and October 2022. These plants do not significantly differ in size for any traits in June 2023 (p > 0.05, Tukey-adjusted). Honeycrisp/M.9Nic29 and Honeycrisp/G.935 do not significantly differ in maximum diameter or medium root length at any point (p > 0.05, Tukey-adjusted). Honeycrisp/G.935 does have significantly larger medium root surface area and volume in June 2022 (p = 0.024 and 0.043, respectively, Tukey-adjusted), but these traits are not significantly different at the next two time points (p > 0.05, Tukey-adjusted). Honeycrisp/M.9Nic29 has a significantly larger average diameter in June 2022 and October 2022 (p = 0.012 and 8.24 × 10⁻¹⁰, respectively, Tukey-adjusted) than the plants that do not differ. Honeycrisp/G.935 and Honeycrisp/M.9Nic29 do not significantly differ in width at any time point (p > 0.39, Tukey-adjusted).
G.935/G.935 and M.9Nic29/M.9Nic29
-
G.935/G.935 has significantly more root tips, total root length, root volume, root surface area, and fine root traits (length, surface area, volume) than M.9Nic29/M.9Nic29 at all time points (p > 0.05, Tukey-adjusted). G.935/G.935 has significantly more coarse and medium root traits (length, volume, surface area) in June of 2022 and June 2023 (p > 0.05, Tukey-adjusted). The plants do not significantly differ in these traits in October 2022 (p < 0.05, Tukey-adjusted). G.935/G.935 had a significantly larger average root diameter in October 2022 (p = 2.26 × 10⁻⁶, Tukey-adjusted), and M.9Nic29/M.9Nic29 has significantly higher root branching frequency in October 2022 (p = 3.09 × 10⁻¹⁰, Tukey-adjusted). The plants did not significantly differ in their root system width in June 2022 and June 2023 (p > 0.05, Tukey-adjusted). G.935/G.935 has a significantly larger width than M.9Nic29/M.9Nic29 in October 2022 (p = 0.03, Tukey-adjusted).
Tree canopy and root system size
-
Root system size can predict tree canopy surface area (p = 1.13 × 10⁻⁶, linear model) in the four scion–rootstock combinations used in this study. As root system surface area increases, canopy area increases.
Impact of the initial root system
-
G.935's pre-planting surface area is significantly larger than M.9Nic29's (p = 0.028, Tukey-adjusted). G.935 still has a significantly larger (p < 0.01, Tukey-adjusted) total root surface area (mm2) at all harvest dates than M.9Nic29 when controlling for pre-planting size, implying that the size difference observed between these rootstocks is not explained by the size of the root system before planting.
When controlling for scion and harvest date, both pre-harvest surface area and volume were able to significantly (p < 0.02, linear model) predict post-harvest medium root traits (volume, surface area, and root length). Pre-planting root system volume can significantly (p < 0.04, linear mixed effects model) predict post-harvest root volume in rootstocks grafted to Honeycrisp scions in June 2022 and in Honeycrisp/G.935 in June 2023.
Both the PCA and the random forest model indicate that pre-planting root system size is not an influential factor in explaining post-harvest root system traits. Pre-planting surface area and volume are variables in PC3, which explains only 7.1% of the variation in root systems (Fig. 3b). Pre-planting surface area had a negative percent increase in mean square error in the random forest model (−0.31), indicating that it is irrelevant for predicting total root system surface area. These results indicate that while the overall size of the root system before planting is reflective of its size after planting at certain times and in certain graft combinations, it is ultimately not a large predictor of post-harvest root system architecture.
Root system width
-
Root system width did not differ in the N/S and E/W directions in all plant types (p > 0.05). G.935/G.935 root systems are 1.03 ± 0.47 ft wide in June 2022, 2.23 ± 0.52 ft wide in October 2022, and 1.55 ± 0.51 wide in June 2023 (mean ± SD). Honeycrisp/G.935 root systems are 1.08 ± 0.20 ft wide in June 2022, 1.90 ± 0.47 ft wide in October 2022, and 1.21 ± 0.55 wide in June 2023 (mean ± SD). M.9Nic29/M.9Nic29 root systems are 0.85 ± 0.20 ft wide in June 2022, 1.53 ± 0.34 ft wide in October 2022, and 1.18 ± 0.63 ft wide in June 2023 (mean ± SD). Honeycrisp/M.9Nic29 root systems are 0.99 ± 0.33 ft wide in June 2022, 1.57 ± 0.34 ft wide in October 2022, and 1.36 ± 0.59 ft wide in June 2023 (mean ± SD) (Table 1).
Table 1. Average ± standard deviation (meters [feet]) of root system width of four apple scion–rootstock combinations over time.
June 2022 October 2022 June 2023 G.935/G.935 0.31 ± 0.14
[1.03 ± 0.47] a0.68 ± 0.16
[2.23 ± 0.52] b0.47 ± 0.16
[1.55 ± 0.51] cHoneycrisp/G.935 0.33 ± 0.06
[1.08 ± 0.20] a0.58 ± 0.14
[1.90 ± 0.47] b0.37 ± 0.17
[1.21 ± 0.55] aM.9Nic29/M.9Nic29 0.26 ± 0.06
[0.85 ± 0.20] a0.47 ± 0.10
[1.53 ± 0.34] b0.36 ± 0.19
[1.18 ± 0.63] bHoneycrisp/M.9 Nic29 0.30 ± 0.10
[0.99 ± 0.33] a0.48 ± 0.10
[1.57 ± 0.34] b0.41 ± 0.18
[1.36 ± 0.59] bLetters represent significant (p < 0.05) differences in scion–rootstock combinations over time. Significance values are based on post hoc Tukey-adjusted pairwise comparison from a linear model. Modeling root growth over time
-
All generalized additive models (GAM) and linear models were significant (p < 2 × 10⁻¹⁶). M.9Nic29/M.9Nic29 and Honeycrisp/M.9Nic29 plants had GAMs indistinguishable from linear models; these models had effective degrees of freedom of one, implying that there is no difference from a linear model. These models also had the same AIC adjusted-R2 and deviance explained values (Supplementary Table S1). The models imply that M.9Nic29 rootstocks have a linear increase in root surface area over time, beginning immediately after planting. The maximum root surface area (predicted value of 375,698.1 mm2 for M.9Nic29/M.9Nic29 and 419,215.4 mm2 for Honeycrisp/M.9Nic29) is reached two years after planting (Fig. 6b, d).
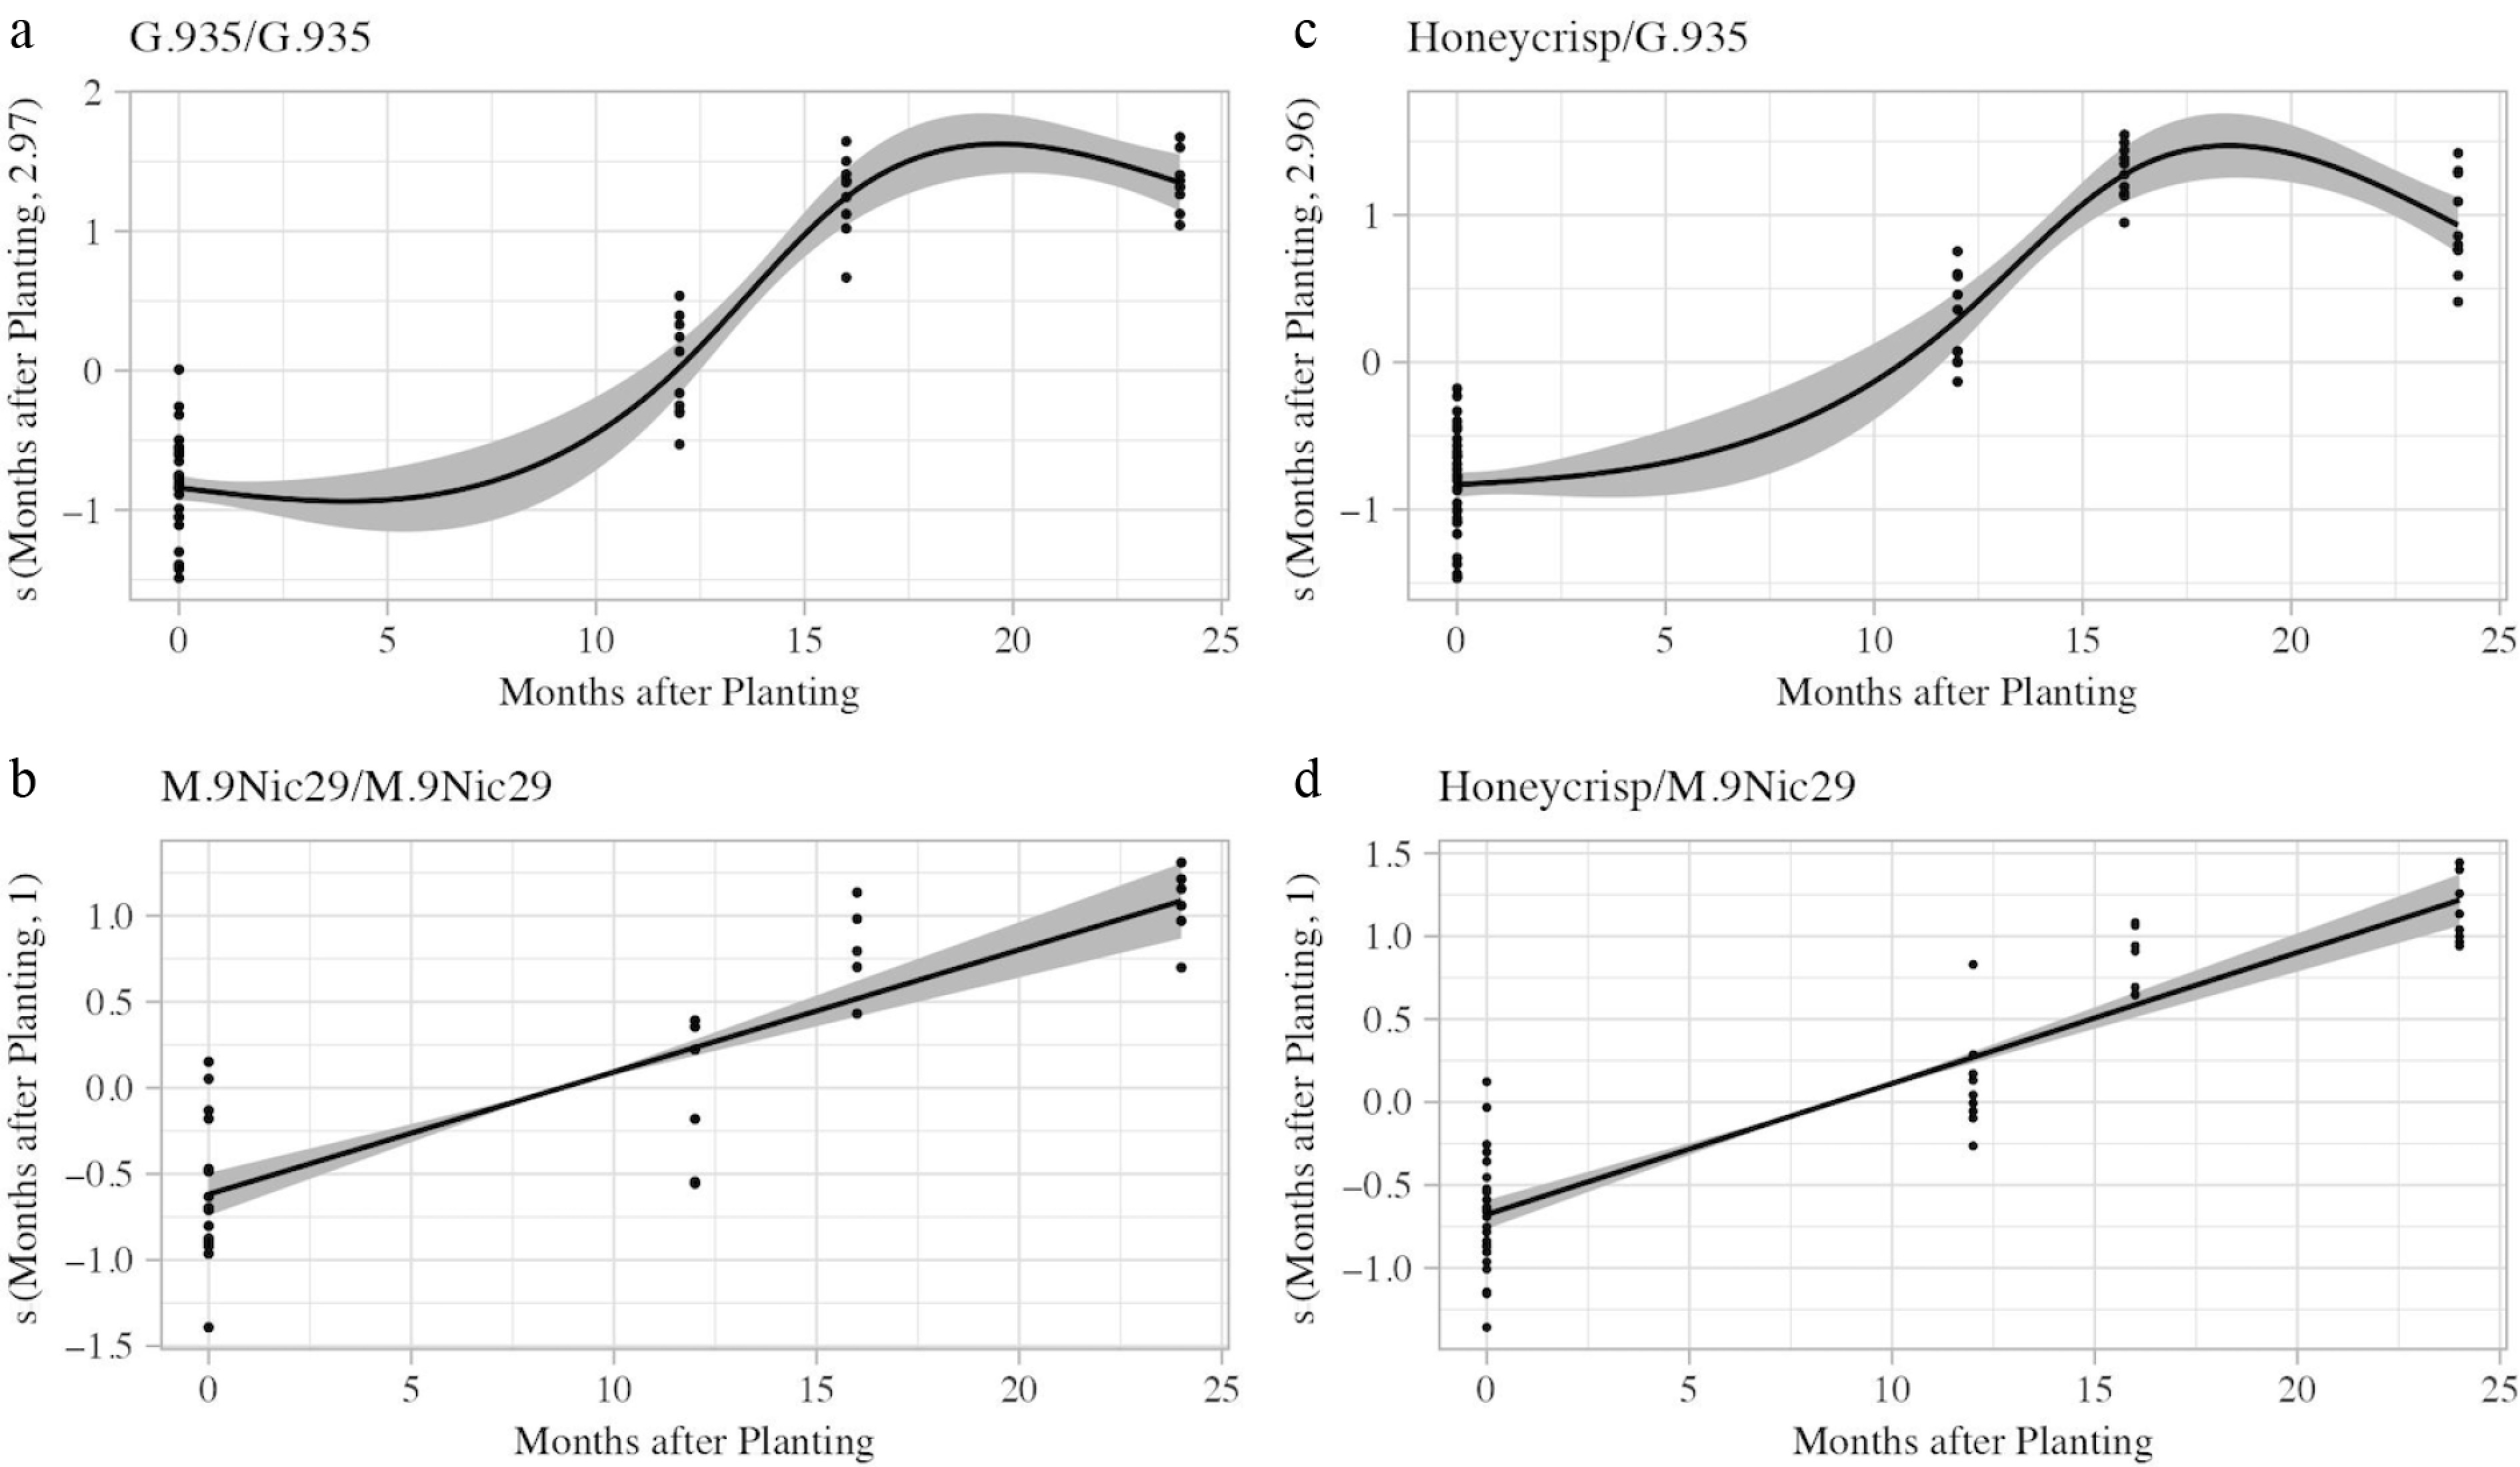
Figure 6.
Estimated smoothness of harvest date (months after planting) on apple root system surface area (mm2) for the four scion–rootstock combinations. (a) G.935/G.935. (b) M.9Nic29/M.9Nic29. (c) Honeycrisp/G.935. (d) Honeycrisp/M.9Nic29. The y-axis is the partial effect of harvest date, the shaded areas are the standard-error confidence intervals, and dots represent individuals.
G.935/G.935 and Honeycrisp/G.935 had GAMs with lower AIC values than the linear model, indicating that the GAM better explained root growth over time. These models also had higher R2 and deviance explained values (Supplementary Table S1). The GAM model implies that G.935 rootstocks begin moderately increasing in root surface area about five months after planting. There is a rapid increase in size from 12 to 18 months after planting, when the root surface area is at its maximum (predicted value of 798,168.9 mm2 for G.935/G.935 and 456,581.9 mm2 for Honeycrisp/G.935). This is followed by a gradual reduction in root surface area. The models also imply that the root growth patterns of both rootstocks are similar regardless of scion (Fig. 6b, d).
Ranking of trait importance
-
Ranking of trait variables was done to determine the most important variables that influence apple root system shape and size. The random forest model explained 70.14% of the variance, and harvest date and rootstock–scion combination had the largest percent increase in mean square error (Fig. 7a). These two variables also had the lowest mean minimal depth (Fig. 7b). This implies that these variables are extremely influential in modeling the root system surface area and can accurately group different root systems. Generalized additive models were used to measure the influence of each trait on the final total root system volume. The model with both harvest date and rootstock–scion combination explained 69.8% of the variance, had an R2 value of 0.682, and an AIC of 2,544.105, further supporting the importance of these traits. The model with just rootstock-scion combination explained 21.2% of the variance, had an R2 value of 0.187, and an AIC of 2,635.115. The model with just the harvest date explained 48.8% of the variance, had an R2 value of 0.477, and an AIC of 2,590.406.
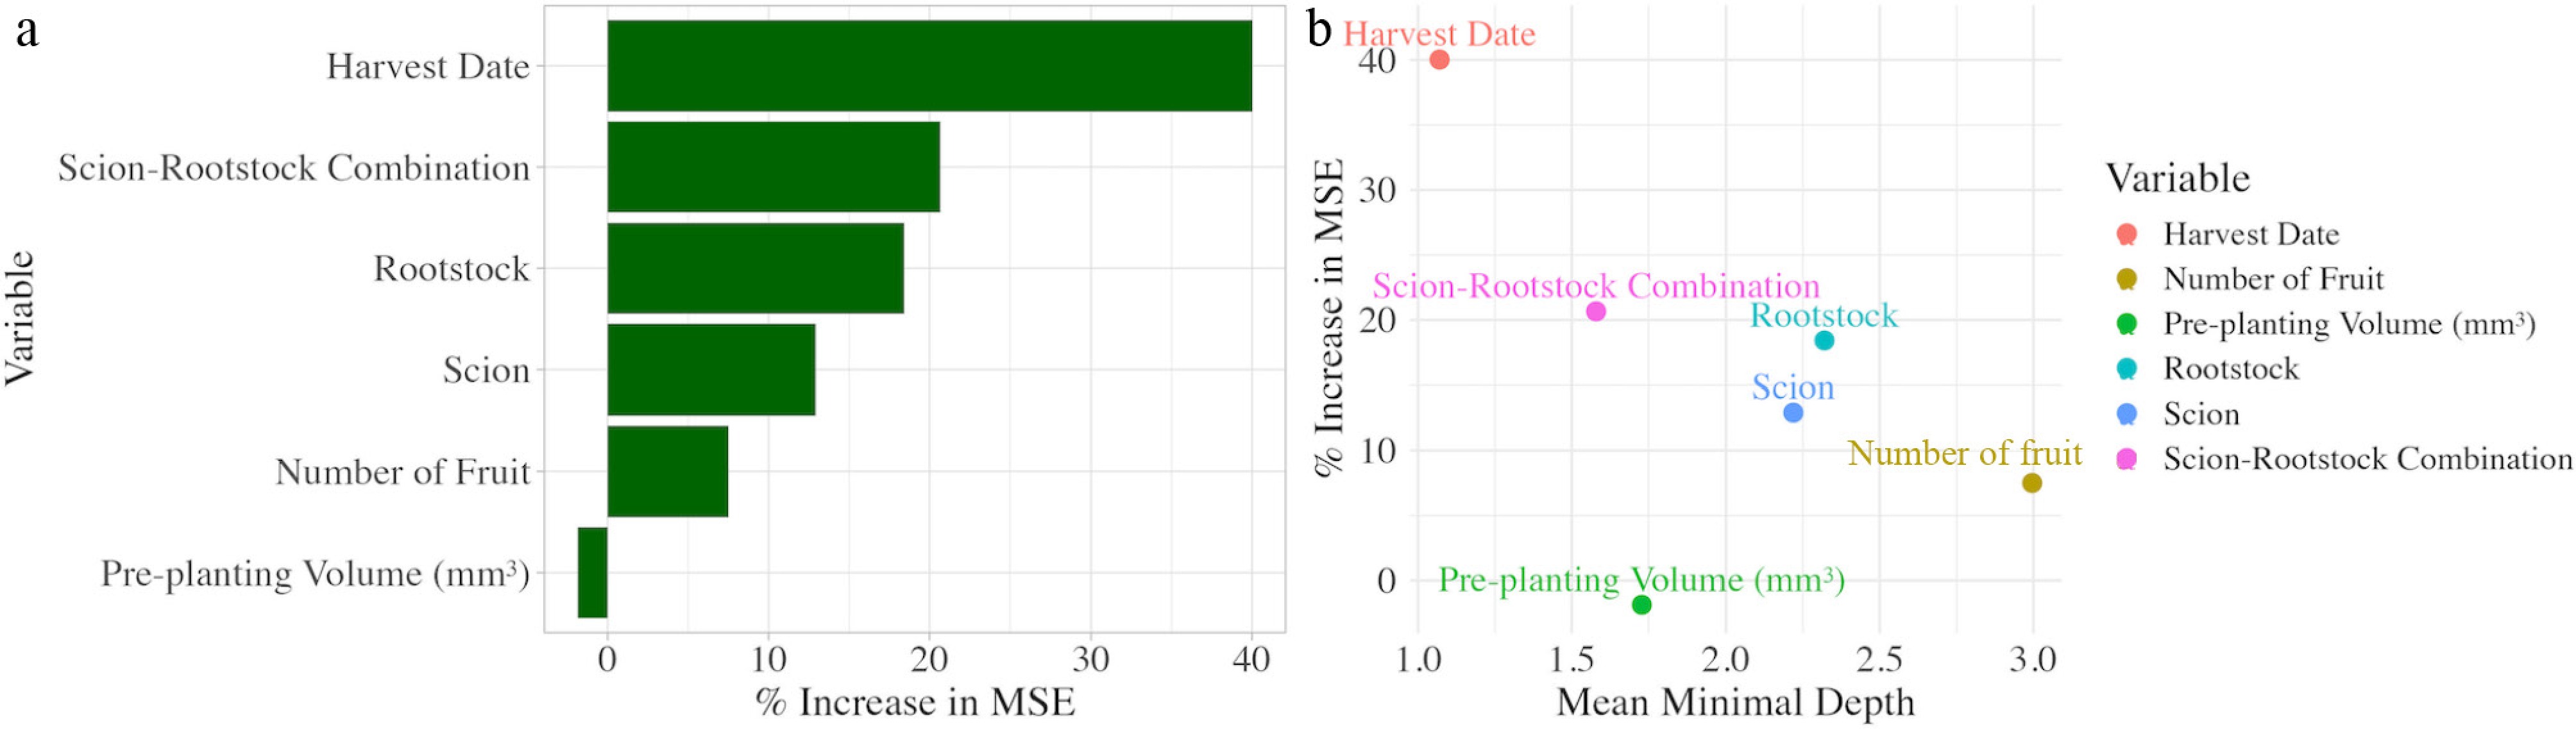
Figure 7.
(a) Percent increase in mean square error of the six predictor variables of apple root system volume (mm3) used in a random forest model. (b) Percent increase in mean square error (MSE) plotted against the mean minimal depth of the six predictor variables used in the model.
-
Root systems of perennial tree crops are critical for plant health, but have historically been understudied. In this study, we examined the root systems of two commercially important apple rootstocks (G.935 and M.9Nic29) self-grafted and grafted on a scion cultivar ('Honeycrisp') in a high-density orchard over two years. Our results indicate that scion and rootstock genotype, and their combination, are the primary influencers of root system architecture and seasonal growth in apple root systems in high-density orchards.
A random forest model identified scion–rootstock combination as one of the primary factors influencing root system size during the study period. Scion genotype has been shown to influence root environmental responses in perennial fruit crops. For example, in grapes, scion choice regulated root gene expression in response to drought[41]. Scions and rootstocks are continuously exchanging photoassimilates, water, nutrients, and other small molecules, which can alter root development[20,41,42]. The ability of a scion to alter the root system architecture of apple indicates that scion genotype can indirectly influence root health and function because root system traits are associated with disease susceptibility and microbial community composition in apple[2,28,43,44].
The size of the root system at planting had little influence on the final root system size in the first two years of planting. Although some statistically significant associations were observed between initial and final root sizes, both principal component analysis and the random forest model indicate that the root system at planting is not a major determinant of final root architecture. It is important to note that, for this study, we selected rootstocks that appeared visually healthy and exhibited well-developed root systems at the time of planting, and there may be a threshold level of root system health required at planting, beyond which root establishment is consistent. Roots are inherently transient in nature; apple root systems can lose up to 80% of their initial length in the weeks after planting due to transplantation shock, and roots die over winter[45]. Additionally, root systems are plastic and grow in response to the environmental cues, which influence the ultimate shape and size of the root system[46]. These results indicate that, as long as rootstocks start with a sufficiently healthy root system, their initial size is less likely to affect long-term orchard health and performance.
Our results show that the G.935 and M.9Nic29 rootstocks had unique root system architecture. G.935 rootstocks had root systems with significantly higher root trait values than M.9Nic29 rootstocks. These findings align with previous research that dwarfing rootstocks have smaller root systems than non-dwarfing rootstocks[9−11]. Disruption of the regulatory region of an auxin response factor is the mechanism of dwarfing in Malling series rootstocks[47]. Because auxin is the key hormone involved in root development and growth, this disruption likely explains the smaller root system size observed in this and other studies[48]. Differences in root size can affect orchard health; a larger root system is associated with higher nutrient and water uptake, greater soil stabilization, and increased recruitment of beneficial microbes[46]. Therefore, G.935 rootstocks may be favorable in orchards with poor soil quality or limited water, where demand for water and nutrients is high. However, larger root systems may increase the chances of natural root grafting between trees, which can serve both as a mechanism of resource sharing and pathogen transmission.
Viruses, fungi, and bacteria have been reported to spread through natural root grafts[26,27,49]. All scion–rootstock combinations used in this study developed root systems large enough to come into physical contact in the high-density orchards within 18 months of planting (with a 3-ft spacing). While the actual frequency of natural root grafting in apple orchards is unknown, our findings suggest that high-density plantings can create conditions that promote graft formation, which could serve as a mechanism of disease movement. In other species, root grafting can serve as the primary transmission mechanism of multiple pathogens. In apple, Candidatus Phytoplasma mali is the only pathogen that has been reported to spread through natural root grafts[26,27]. It is likely that other graft-transmissible pathogens in apple, particularly viruses, can spread via root grafts, as the physiology that allows movement is the same. In addition to creating these root connections, the rapid expansion of the root system observed in these high-density plantings may create a struggle for soil resources.
The two rootstocks also had different seasonal growth patterns. While both rootstocks grew between June 2022 and October 2022 and generally remained a constant size over the winter, G.935 rootstocks had more growth between June and October. These results are further supported by the GAM, which implies that G.935 rootstocks experience a period of rapid root growth during the summer and early fall, while M.9Nic29 rootstocks appear to have more moderate growth that is spread throughout the year. Ultimately, this results in G.935 rootstocks having larger and more complex root systems than M.9Nic29. It is important to note that the patterns of root growth are extrapolated from the root size between sampling points and thus are not exact reflections of root growth throughout the year. For example, it is unlikely that certain traits of M.9Nic29 root systems were growing during dormancy; the continuous growth observed in some traits is more likely to reflect the timing and rate of root growth initiation after exiting dormancy.
Studies on the timing of root growth in apple vary; unimodal, bimodal, and continuous growth patterns have been reported[12−14]. Consistent with our findings, Gala/M.9 was reported to have continuous root growth throughout the year[14]. While this is the first study to describe G.935 root systems, summer and fall root flushes have been observed in other rootstock genotypes[12,50,51]. Knowledge of the timing of root flushes can be used for effective timing of fertilizer applications, as roots have an increased capacity to absorb nutrients during active root growth. In Arabidopsis, nitrate transporters are highly expressed in root tips and root primordia during these phases, facilitating increased nutrient absorption[46]. Ultimately, while the root timing observed in this study aligns with previous work, seasonal growth patterns appear to be scion-rootstock specific and vary from year to year.
Scion choice affected root system size and growth differently in the two rootstocks. G.935 root systems were highly affected by scion choice. In June 2023, G.935/G.935 plants had substantially larger and more complex root systems than Honeycrisp/G.935 plants. In contrast, root system size differed little between M.9Nic29/M.9Nic29 and Honeycrisp/M.9Nic29 plants. 'Honeycrisp' scions have been observed to reduce root system size in some rootstocks[15]. One explanation for this effect on only G.935 rootstocks may be a weak graft union. Some Geneva series rootstocks are reported to form brittle graft unions, and previous work has shown that Honeycrisp/G.935 unions are weaker than Honeycrisp/M.9Nic29[52,53]. A graft union with disorganized vasculature, along with the small canopy common to Honeycrisp, may limit the transport of photoassimilates to the roots, resulting in a smaller root system in Honeycrisp/G.935 plants[52]. Reduced root size and weakened graft unions increase the susceptibility of plants to rapid apple decline, which has been associated with graft union necrosis and small root systems[44].
Honeycrisp/G.935 decreased in size between October 2022 and June 2022, whereas G.935/G.935 stayed the same size. In contrast, M.9Nic29 plants show consistent growth patterns between scions. This contrasting effect in G.935 may be due to differences in root growth initiation as the plant exits winter dormancy or root mortality. During dormancy, root dieback can occur, particularly in fine roots[54,55]. Once shoot and root chilling requirements are met, apples enter ecodormancy, followed by bud break and initiation of root growth[56]. The molecular mechanisms underlying this process involve communication between the scion and the rootstock[57,58]. Saini et al. reported scion-dependent expression of antifreeze proteins (MdAFP) in apple rootstocks, which may mean that scion choice affects overwintering survival of apple roots. Data on the timing of initiation of root growth in the spring is lacking, but Malus × robusta clone 5, a parent of G.935, is known to have early bud break, which may be reflected in root growth initiation[31,59]. In contrast, 'Honeycrisp' is considered a late bloomer[60]. Scion-dependent differences in root dormancy patterns may affect soil pathogen dynamics and disease management. For example, newly emerged apple roots are the most susceptible to apple replant disease infection, and root emergence triggers pathogen growth; so knowledge of root growth initiation can be used for accurate timing of disease management strategies and scouting[2,61]. The apple replant disease pathogen complex is also known to overwinter in dead root tissue, so if Honeycrisp/G.935 has higher root dieback in the winter, the soil in these orchards may have a higher pathogen load[61].
-
Root systems are an important yet often overlooked aspect of plant health, particularly in perennial trees, which must survive for decades in a wide variety of conditions. This study provides the first comprehensive characterization of full root systems in two commercial apple rootstocks (M.9Nic29 and G.935), each grafted to either 'Honeycrisp' or itself, over two years in a high-density orchard. This study demonstrated that scion and rootstock genotype and graft combination are the major contributors to apple root system variation and growth in high-density orchards. G.935 root systems were larger and more complex than M.9Nic29 root systems. M.9Nic29 root systems exhibited more continuous growth, whereas G.935 root growth occurred more rapidly in smaller time frames. Honeycrisp had a sizeable impact on the root system architecture and growth of G.935 root systems, but no observable effect on M.9Nic29 root systems. These results demonstrate the need for consideration of the scion when choosing a rootstock and vice versa. Additionally, the root systems of all plant types were wide enough to facilitate natural root grafting between trees within 18 months of planting. This study only had three time points, and more detailed temporal information is needed to understand the growth patterns of these rootstocks fully. Ultimately, the mechanisms underlying scion rootstock root interactions are not understood. The research presented in this paper can help inform breeding and management strategies aimed at optimizing and exploiting root architecture for improved orchard health and yield.
-
During the preparation of this work, the author(s) used ChatGPT v3.5 for language refinement and code debugging. The author(s) reviewed and edited all content produced with the assistance of this tool, verified its accuracy, and take full responsibility for the integrity and originality of the final manuscript. This work represents the author(s)' own intellectual contribution, and no AI tool is credited as an author.
-
The authors confirm their contributions to the paper as follows: study conception and design: Khan A, Singh J; data collection: Sabety J, Serrano A, Cobb-Smith D; analysis and interpretation of results, draft manuscript preparation: Sabety J. All authors reviewed the results and approved the final version of the manuscript.
-
Root and canopy data are available in Supplementary File. The PlantCV code for canopy analysis is available at the following link: https://github.com/KhanLab-AppleDiseases/Canopy-Analysis. Root images are available upon request.
-
This research was financially supported by the USDA-AFRI (Agriculture and Food Research Initiative), Critical Agriculture Research and Extension (CARE) program (Grant No. 2021-68008-34117), USDA-NIFA Pre-doctoral Fellowship accession (Grant No. 2024-67011-42905), USDA-NIFA accession (Grant No. 2021-67021-34199, sub-award 32365-01), and the NIFA-USDA Hatch project (Grant Nos 1024511 and NYG-625400) funded through the Federal Capacity Funds managed by the New York State Agricultural Experiment Station (NYSAES), Cornell University, Geneva, NY, USA. Alicia Serrano Gomez was supported by the postdoctoral fellowship from the grants program for the requalification of the Spanish University system for 2021–2023 (modality Margarita Salas), funded by the European Union-NextGenerationEU. We acknowledge Yuxing Niu, Anze Svara, David Hickok, and Hana Feulner for assistance in excavating root systems, Sarah Duber for assistance in excavating root systems and tracking canopy traits, Hazel Fritz for assistance with taking canopy images, and the Cornell Statistical Consulting Unit for assistance with statistics.
-
The authors declare that they have no conflict of interest.
-
accompanies this paper online at: https://doi.org/10.48130/frures-0026-0017.
- Supplementary Table S1 Akaike information criterion (AIC), adjusted-R2, and deviance explained values for generalized additive (GAM) and linear models of root surface area (mm2) of apple rootstocks over time.
- Supplementary Fig. S1 Average ± standard error of 17 root traits over time for the four apple scion-rootstock combinations.
- Supplementary File 1 Raw root system architecture and canopy data at the three harvest timepoints for all apple scion-rootstock combinations used in the analysis.
- Supplementary File
- Copyright: © 2026 by the author(s). Published by Maximum Academic Press, Fayetteville, GA. This article is an open access article distributed under Creative Commons Attribution License (CC BY 4.0), visit https://creativecommons.org/licenses/by/4.0/.
-
About this article
Cite this article
Sabety J, Serrano A, Singh J, Cobb-Smith D, Khan A. 2026. Scion and rootstock genotypes drive root system dynamics in modern apple orchards. Fruit Research 6: e022 doi: 10.48130/frures-0026-0017 

Scion and rootstock genotypes drive root system dynamics in modern apple orchards
- Received: 06 January 2026
- Revised: 13 March 2026
- Accepted: 22 April 2026
- Published online: 05 June 2026
Abstract: Root systems are critical to orchard productivity and resilience, yet their size and structure remain poorly characterized in modern high-density apple (Malus × domestica) plantings. We examined root architectural traits of G.935 and M.9Nic29 apple rootstocks over two years in a high-density orchard, grafted either to 'Honeycrisp' or self-grafted. Each rootstock displayed distinct root architectural and growth patterns. G.935 had significantly (p < 0.05) higher total root surface area, total root volume, and number of fine roots than M.9Nic29 over all time points. G.935 grafted to 'Honeycrisp' produced significantly (p < 0.05) smaller root systems than self-grafted trees, whereas M.9Nic29 showed no such difference. The root growth of M.9Nic29 generally did not differ based on scion, but Honeycrisp/G.935 reduced in size over the winter, whereas G.935/G.935 root systems stayed the same size. Our results also indicate the potential for root-root interactions in high-density orchards. All tree types had root growth of at least 45.72 cm (1.5 ft) in each direction during the study period. These findings provide insights into the root systems of apple trees in a high-density orchard and demonstrate that scion–rootstock interactions can primarily drive root system growth under intense planting systems.
-
Key words:
- Rootstocks /
- Apples /
- Root system architecture /
- Apple orchards