-
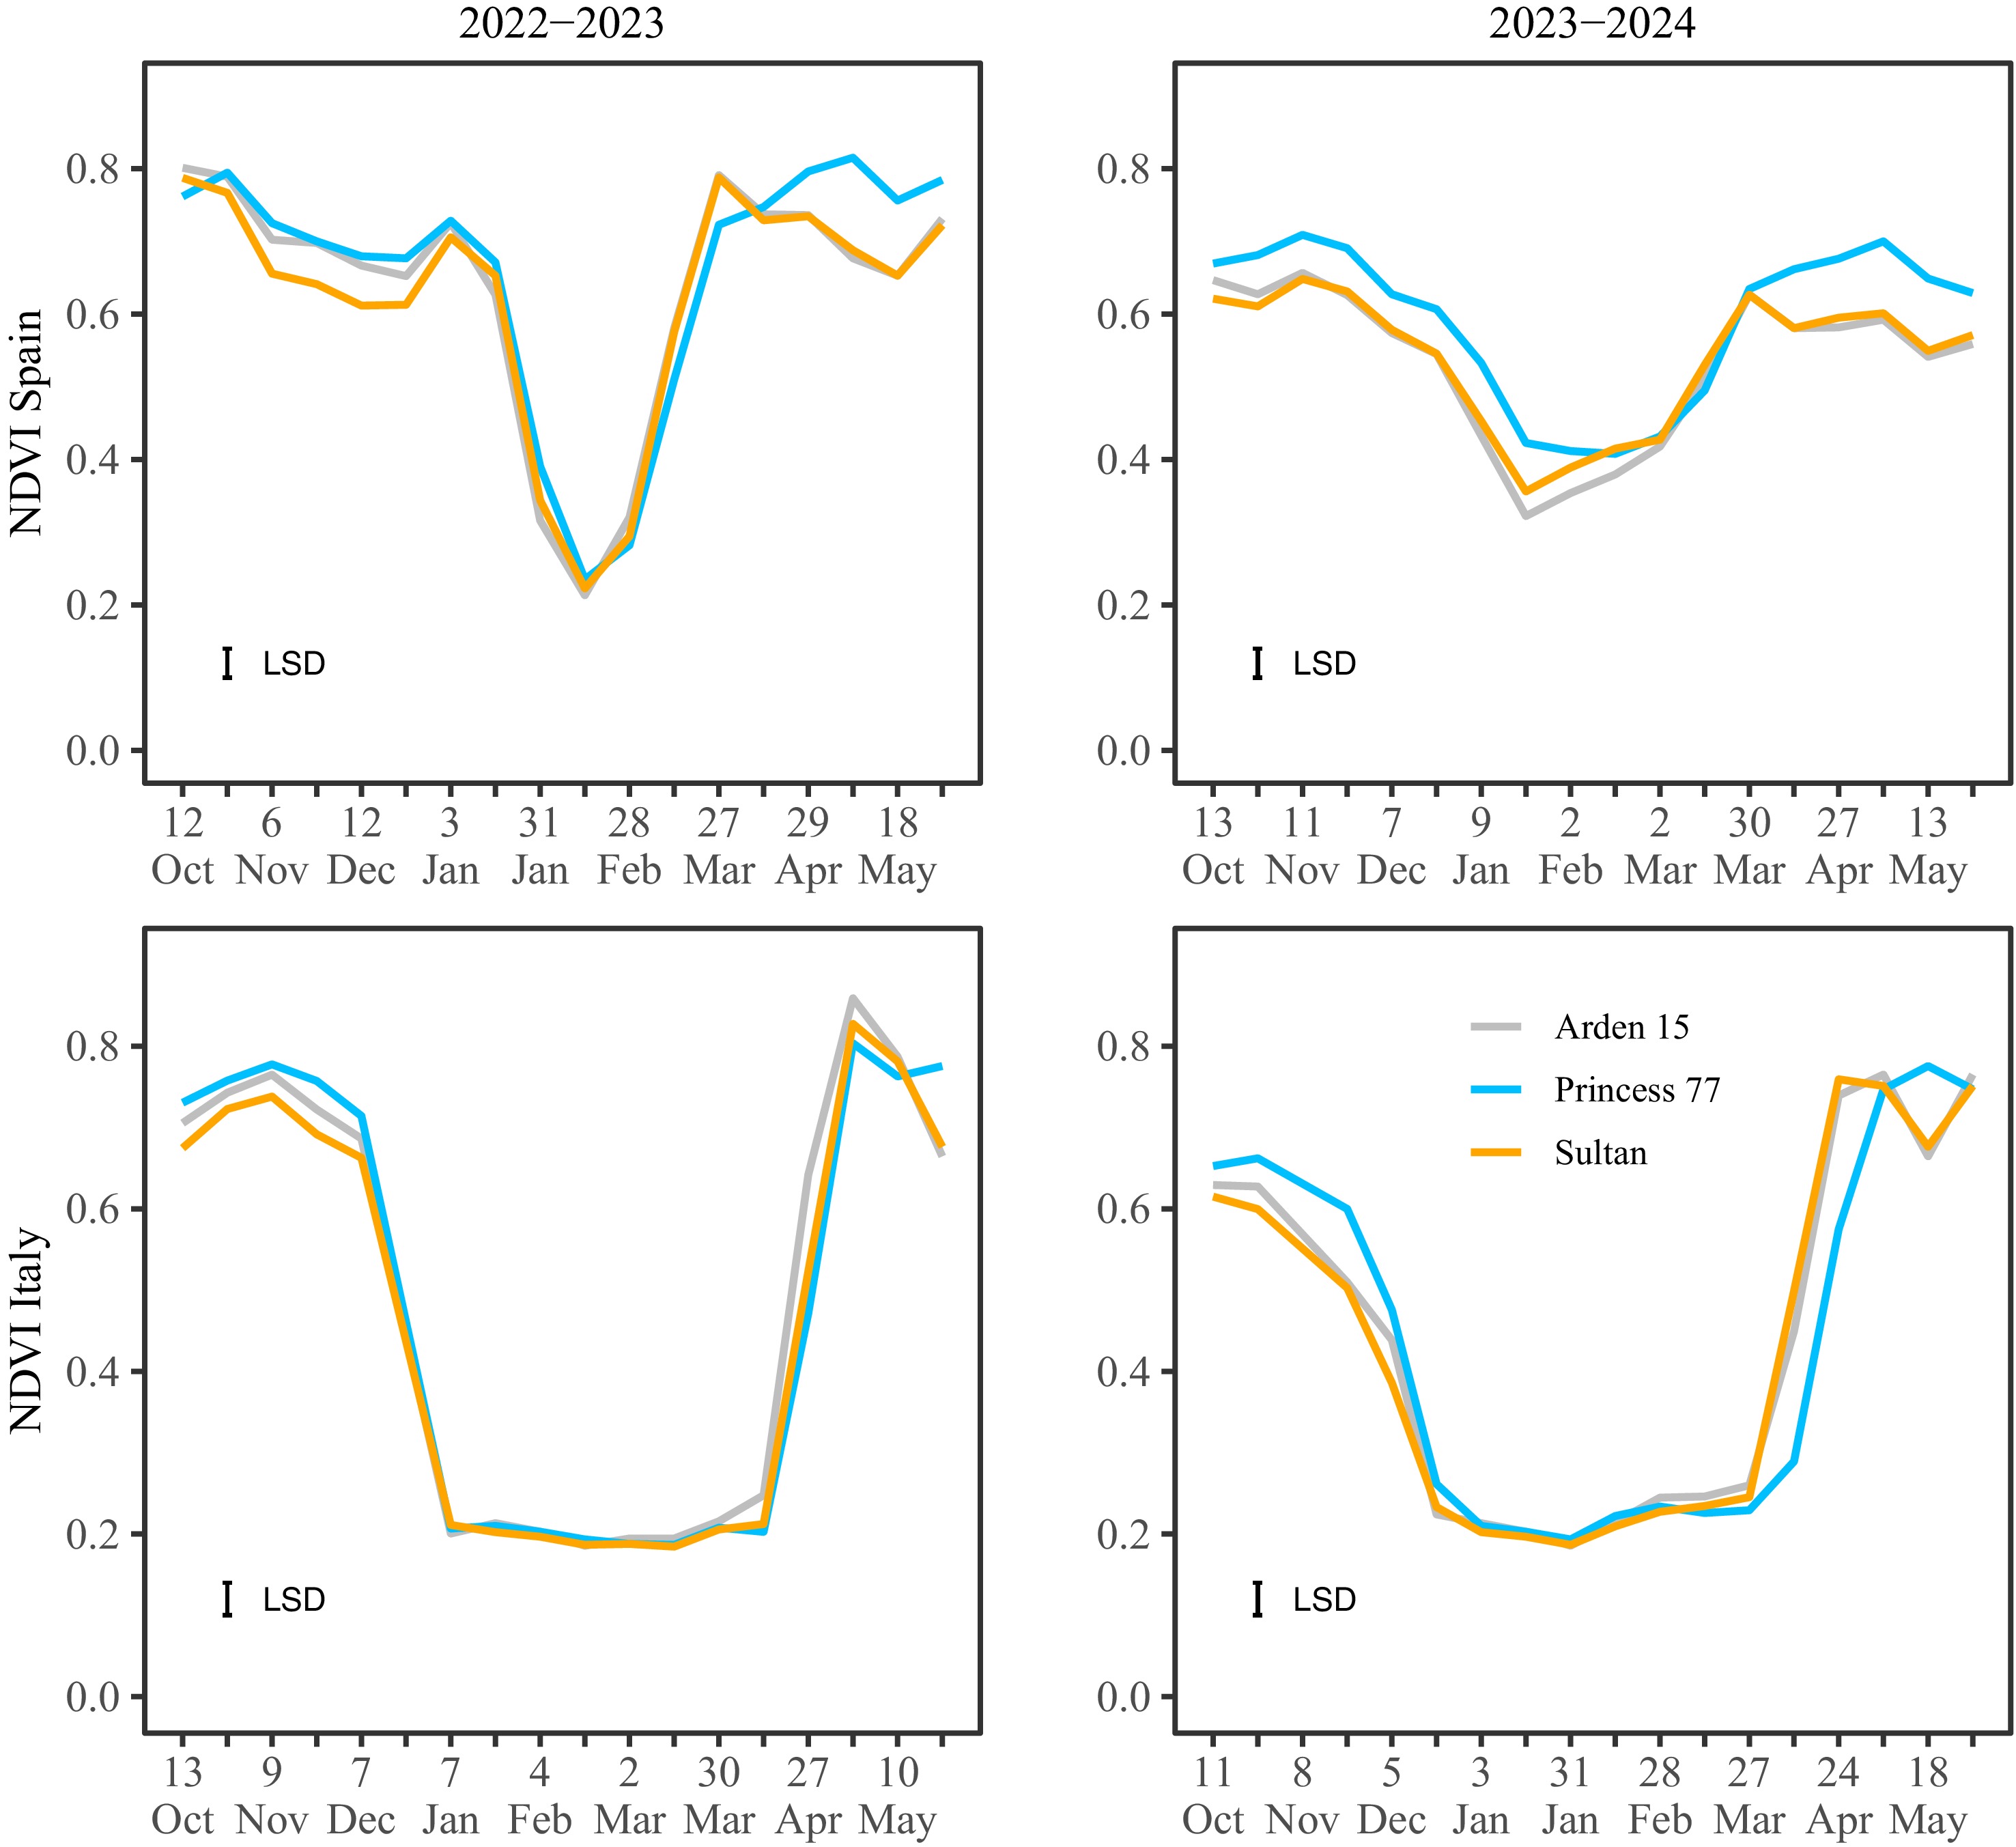
Figure 1.
The effects of cultivar and treatments on turf quality and turf color of three bermudagrass cultivars ('Arden 15', 'Princess 77',and 'Sultan') established at the experimental agricultural farm of the Polytechnic University of Valencia in Valencia (Spain), and on NDVI (below) of the same cultivars established at the experimental agricultural farm of the University of Padova in Legnaro (Italy) during the 2022−2023, and 2023−2024 growing seasons. Bars with different letters are significantly different at p < 0.05.
-
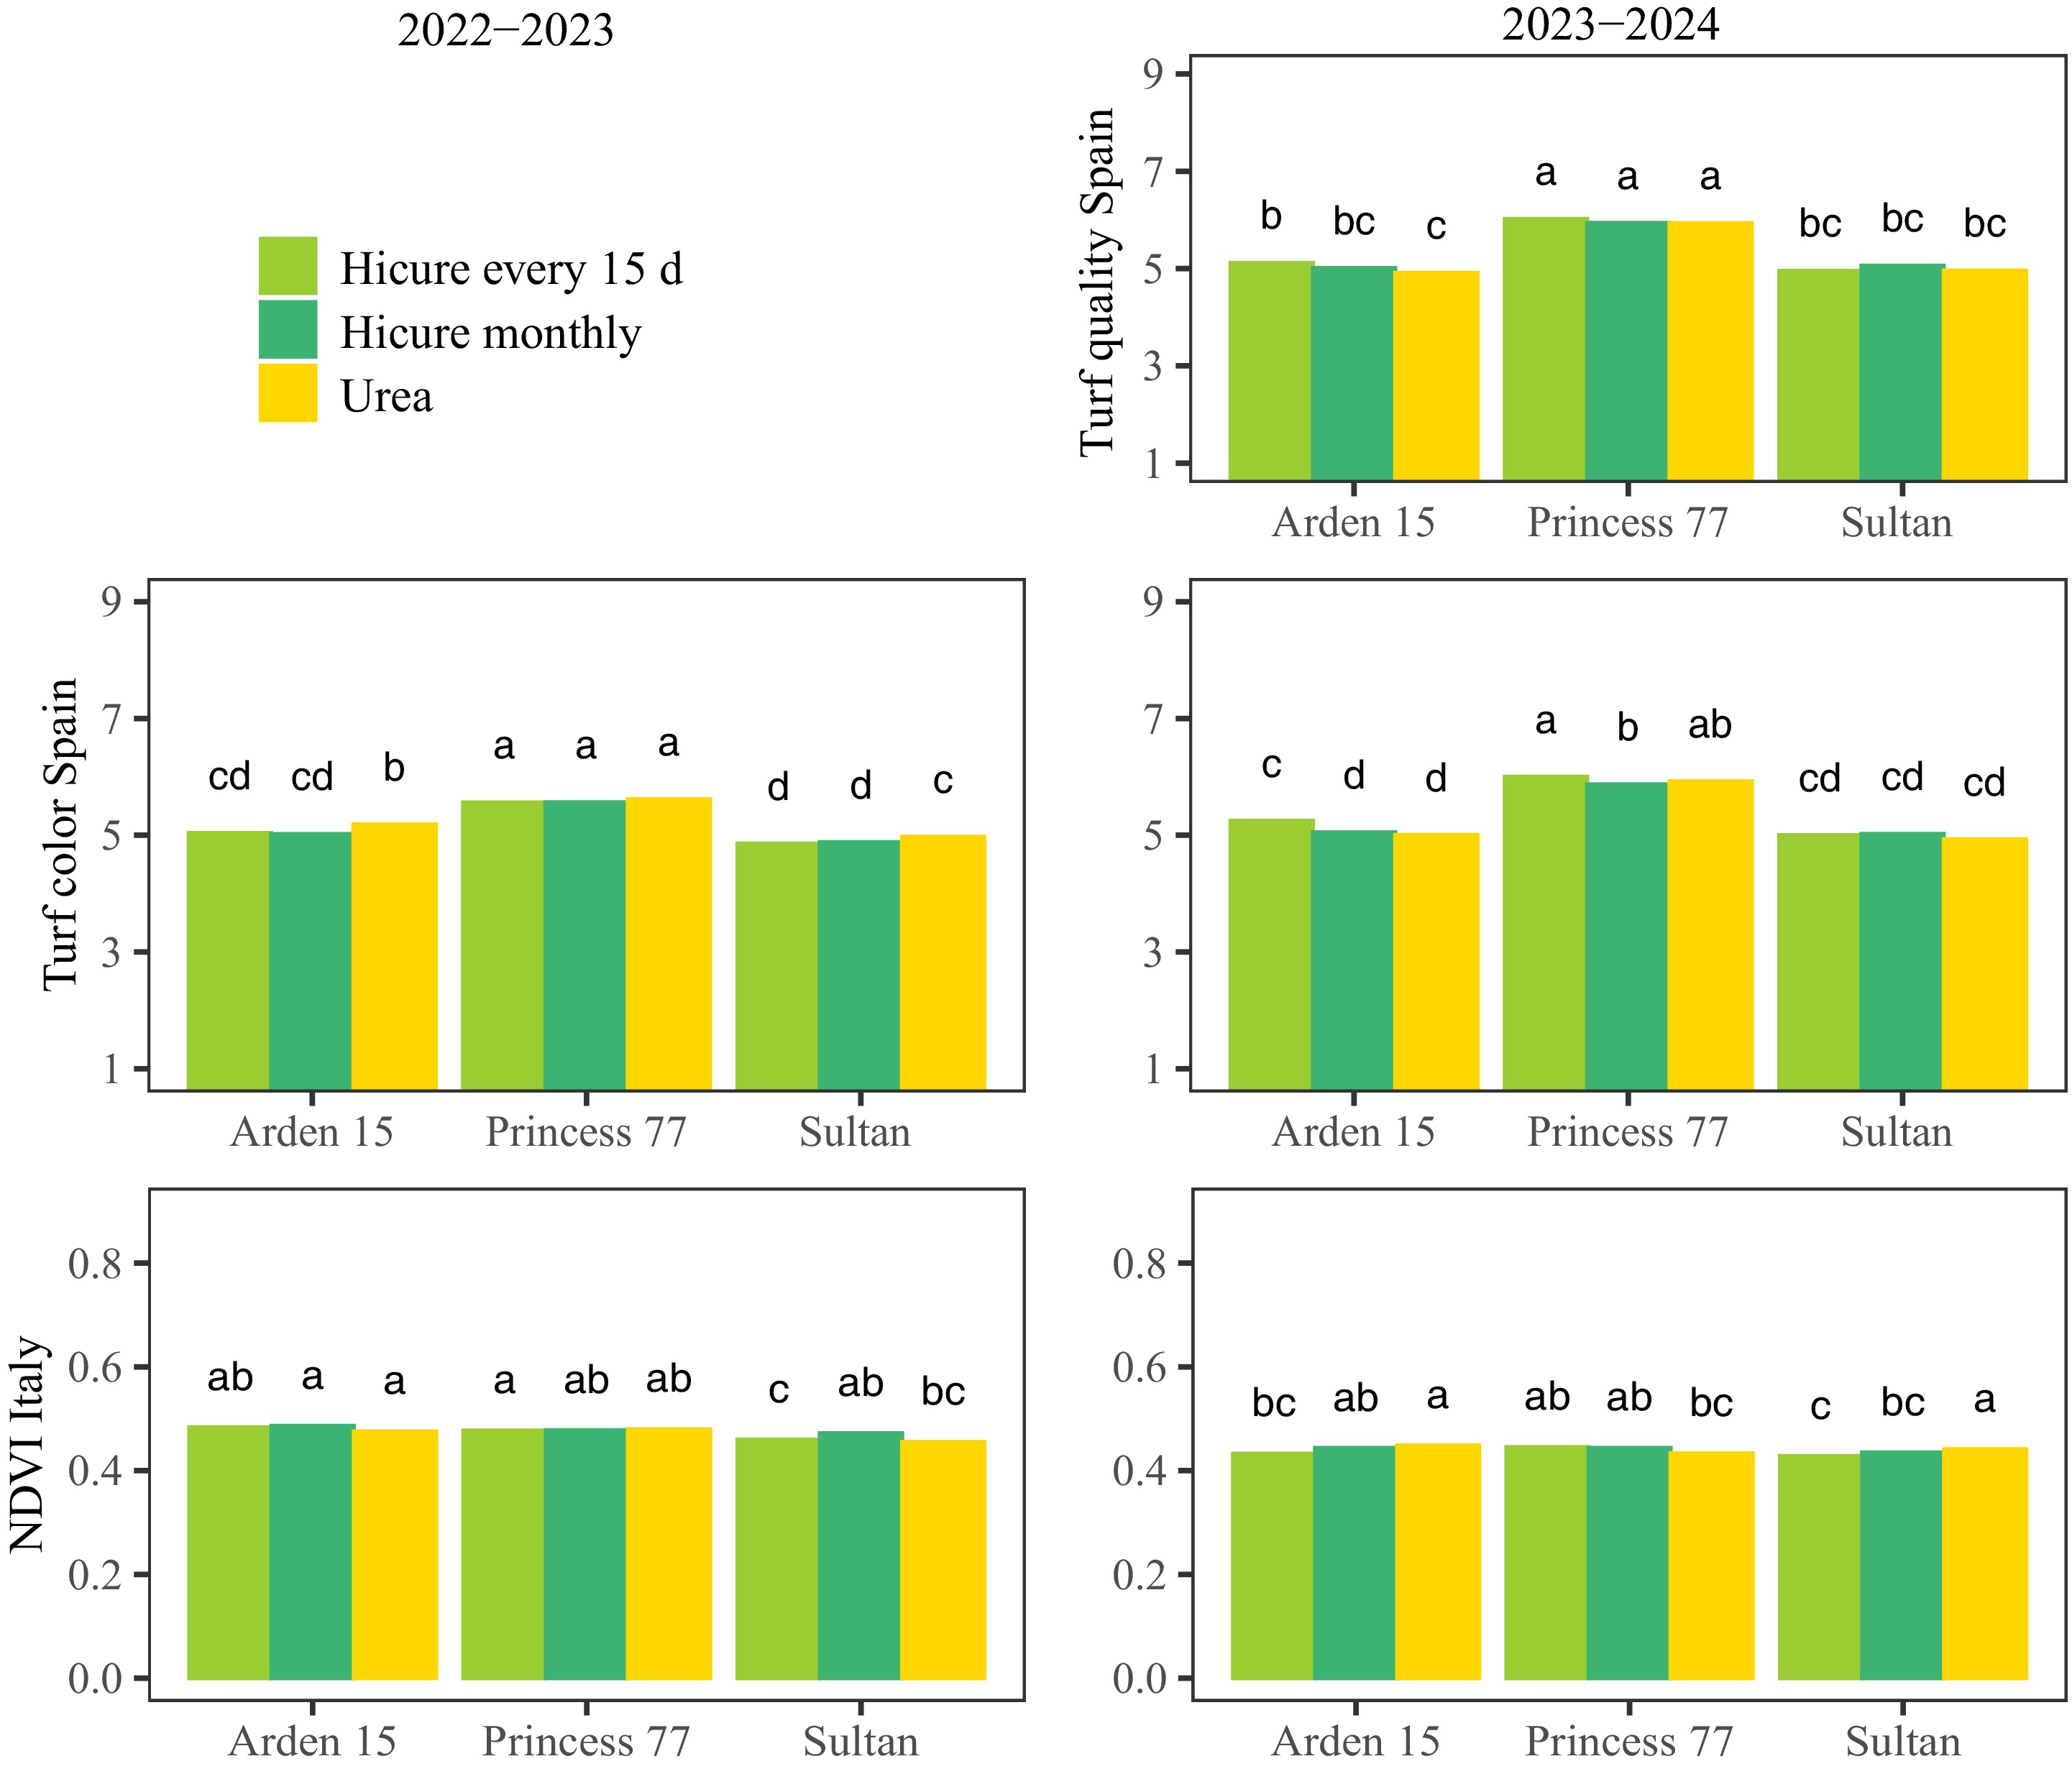
Figure 2.
The effects of cultivar and sampling date on NDVI of three bermudagrass cultivars ('Arden 15', 'Princess 77', and 'Sultan') established at the experimental agricultural farm of the Polytechnic University of Valencia in Valencia, Eastern Spain (Lat. 39°48' N, Long. 0°34' W; elevation 5 m) (above), and at the experimental agricultural farm of the University of Padova in Legnaro, Northeastern Italy (Lat. 45°20' N, Long. 11°57' E; elevation 8 m) (below), during the 2022−2023 (on the left), and 2023−2024 (on the right) growing seasons. Vertical bars represent the least significant differences (p = 0.05) for comparing means.
-
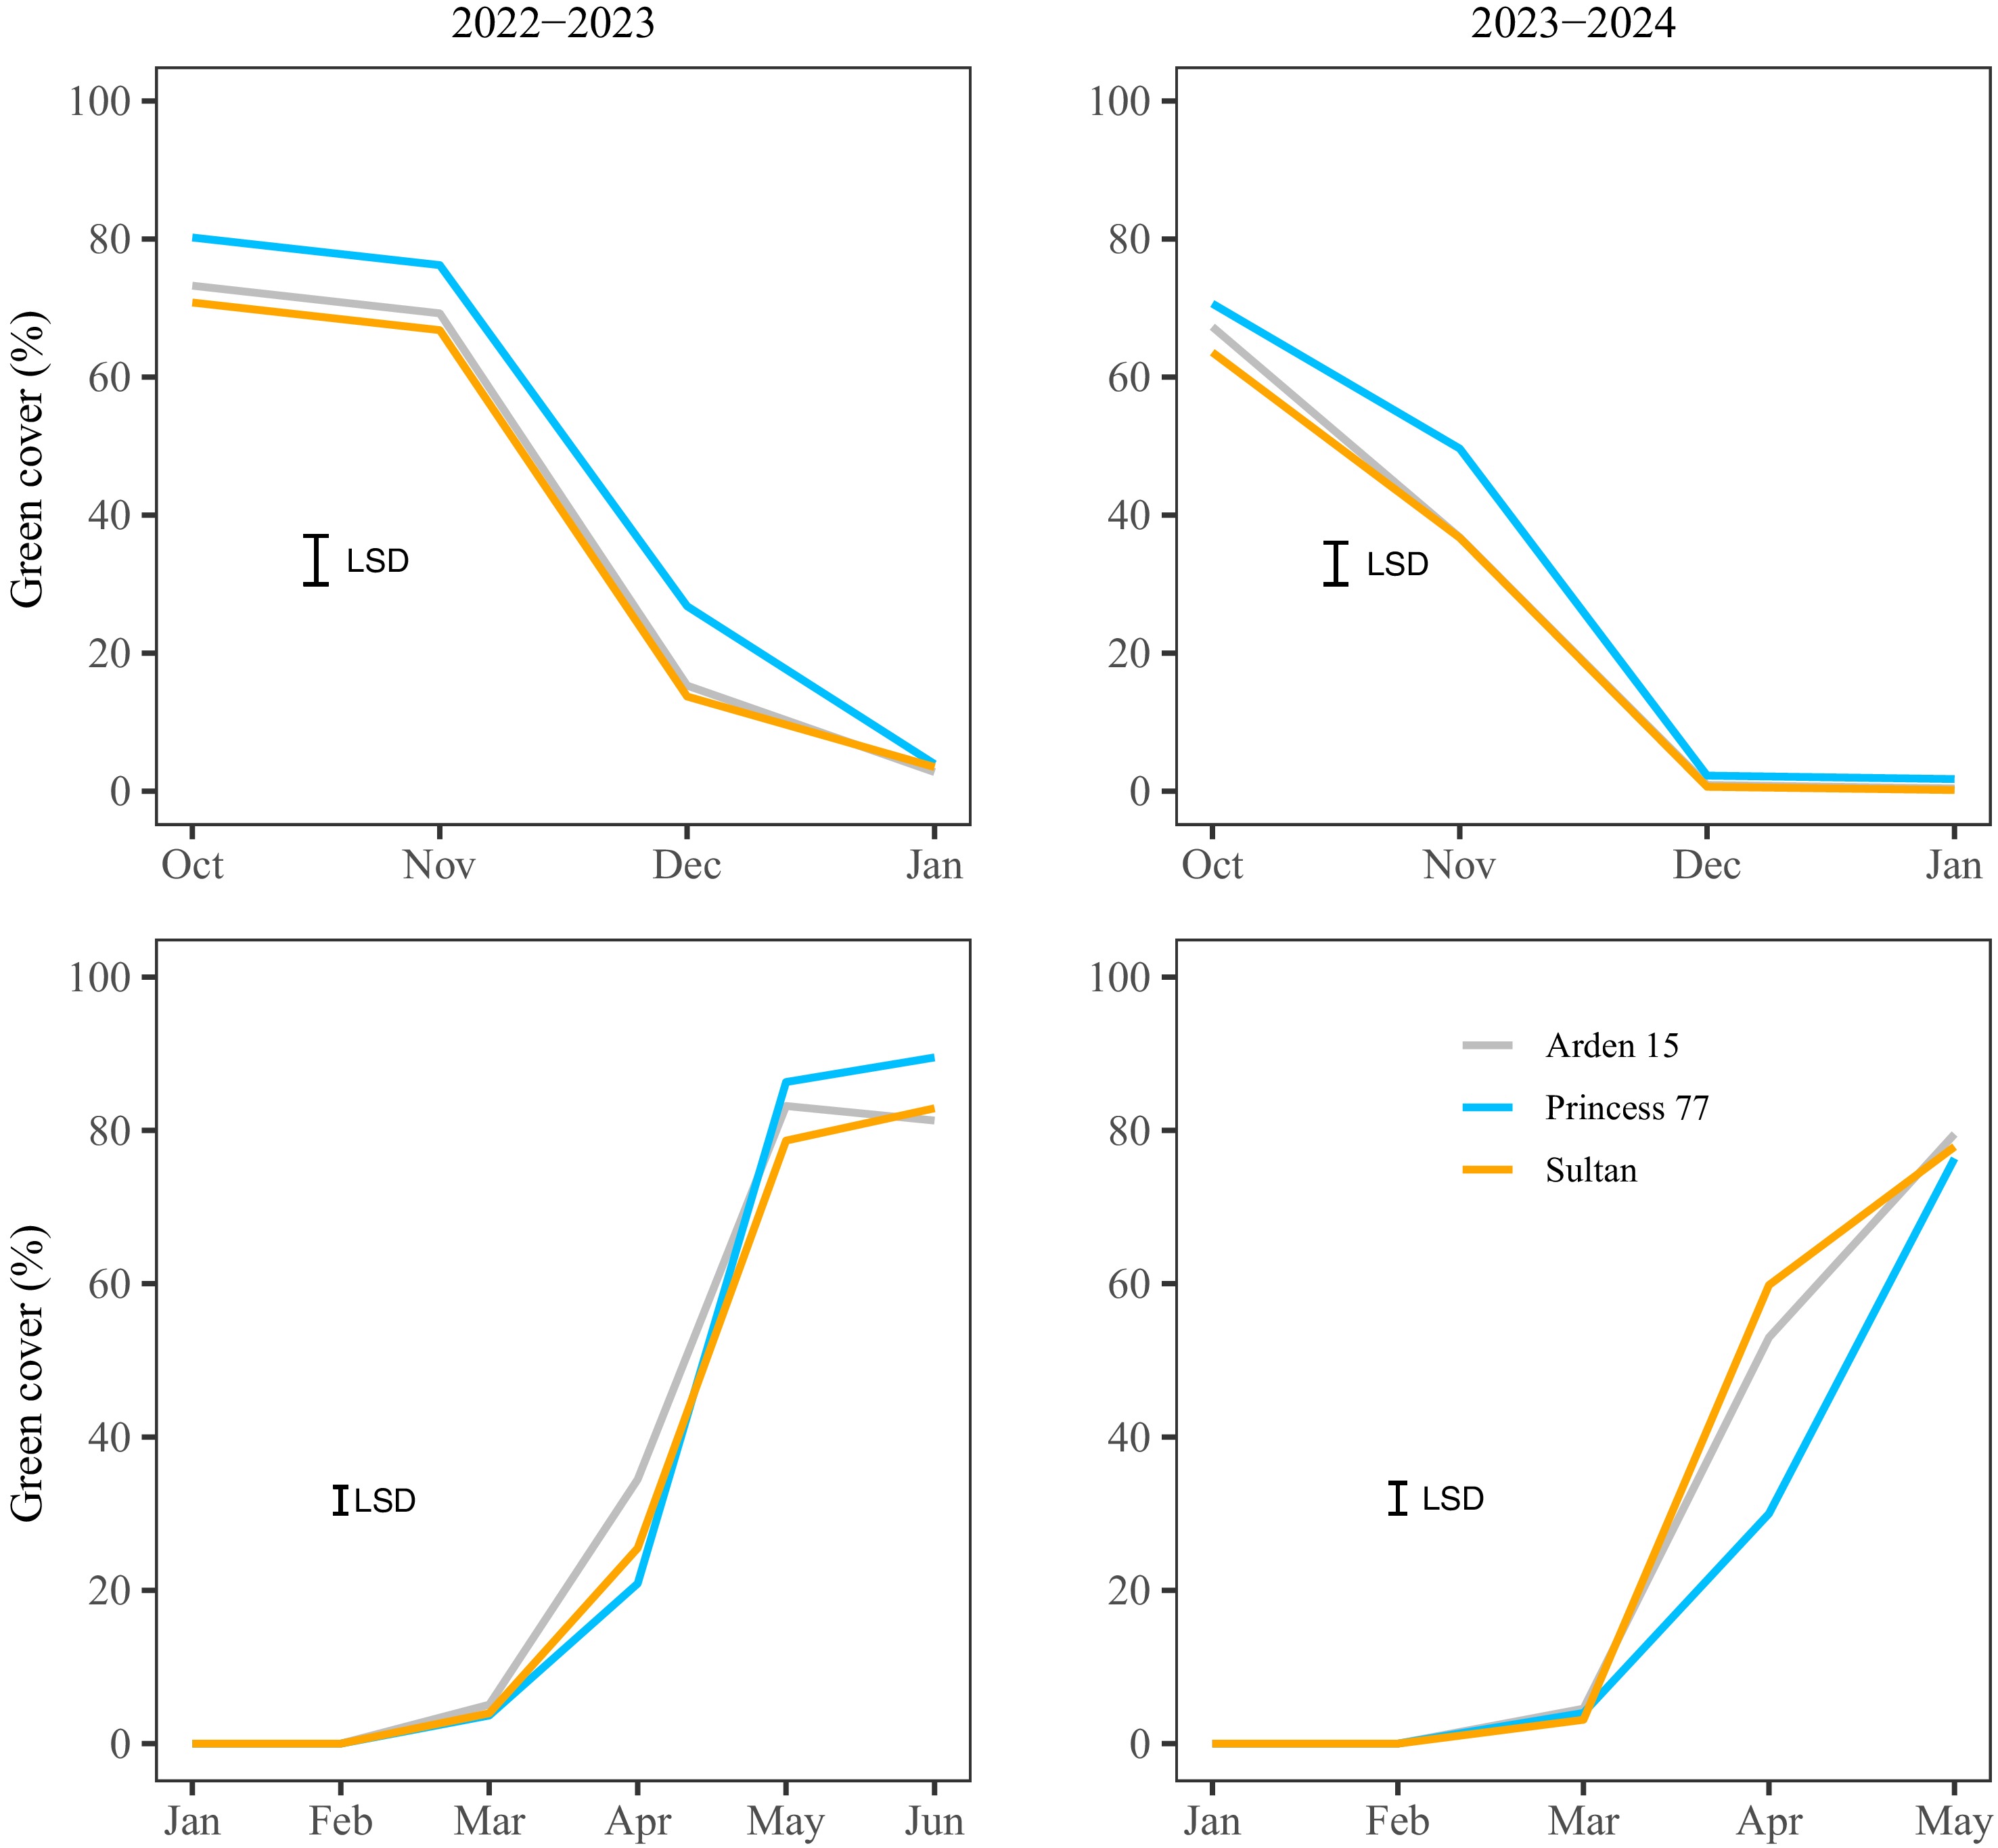
Figure 3.
The effects of cultivar and sampling date on green cover of three bermudagrass cultivars ('Arden 15', 'Princess 77', 'Sultan') established at the experimental agricultural farm of the University of Padova in Legnaro (Italy) during 2022−2023 and 2023−2024 dormancy (upper) and spring green-up (lower) periods. Vertical bars represent the least significant differences (p = 0.05) for comparing means.
-
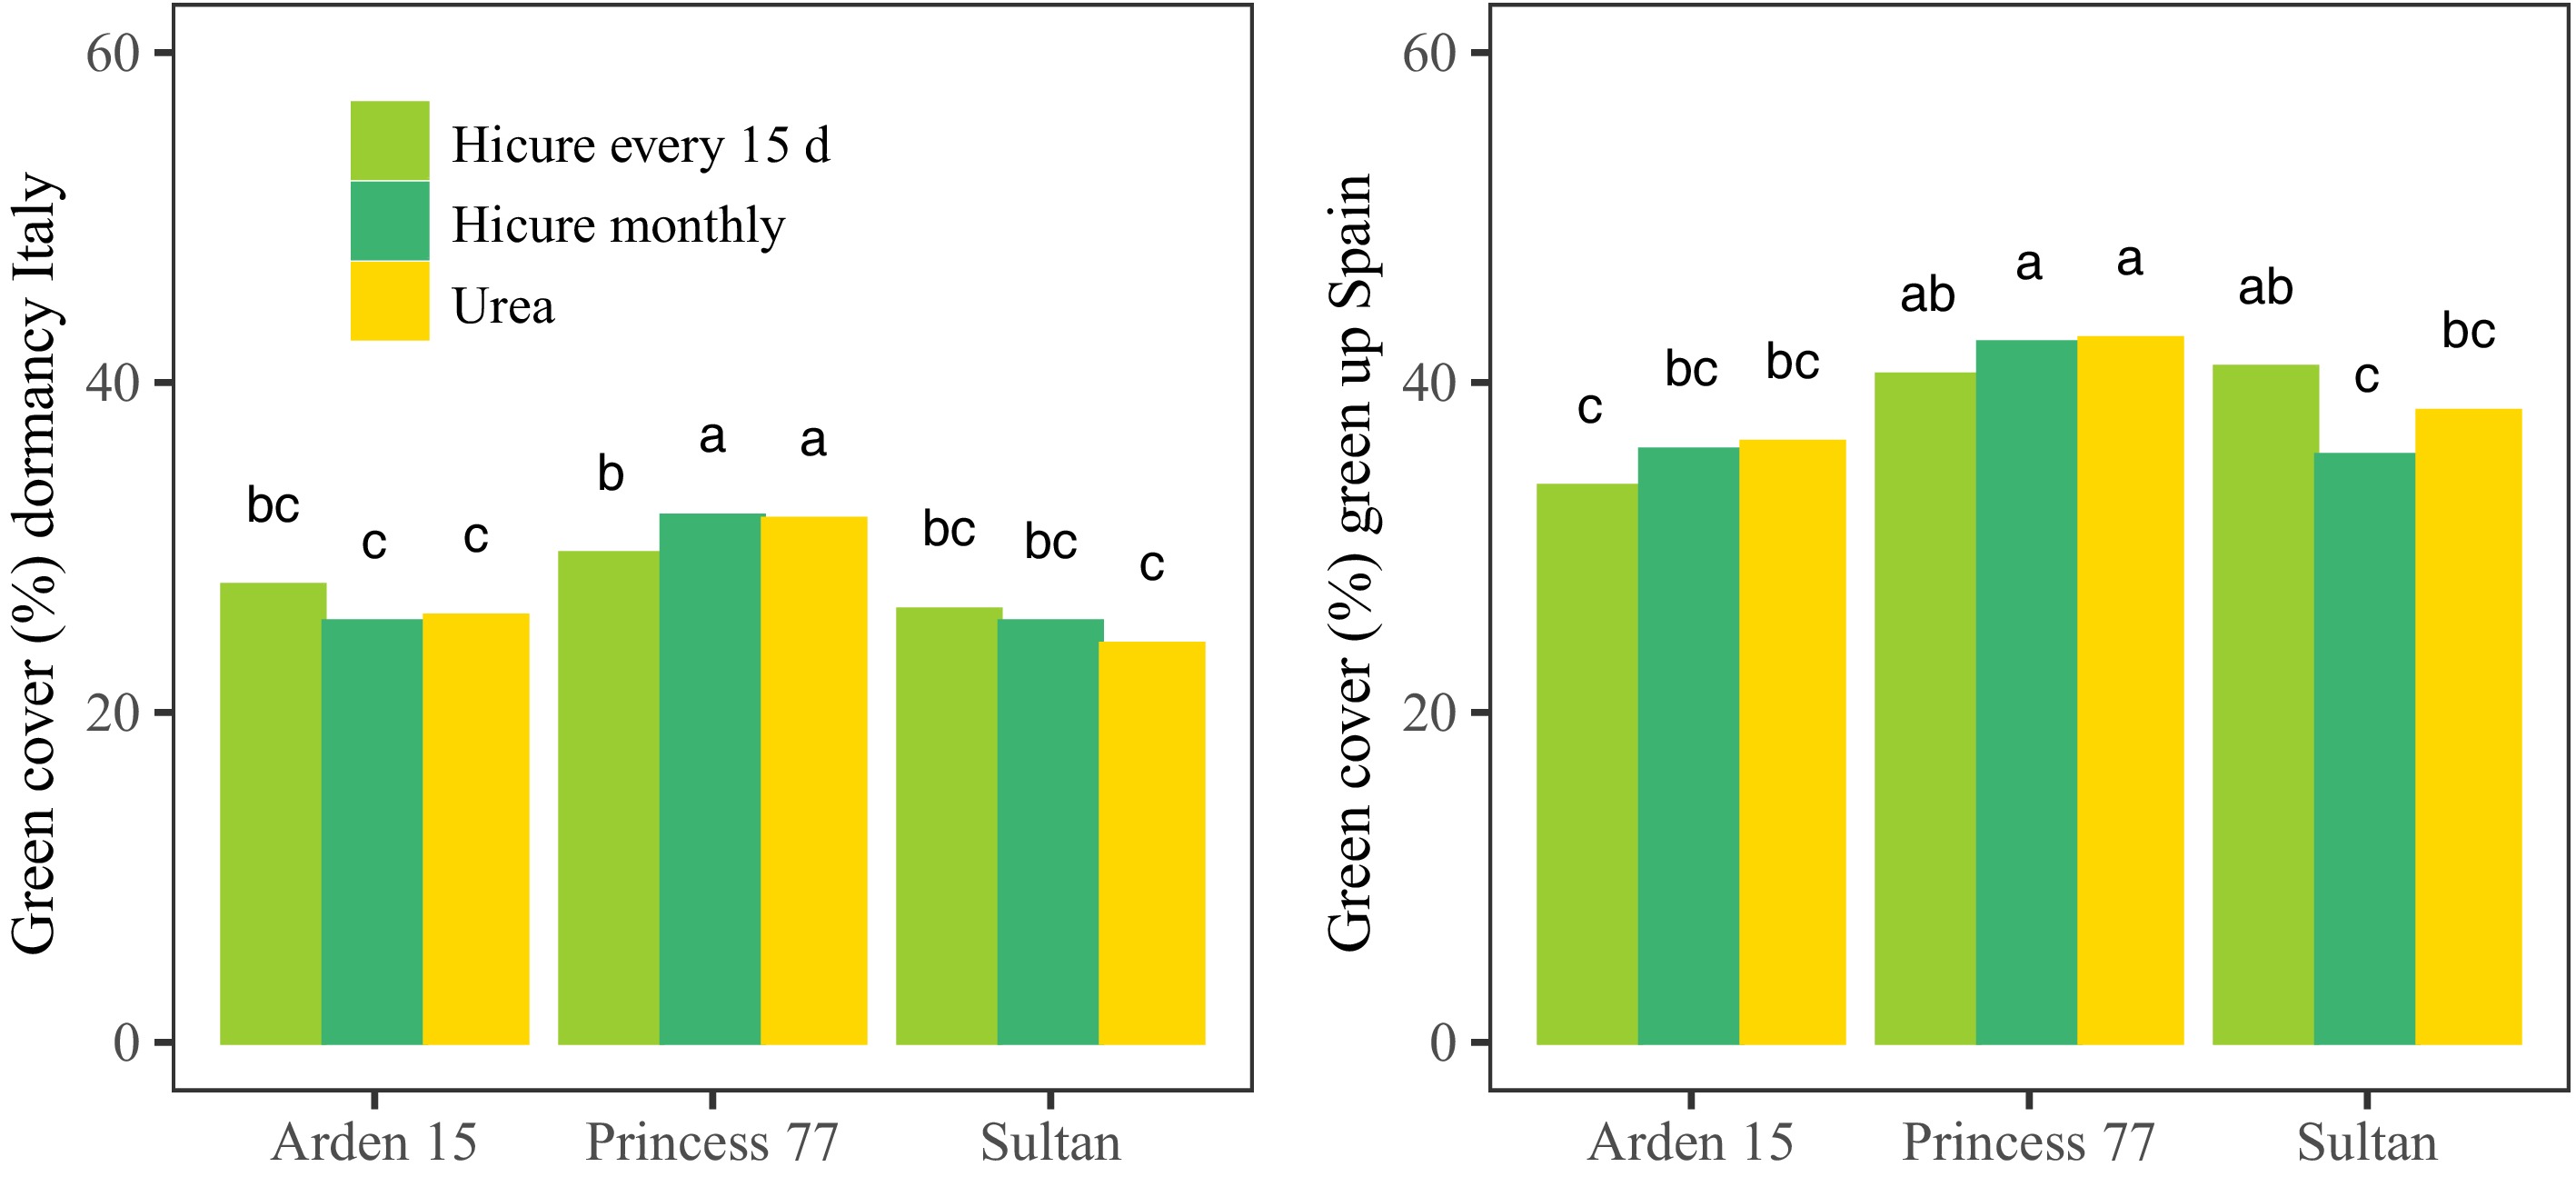
Figure 4.
The effects of cultivar and treatments on green cover during 2023−2024 spring green-up of three bermudagrass cultivars ('Arden 15', 'Princess 77', and 'Sultan') established at the experimental agricultural farm of the Polytechnic University of Valencia in Valencia (Spain), and during the 2022−2023 dormancy period of three bermudagrass cultivars ('Arden 15', 'Princess 77', and 'Sultan') established at the experimental agricultural farm of the University of Padova in Legnaro (Italy). Bars with different letters are significantly different at p < 0.05.
-
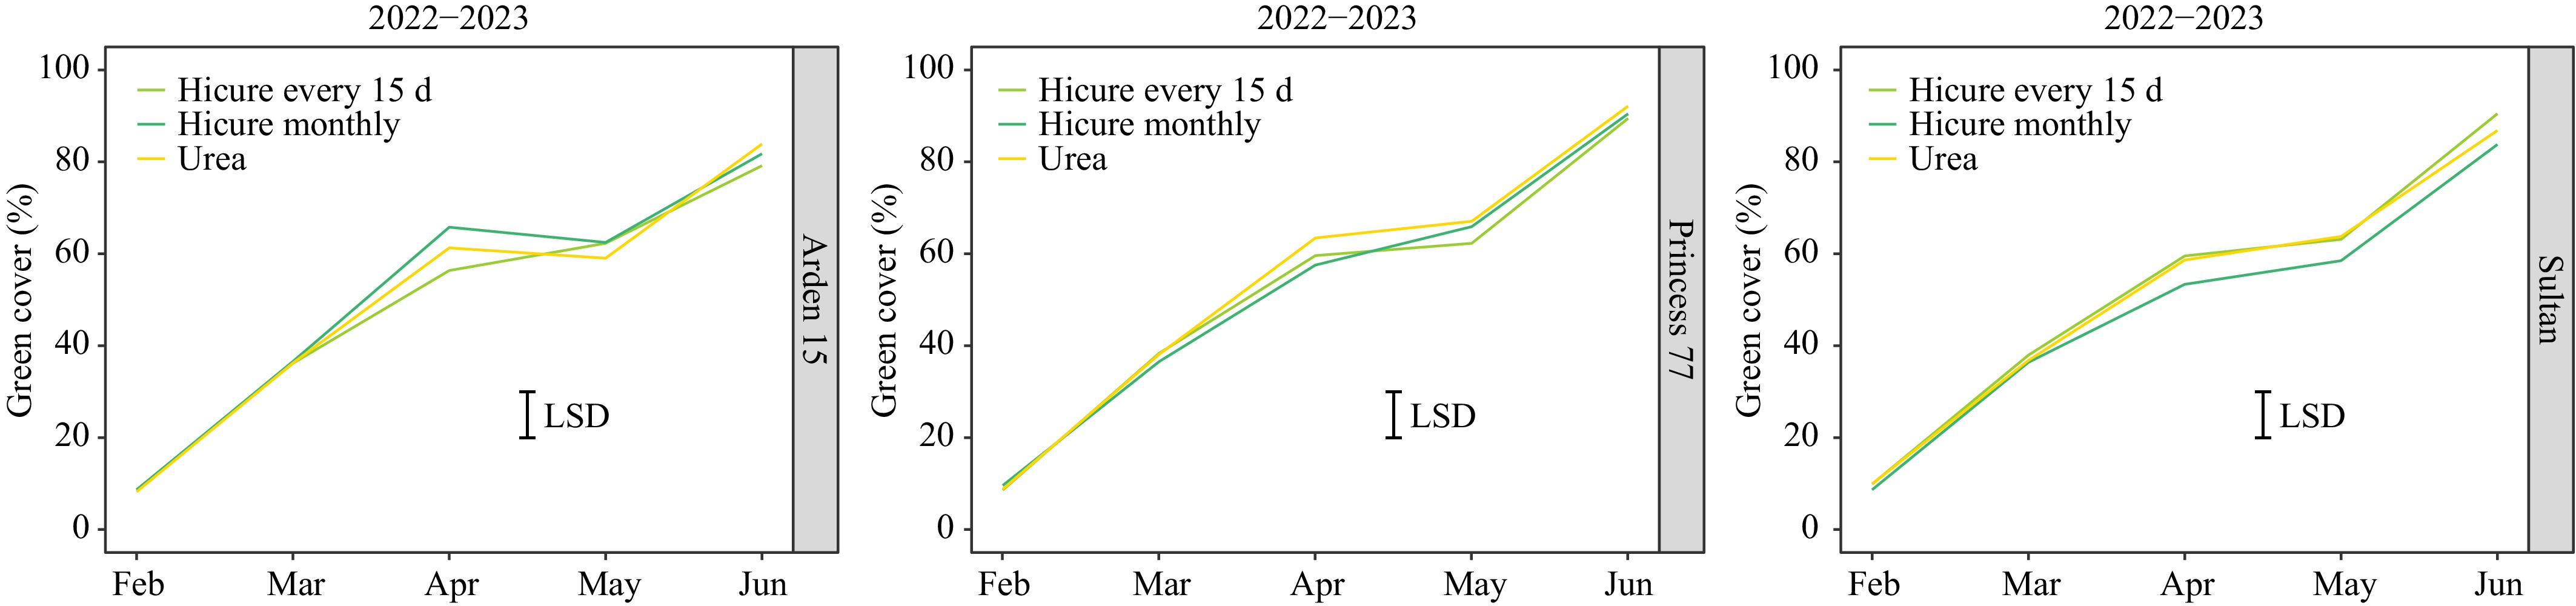
Figure 5.
The effects of the interaction between cultivar and treatment on green cover of three bermudagrass cultivars ('Arden 15', 'Princess 77', and 'Sultan') established at the experimental agricultural farm of the Polytechnic University of Valencia in Valencia (Spain) during spring green-up 2023. Vertical bars represent the least significant differences (p = 0.05) for comparing means.
-
Month Legnaro (Italy) Valencia (Spain) 2022 2023 2024 36 yr avg. 2022 2023 2024 22 yr avg. Jan. 3 6.2 3.6 3.2 10.1 10.9 13.2 9.9 Feb. 6.2 5.3 8.1 4.9 12.6 9.7 13.9 10.6 Mar. 8.2 10.4 11.1 9.0 13.0 15.9 14.6 12.7 Apr. 12 12.3 14.2 13.2 15.5 17.3 16.4 15.3 May 20 18 18.1 18.0 20.3 19.4 20.0 18.7 June 24.5 23 22.8 22.0 25.6 24.1 23.4 22.8 July 26.2 25.1 26.4 23.0 27.4 30.3 26.5 25.3 Aug. 24.6 24.2 26.3 23.4 28.1 27.5 27.8 25.5 Sept. 19.3 21.7 19.8 18.9 24.9 23.9 23.7 22.4 Oct. 16.8 17 15.9 14.0 20.9 21.7 20.7 18.5 Nov. 10.2 8.4 7.8 8.9 17.4 17.2 16.8 13.3 Dec. 6.5 5.2 4.5 4.1 14.5 12.5 12.5 10.4 Year 14.8 14.7 14.9 13.6 19.2 19.2 19.1 17.1 Table 1.
Monthly mean air temperatures (°C) over the study period and long-term average at the experimental agricultural farm of the University of Padova in Legnaro, Northeastern Italy (Lat. 45°20' N, Long. 11°57' E; elevation 8 m), and at the experimental agricultural farm of Polytechnic University of Valencia, in Valencia, Eastern Spain (Lat. 39°48' N, Long. 0°34' W; elevation 5 m).
-
Month Legnaro (Italy) Valencia (Spain) 2022 2023 2024 36 yr avg. 2022 2023 2024 22 yr avg. Jan. 20 58 58 43 11 0 7 33 Feb. 10 0 110 51 3 34 8 22 Mar. 14 27 100 57 172 0 8 38 Apr. 40 77 52 73 65 0 19 35 May 33 169 193 89 71 11 4 33 June 11 30 74 73 2 18 22 17 July 42 100 49 72 3 26 47 11 Aug. 105 75 42 65 25 26 0 17 Sept. 94 34 113 81 24 106 119 56 Oct. 6 83 204 84 37 3 81 56 Nov. 98 74 12 89 30 0 13 47 Dec. 92 34 65 61 12 2 13 29 Year 565 761 1072 837 455 226 341 394 Table 2.
Monthly precipitations (mm) over the study period and long-term average at the experimental agricultural farm of the University of Padova in Legnaro, Northeastern Italy (Lat. 45°20' N, Long. 11°57' E; elevation 8 m), and at the experimental agricultural farm of Polytechnic University of Valencia, in Valencia, Eastern Spain (Lat. 39°48' N, Long. 0°34' W; elevation 5 m).
-
N (kg ha−1) Program 1:
UreaProgram 2:
HICURE monthlyProgram 3:
HICURE every 15 d2022 15 July 25 25 (urea) 25 (urea) 10 Aug. 25 25 (urea) 25 (urea) 5 Sept. 25 12.5 6.25 1 Oct. − 12.5 6.25 15 Oct. − − 6.25 1 Nov. − − 6.25 15 Dec. − − − Total N 2022 125 125 125 2023 At 30% green-up 25 25 (urea) 25 (urea) 1 May − 25 12.5 15 May 25 − 12.5 1 June − 25 12.5 15 June 25 − 12.5 1 July − 25 12.5 15 July 25 − 12.5 1 Aug. − 25 12.5 15 Aug. 25 − 12.5 5 Sept. 25 25 12.5 1 Oct. − 25 − 15 Oct. − − − 1 Nov. − 25 − Total N 2023 150 150 150 2024 At 30% green-up 25 25 (urea) 25 (urea) 1 May 25 − 12.5 15 May 25 12.5 Total N 2024 50 50 50 Total N-3 years 375 375 375 Table 3.
Biostimulants-based programs used during the experimental period in the plot trials established at the experimental agricultural farm of the Polytechnic University of Valencia in Valencia, Eastern Spain (Lat. 39°48' N, Long. 0°34' W; elevation 5 m), and at the experimental agricultural farm of the University of Padova in Legnaro, Northeastern Italy (Lat. 45°20' N, Long. 11°57' E; elevation 8 m).
-
Year 1 (Oct. 2022–May 2023) Year 2 (Oct. 2023–May 2024) TQ TC NDVI Cover D Cover GU TQ TC NDVI Cover D Cover GU Cultivar (C) ns† ** ns ns ns *** * * ns ns Treatment (T) *** *** ns ns ns ** *** *** ns ns Sampling date (Da) *** *** *** *** *** *** *** *** *** *** C × T ns ** ns ns ** ** * ns ns * C × Da *** *** * ns ns *** *** *** ns ns T × Da ns ns ns ns ns ns ns ns ns ns C × T × Da ns ns ns ns ** ns ns ns ns ns * Significant F test at the 0.05 level of probability; ** significant F test at the 0.01 level of probability; *** significant F test at the 0.001 level of probability. ns† not significant at the 0.05 probability level. Table 4.
Results of the analysis of variance testing the effects of cultivar, treatment, sampling date, and their interactions on turfgrass quality (TQ), color (TC), normalized difference vegetation index (NDVI), and turf green cover when approaching dormancy (cover D), and in spring green-up (cover GU) periods of three bermudagrass cultivars ('Arden 15', 'Princess 77', and 'Sultan') established at the experimental agricultural farm of the Polytechnic University of Valencia in Valencia (Spain) in the 2 years of study.
-
Year 1 (Oct. 2022–May 2023) Year 2 (Oct. 2023–May 2024) TQ TC NDVI Cover D Cover GU TQ TC NDVI Cover D Cover GU Cultivar (C) ns† * * ns ns ns ns ns * ** Treatment (T) *** ** ** *** ns ns *** ns ns ns Sampling date (Da) *** *** *** *** *** *** *** *** *** *** C × T ns ns * ns ns ns ns *** * ns C × Da *** *** *** * *** *** ** *** * *** T × Da ns *** *** ns ns ns *** ns ns ns C × T × Da ns ns ns ns ns ns ns ns ns ns * Significant F test at the 0.05 level of probability; ** significant F test at the 0.01 level of probability; *** significant F test at the 0.001 level of probability. ns† not significant at the 0.05 probability level. Table 5.
Results of the analysis of variance testing the effects of cultivar, treatment, sampling date, and their interactions on turfgrass quality (TQ), color (TC), normalized difference vegetation index (NDVI), and turf green cover when approaching dormancy (cover D), and in spring green-up (cover GU) periods of three bermudagrass cultivars ('Arden 15', 'Princess 77', and 'Sultan') established at the experimental agricultural farm of the University of Padova in Legnaro (Italy) in the 2 years of study.
-
Autumn 2022 Spring 2023 Autumn 2023 Spring 2024 Starch Glucose Fructose Starch Glucose Fructose Starch Glucose Fructose Starch Glucose Fructose Cultivar (Cv) ns† * * *** * ** *** * * ** ns ns Location (Loc) ns ns ns ** ns *** *** *** *** *** *** *** Treatment (Tr) ns ns ns ns ns ns ns * ns ns ns ns Cv × Loc ns ns ns ** ns ns ns ns * ns ns ns Cv × Tr ns ns ns ns ns ns ns ns ns ns ns ns Loc × Tr ns ns ns ns ns ns ns ns ns ns ns ns Cv × Loc × Tr ns ns ns ns ns ns ns ns ns ns ns ns * Significant F test at the 0.05 level of probability; ** significant F test at the 0.01 level of probability; *** significant F test at the 0.001 level of probability. ns† not significant at the 0.05 probability level. Table 6.
Results of the analysis of variance testing the effects of cultivar, treatment, location, and their interactions on starch, glucose, and fructose in autumn and spring of three bermudagrass cultivars ('Arden 15', 'Princess 77', and 'Sultan') established at the experimental agricultural farm of the Polytechnic University of Valencia in Valencia (Spain), and at the experimental agricultural farm of the University of Padova in Legnaro, (Italy) in the 2 years of study (year 1 = October 2022–May 2023; year 2 = October 2023–May 2024).
Figures
(5)
Tables
(6)