-
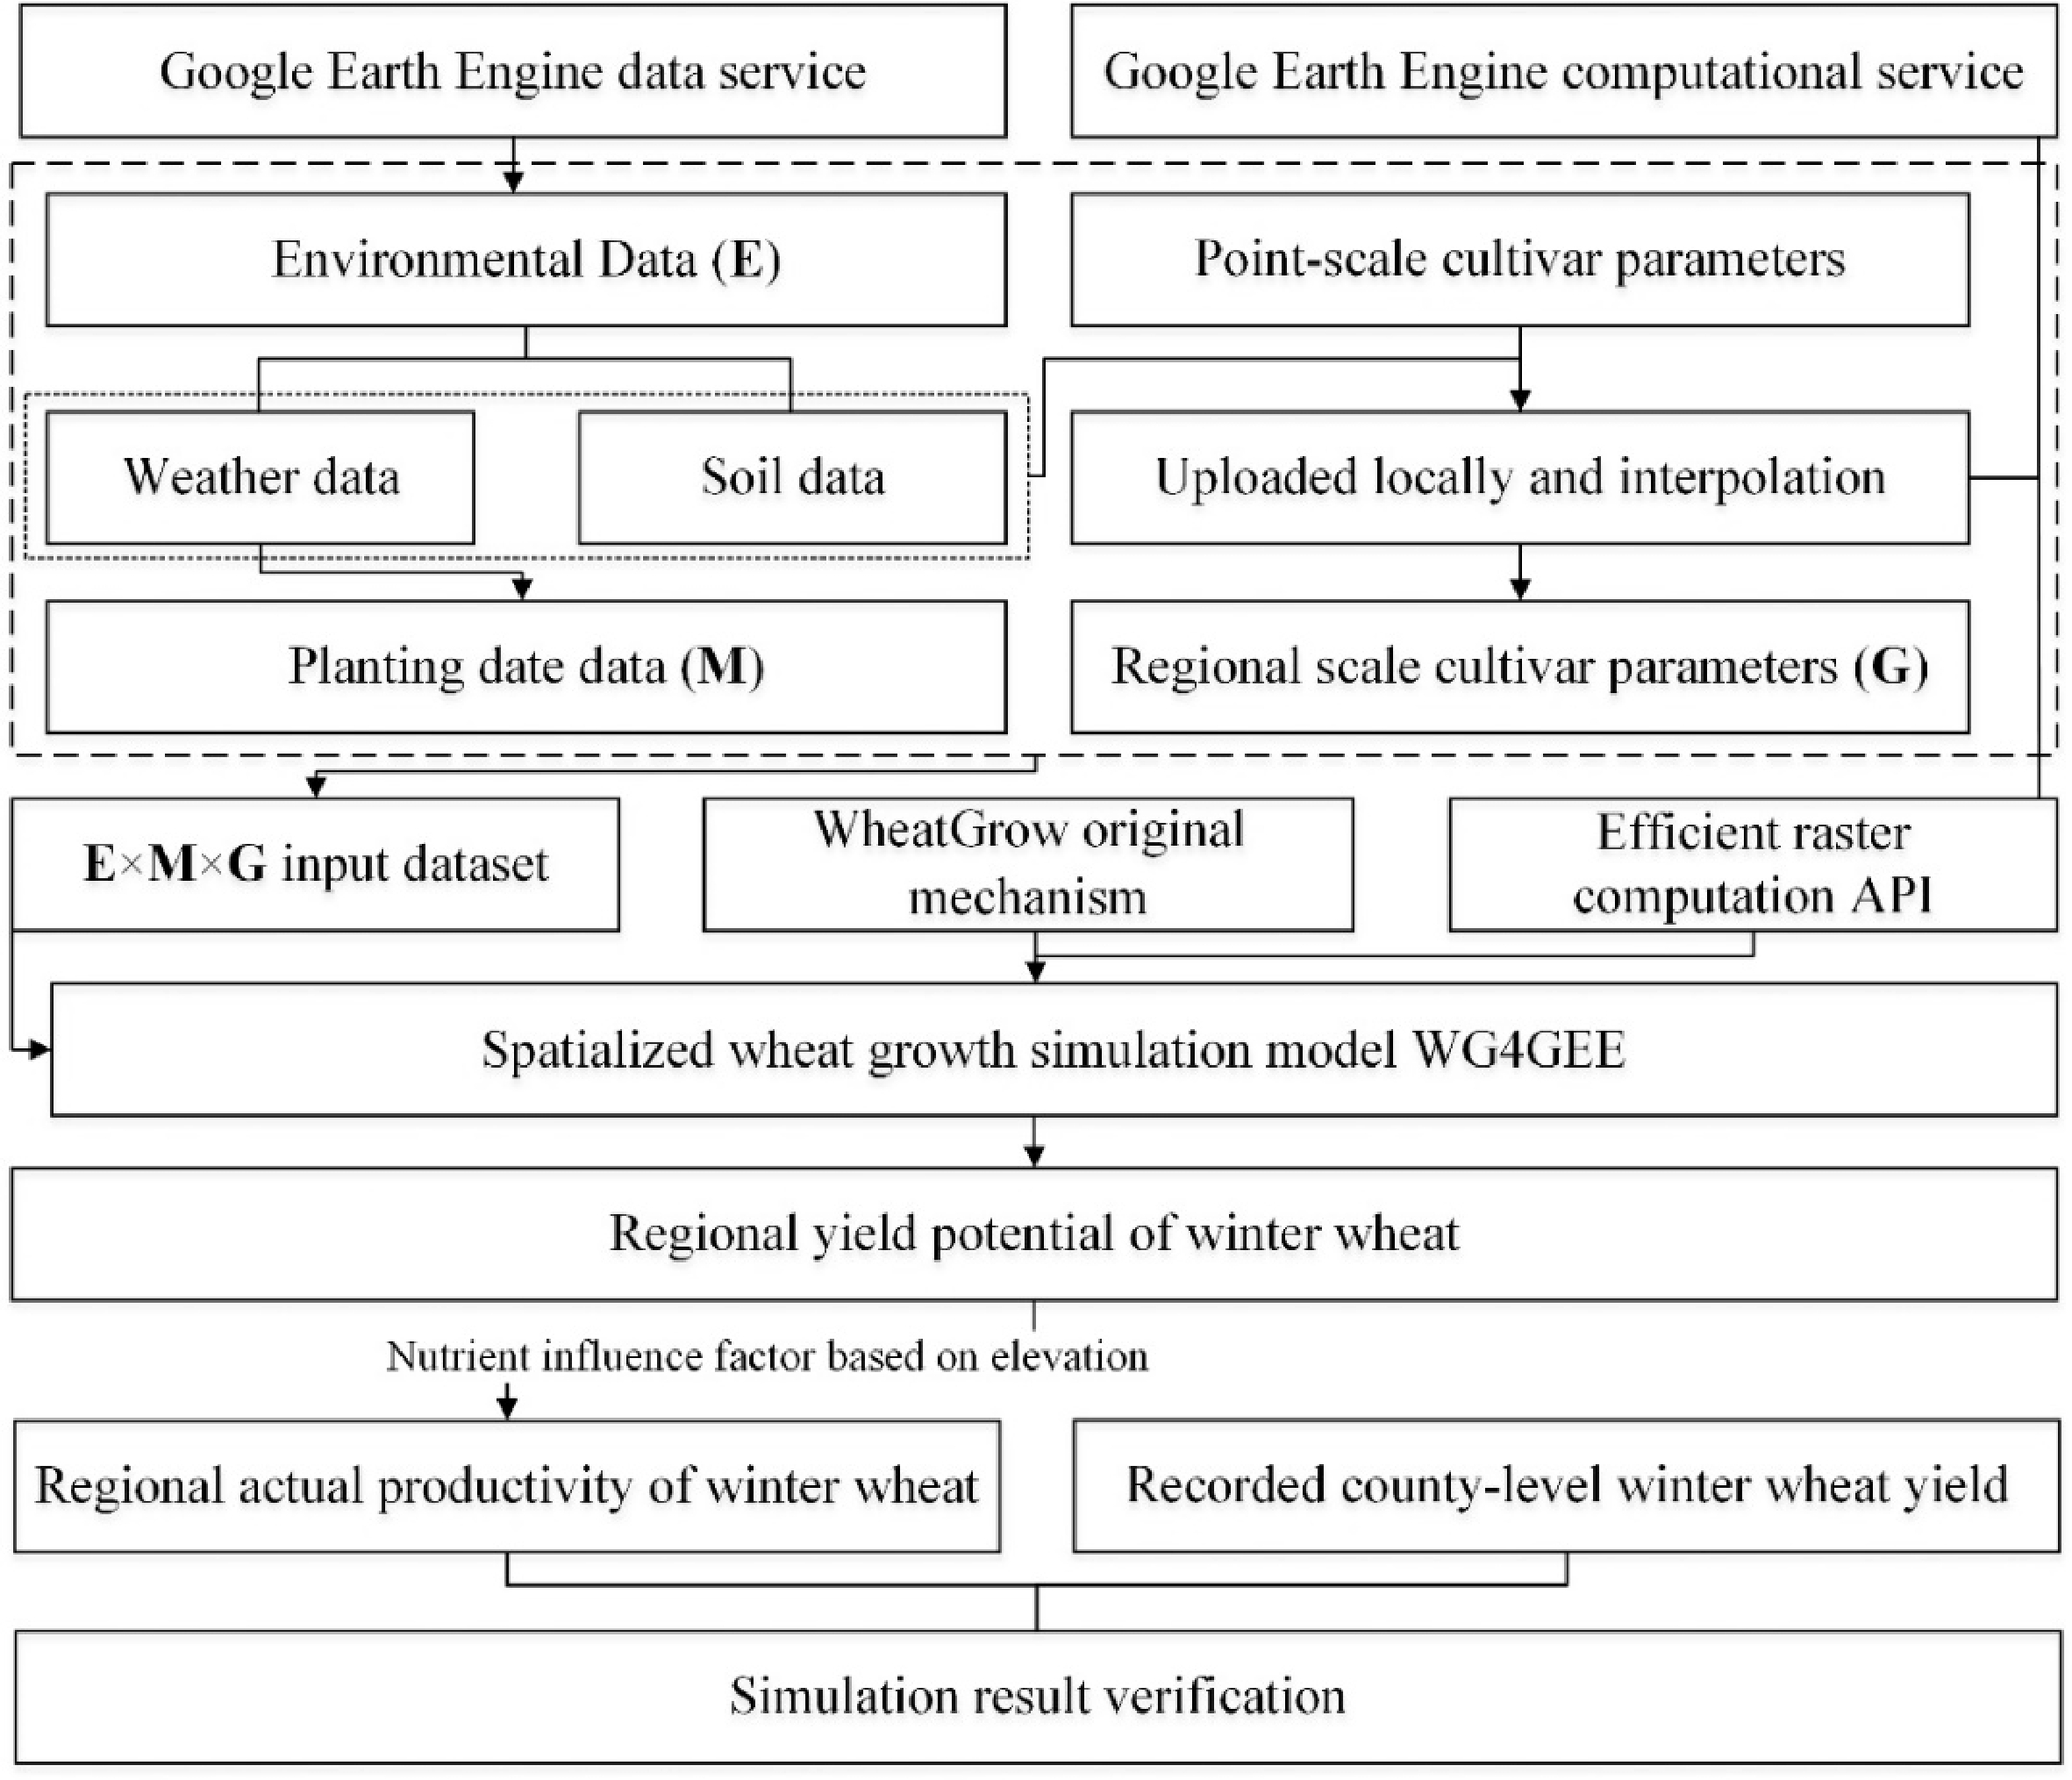
Figure 1.
The construction process of WG4GEE.
-
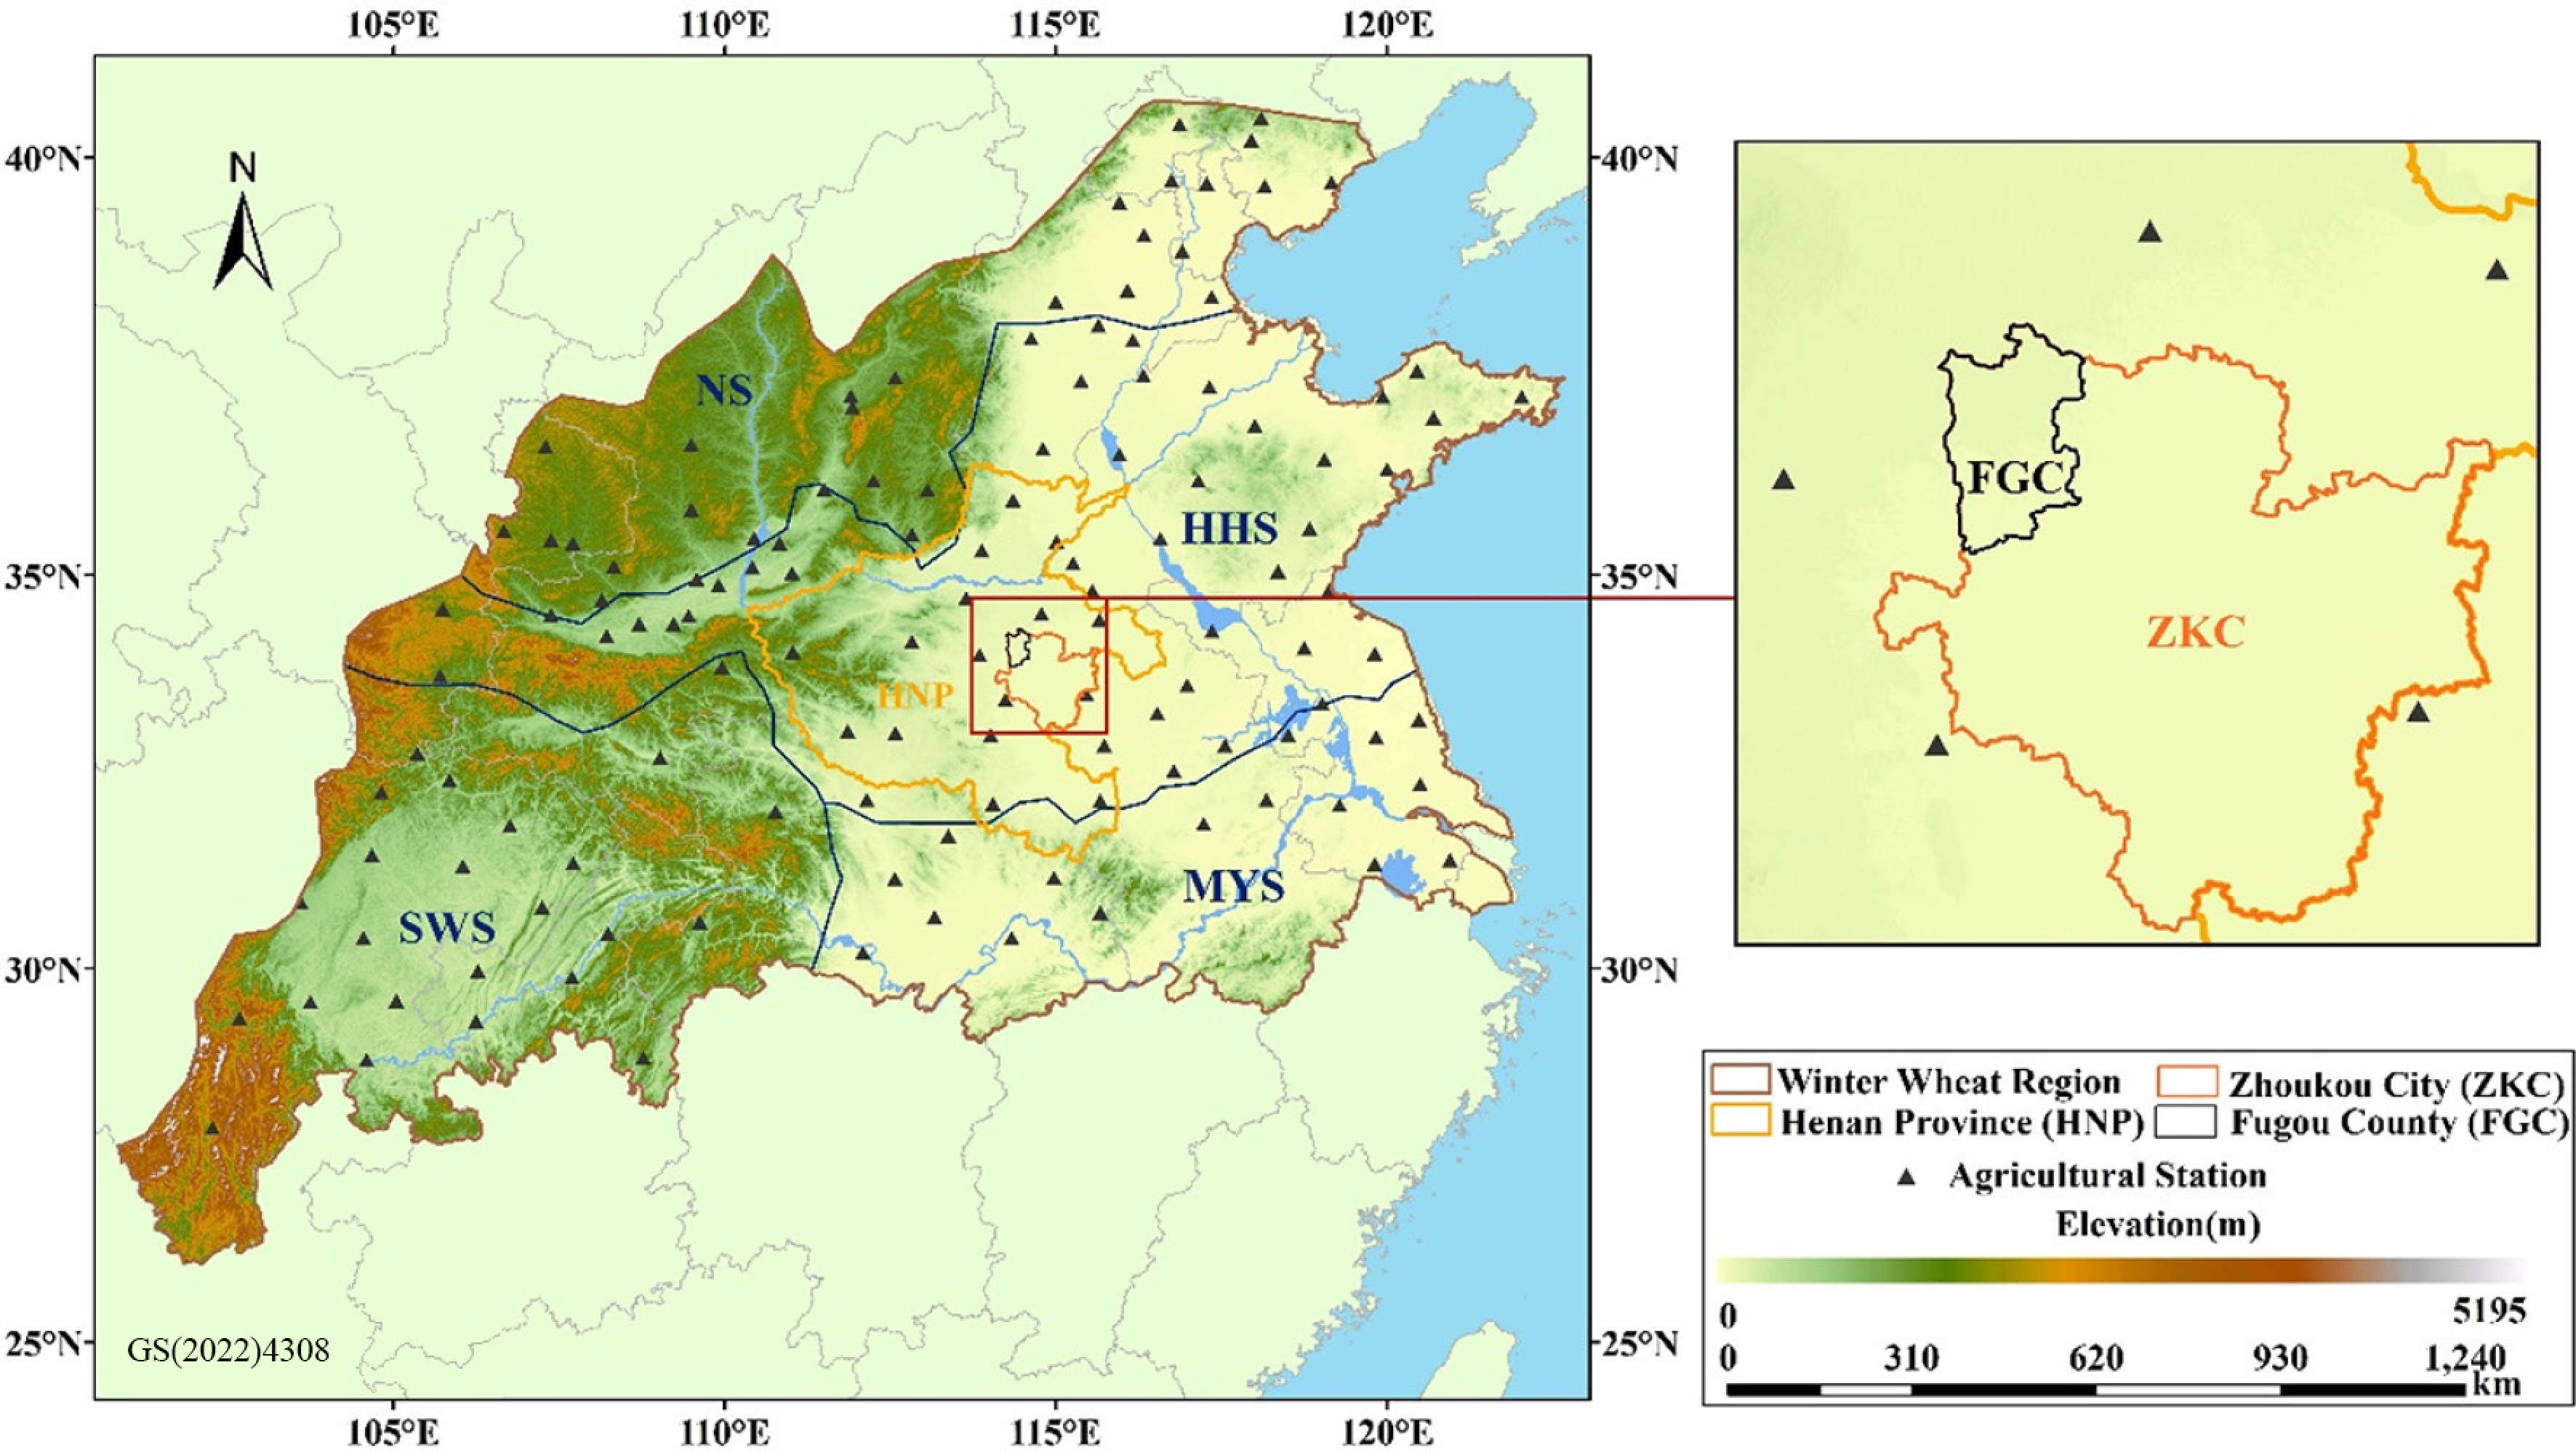
Figure 2.
Location of China's winter wheat region and agricultural stations. Base map: Standard Map of China (2022 edition), review No. GS(2022)4308.
-
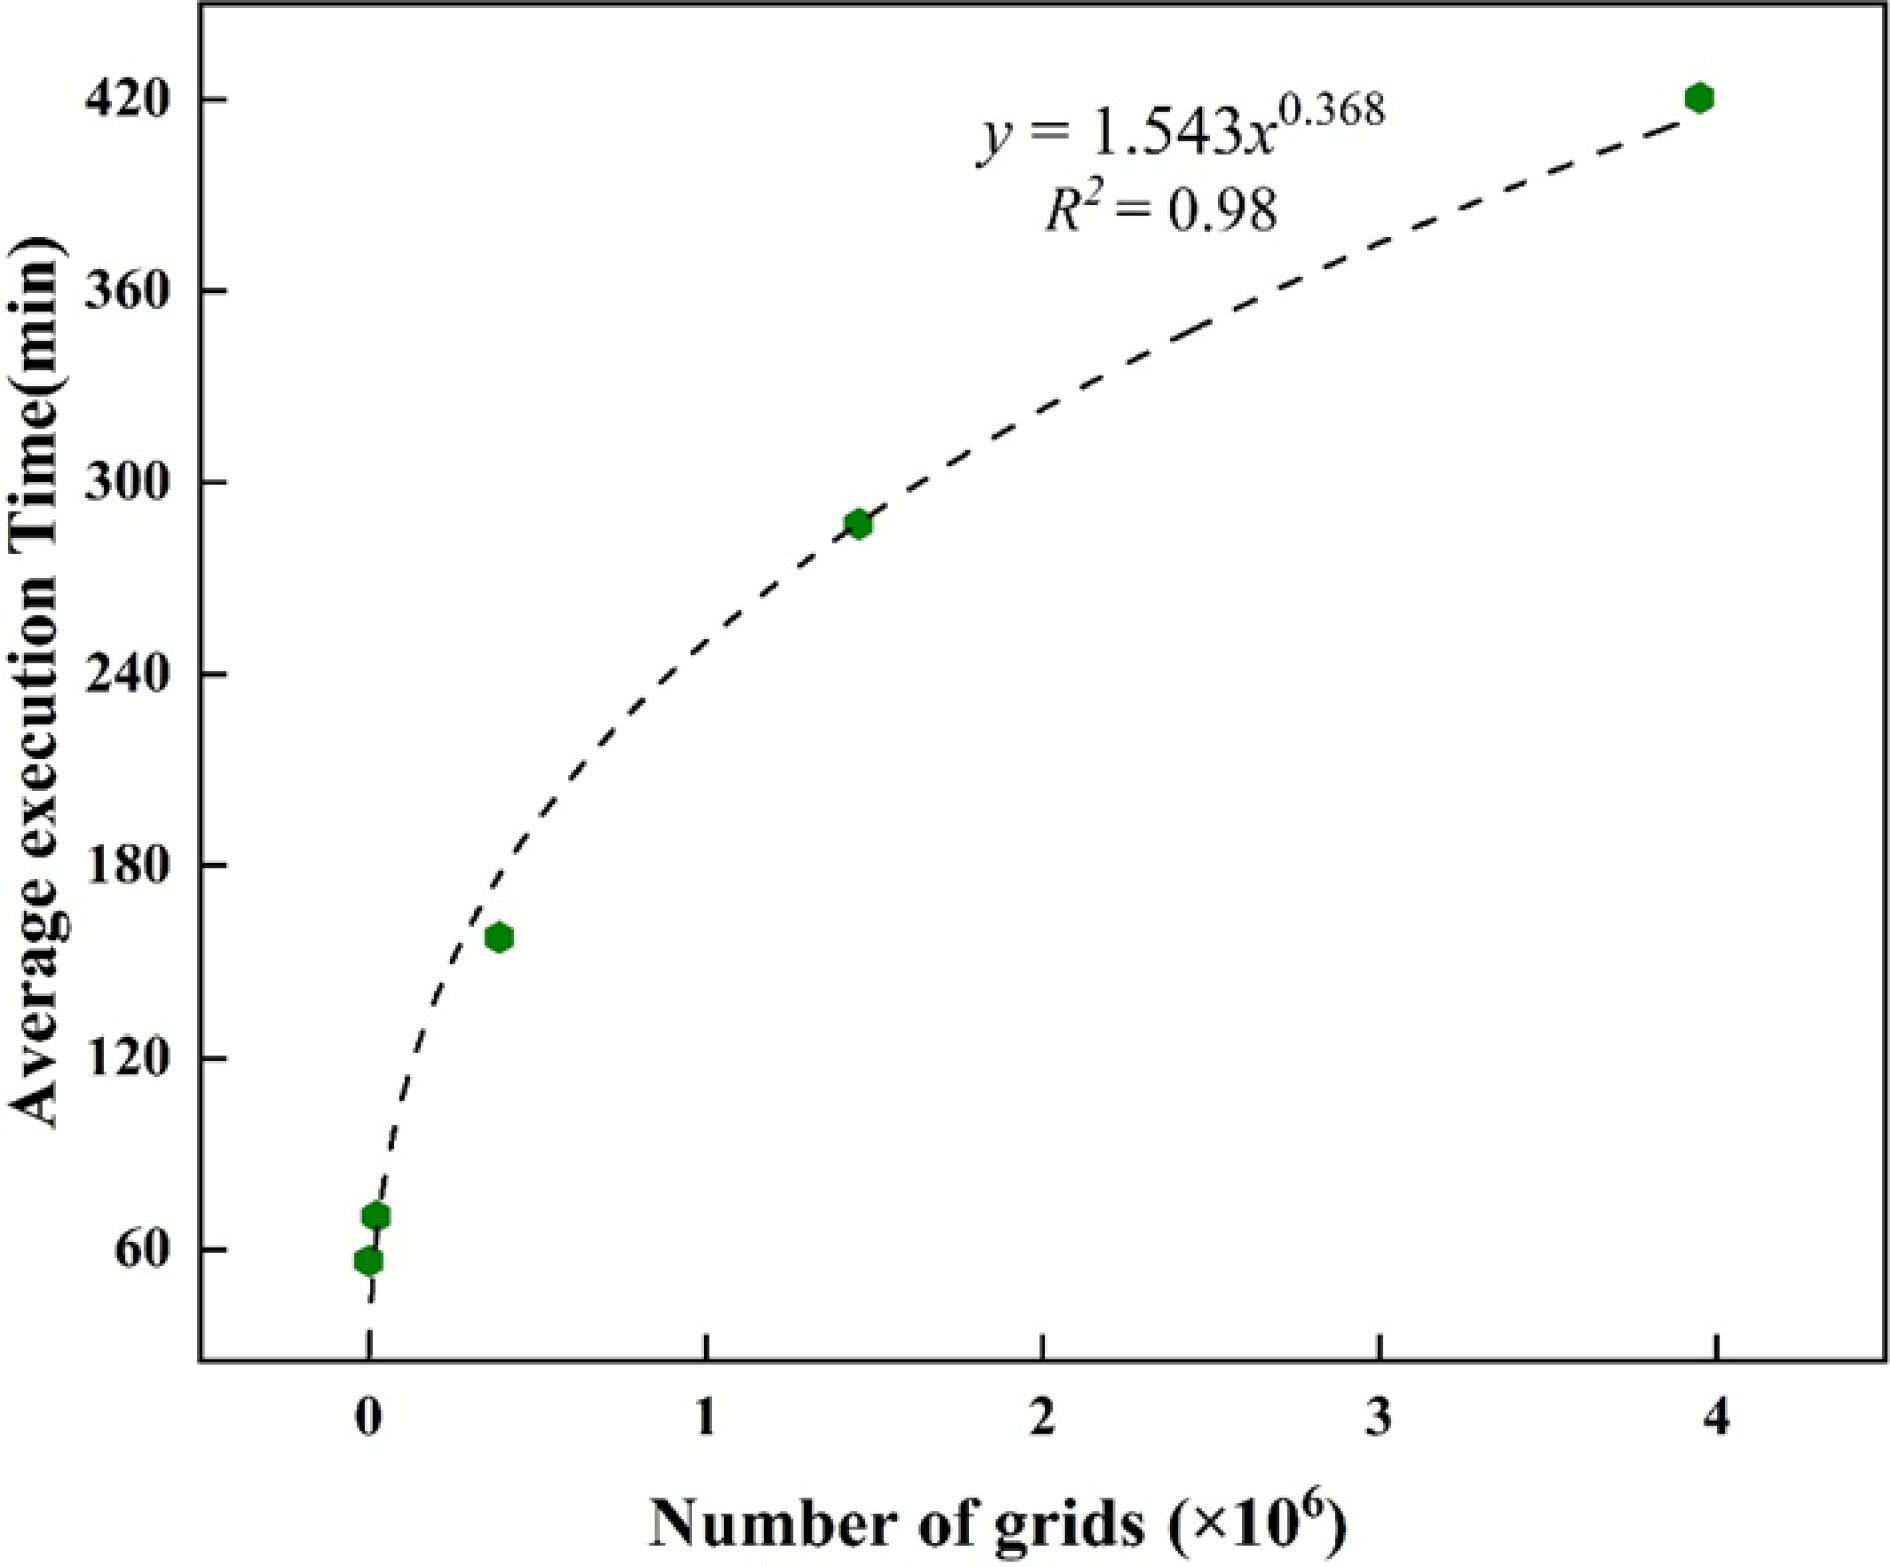
Figure 3.
WG4GEE execution time with different grid numbers.
-
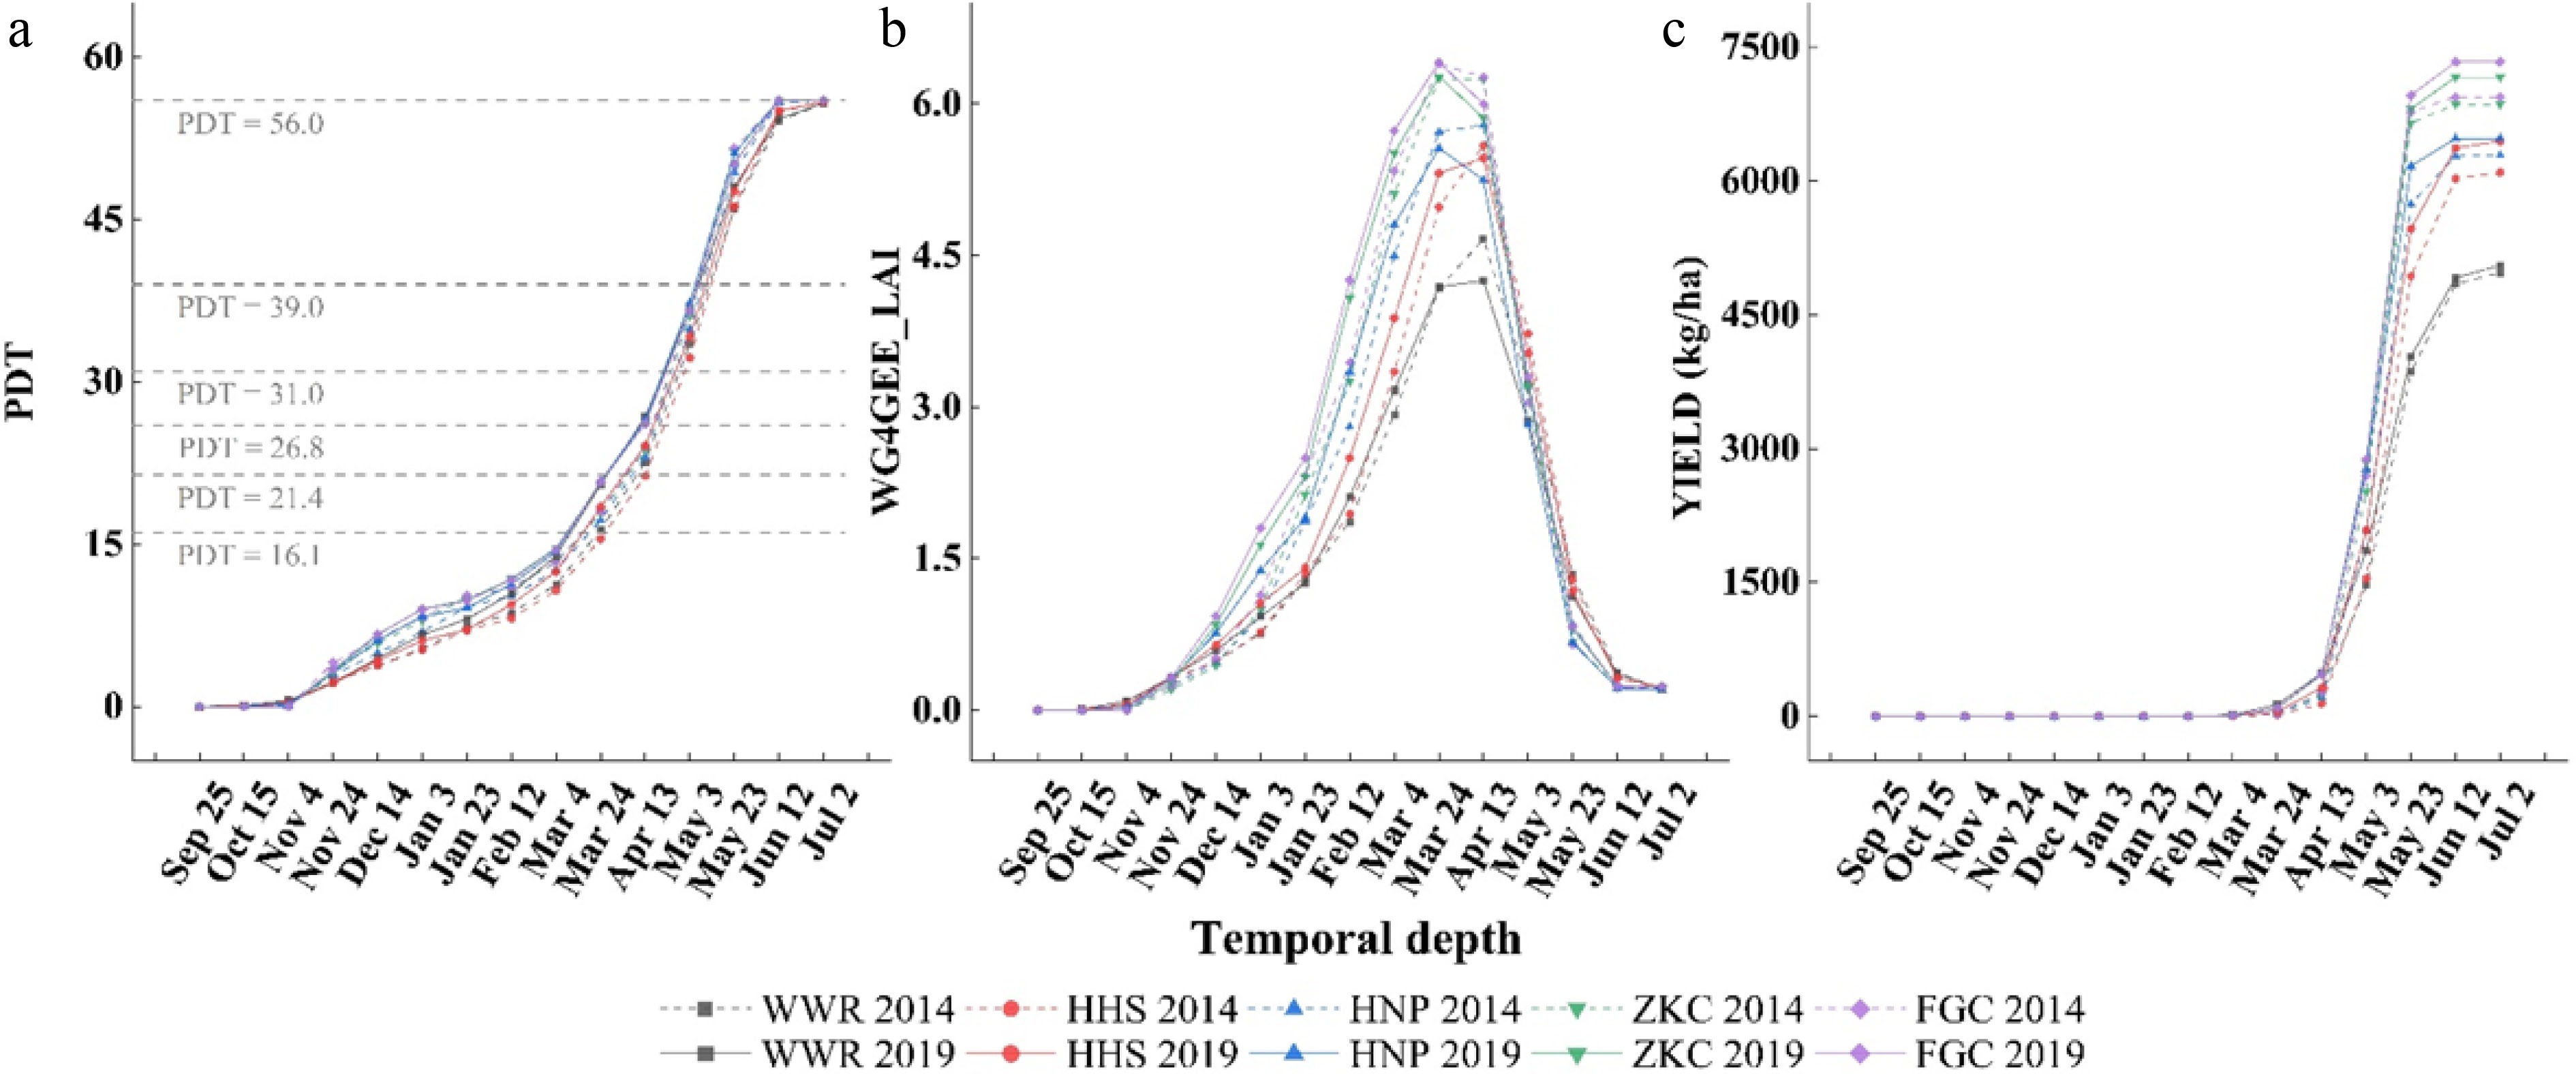
Figure 4.
Dynamic simulation of winter wheat growth based on WG4GEE. (a)−(c) respectively demonstrate the simulated PDT, LAI, and yield based on WG4GEE. WWR: China's winter wheat region. HHS: Huanghuai winter wheat subregion. HNP: Henan Province. ZKC: Zhoukou City. FGC: Fugou County.
-
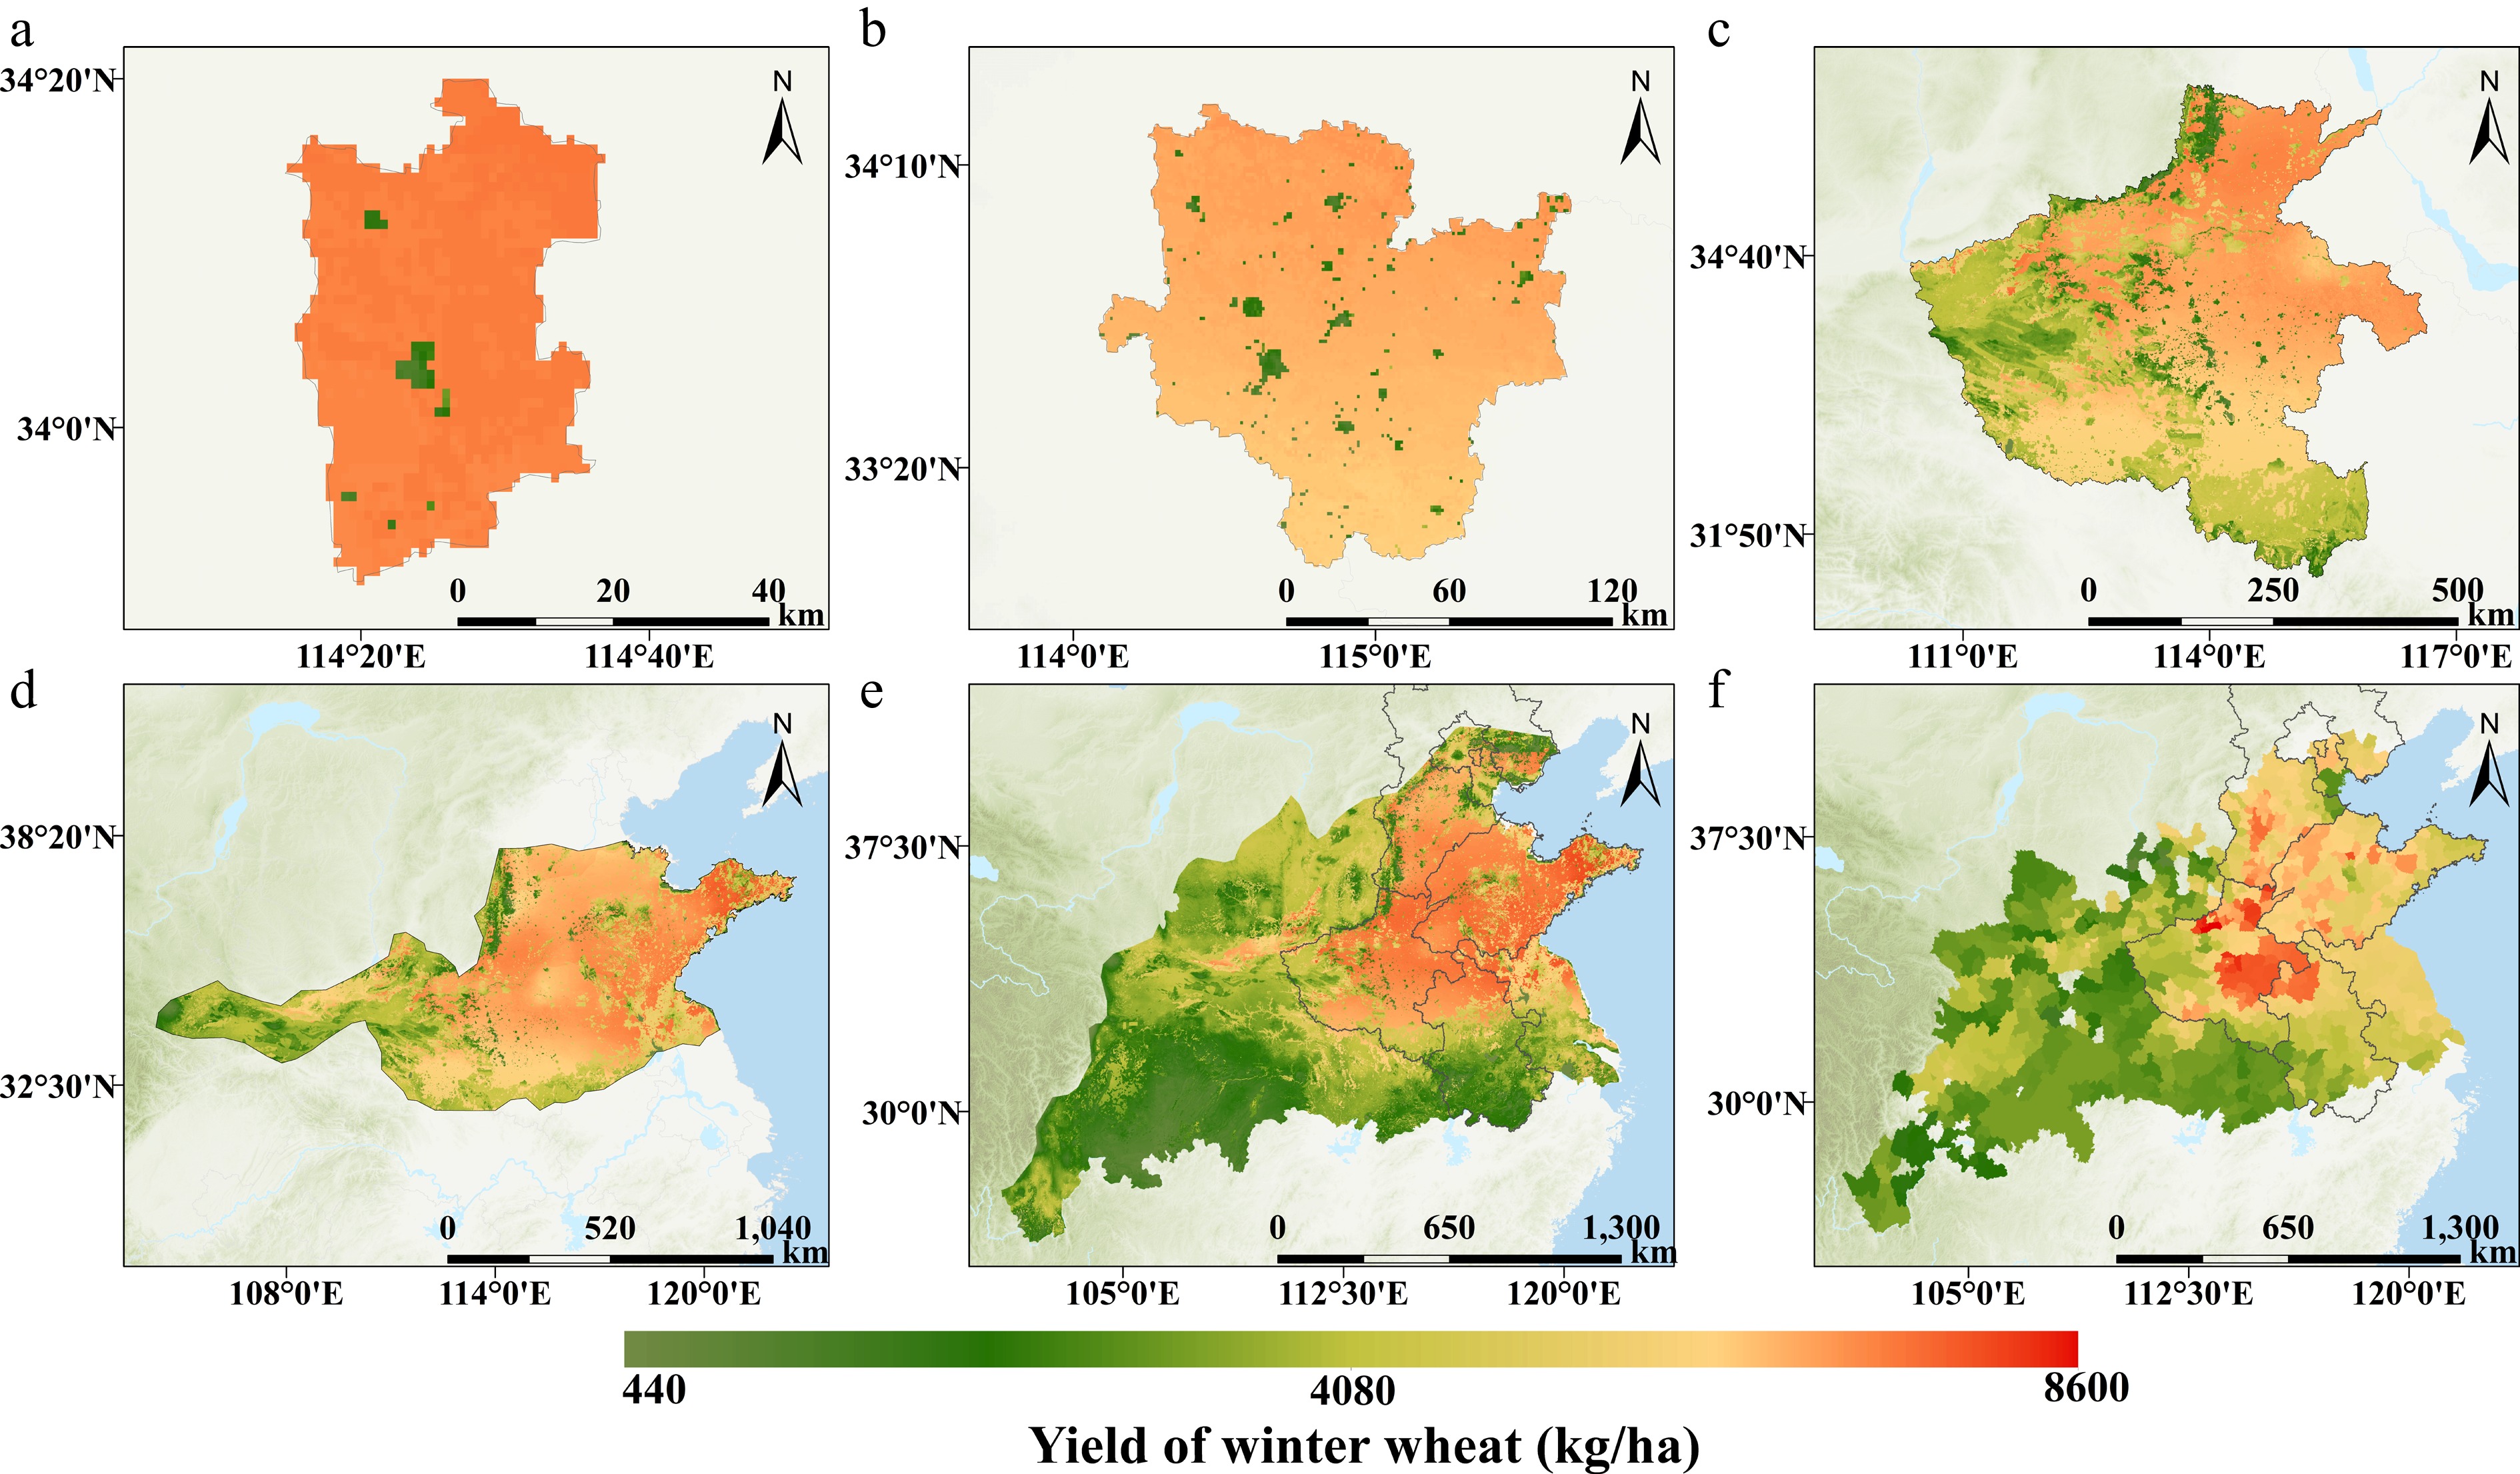
Figure 5.
Distribution of winter wheat yields at different regional scales. (a)−(e) Simulation results based on WG4GEE at different spatial scales. (a) Fugou County. (b) Zhoukou City. (c) Henan Province. (d) Huanghuai winter wheat subregion. (e) Winter wheat region. (f) Statistical production of counties within the winter wheat region. Base map: Standard Map of China (2022 edition), review No. GS(2022)4308.
-
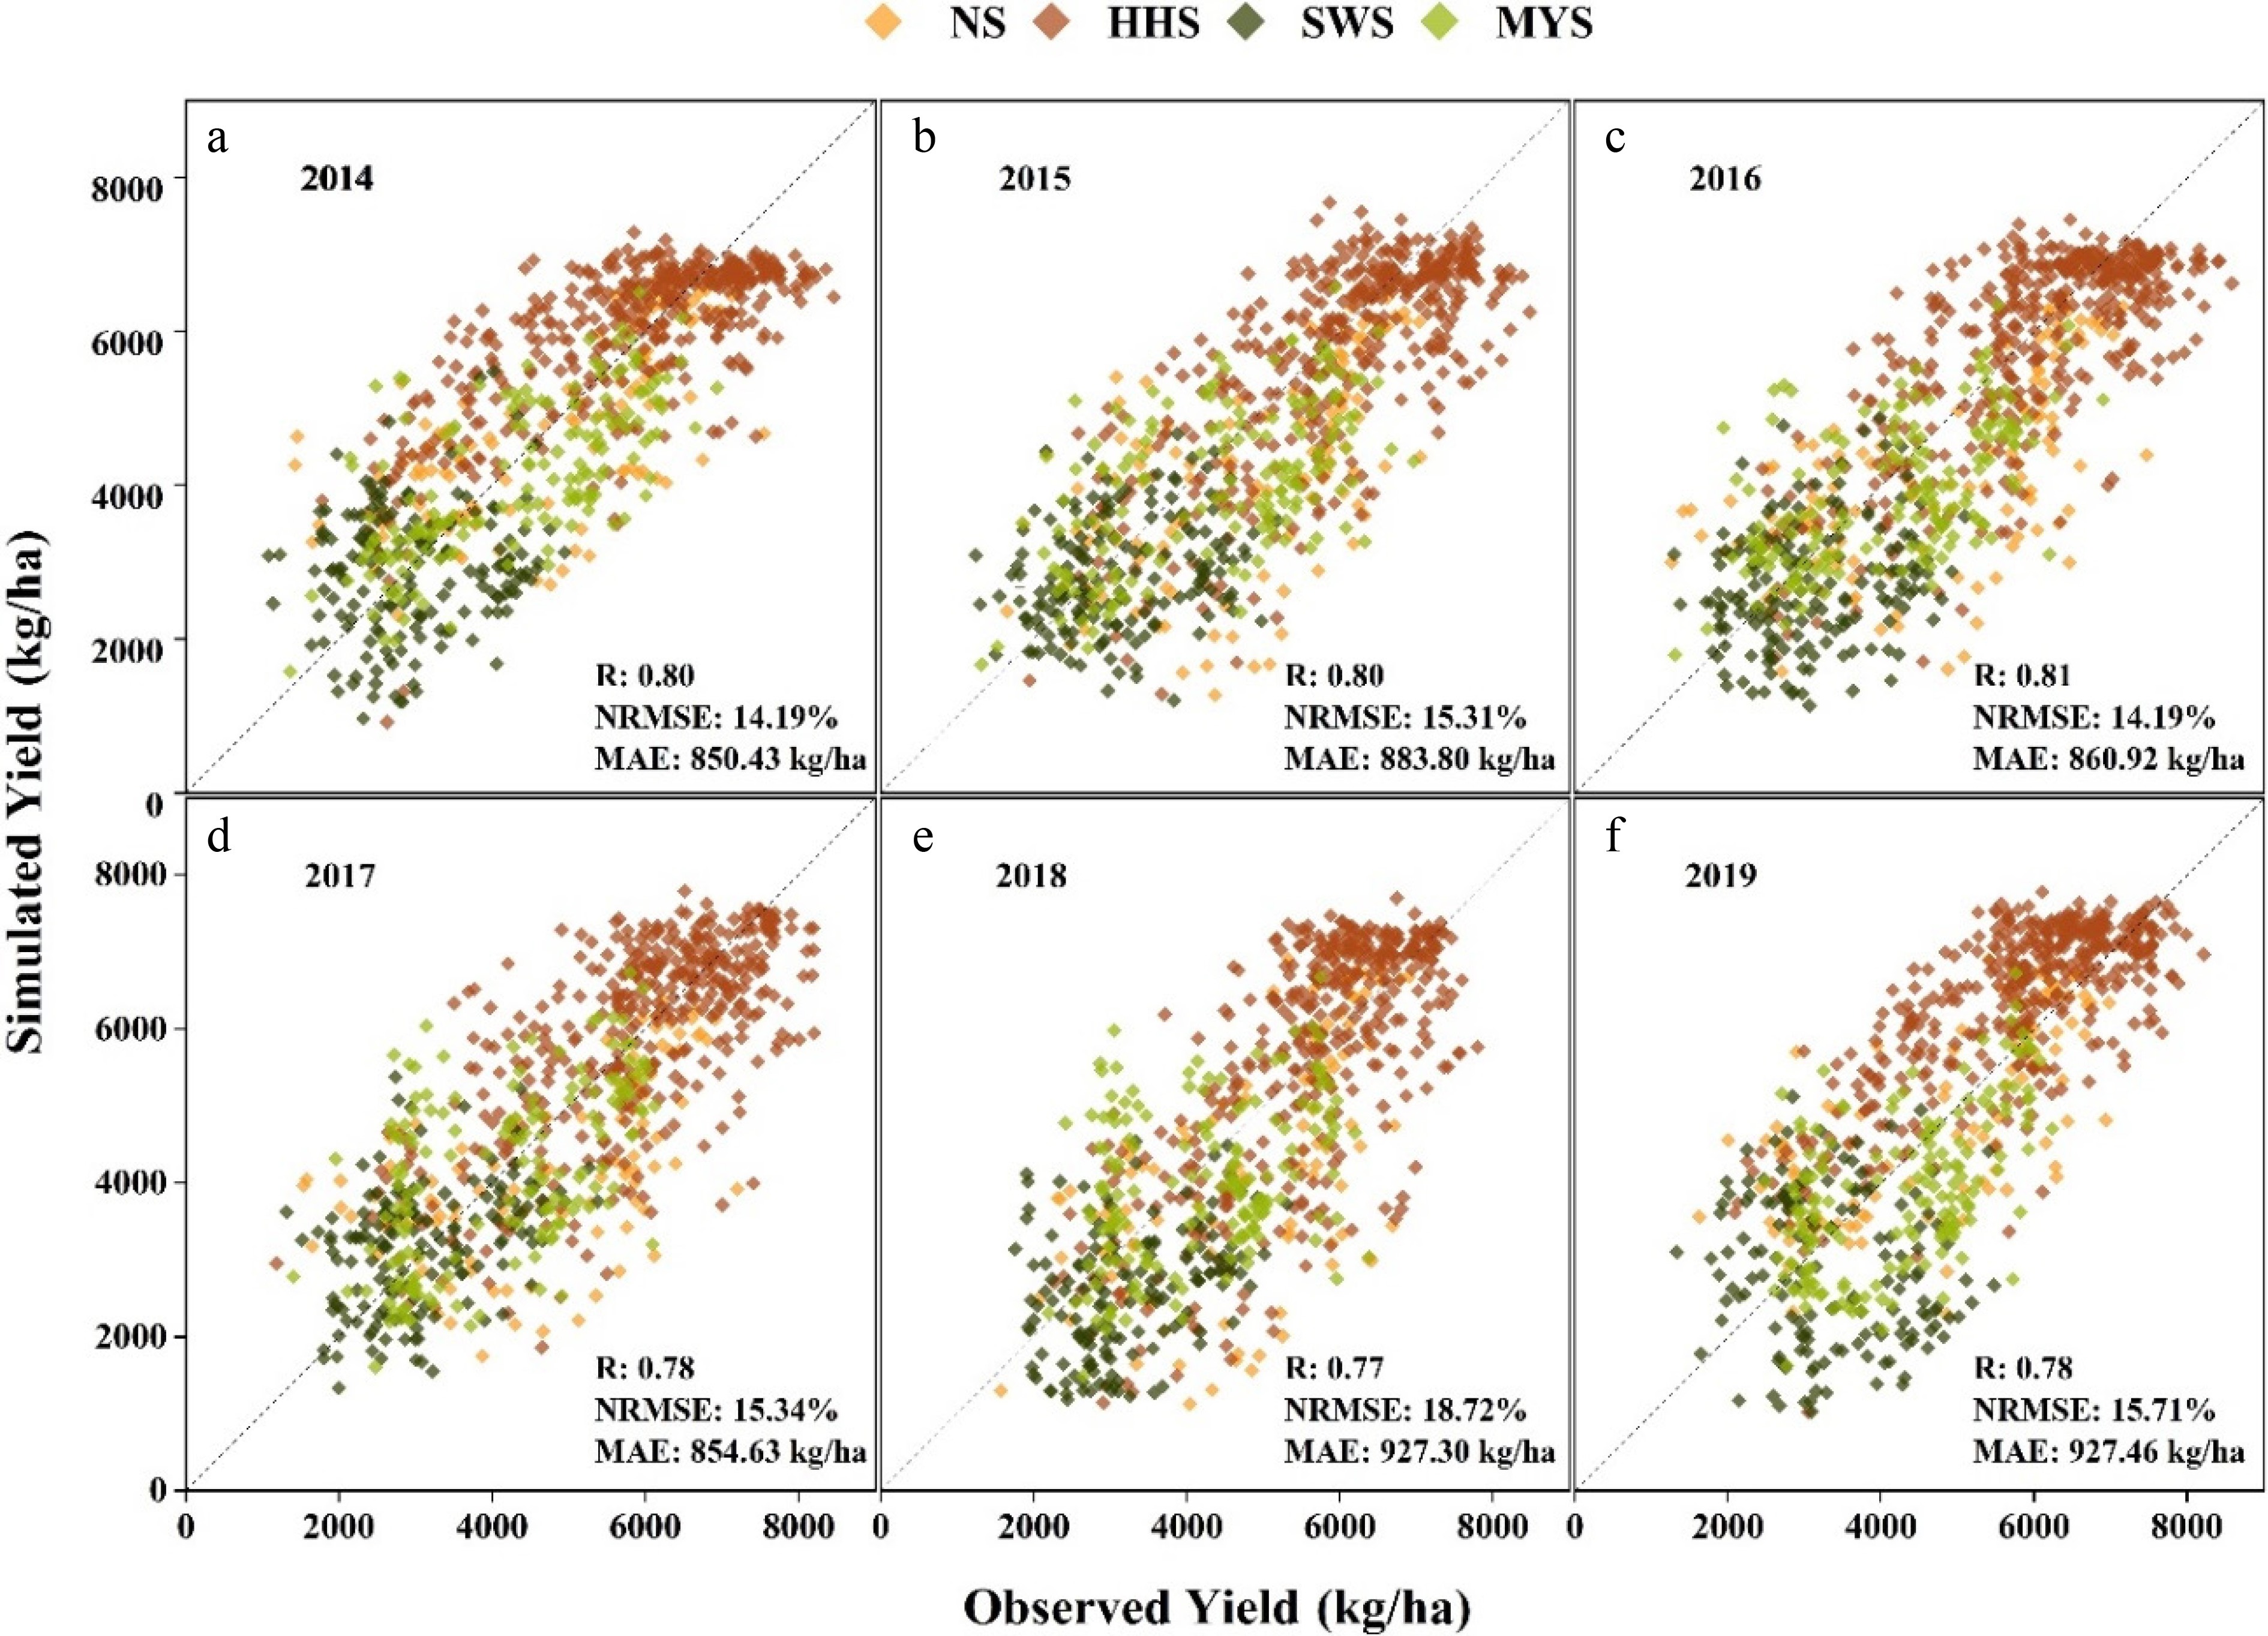
Figure 6.
Observed winter wheat yield versus simulated yield by WG4GEE. NS: Northern winter wheat subregion, HHS: Huanghuai winter wheat subregion, SWS: Southwestern winter wheat subregion, MYS: Middle-lower Yangtze River winter wheat subregion.
-
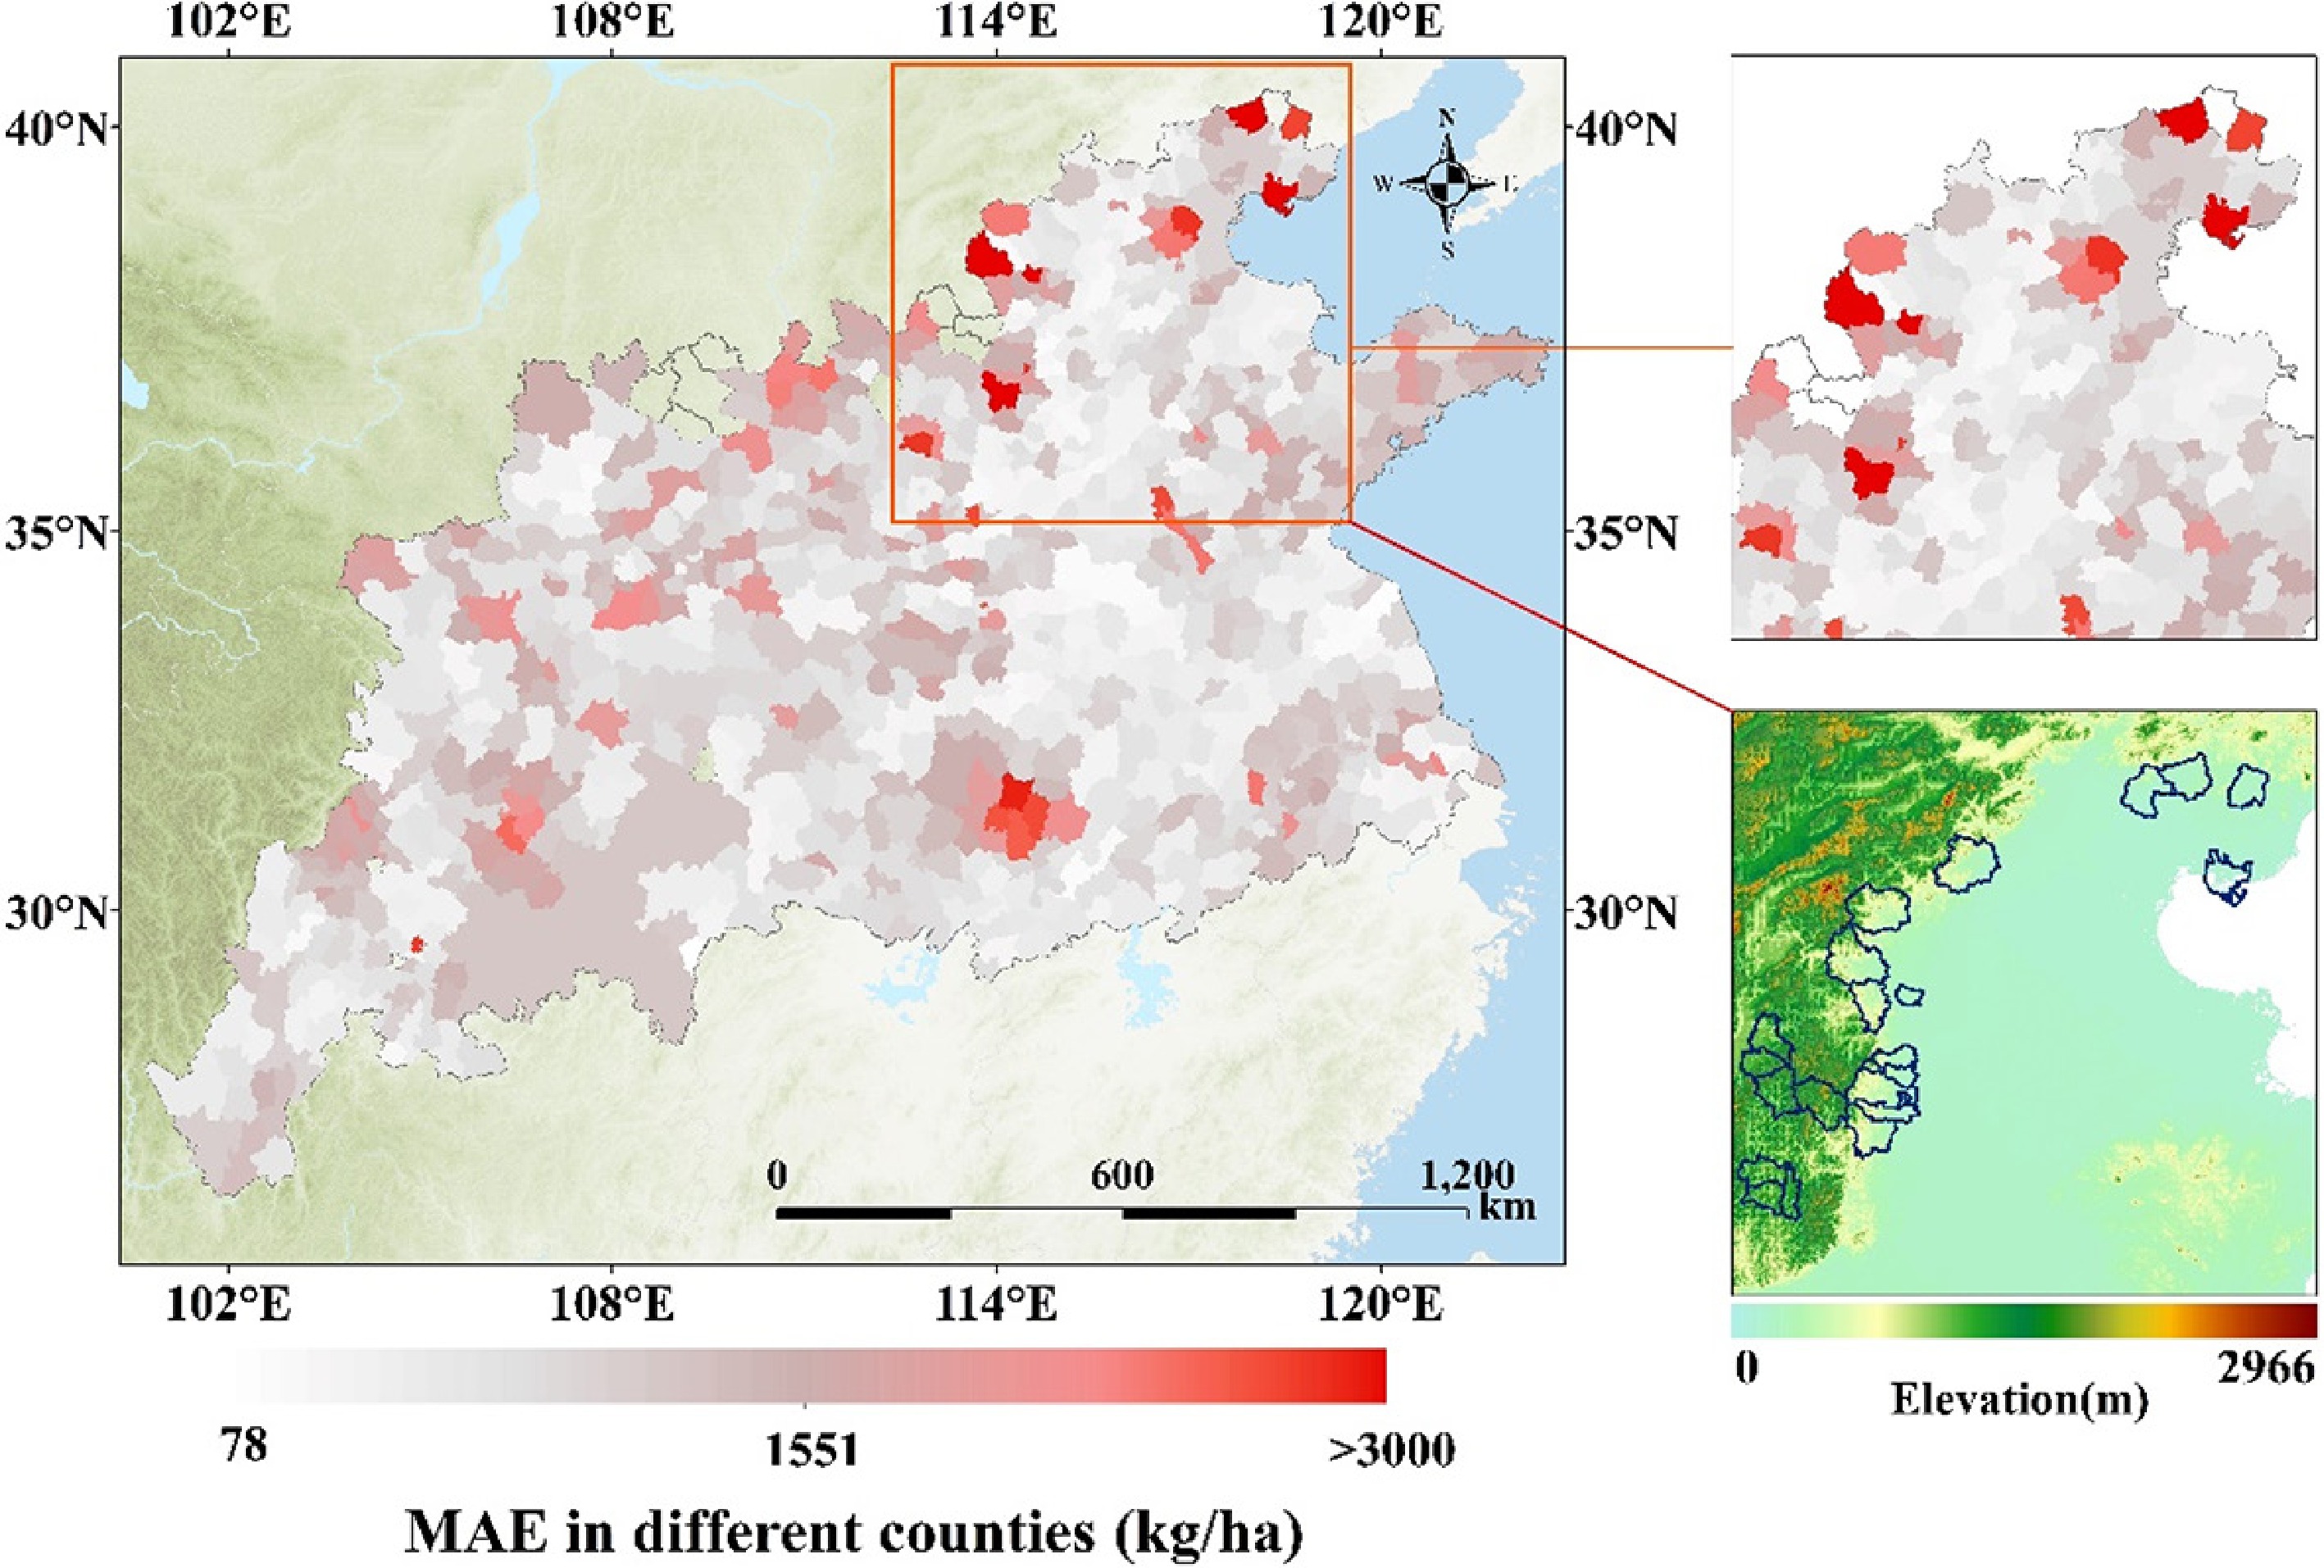
Figure 7.
Distribution of MAE across different counties in the study area. Base map: Standard Map of China (2022 edition), review no. GS(2022)4308.
-
Data type Data description Datasets/data sources Spatial resolution Temporal resolution Unit Weather data Tmax ERA5-Land Hourly1 0.1° Hourly K Tmin K Tmean K Solar radiation J/m2 Soil data Soil moisture GLDAS2 0.25° Every 3 h kg/m2 Clay content OpenLandMap3 250 m / % Sand content % Organic carbon content *5 g/kg Soil bulk density kg/m3 Management data Planting dates Dual-window model4 1 km Yearly Doy Irrigation map GFSAD1005 1 km / / Sowing depth Default (value = 2.5) / / cm Sowing rate Default (value = 130) / / kg/ha Cultivar parameters PVT, TS, IE, FDF, PS, HI Uploaded locally 1 km / / Validation data Site records planting dates Agricultural stations / Yearly (2010–2018) Doy Winter wheat planting area Winter wheat maps6 30 m Yearly (2016–2020) / Yield Statistical Year Book of China / Yearly (2014–2019) kg/ha 1 https://cds.climate.copernicus.eu/cdsapp#!/dataset/reanalysis-era5-land?tab=overview . 2https://disc.gsfc.nasa.gov/datasets/GLDAS_NOAH025_3H_2.1/summary?keywords=GLDAS . 3https://openlandmap.org/ . 4 For detailed information, please refer to the Supplementary File 1 (Fig. S1). 5https://lpdaac.usgs.gov/products/gfsad1kcmv001 . 6 This dataset is used in the statistical analysis to exclude areas not cultivated with wheat[40]. All environmental data (including weather and soil data) were sourced from GEE. The planting date data was derived using the methods in the Supplementary Information, and the remaining management parameters were assigned default values. Cultivar and validation data were both sourced and uploaded locally. PVT: Physiological Vernalization Time. TS: Thermal Sensitivity. IE: Intrinsic Earliness. FDF: Filling Duration Factor. PS: Photoperiodic Sensitivity. HI: Harvest Index.Table 1.
Research data sources.
-
Site Area (km2) No. of
gridsYear Execution
timeFugou County 1,173 2,430 2014 52 min 2019 1 h 01 min Zhoukou City 11,959 24,739 2014 1 h 11 min 2019 1 h 10 min Henan Province 167,000 389,756 2014 2 h 32 min 2019 2 h 43 min Huanghuai winter wheat
subregion546,788 1,453,450 2014 4 h 55 min 2019 4 h 39 min China's winter wheat region 1,552,522 3,949,554 2014 7 h 12 min 2019 6 h 49 min Table 2.
WG4GEE execution time at different spatial scales.
-
Winter wheat growth stage PDT Sowing to jointing 0−16.1 Jointing to booting 16.1−21.4 Booting to heading 21.4−26.8 Heading to flowering 26.8−31.0 Flowering to grain filling 31.0−39.0 Grain filling to maturity 39.0−6.0 Maturity > 56.0 Table 3.
The correspondence between PDT and growth stages of winter wheat in WG4GEE.
-
Regional wheat growth simulation model Strengths Limitations SIMPLE[19] ● Simple framework with few parameters
● Strong scalability
● Fast simulation speed● Absence of photoperiod and vernalization mechanisms
● Lack of nutrient dynamics mechanismGYMEE[28] ● Built on GEE
● Well-developed factors
● High simulation accuracy and spatial resolution.● Lack of variety-specific parameters
● Incomplete simulation mechanismWG4RASTER[78] ● High parallel computational efficiency
● High regional simulation accuracy
● Strong coupling capabilities● Complex preprocessing procedures
● Dependence on local computational resourcesWG4GEE ● Relatively complete mechanism
● Simple data acquisition process
● Fully cloud-based computation
● High simulation accuracy● Limited by platform-provided data and computational efficiency
● Lacks modules for extreme climate conditionsTable 4.
Comparison of advantages and limitations of regional wheat growth simulation models.
Figures
(7)
Tables
(4)