


-
Understanding food crops' growth, development, and yield formation is essential for maintaining successful agricultural production. Crop growth and development are shaped by a combination of genetic characteristics, environmental conditions, and agronomic practices. These factors are often complex and interact in various ways, while crop growth models help simulate their combined effects on development and yield formation, allowing us to assess how different factors impact crop performance.
The most widely used crop growth models operate at the point scale. Initially developed based on ecological point observations, crop growth models have since been adapted for spatial applications to simulate regional-scale crop development[1,2]. At the regional level, these models are widely employed to analyze spatial variability in crop yields[3], assess crop responses under varying climate conditions[4,5], and support crop varietal design[6,7].
However, to spatialize crop models, a significant amount of spatially heterogeneous input data within the study area is required[8,9]. Typically, this data is acquired through spatial analysis, like interpolating model input data from site observations into regional raster data[10,11]. Hence, these methods can generate regional outcomes without spatially continuous observational data, introducing substantial uncertainties into the model[12]. In order to tackle this issue, crop growth models are frequently integrated with regional observations from satellite remote sensing data[13,14]. Nevertheless, acquiring and processing extensive satellite remote sensing observation data over large areas for regional crop growth simulation demands substantial computational resources[15,16]. As a result, some studies simplify model parameters to streamline computation and mitigate the demand for computational resources[17,18]. However, this method can sacrifice model mechanistic understanding[19] and increase model uncertainty[20].
In recent years, remote sensing big data platforms such as Google Earth Engine (GEE), AI Earth, and PIE Engine have emerged. These platforms offer extensive geospatial datasets, robust computational capabilities, and flexible development environments. They play a critical role in facilitating regional-scale crop growth modeling[21]. GEE is the most popular remote sensing big data platform[22], with powerful raster computational capability, and vast geographic information data that cater to the demands of crop yield research[23,24]. However, current studies primarily rely on modeling approaches that combine GEE's cloud-based data services with localized modeling, using only the remote sensing data provided by GEE, and not fully leveraging its computational capabilities for more complex regional crop growth simulations[25,26]. The absence of a mechanistic model for simulating regional crop growth using satellite remote sensing data has hindered the capacity for yield simulation research on the GEE platform[27,28], which limits relevant research and applications.
This study constructs an efficient regional wheat growth model on the GEE platform, incorporating the core algorithm of the WheatGrow model[29−31]. WG4GEE fully leverages GEE's remote sensing data and computational efficiency, eliminating the need for local data processing or computational resources, and enabling large-scale simulation of regional wheat growth processes. Through rigorous testing and validation in China's winter wheat region, the model provides a new reference framework for combining remote sensing big data platforms with crop growth simulations.
-
The basic framework and core algorithms of WG4GEE are derived from the widely used wheat growth model, WheatGrow[32]. WheatGrow is composed of submodules for stage development and phenology[33], organogenesis and architecture[34], photosynthetic production[35], assimilate partitioning and yield quality[36], and nutrient-water dynamics[37]. The model segments wheat growth stages based on physiological development time (PDT) and simulates daily organ development, biomass accumulation, distribution, and yield formation as growth advances. PDT denotes a time parameter corresponding to the most favorable growth conditions[38], and is defined as the product of the daily relative thermal effect (RTE) and the daily relative photoperiod effectiveness (RPE). Specifically, the daily RTE is calculated as the ratio of wheat growth status under actual temperature conditions to that under optimal temperature conditions within a 24-h cycle. Meanwhile, the daily RPE refers to the ratio of wheat growth performance under real light conditions compared to that under optimal light conditions in a single day[39].
The simulation process also considers the influence of water and nutrient availability. In this study, WG4GEE was constructed by adapting the WheatGrow process simulation algorithm to the computational logic of GEE. The entire process is shown in Fig. 1.
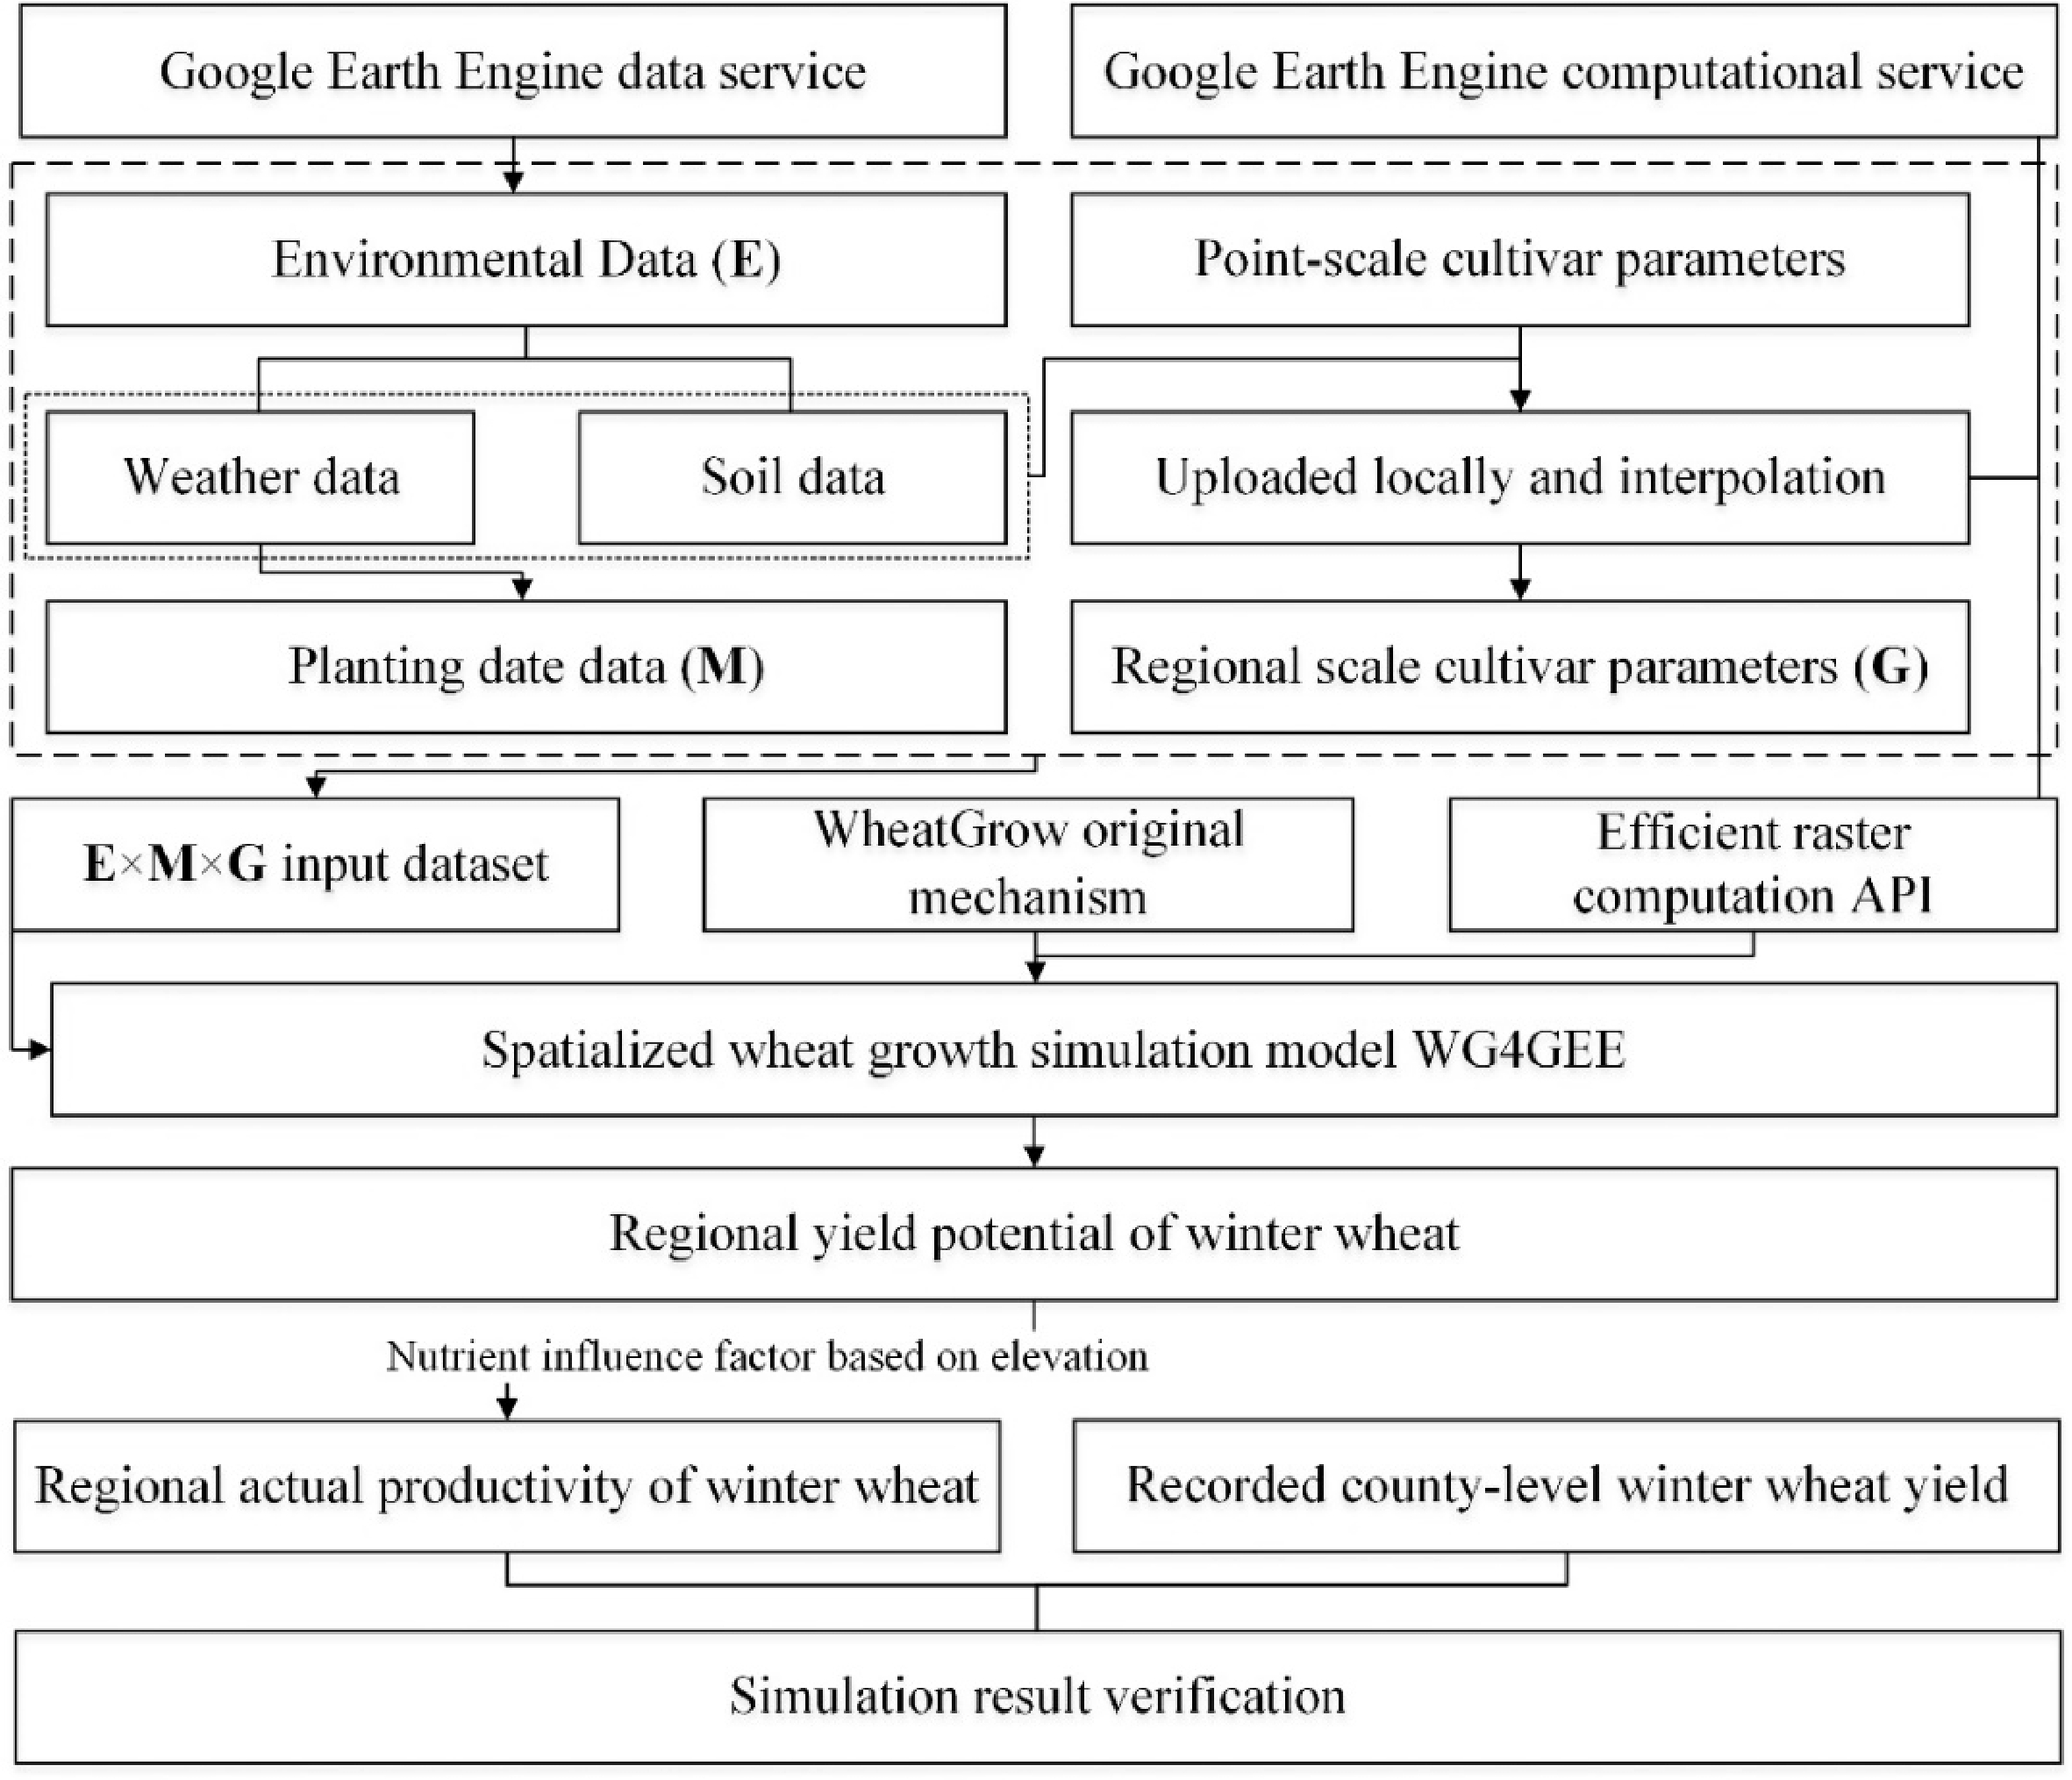
Figure 1.
The construction process of WG4GEE.
Development environment and model calculation mode
-
All computational processes of WG4GEE are implemented using the GEE Python API (
https://developers.google.com/earth-engine/apidocs ), with the primary development environment being the free version of Google Colab. The implementation involves rewriting all the calculation processes and objects from the original wheat growth model into GEE-compatible methods and objects. Furthermore, all the for-loops are optimized using GEE's. map and. iterate functions. These functions are specifically designed for raster-based computations, enabling direct, pixel-by-pixel processing of each image within an image collection.Construction of the WG4GEE input dataset
-
The input data for WG4GEE includes cultivar, environment, and management practice data, while the intermediate variables involved in the simulation include PDT, LAI, and the dynamics of yield changes simulated by the model. Cultivar parameters required for the model included physiological vernalization time (PVT), intrinsic earliness (IE), thermal sensitivity (TS), photoperiodic sensitivity (PS), filling duration factor (FDF), and harvest index (HI). All cultivar parameters were determined through WheatGrow's trial-and-error parameterization method, based on field experiments, and were then uploaded to GEE. GEE provided meteorological and soil data. However, two key inconsistencies existed between this data and the input requirements of the WheatGrow model, which necessitated targeted preprocessing. The first was discrepancies in variable units, and the second was the unavailability of field-specific variables at a large spatial scale (Table 1). Management measures were set by default, except for the planting date, which was generated by the dual-window planting simulation method proposed by this institute (Supplementary File 1: Fig. S1).
Table 1. Research data sources.
Data type Data description Datasets/data sources Spatial resolution Temporal resolution Unit Weather data Tmax ERA5-Land Hourly1 0.1° Hourly K Tmin K Tmean K Solar radiation J/m2 Soil data Soil moisture GLDAS2 0.25° Every 3 h kg/m2 Clay content OpenLandMap3 250 m / % Sand content % Organic carbon content *5 g/kg Soil bulk density kg/m3 Management data Planting dates Dual-window model4 1 km Yearly Doy Irrigation map GFSAD1005 1 km / / Sowing depth Default (value = 2.5) / / cm Sowing rate Default (value = 130) / / kg/ha Cultivar parameters PVT, TS, IE, FDF, PS, HI Uploaded locally 1 km / / Validation data Site records planting dates Agricultural stations / Yearly (2010–2018) Doy Winter wheat planting area Winter wheat maps6 30 m Yearly (2016–2020) / Yield Statistical Year Book of China / Yearly (2014–2019) kg/ha 1 https://cds.climate.copernicus.eu/cdsapp#!/dataset/reanalysis-era5-land?tab=overview . 2https://disc.gsfc.nasa.gov/datasets/GLDAS_NOAH025_3H_2.1/summary?keywords=GLDAS . 3https://openlandmap.org/ . 4 For detailed information, please refer to the Supplementary File 1 (Fig. S1). 5https://lpdaac.usgs.gov/products/gfsad1kcmv001 . 6 This dataset is used in the statistical analysis to exclude areas not cultivated with wheat[40]. All environmental data (including weather and soil data) were sourced from GEE. The planting date data was derived using the methods in the Supplementary Information, and the remaining management parameters were assigned default values. Cultivar and validation data were both sourced and uploaded locally. PVT: Physiological Vernalization Time. TS: Thermal Sensitivity. IE: Intrinsic Earliness. FDF: Filling Duration Factor. PS: Photoperiodic Sensitivity. HI: Harvest Index.Weather data
-
Solar radiation and temperature serve as basic input data for WG4GEE. The solar radiation and temperature data used in this study were extracted from ERA5-Land Hourly[41], which has shown high accuracy across various regions of China[42], and is suitable for crop physiological modeling[43]. However, the solar radiation data provided by ERA5 is downward shortwave radiation, which needs to be converted to photosynthetically active radiation (PAR) for crop growth. It has been demonstrated that PAR is proportional to total radiation[44]. The scaling factor ranges from 0.47 to 0.52 under clear weather, and 0.5 to 0.58 under cloudy weather[45]. To balance the influence of different weather conditions, the scaling factor was set to 0.52 in this study.
Soil data
-
The OpenLandMap dataset was used in this study, providing data on soil sand and clay content, organic carbon, and soil bulk density. Soil wilt coefficient and field water holding capacity were calculated from this data based on formulas from Saxton & Rawls[46]. Soil moisture, essential for regulating water and energy exchange in the soil-plant-atmosphere continuum[47], was obtained from the Global Land Data Assimilation System (GLDAS-2.1). The GLDAS dataset offers three-hourly soil moisture data at four standardized depths, meeting the input requirements for crop growth models. Previous research has successfully incorporated GLDAS data into crop growth models[48,49], and this data also performed well in the Chinese mainland[50]. As the GLDAS soil moisture is given in kg/m2, and WG4GEE requires m3/m3, the data was converted accordingly.
Management data
-
Management data includes seeding biomass, seeding depth, planting date, and irrigation practices. For large-area simulation, default parameters for seeding biomass and seeding depth can be employed (Table 1). However, planting dates exhibit high variability across spatial and temporal scales, and obtaining precise, comprehensive data on planting dates is challenging[51]. As a default solution to facilitate the application of WG4GEE, this study proposes a temperature-based rule of the suitable planting date for winter wheat within a dual-window framework, thereby generating input parameters for the planting date ((Supplementary File 1: Figs S2, S3).
Furthermore, as it is challenging to synchronize field irrigation measures with GLDAS data, the simulation process necessitates the incorporation of irrigation, based on the GFSAD1000 irrigation map[52]. This map was verified to be within the study area[53]. The prescribed irrigation measures in irrigated areas are set as follows: (1) Irrigation is applied from the sowing to the booting stage of winter wheat when soil moisture falls below 80% of the field water holding capacity. During the overwintering period, soil moisture must not drop below 65% of the field water holding capacity. (2) During the booting to filling stage, irrigation is applied when soil moisture drops below 90% of the field water holding capacity, with irrigation restoring moisture to this level. Please note that these irrigation measures represent the simulation scenario in this study and may not reflect actual irrigation practices in real-world agricultural production.
Model validation and evaluation
Case study area and data
-
This study used China's winter wheat region as a case study area (Fig. 2), comprising four subregions with distinct variations in natural conditions: Northern winter wheat subregion (NS), Huang-Huai winter wheat subregion (HHS), the Southwestern winter wheat subregion (SWS), and the Middle-lower Yangtze River winter wheat subregion (MYS). The study utilized 129 stations distributed in the winter wheat regions, recording winter wheat planting dates from 2010 to 2018. These recorded dates were used to validate the dual-window planting simulation method proposed in this study. In addition, we masked the study area's gridded yield simulation data with the winter wheat cultivation map[40] to exclude non-winter wheat areas prior to the final statistical analysis. The accuracy of the model's final simulated yields was then validated against recorded county-level winter wheat yields from the China Statistical Yearbook (2014–2019).
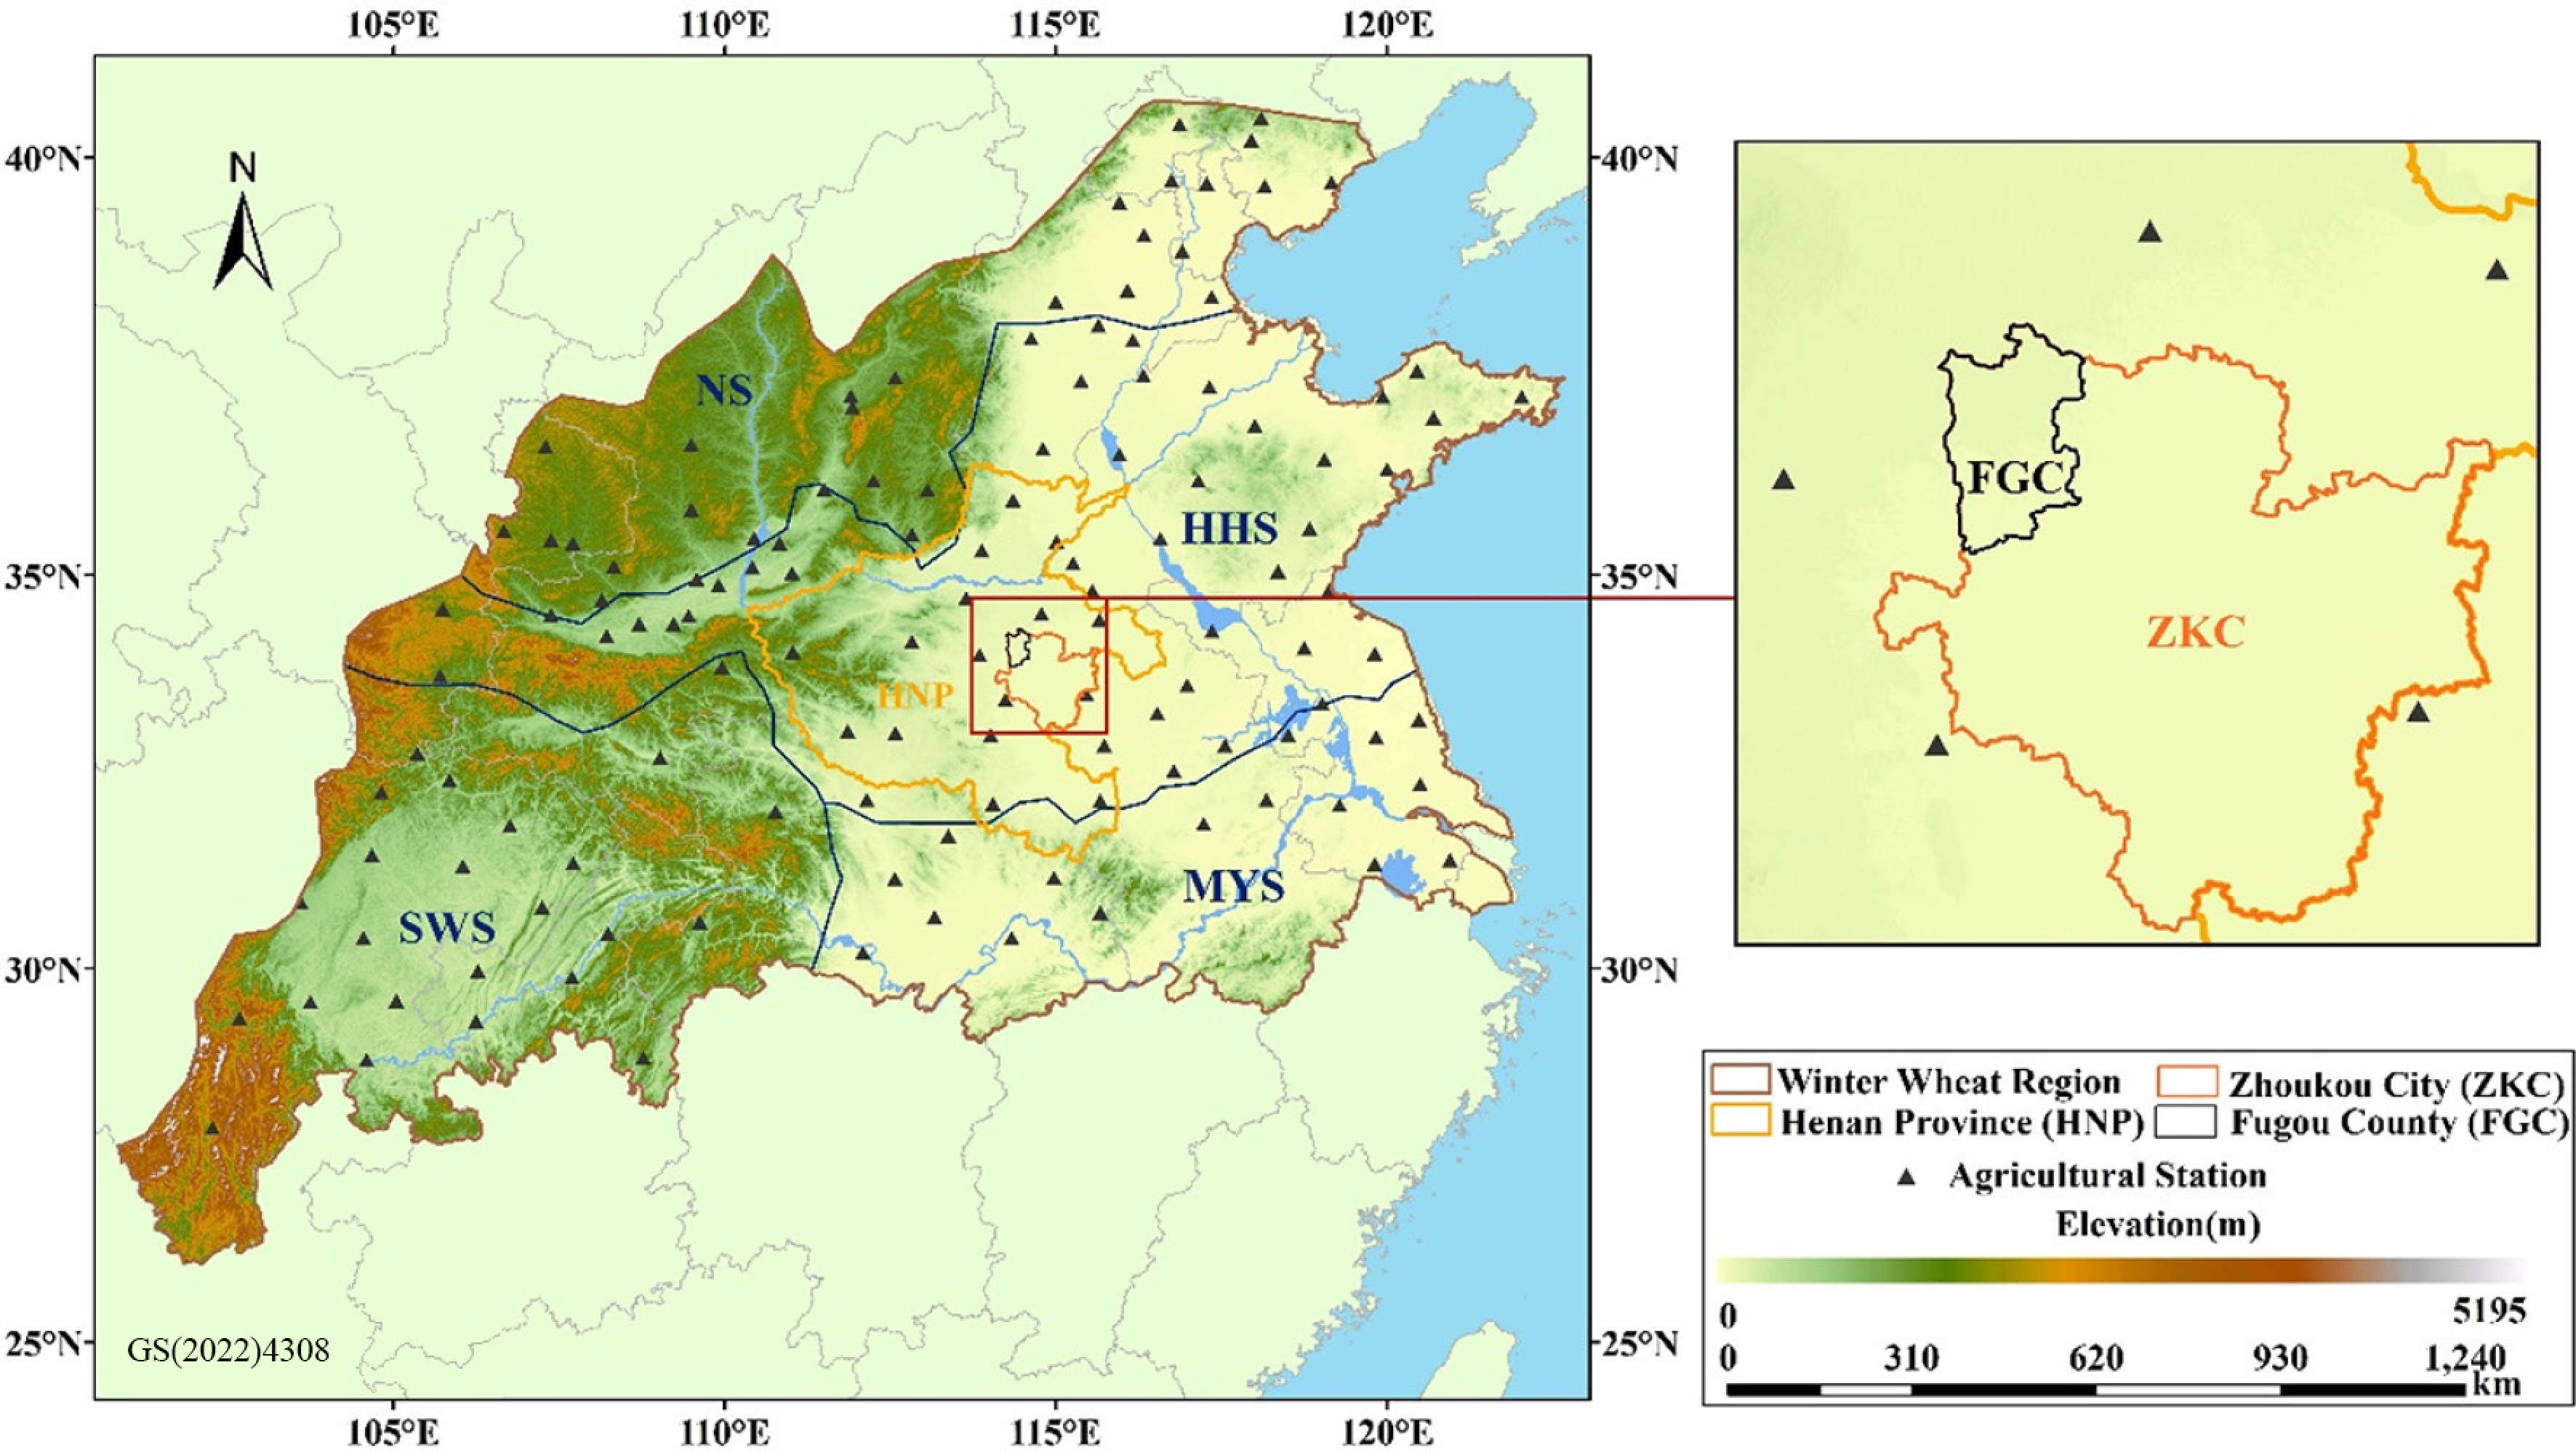
Figure 2.
Location of China's winter wheat region and agricultural stations. Base map: Standard Map of China (2022 edition), review No. GS(2022)4308.
Performance evaluation
-
The performance of WG4GEE was assessed using two indicators: simulation efficiency and accuracy. Simulation efficiency was evaluated by determining the runtime for the 1 km spatial resolution simulation results across five regions of varying sizes: 1,173, 11,959, 167,000, 546,788, and 1,552,522 km2 (Table 2). The study employs a suite of accuracy metrics, including the Normalized Root Mean Square Error (NRMSE), Mean Absolute Error (MAE), and the Coefficient of Determination (R2), to evaluate the simulation accuracy.
Table 2. WG4GEE execution time at different spatial scales.
Site Area (km2) No. of
gridsYear Execution
timeFugou County 1,173 2,430 2014 52 min 2019 1 h 01 min Zhoukou City 11,959 24,739 2014 1 h 11 min 2019 1 h 10 min Henan Province 167,000 389,756 2014 2 h 32 min 2019 2 h 43 min Huanghuai winter wheat
subregion546,788 1,453,450 2014 4 h 55 min 2019 4 h 39 min China's winter wheat region 1,552,522 3,949,554 2014 7 h 12 min 2019 6 h 49 min -
The execution times for simulating the winter wheat growth process in 2014 and 2019 at five different spatial scales, all with a 1 km spatial resolution, are shown in Table 2. At the county scale, which consists of approximately 2,500 grids, WG4GEE completed the simulation in about 1 h. When the number of grids increased by a factor of ten at the city scale, the simulation time remained roughly 1 h 10 min. This suggests that when the WG4GEE algorithm runs with fewer grids; the time consumption is not due to the algorithm, but may be due to the transmission of computational requests that take up more time. However, execution time has a power-law increase as the number of simulation grids expands (Fig. 3). The exponent lies between 0 and 1, indicating that WG4GEE possesses a computational efficiency advantage for large-area simulation.
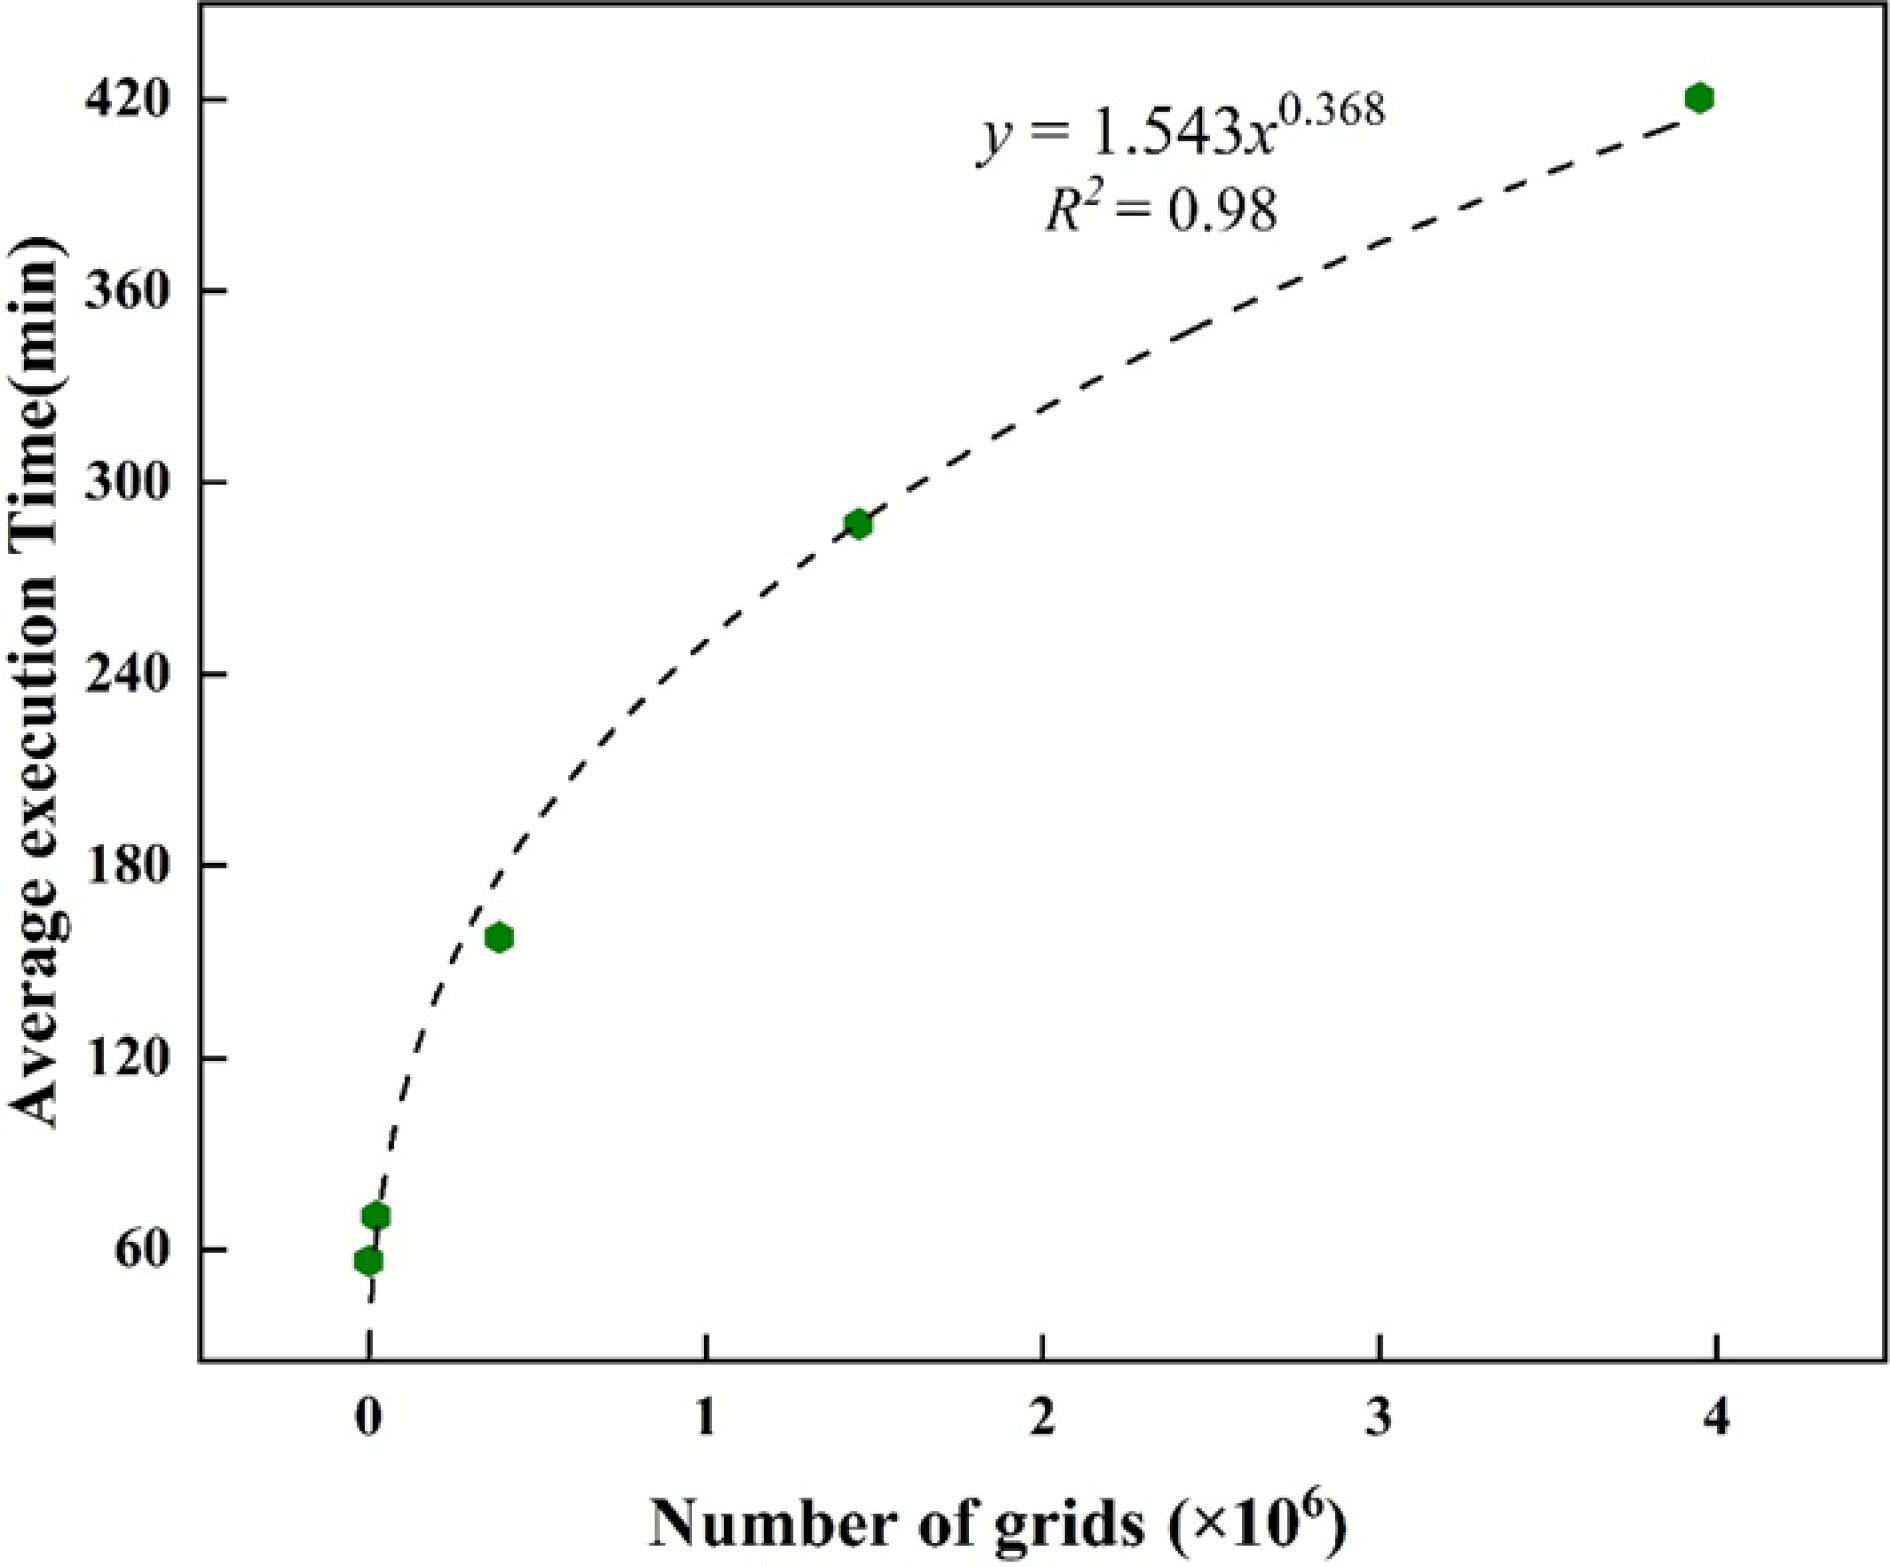
Figure 3.
WG4GEE execution time with different grid numbers.
Dynamic simulation based on WG4GEE
-
WG4GEE is a process-based model that simulates the fertility period of winter wheat through PDT delineation (Table 3)[54]. The dynamics of PDT varied across different scales and times (Fig. 4a). The booting phase began between March 4th and 24th, the grain filling phase spanned from May 3rd to 23rd, and the maturity phase occurred around June 12th.
Table 3. The correspondence between PDT and growth stages of winter wheat in WG4GEE.
Winter wheat growth stage PDT Sowing to jointing 0−16.1 Jointing to booting 16.1−21.4 Booting to heading 21.4−26.8 Heading to flowering 26.8−31.0 Flowering to grain filling 31.0−39.0 Grain filling to maturity 39.0−6.0 Maturity > 56.0 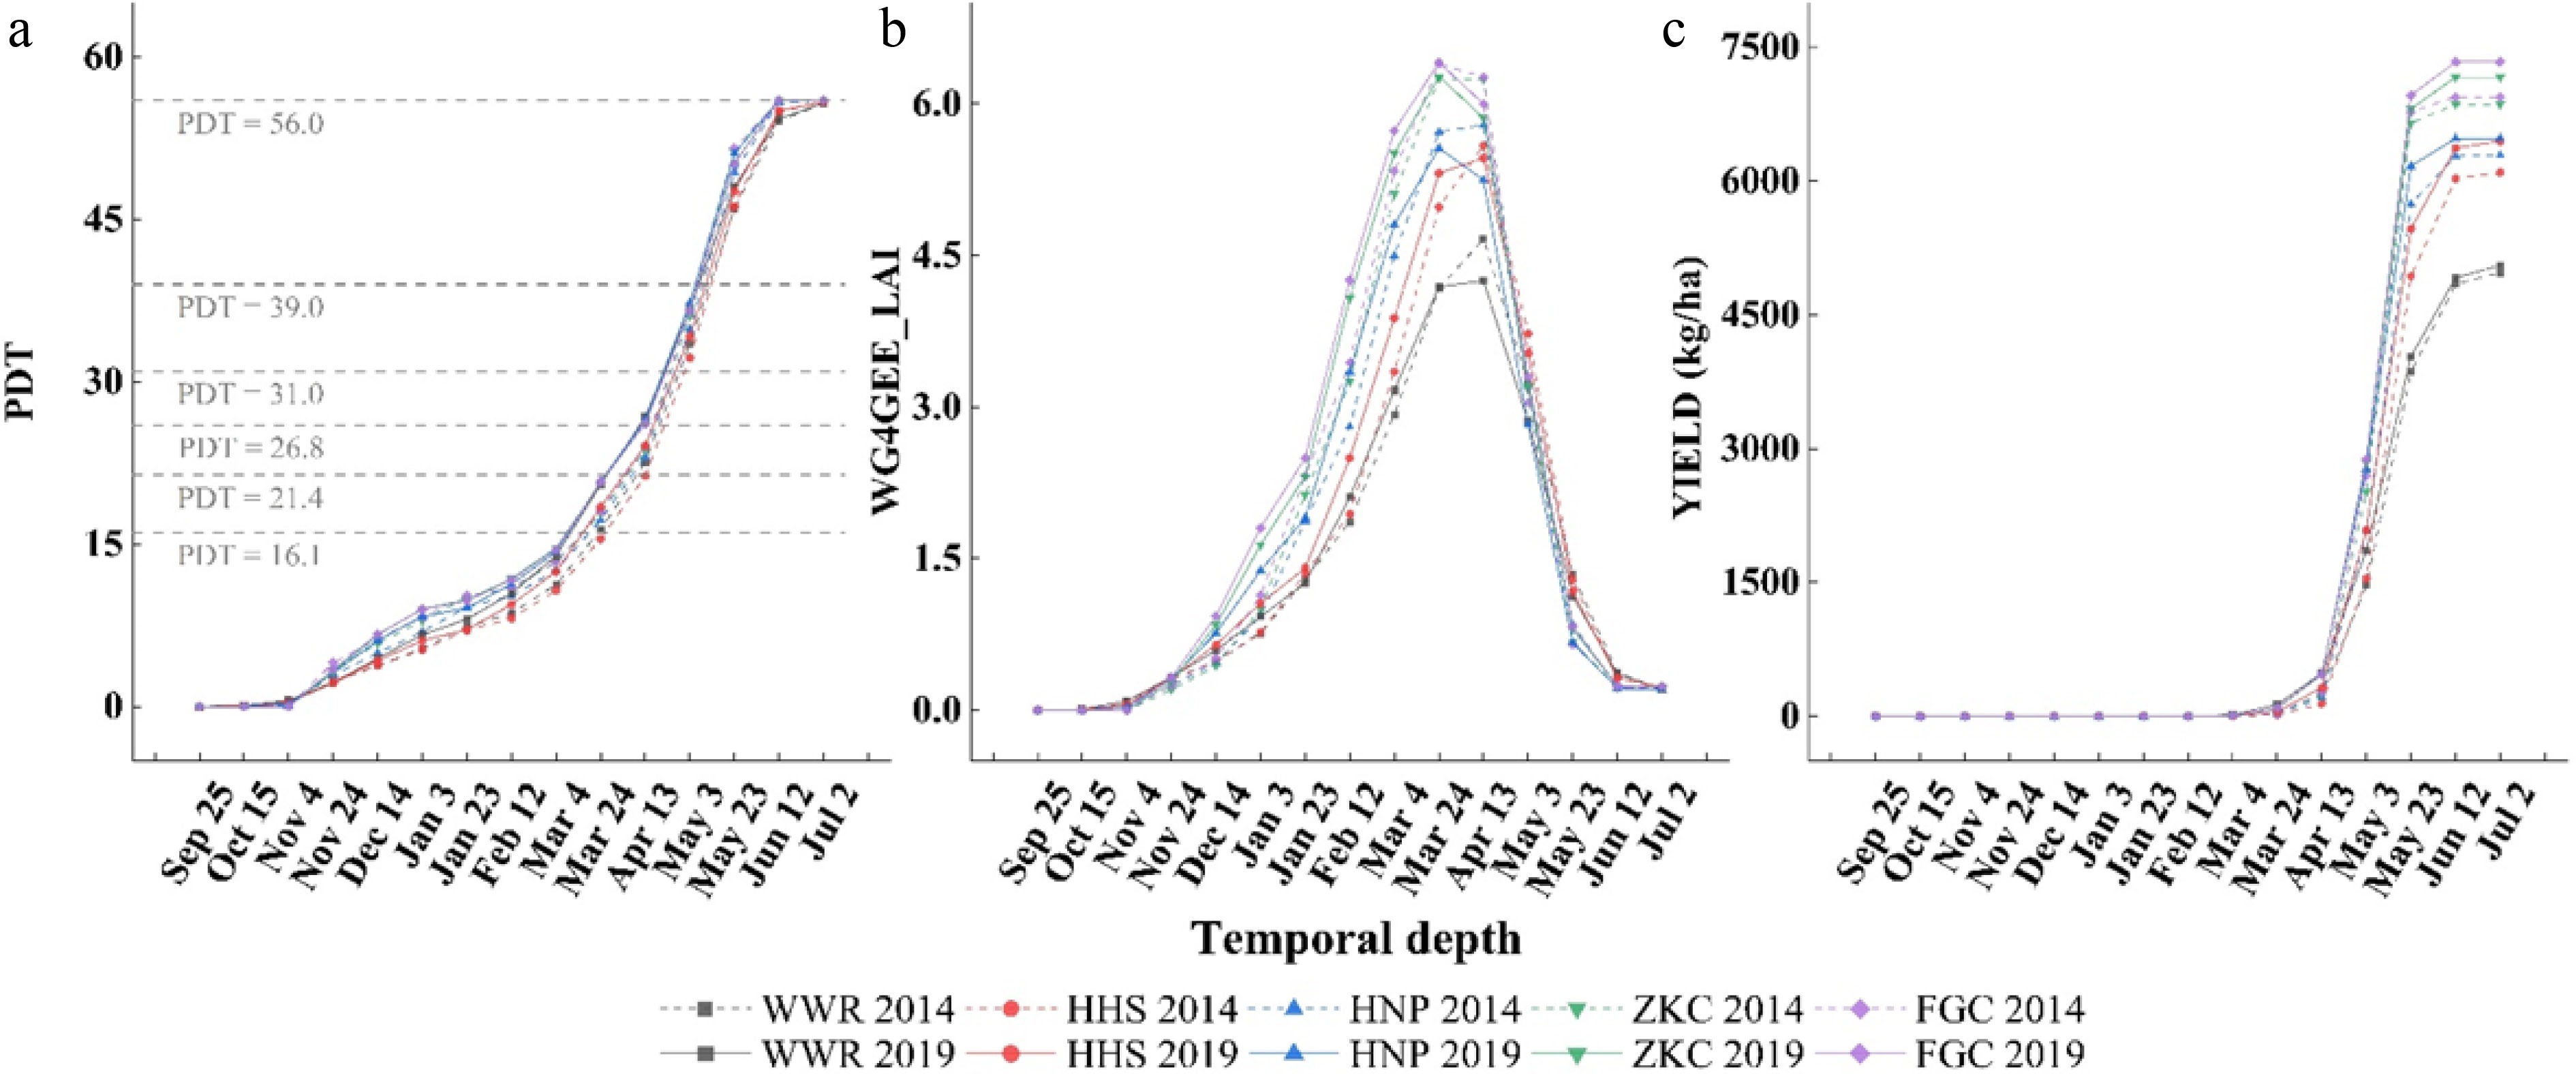
Figure 4.
Dynamic simulation of winter wheat growth based on WG4GEE. (a)−(c) respectively demonstrate the simulated PDT, LAI, and yield based on WG4GEE. WWR: China's winter wheat region. HHS: Huanghuai winter wheat subregion. HNP: Henan Province. ZKC: Zhoukou City. FGC: Fugou County.
LAI reflects the development and growth of wheat. According to the WG4GEE simulation (Fig. 4b), the peak of the LAI sequence appeared between March 24th and April 13th. The maximum LAI of winter wheat occurred during the heading and tassel stages[55], which corresponded to a PDT value of approximately 26.8 (around April 13th, Fig. 4a). This alignment suggests that the LAI values simulated by WG4GEE correspond well with the fertility period.
The yield dynamics of winter wheat highlight yield formation during different fertility periods. The heading stage, which occurs around April 13th (Fig. 4a), is a critical point in the growth process. During this stage, the number and quality of tillers are crucial in yield formation, leading to exponential growth (Fig. 4c).
Simulation of regional winter wheat yield based on WG4GEE
-
A simulated winter wheat yield at 1 km resolution in 2019 was produced using WG4GEE (Fig. 5a−e). The concentrated high-production areas were identified in Hebei, Shandong, Henan, and northern Anhui (Fig. 5e), aligning with the realistic trend of winter wheat yield distribution (Fig. 5f). Simulated yield results of winter wheat areas from 2014 to 2019 were selected for accuracy verification (Fig. 6). The simulation results for consecutive years had an average R2 of 0.62, an average NRMSE of 15.57%, and an average MAE of 884.10 kg/ha. These findings illustrate a comprehensive and stable performance, indicating the overall effectiveness of the model.
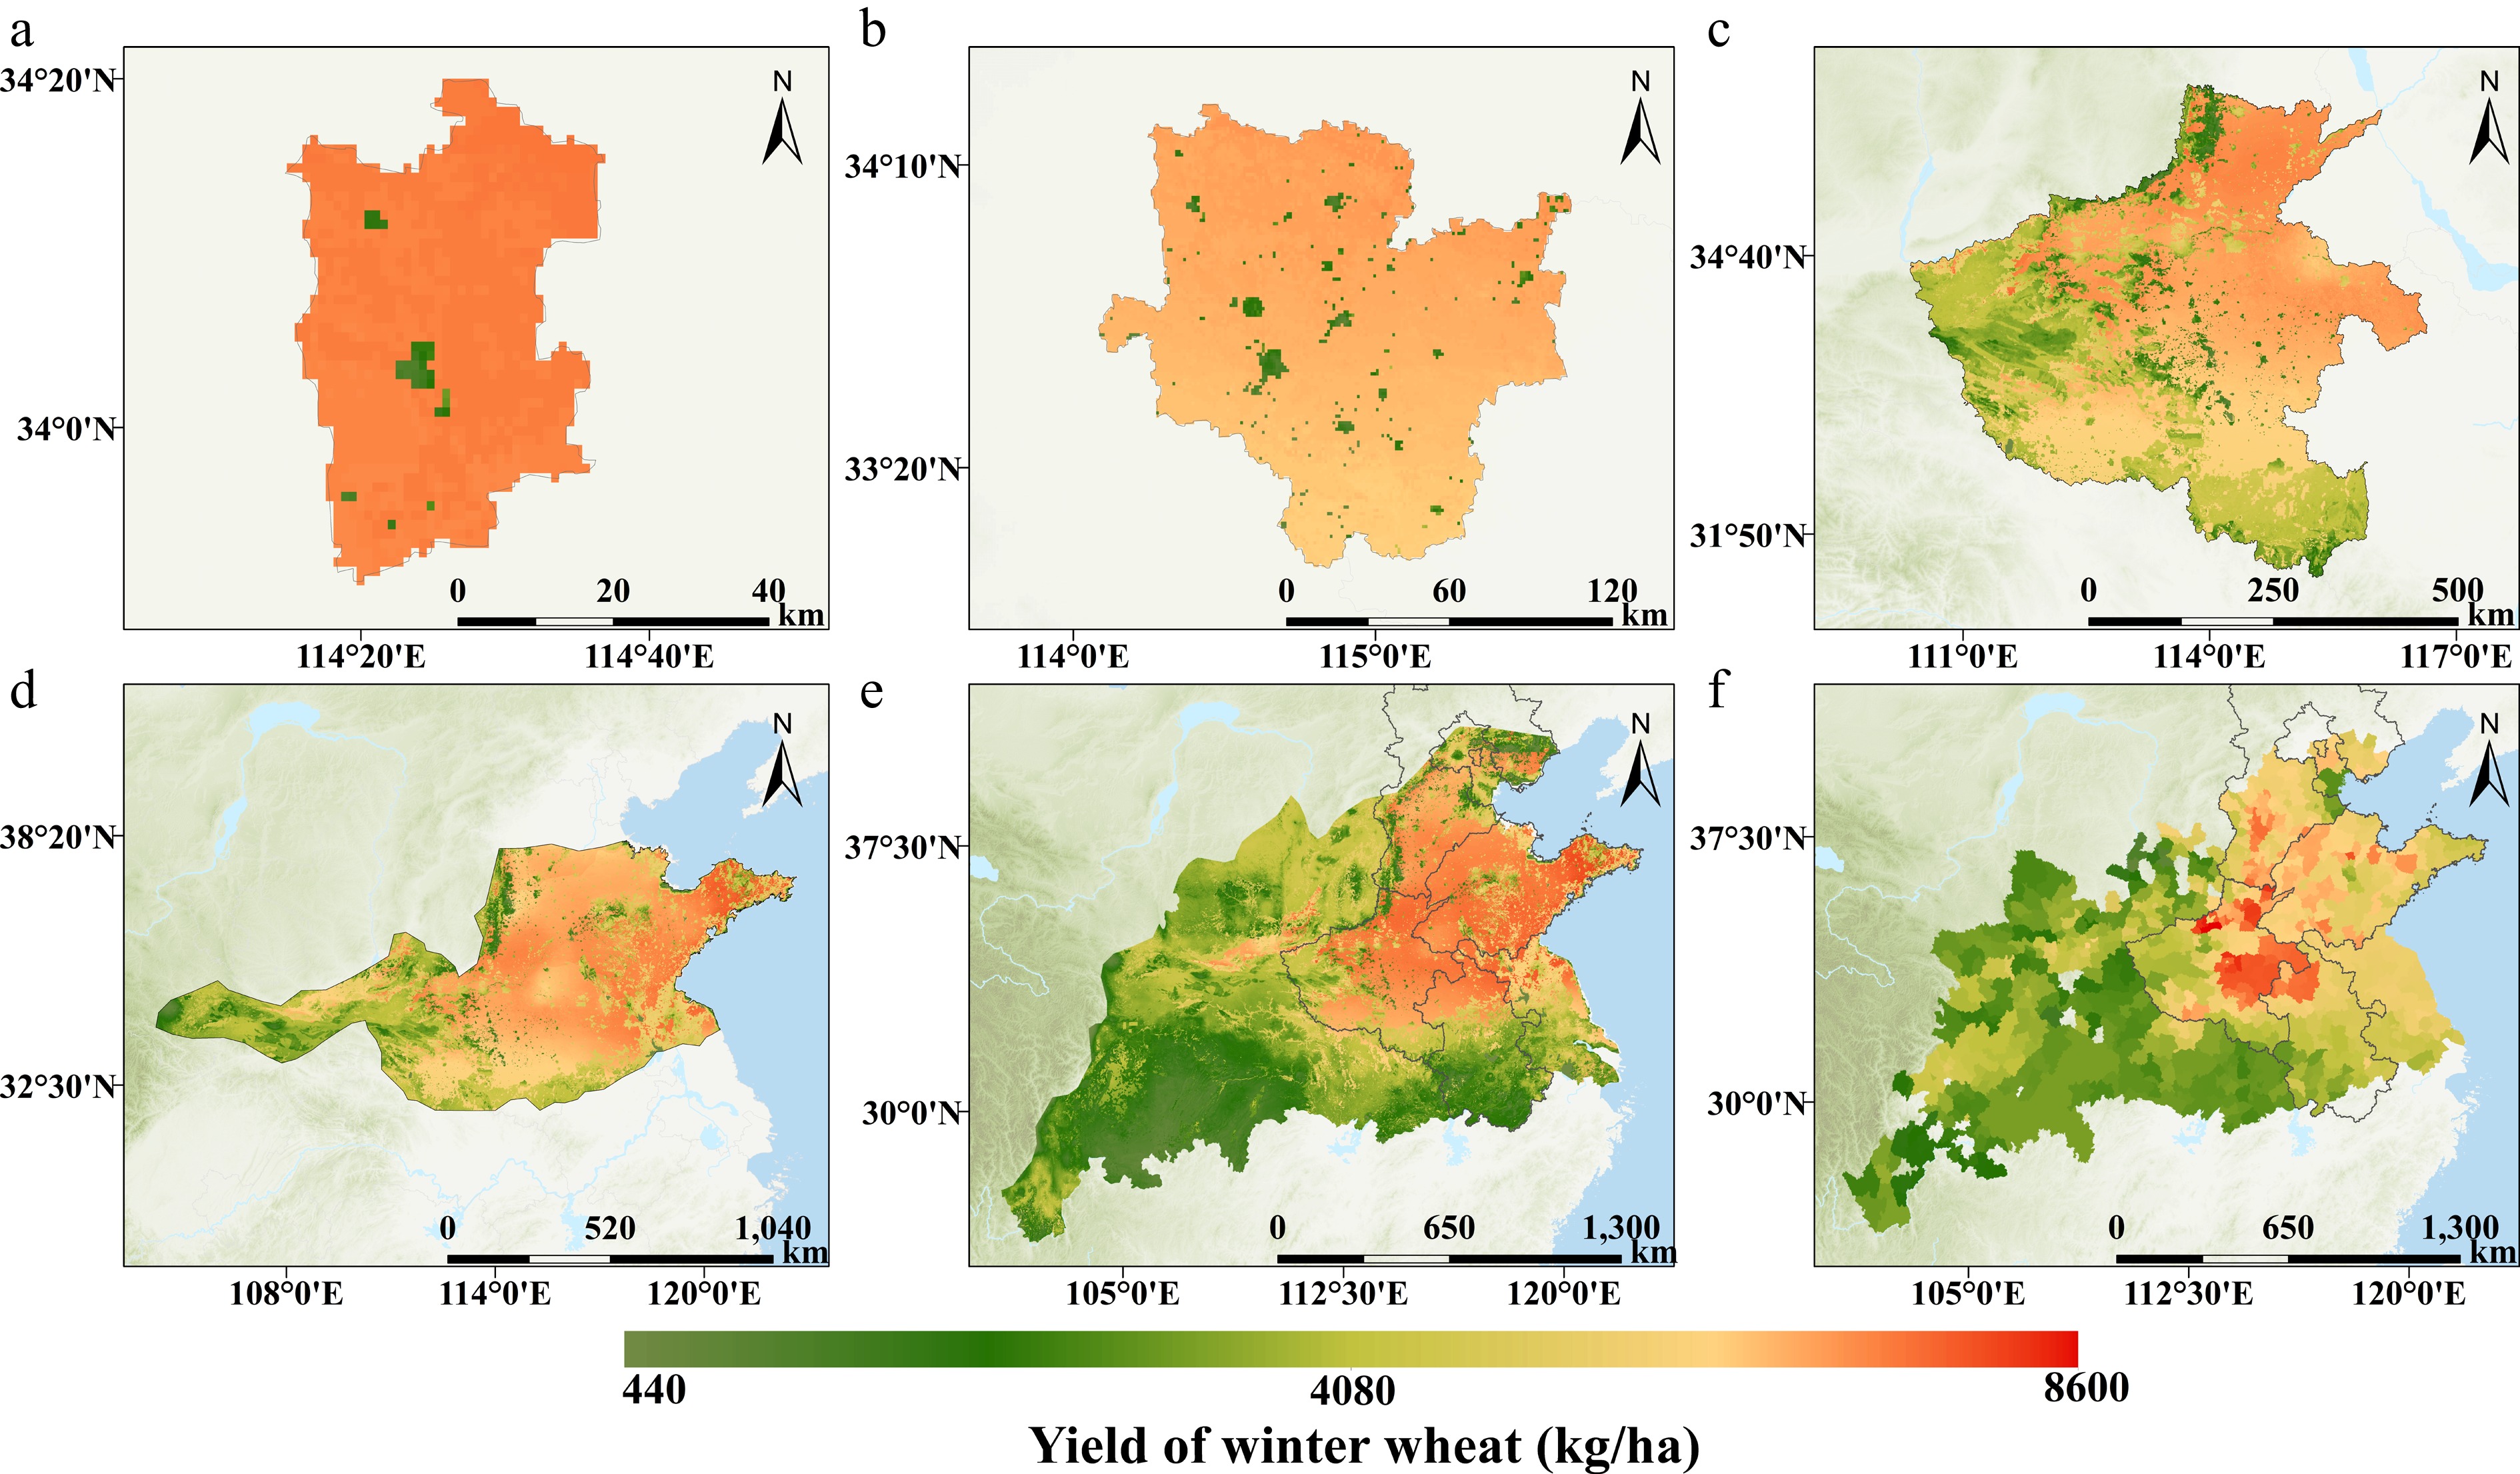
Figure 5.
Distribution of winter wheat yields at different regional scales. (a)−(e) Simulation results based on WG4GEE at different spatial scales. (a) Fugou County. (b) Zhoukou City. (c) Henan Province. (d) Huanghuai winter wheat subregion. (e) Winter wheat region. (f) Statistical production of counties within the winter wheat region. Base map: Standard Map of China (2022 edition), review No. GS(2022)4308.
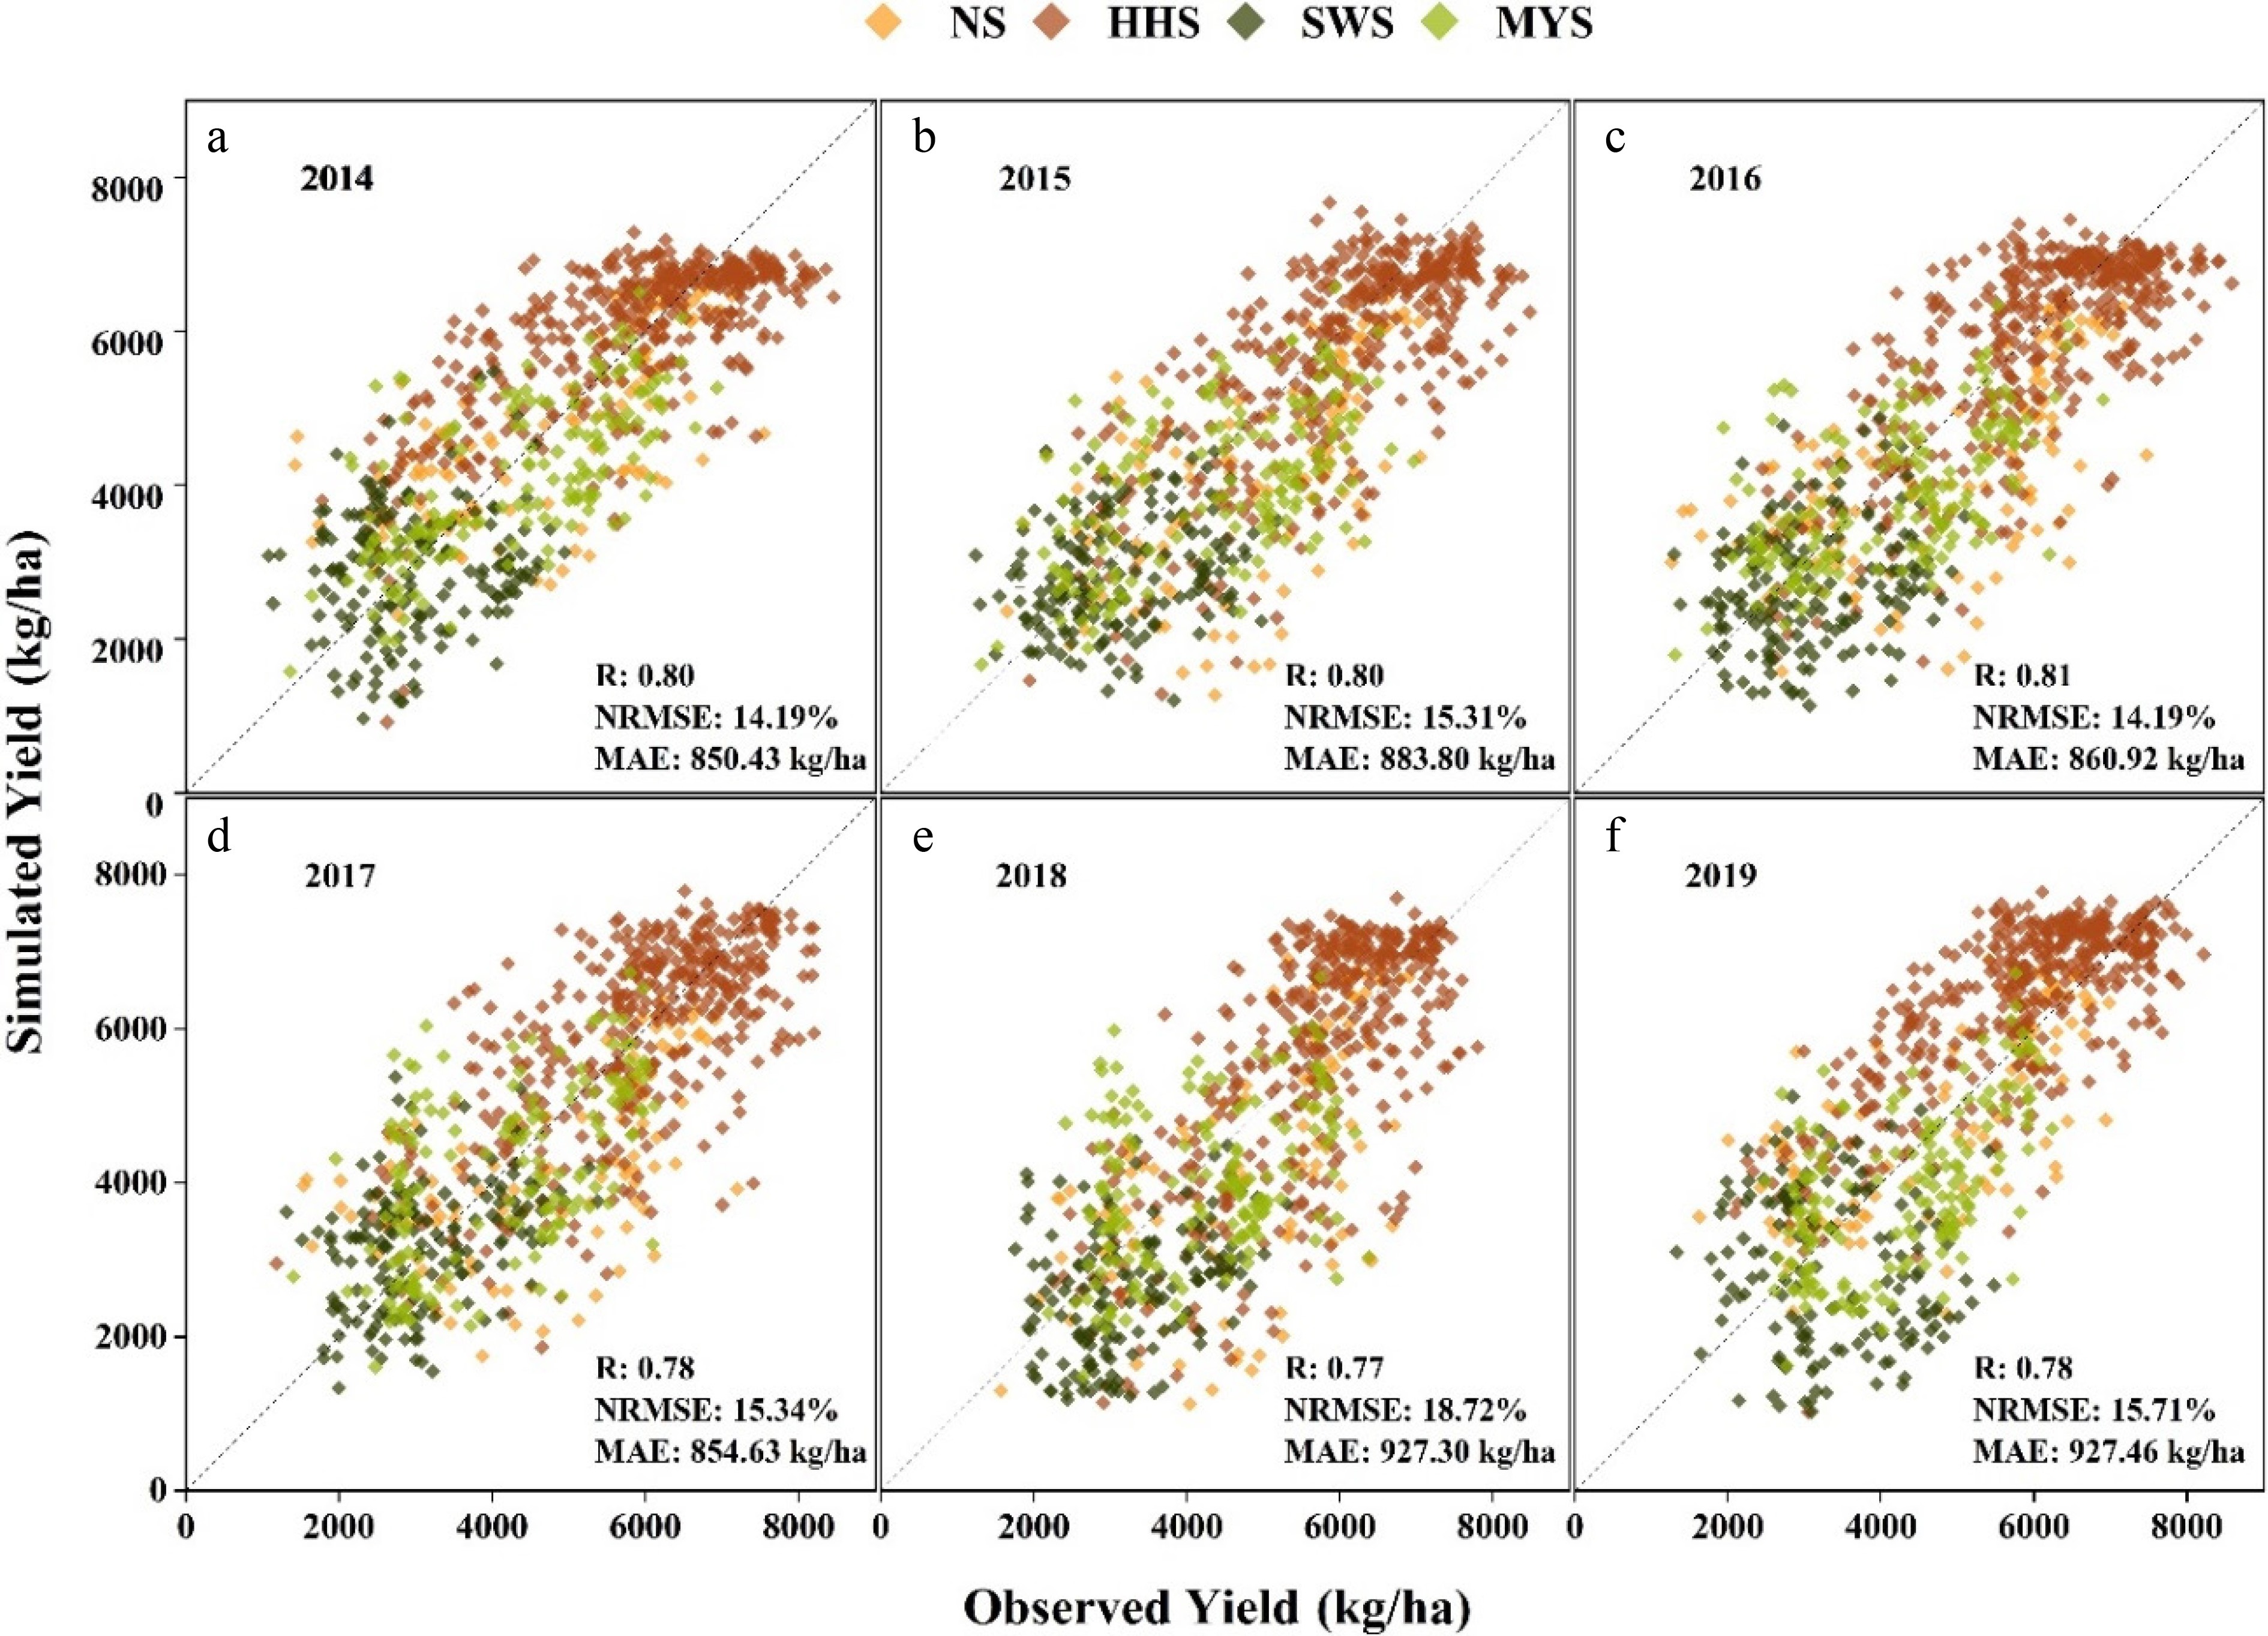
Figure 6.
Observed winter wheat yield versus simulated yield by WG4GEE. NS: Northern winter wheat subregion, HHS: Huanghuai winter wheat subregion, SWS: Southwestern winter wheat subregion, MYS: Middle-lower Yangtze River winter wheat subregion.
Furthermore, it was concluded that the model does not demonstrate significant systematic errors, as evidenced by the moderate MAE of the multi-year simulation results across each county (Fig. 7). Meanwhile, the counties experiencing the most significant errors in the northeastern segment of the winter wheat region are predominantly located in areas of high elevation, or with considerable topographic variation. The meteorological data used in this study had a spatial resolution of 0.1°, while the moisture input data had a resolution of 0.25°. The coarser resolution of the moisture input data diminished the characteristics of terrain changes, causing the input data to converge in areas of rapid topographic variability. This convergence resulted in a certain degree of error.
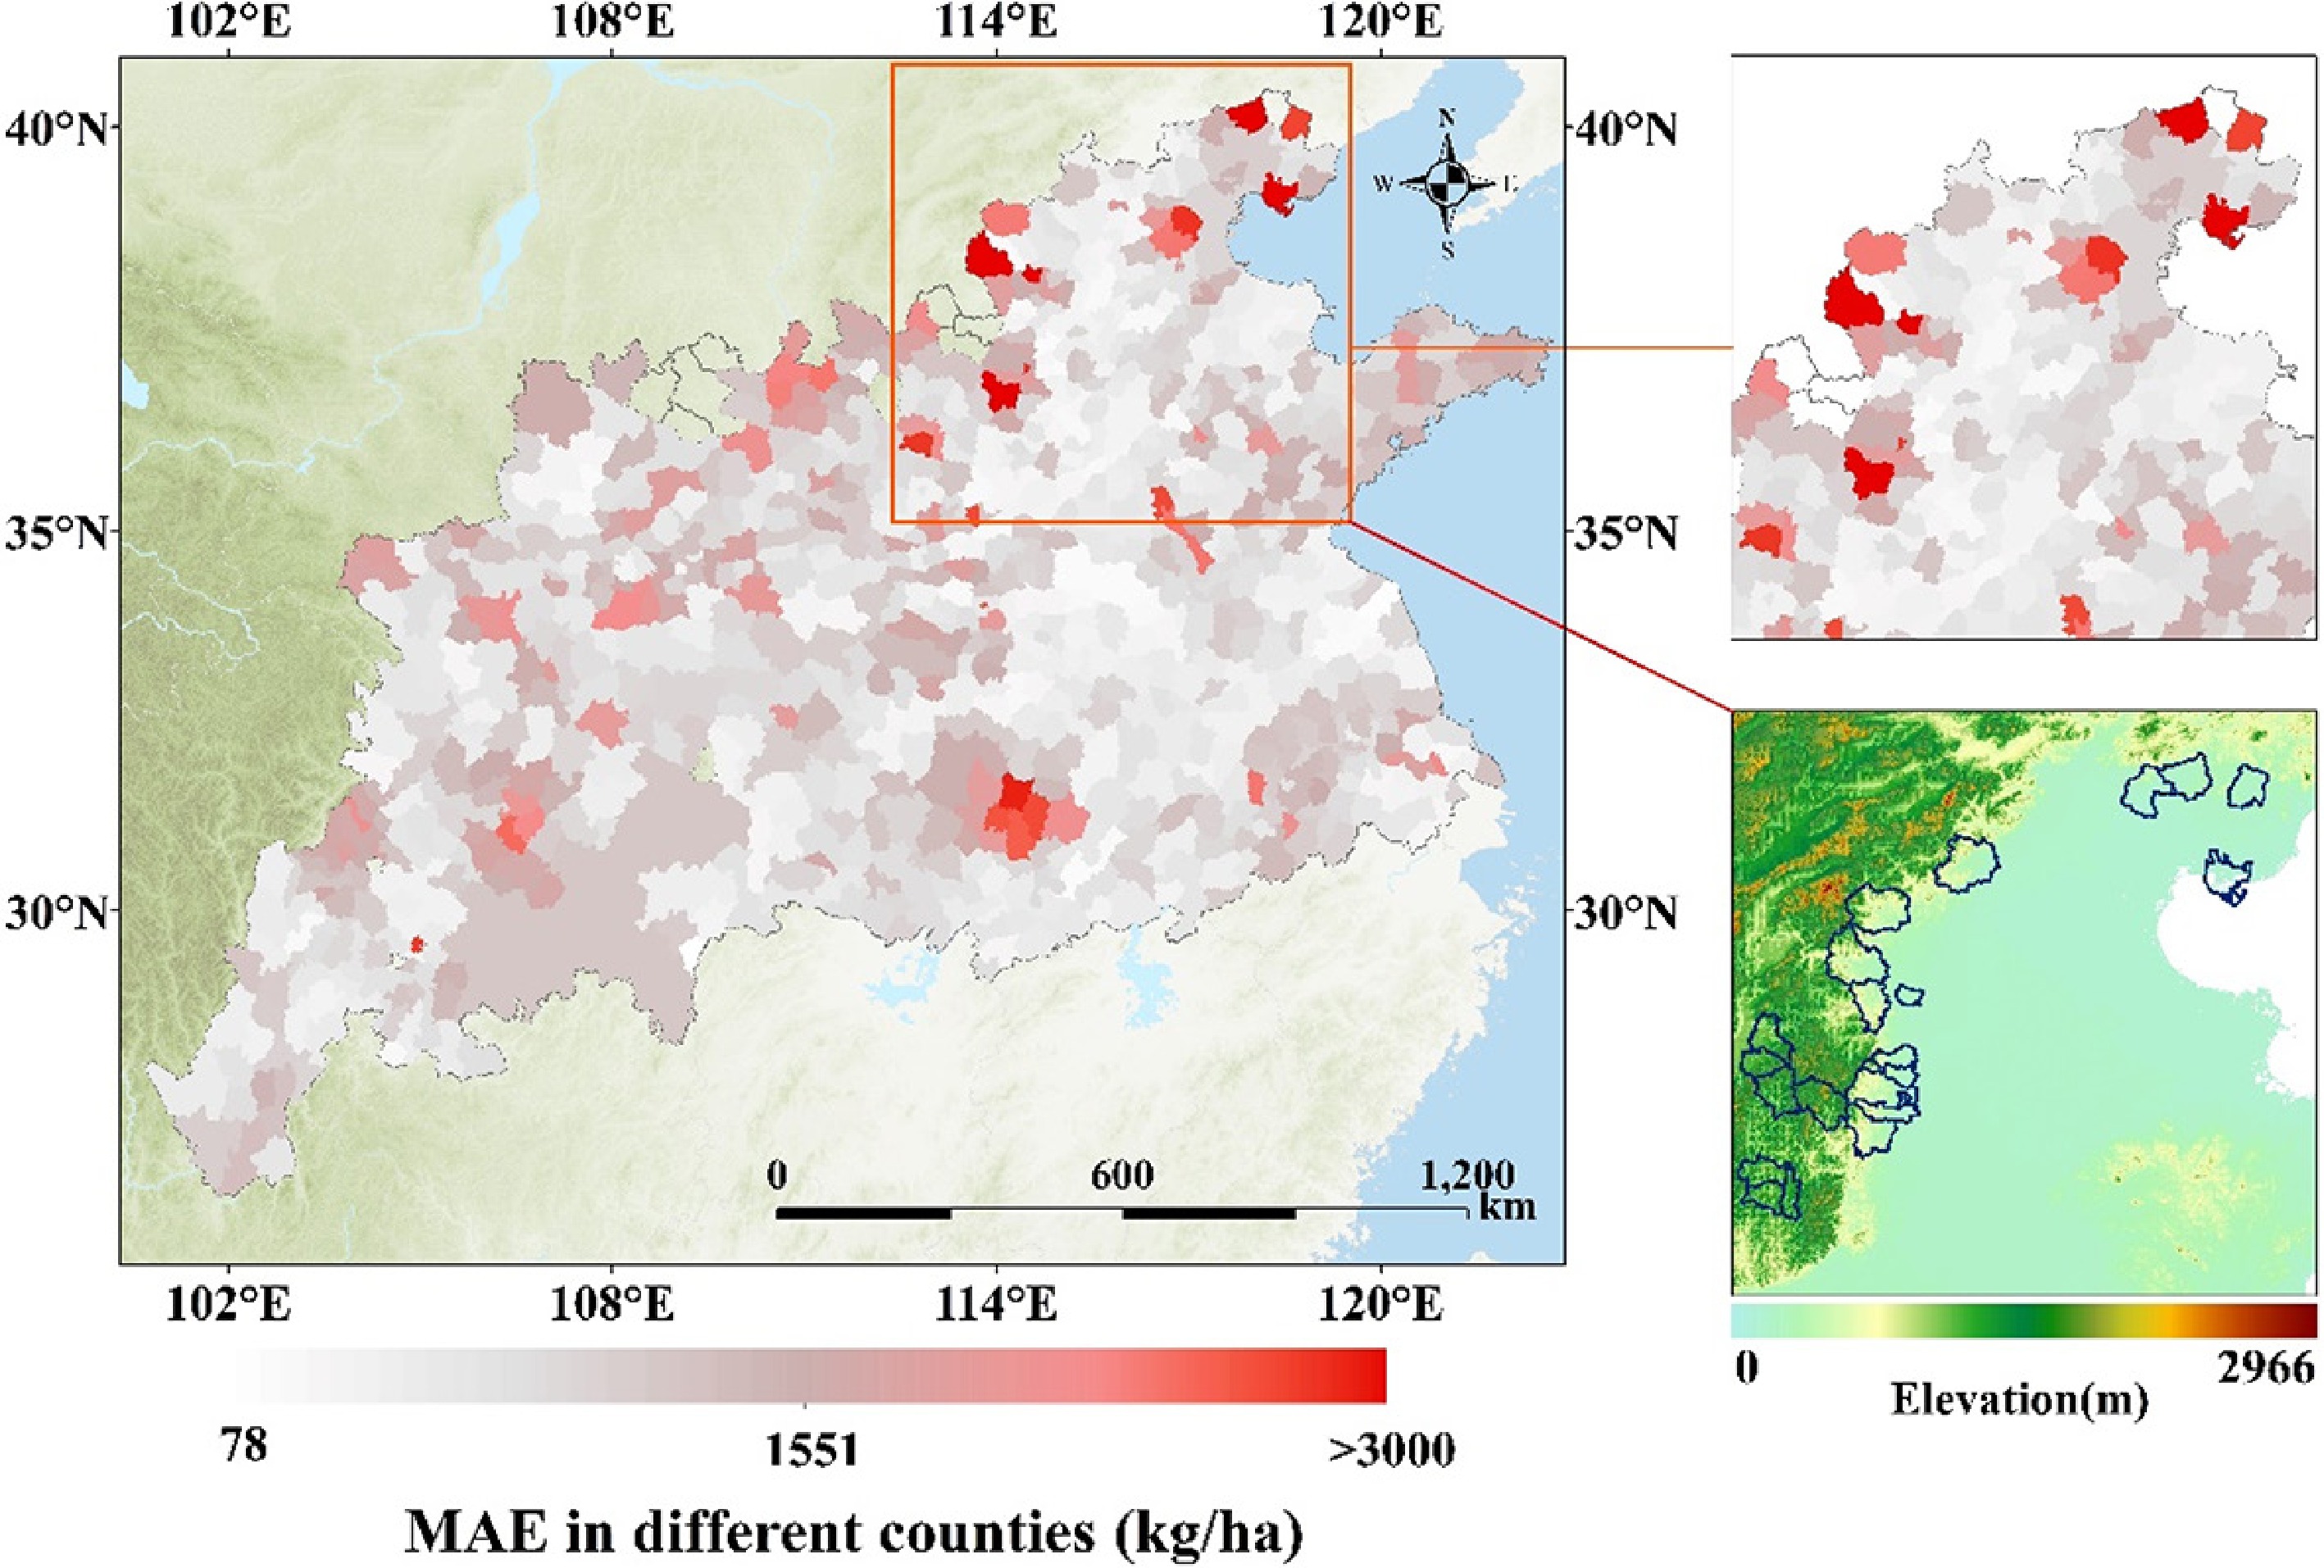
Figure 7.
Distribution of MAE across different counties in the study area. Base map: Standard Map of China (2022 edition), review no. GS(2022)4308.
-
Crop growth models are essential tools for quantifying growth processes and simulating crop yields. Their operation requires numerous spatiotemporal data, including crop characteristics, management practices, soil properties, and daily weather variables[56]. However, obtaining continuous high-quality, day-by-day weather data, along with regional soil and management information, is often a significant challenge[57]. This data gap limits the effective regional application of crop models[58,59].
GEE efficiently stores and processes vast amounts of remote sensing data, enabling seamless integration of these observations with crop process simulations to support efficient and large-scale crop yield estimations[24]. However, existing studies often treat these two components (data and process simulations) separately. For instance, some acquire data solely through GEE to conduct research using standalone crop growth models[60], while others develop statistical yield prediction models based on crop growth model simulations integrated with remotely sensed data from GEE platforms[61,62]. There is no precedent for crop growth model construction based directly on GEE.
WG4GEE is a wheat growth simulation model entirely built on the GEE API, where all spatial input data is provided directly by GEE and simulated online, streamlining the data acquisition and simulation process, and allowing for easy substitution of input data with various available sources on the platform. Since crop growth simulations over large areas are time consuming[63], previous studies often required additional development to reduce the time for spatialized crop model simulations using parallel computing[64]. The WG4GEE constructed in this study leverages the inherently parallel computing capabilities of API embedded in GEE[23], enabling faster crop growth simulations at a 1 km spatial resolution (Table 2), thus lowering the threshold for research using crop models.
Limitations of WG4GEE
-
Given the substantial spatial heterogeneity of environmental conditions and agronomic practices, simulation accuracy can be influenced by the availability and quality of input data[65,66]. WG4GEE diminished performance in regions of rapid topographic change. The significant spatial heterogeneity of environmental elements in these regions hinder coarse resolution weather and soil data products from adequately capturing the spatial intricacies of such environments, consequently escalating the uncertainty of model simulations (Fig. 7)[51, 67].
Additionally, the solar radiation data used in this study is sourced from ERA5-Land Hourly, which has a 10−15 d lag compared to real-time observations. This delay limits the predictive capability and applicability of the crop growth model for regional simulations. To address this challenge, integrating predictive meteorological data into the GEE platform or coupling the model with future climate scenario simulation tools could be beneficial[68]. Furthermore, to enhance the model's mid-season predictive performance, incorporating machine learning models for targeted simulation during critical crop growth stages could provide valuable improvements[69].
The accuracy of crop growth models largely relies on the precise parameterization of agricultural management practices[70]. The inability to obtain accurate management data at the regional scale is a primary constraint on applying WG4GEE simulations. Planting date is a key management input that affects crop growth and yield[71], making it particularly challenging to acquire at the regional scale. Some studies address this challenge by setting the planting date as a constant parameter for simulation[5, 72], but this does not correspond to the spatial variation of planting date at the regional scale. This study proposes a dual-window planting date simulation rule to address the need for variable planting date data (Supplementary File 1: Table S1). This rule relies solely on temperature data to simulate the appropriate planting date rather than the actual one. Ongoing research based on remote sensing inversion of the actual planting dates for winter wheat is extensive, and the results are more accurate[73,74]. GEE can be directly involved in the model simulation after mounting the relevant data, which in turn can improve the accuracy of the WG4GEE simulation.
There is also a limitation to the computational services GEE provides for free users[75], which includes restrictions on the number of computational requests sent to the servers[23]. To facilitate process simulation under limited computational conditions, WG4GEE in this study simplified the role of soil nutrients in determining yield. Given the negative correlation between soil nutrients (N, P, and K) and elevation[76,77], elevation was used as an empirical factor to represent nutrient influence, which could introduce potential errors.
Among the regional wheat growth models developed by previous researchers (Table 4), the SIMPLE and GYMEE models prioritize balancing computational efficiency and regional applicability. SIMPLE offers fast simulations with a straightforward framework, while GYMEE achieves higher spatial resolution and improved simulation accuracy. However, both models compromise on mechanistic completeness. In contrast, the WG4RASTER model excels in regional simulation accuracy and coupling capabilities, but is hindered by complex data preparation processes and high computational demands.
Table 4. Comparison of advantages and limitations of regional wheat growth simulation models.
Regional wheat growth simulation model Strengths Limitations SIMPLE[19] ● Simple framework with few parameters
● Strong scalability
● Fast simulation speed● Absence of photoperiod and vernalization mechanisms
● Lack of nutrient dynamics mechanismGYMEE[28] ● Built on GEE
● Well-developed factors
● High simulation accuracy and spatial resolution.● Lack of variety-specific parameters
● Incomplete simulation mechanismWG4RASTER[78] ● High parallel computational efficiency
● High regional simulation accuracy
● Strong coupling capabilities● Complex preprocessing procedures
● Dependence on local computational resourcesWG4GEE ● Relatively complete mechanism
● Simple data acquisition process
● Fully cloud-based computation
● High simulation accuracy● Limited by platform-provided data and computational efficiency
● Lacks modules for extreme climate conditionsOn the other hand, WG4GEE simplifies data acquisition, avoids reliance on local computational resources, and uses cloud-based computing while maintaining a more comprehensive representation of wheat growth mechanisms. Despite some limitations regarding computational efficiency, its high efficiency and straightforward data processing make it well suited for large-scale regional simulations. This positions WG4GEE as a powerful and practical tool for regional wheat growth modeling.
Potential applications of WG4GEE
-
GEE has made significant achievements in crop mapping, including multi-crop mapping[79,80], and crop intensity mapping[81,82]. Although there are fewer studies on large-scale crop yield mapping, the development of WG4GEE has expanded the scope of research in this domain. The environmental and management parameters used as inputs to the model are based entirely on GEE global-scale data, which makes WG4GEE potentially applicable for large-scale simulations globally. Cultivar parameters are derived from the cultivar data within the winter wheat region. While representative cultivar parameter data from other global regions is currently unavailable, with the inclusion of such data in the future, the simulation domain of WG4GEE can be extended to a larger scale, enabling the realization of global mapping for winter wheat production.
Climate change has already impacted global food production[83]. Integrating large-scale climate models with crop growth models involves using climate projections (temperature, precipitation, and CO2 levels) to evaluate the impact of climate change on agriculture[84,85]. WG4GEE can effectively leverage existing real-time and historical meteorological environment data within GEE. In the future, WG4GEE could rapidly simulate winter wheat yields under different climate scenarios, providing a comprehensive understanding of how climate change may affect agricultural production.
Furthermore, the integration of remote sensing data with crop models can improve the accuracy of predicting various crop canopy variables and yield forecasts at regional scales[86]. However, the application of large-scale data assimilation algorithms typically result in significant increases in both computational time and cost[21]. WG4GEE is developed based on the GEE platform, which can quickly retrieve all kinds of remote sensing data already available in GEE. Suppose the corresponding data assimilation algorithms or modules can be developed in subsequent research, the real-time coupling of remote sensing and crop modeling at large scales can be realized, which can further improve the simulation accuracy of different crop models at the regional scale.
-
This study successfully developed an efficient spatialized crop growth model, WG4GEE, by integrating the WheatGrow model's mechanism with GEE's capabilities. Applying WG4GEE to simulate wheat yields in China's winter wheat region from 2014 to 2019, the results demonstrated excellent stability and accuracy with an average R2 of 0.62 and an average NRMSE of 15.57% compared with the statistical data. Compared to the traditional spatialization methods for crop models, WG4GEE is developed directly on the GEE platform, eliminating the need for complex local preprocessing of spatial input data and reliance on local computational resources. This significantly lowers the technical barriers for applying crop models at regional scales. In addition, it introduces a novel approach to spatializing crop simulation models, providing a valuable tool for global research on the impact of climate change on food production.
-
The authors confirm their contributions to the paper as follows: conceptualization: Han Q, Zhang X; methodology, writing − original draft: Han Q; investigation: Han Q, Xue R, Shi J; data curation: Han Q, Zuo W; validation: Zuo W, Xue R, Shi J; software: Han Q, Zheng Z, Xu H; supervision: Qiu X, Tang L, Zhu Y; project administration: Cao W; formal analysis, funding acquisition, writing − review & editing: Zhang X. All authors reviewed the results and approved the final version of the manuscript.
-
The WG4GEE code is mounted on https://github.com/WheatGrow/WG4GEE, where the data will be made available on request.
-
This research is supported by grants from the National Key R&D Program of China (No. 2022YFD2001103).
-
The authors declare that they have no conflict of interest.
-
accompanies this paper online at: https://doi.org/10.48130/tia-0026-0002.
-
# Authors contributed equally: Qin Han, Wenjun Zuo
- Supplementary File 1 Supporting materials to this study.
- Copyright: © 2026 by the author(s). Published by Maximum Academic Press, Fayetteville, GA. This article is an open access article distributed under Creative Commons Attribution License (CC BY 4.0), visit https://creativecommons.org/licenses/by/4.0/.
-
About this article
Cite this article
Han Q, Zuo W, Xue R, Shi J, Zheng Z, et al. 2026. WG4GEE: a GEE-integrated regional winter wheat growth model for efficient agronomic process and yield simulation. Technology in Agronomy 6: e007 doi: 10.48130/tia-0026-0002 

WG4GEE: a GEE-integrated regional winter wheat growth model for efficient agronomic process and yield simulation
- Received: 01 December 2025
- Revised: 28 January 2026
- Accepted: 30 January 2026
- Published online: 08 June 2026
Abstract: Spatial crop growth models are critical for agronomic decision-making, especially in assessing climate change impacts on productivity. However, regional applications of point-scale models are limited by insufficient input data and computational resources. This study aims to address these challenges by developing WG4GEE—a regional winter wheat growth model integrated with Google Earth Engine (GEE). The GEE platform provides high-resolution weather and soil data for the model, which runs on GEE's cloud computing environment. Validated using 2014–2019 winter wheat yield data from China, WG4GEE completed regional yield simulation in 7 h, achieving an R2 of 0.62 and an NRMSE of 15.57%. Simulated LAI time series accurately reflected wheat growth dynamics. Compared with traditional models, WG4GEE simplifies data acquisition, enhances efficiency via cloud computing, and reduces local resource reliance. This study confirms GEE's value for regional agronomic models, offering a tool for large-scale crop monitoring, yield prediction, and climate-adaptive management.
-
Key words:
- Crop growth model /
- Winter wheat /
- Google Earth Engine /
- Regional application