-
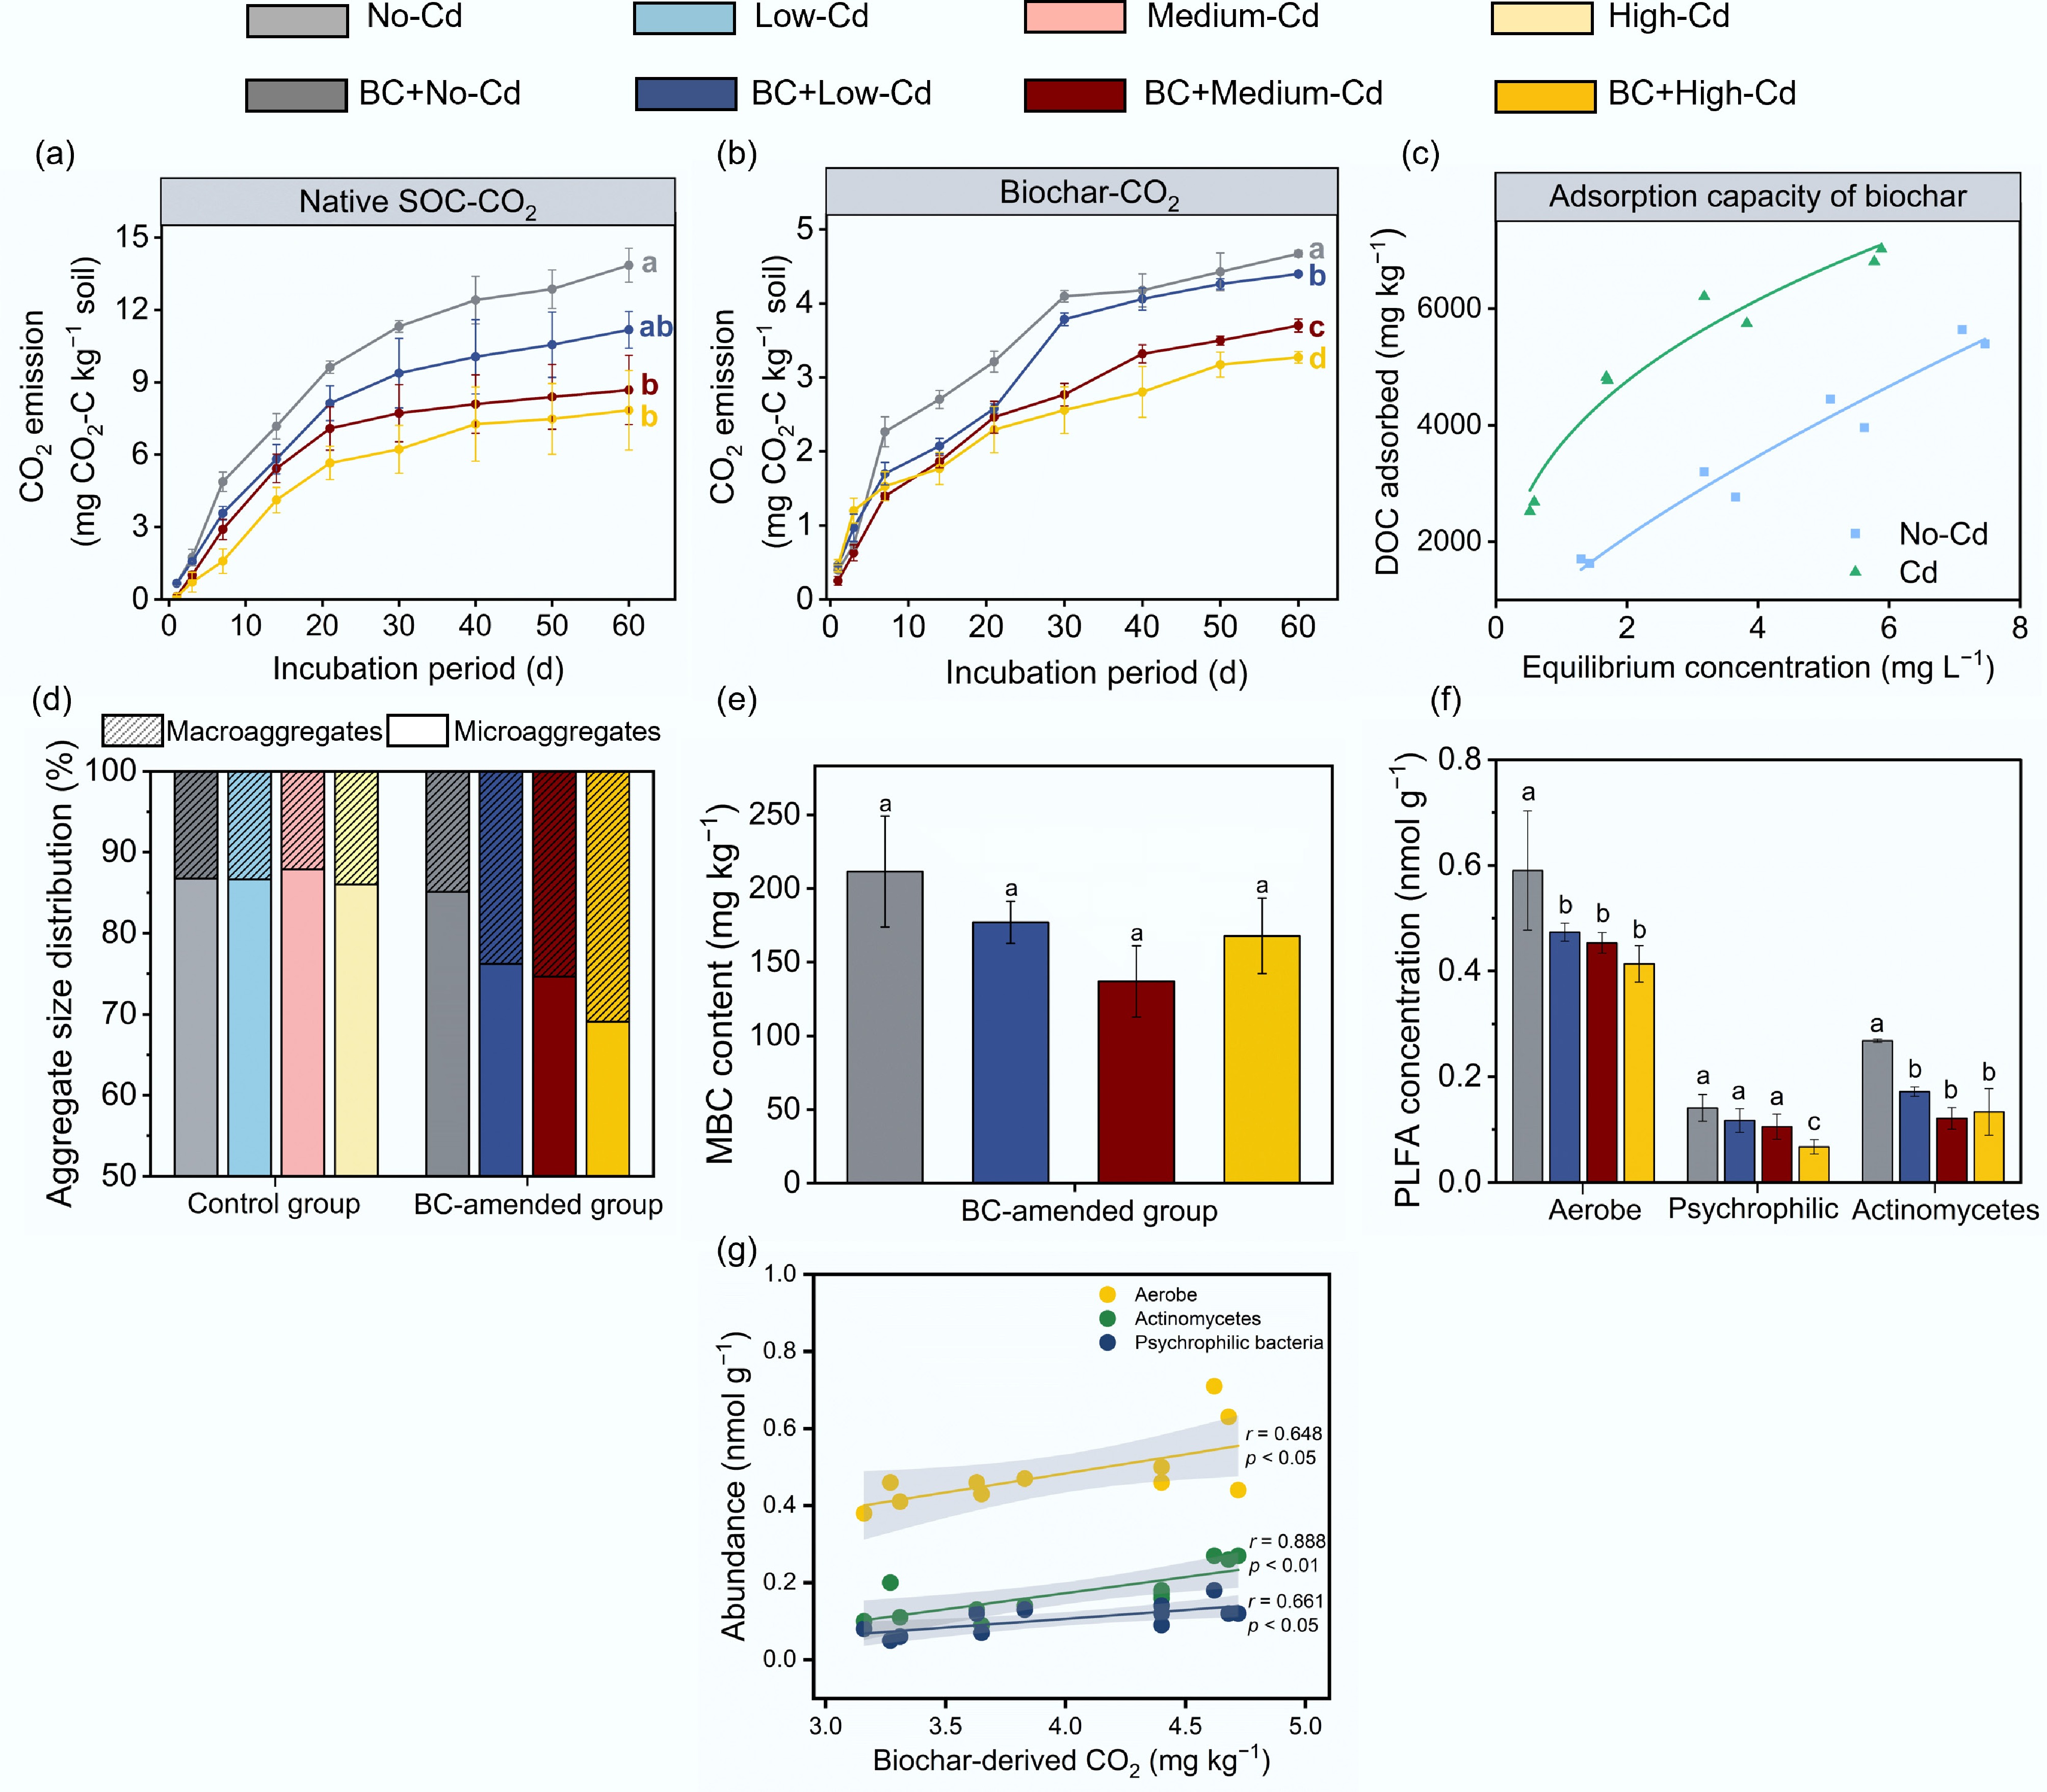
Figure 1.
The cumulative amounts of CO2 evolved from (a) native SOC and (b) biochar. (c) Sorption of soil DOC by biochar components. Solid lines indicate the Freundlich fitting results. (d) The proportions of macroaggregates (250–2,000 µm) and microaggregates (< 250 µm) in the soils. (e) Content of soil microbial biomass carbon of biochar particles. (f) Absolute concentrations of PLFA of typical microbial groups in biochar particles. (g) Correlation between biochar-derived CO2 and microbial abundance. No Cd, low Cd, medium Cd, and high Cd represent the soils without added Cd and soils with the addition of low, medium, and high concentrations of Cd, respectively. BC + no Cd, BC + low Cd, BC + medium Cd, BC + high Cd represent the soils amended with biochar without added Cd and those with the addition of low, medium, and high concentrations of Cd, respectively. Error bars indicate standard deviations (n = 3). Different lowercase letters indicate significant differences (p < 0.05).
-
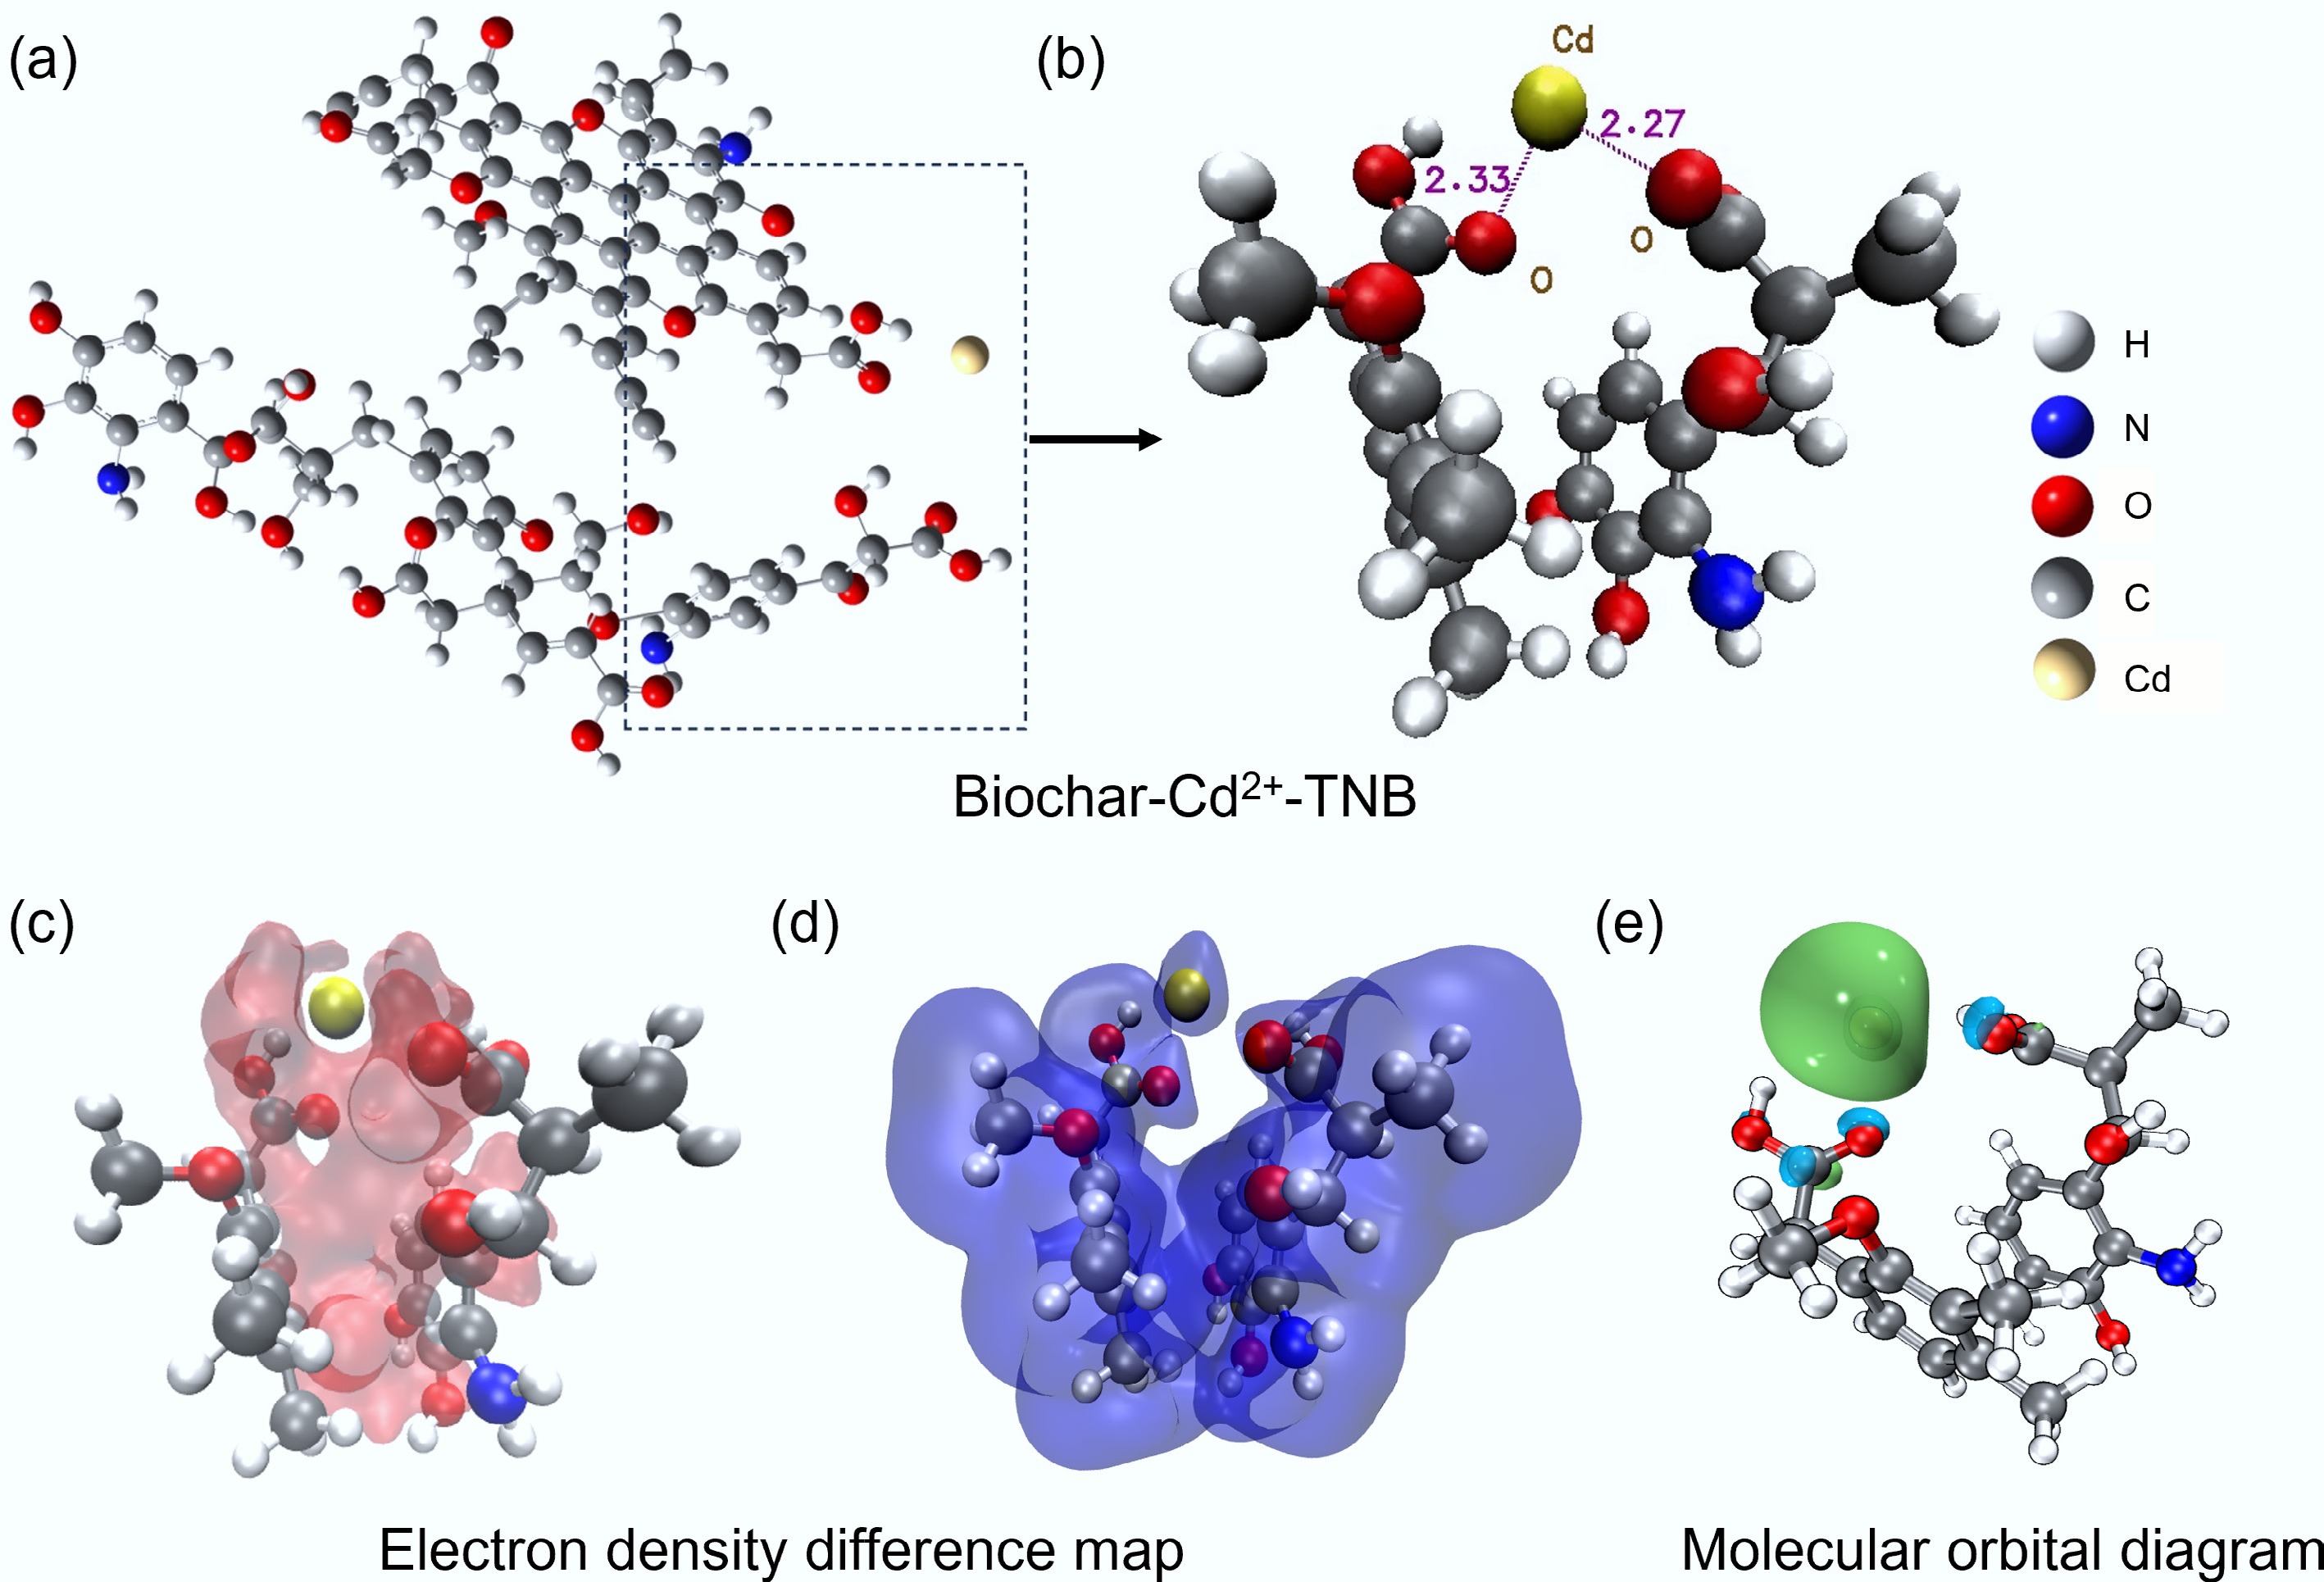
Figure 2.
(a, b) Snapshots of biochar–Cd2+–TNB equilibrium after simulated of the molecular dynamics. The numbers annotated in the figure are in units of Å. (c, d) Isosurface maps of the electrostatic potential for Biochar–Cd2+–TNB, where red and blue represent isosurfaces with values of −0.08 and 0.01, respectively. (e) Differences in charge density for the adsorption of biochar–Cd2+–TNB. Blue and green colors denote holes and electrons.
Figures
(2)
Tables
(0)