-
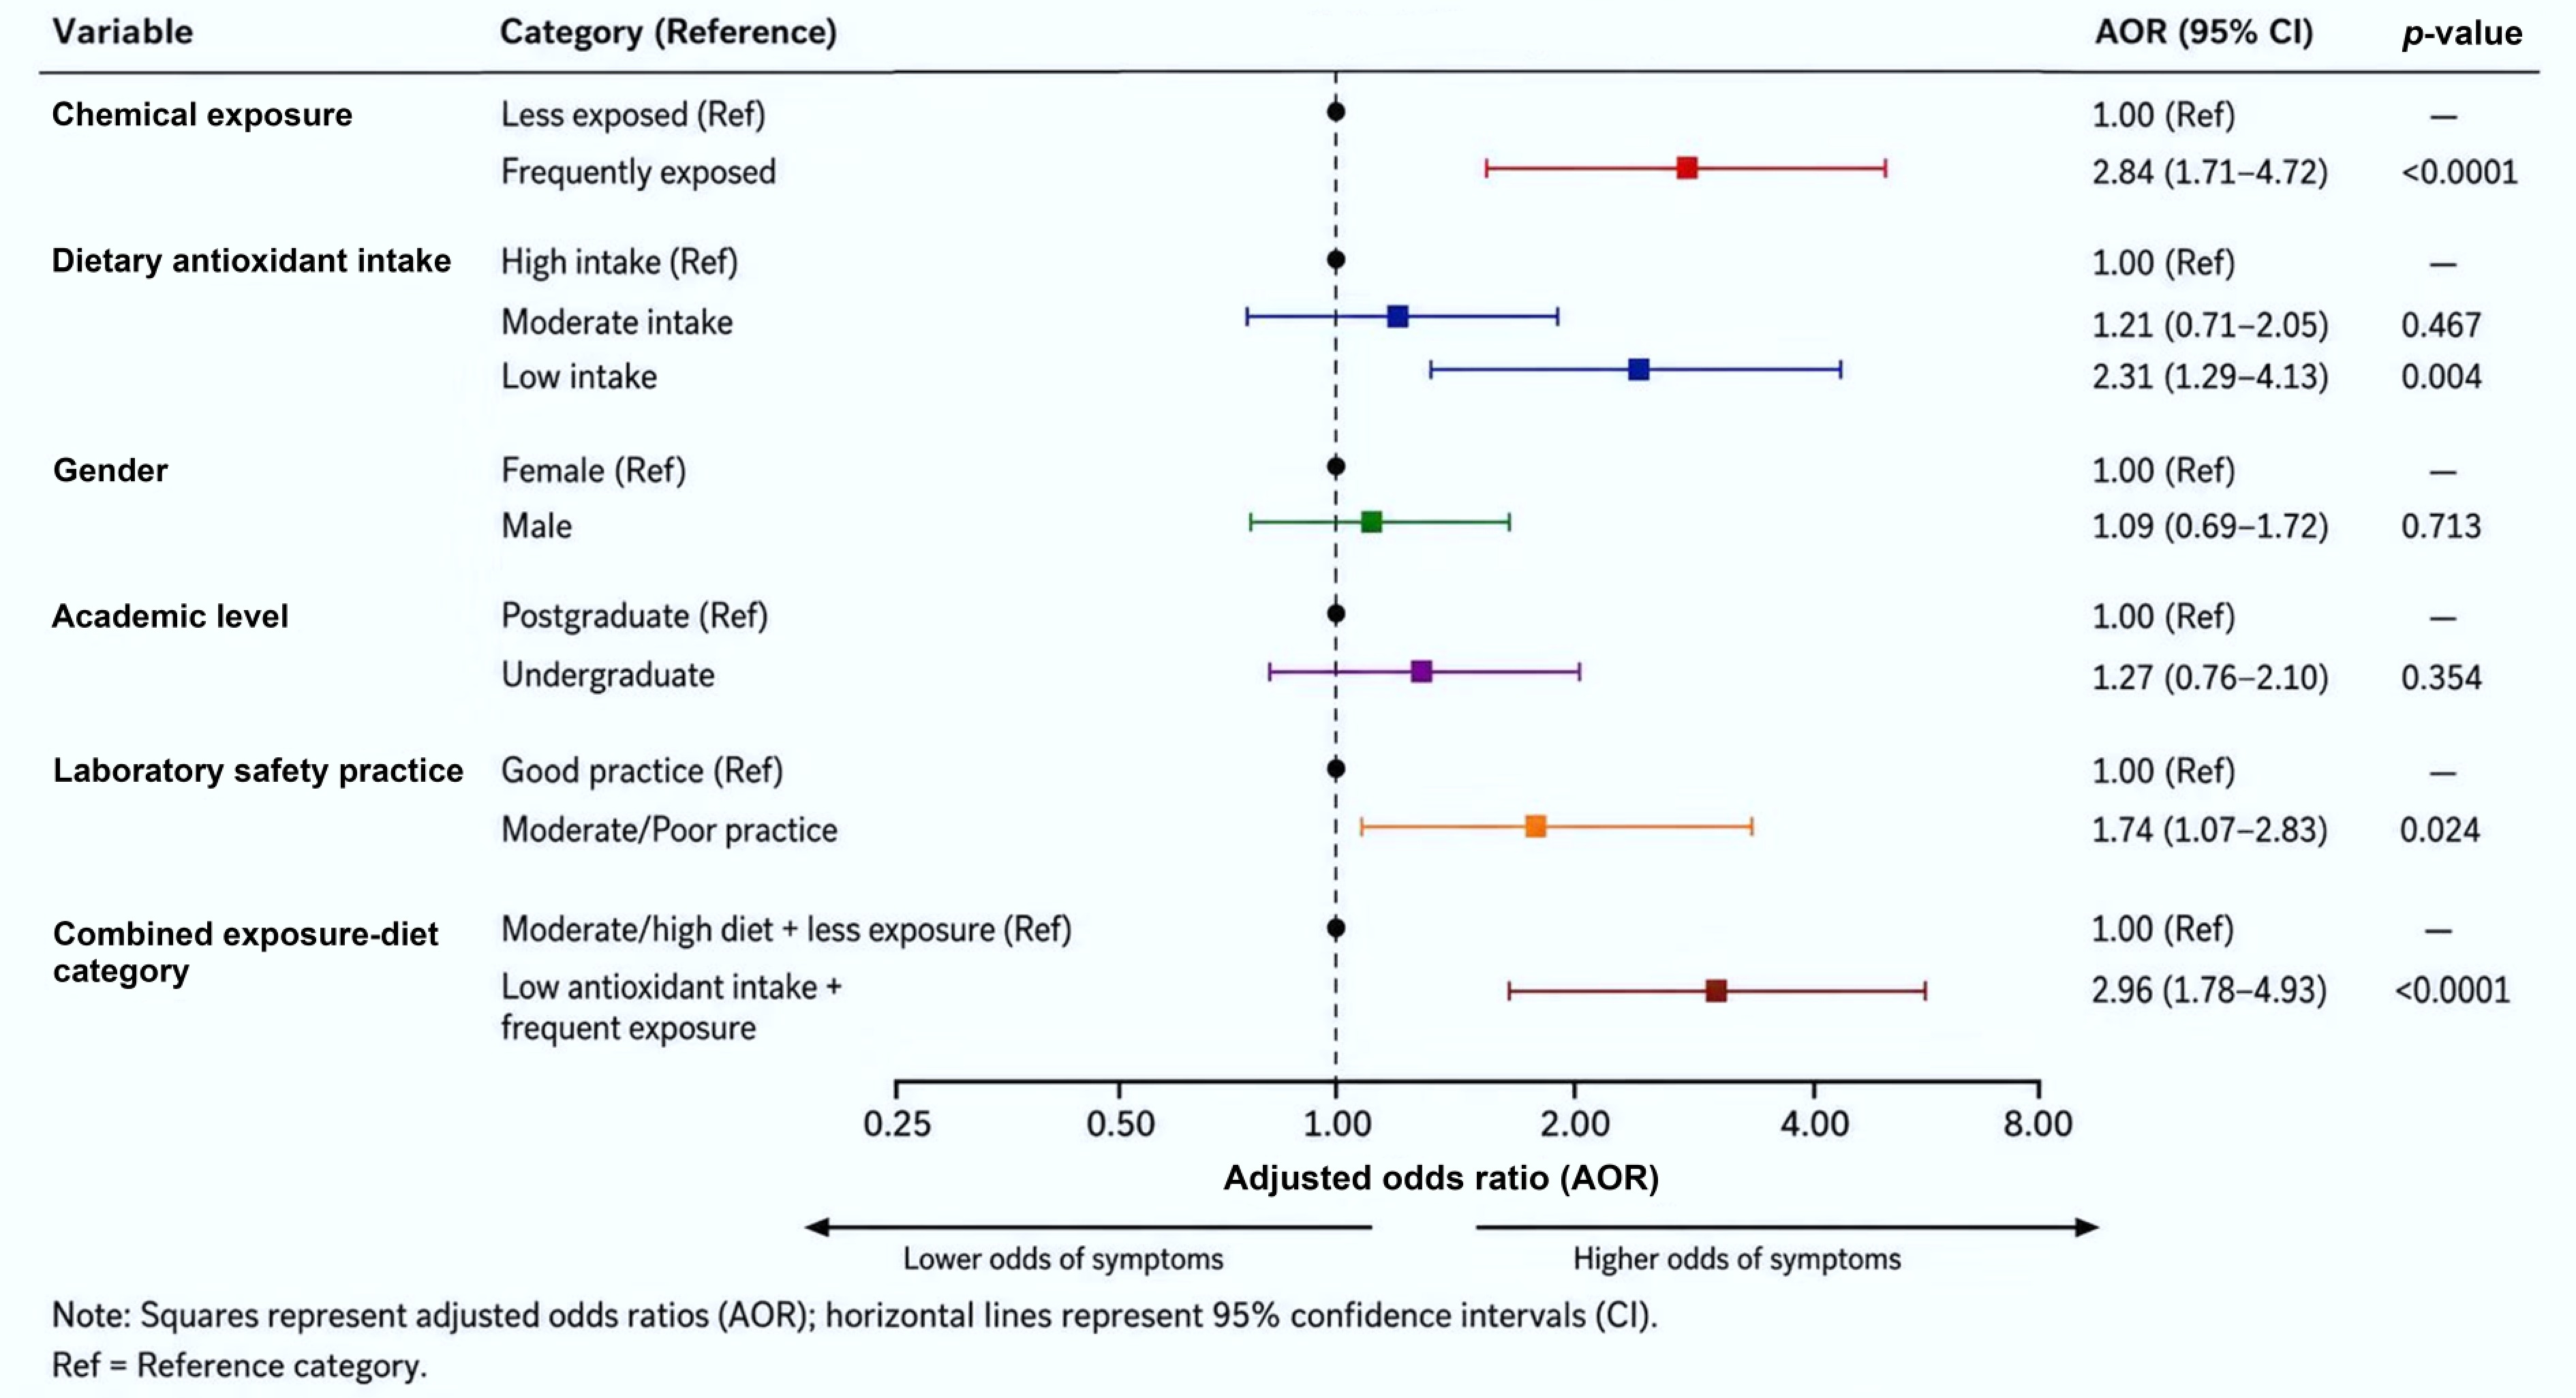
Figure 1.
Forest plot of adjusted odds ratios for factors associated with self-reported oxidative stress-related symptoms among participants (n = 426).
-
Variable Category Frequency (n) Percentage (%) Age (years) 18–25 260 61.0 26–30 112 26.3 > 30 54 12.7 Gender Male 196 46.0 Female 230 54.0 Level of study Undergraduate 295 69.2 Postgraduate 131 30.8 Program Chemistry/science 240 56.3 Medical-related 186 43.7 Table 1.
Sociodemographic characteristics of the respondents (n = 426)
-
Level Good, n (%) Moderate, n (%) Poor, n (%) Total χ2 df p-value Undergraduate 155 (52.5) 90 (30.5) 50 (17.0) 295 Postgraduate 88 (67.2) 32 (24.4) 11 (8.4) 131 15.32 2 0.0005 Total 243 (57.0) 122 (28.6) 61 (14.4) 426 Table 2.
Knowledge level by academic status
-
Exposure status Symptoms present,
n (%)No symptoms,
n (%)Total Frequently exposed 210 (62.7) 125 (37.3) 335 Less exposed 32 (35.2) 59 (64.8) 91 Total 242 184 426 Statistical analysis: χ2 = 22.30, df = 1, p < 0.0001. Table 3.
Association between chemical exposure and self-reported oxidative stress symptoms (n = 426)
-
Knowledge
levelGood practice,
n (%)Poor/moderate,
n (%)Total χ2 df p-value Good 142 (58.4) 101 (41.6) 243 Moderate 30 (24.6) 92 (75.4) 122 28.63 2 <0.0001 Poor 8 (13.1) 53 (86.9) 61 Table 4.
Association between knowledge level and laboratory safety practices
-
Variable Category Crude OR (95% CI) p-value AOR (95% CI) p-value Chemical exposure Less exposed (Ref.) 1.00 — 1.00 — Frequently exposed 3.10 (1.92–5.01) < 0.0001 2.84 (1.71–4.72) < 0.0001 Dietary antioxidant intake High intake (Ref.) 1.00 — 1.00 — Moderate intake 1.29 (0.78–2.13) 0.311 1.21 (0.71–2.05) 0.467 Low intake 2.76 (1.61–4.73) < 0.0001 2.31 (1.29–4.13) 0.004 Gender Female (Ref.) 1.00 — 1.00 — Male 1.18 (0.77–1.81) 0.432 1.09 (0.69–1.72) 0.713 Academic level Postgraduate (Ref.) 1.00 — 1.00 — Undergraduate 1.42 (0.88–2.29) 0.146 1.27 (0.76–2.10) 0.354 Laboratory safety practice Good practice (Ref.) 1.00 — 1.00 — Moderate/poor practice 2.03 (1.29–3.18) 0.002 1.74 (1.07–2.83) 0.024 Combined exposure–diet category Moderate/high diet + less exposure (Ref.) 1.00 — 1.00 — Low antioxidant intake + frequent exposure 3.12 (1.92–5.09) < 0.0001 2.96 (1.78–4.93) < 0.0001 Model statistics Hosmer–Lemeshow goodness-of-fit test: p = 0.41; Nagelkerke's R2 = 0.28. Table 5.
Binary logistic regression analysis of factors associated with self-reported oxidative stress-related symptoms among participants (n = 426)
Figures
(1)
Tables
(5)