-
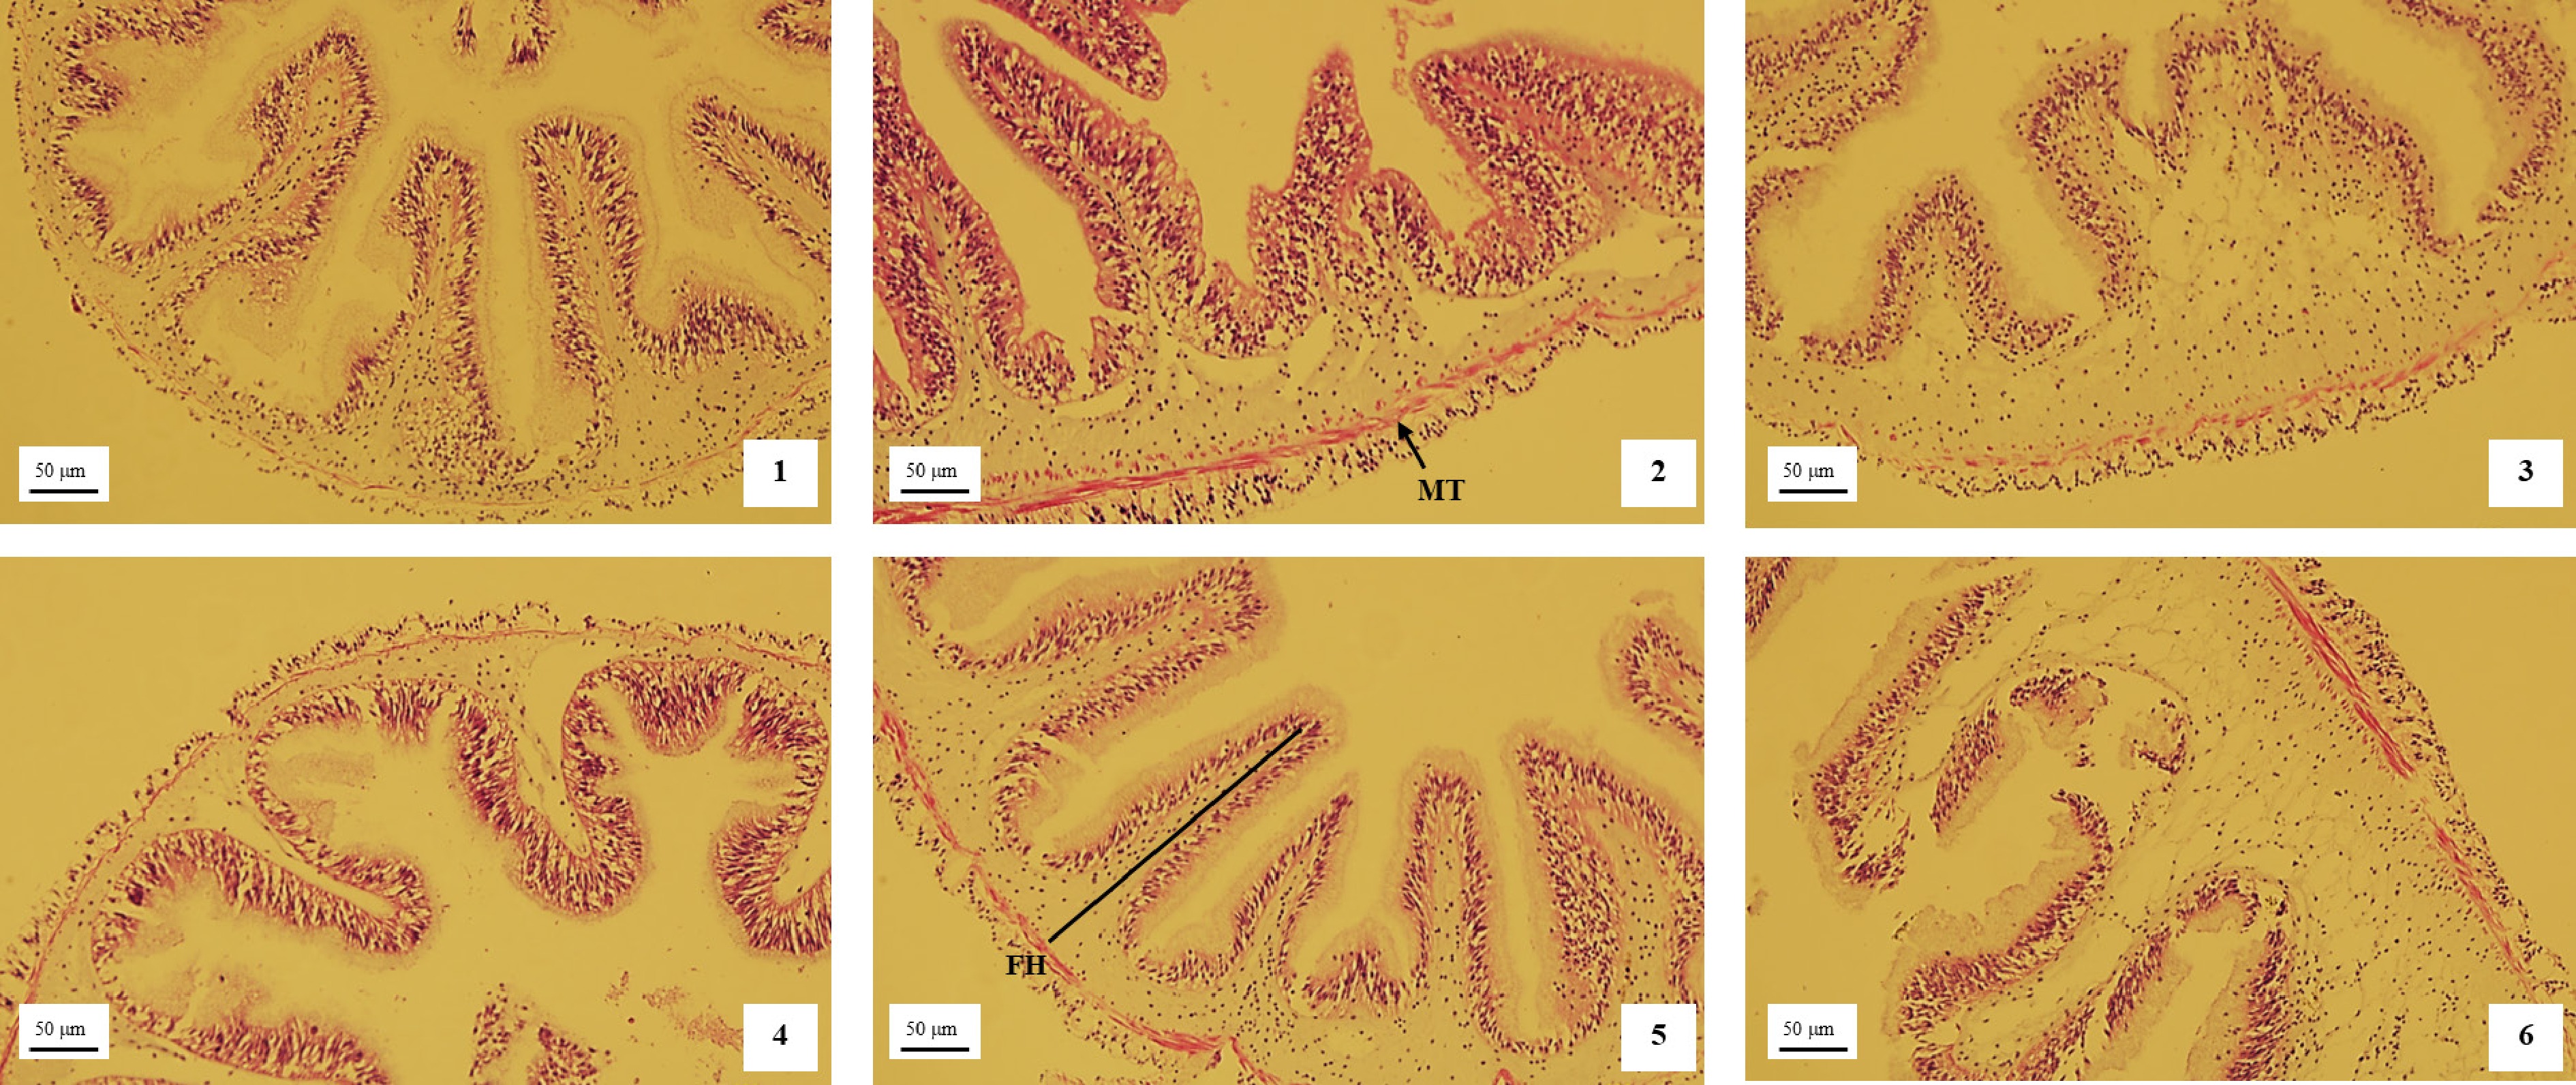
Figure 1.
Effects of dietary protein-to-sea mud ratio on intestinal morphology in A. japonicus (× 40). MT, muscularis thickness. FH, fold height. Histological observations (H&E staining) revealed a gradual thickening of the intestinal wall and an increase in fold height with rising dietary protein and sea mud levels.
-
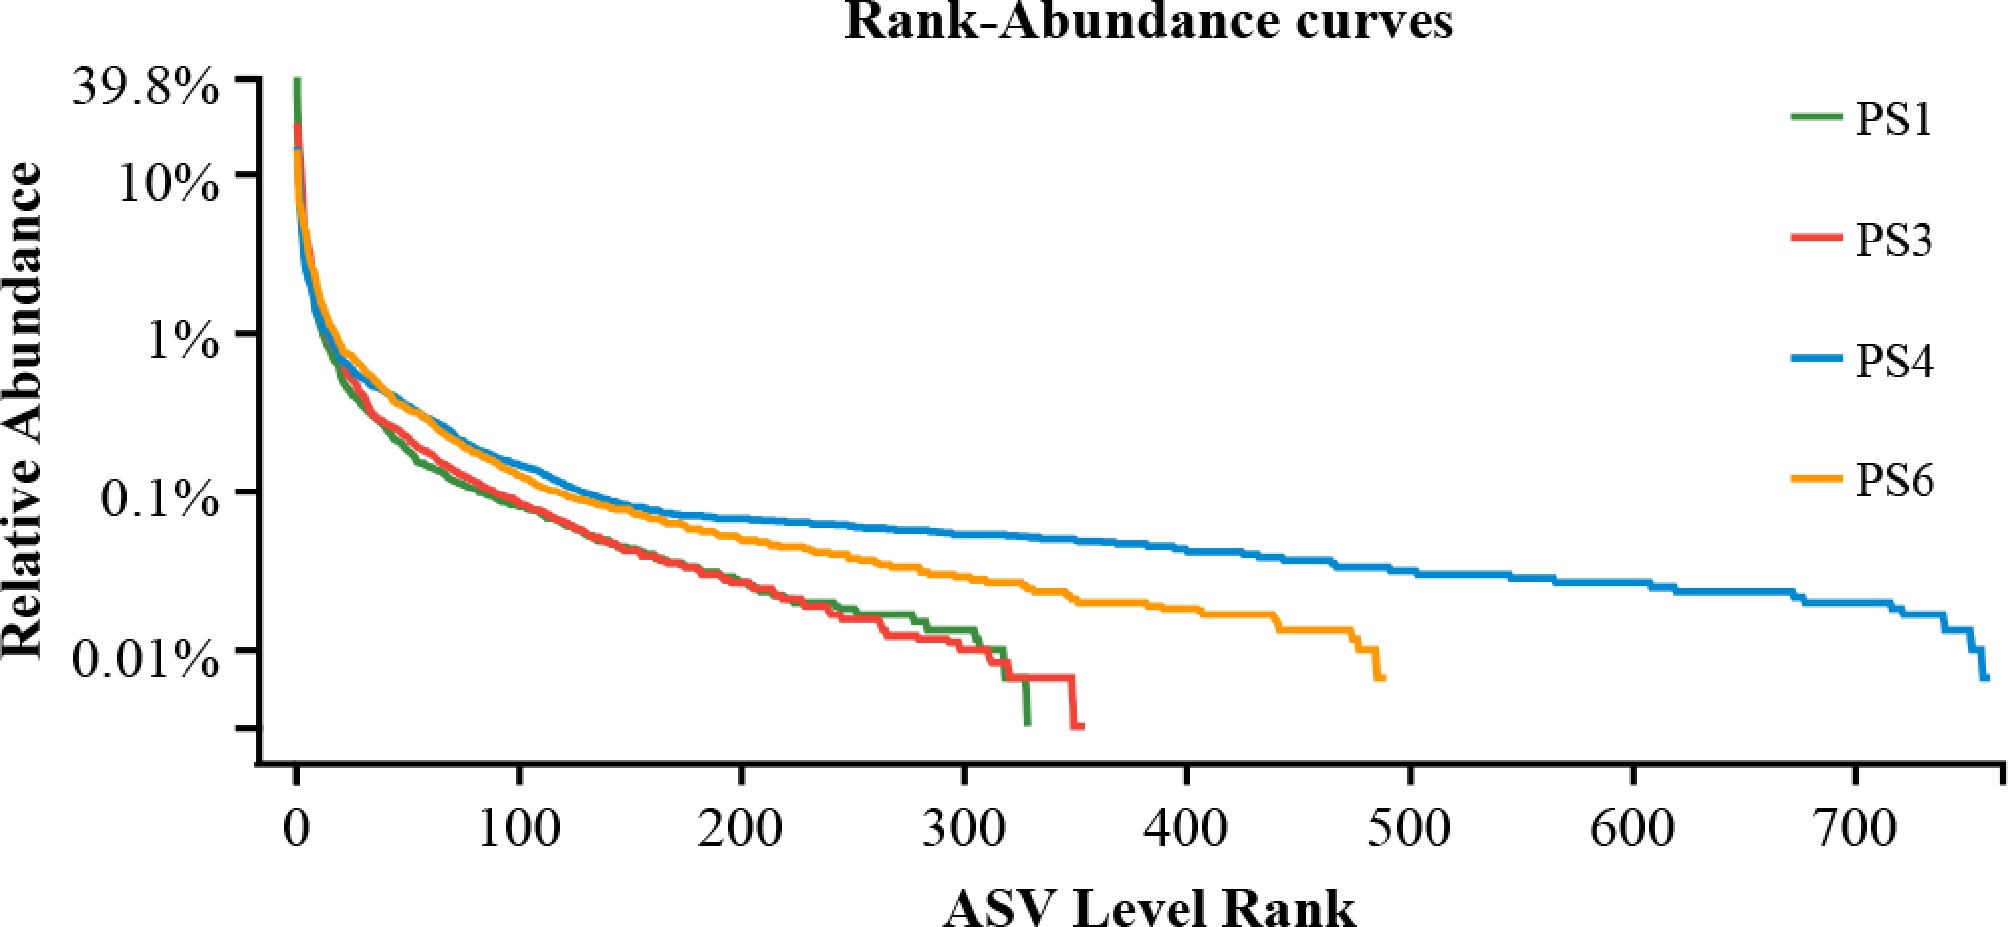
Figure 2.
Rarefaction curves of species richness and evenness in the gut samples of A. japonicus.
-
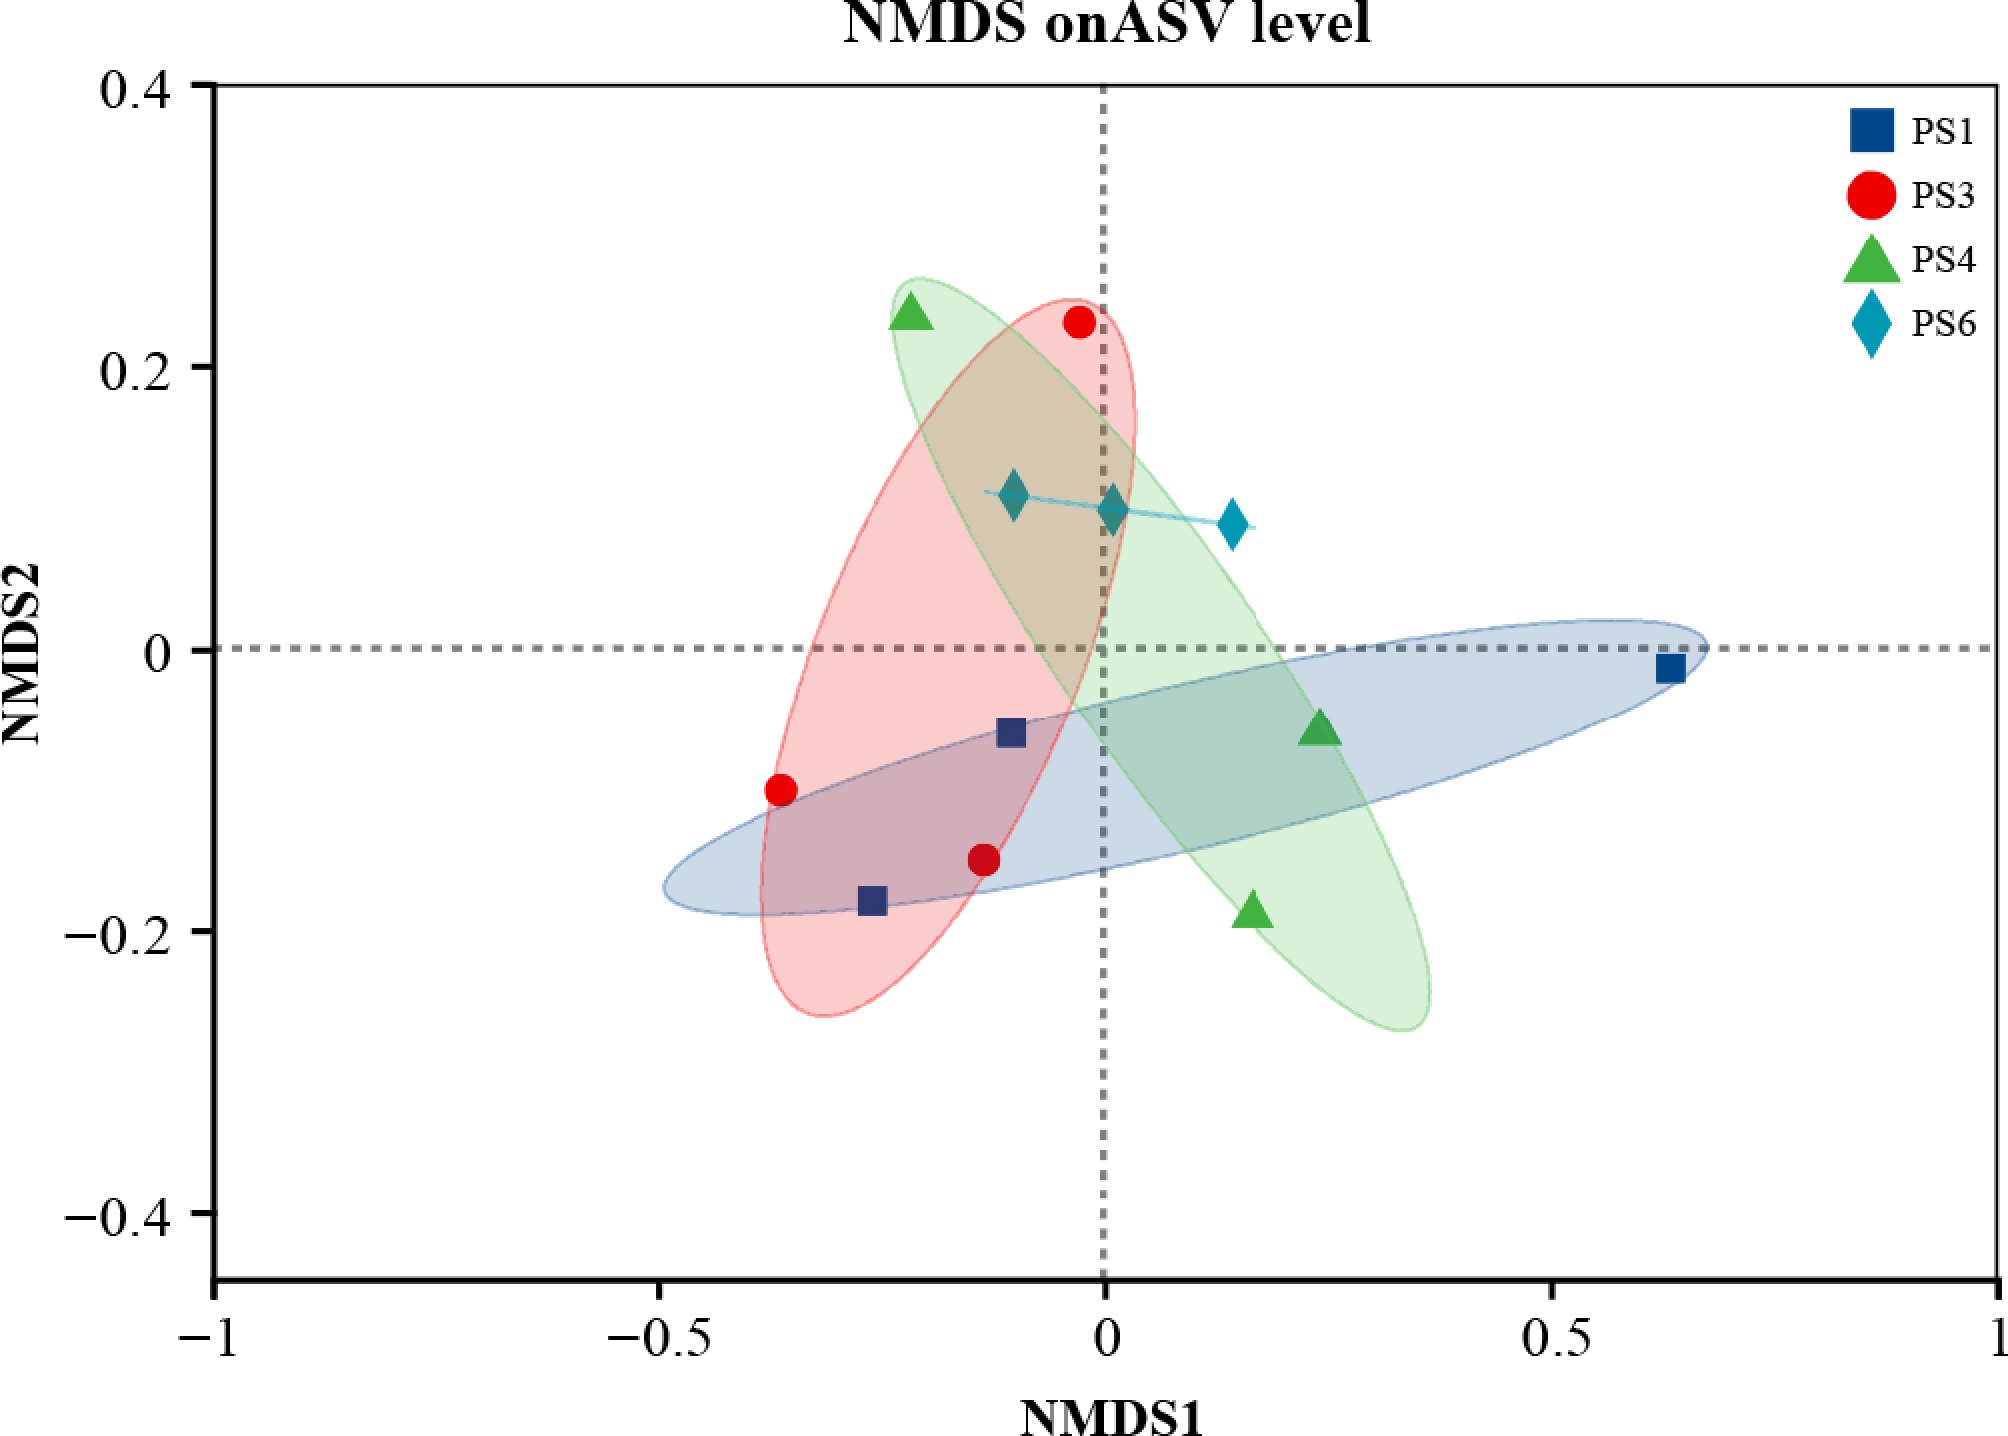
Figure 3.
Nonmetric multidimensional scaling (NMDS) analysis of the intestinal bacterial community of A. japonicus. Notes: stress < 0.2 indicates that NMDS can accurately reflect the degree of difference between samples.
-
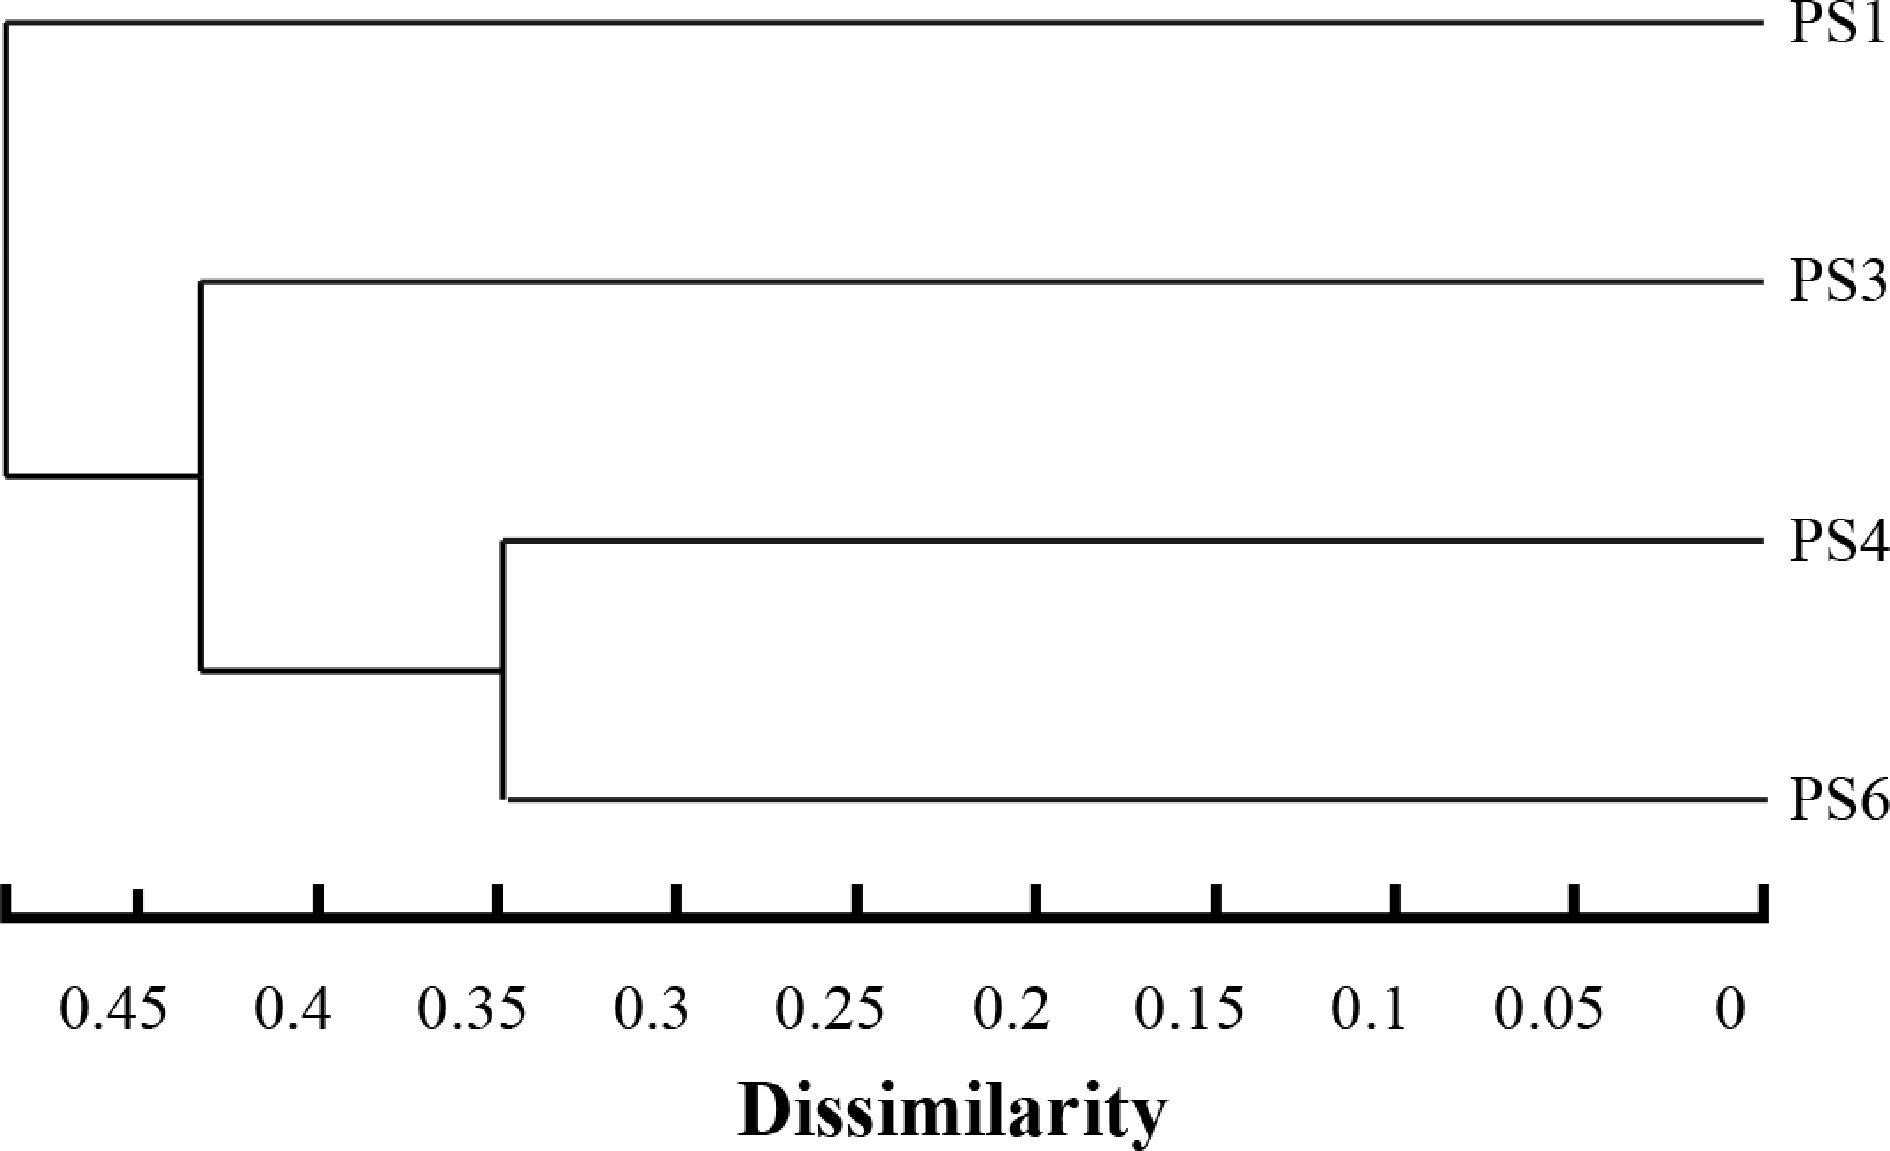
Figure 4.
Hierarchical clustering tree of the intestinal bacterial community of A. japonicus based on the Bray_Curtis distance algorithm.
-
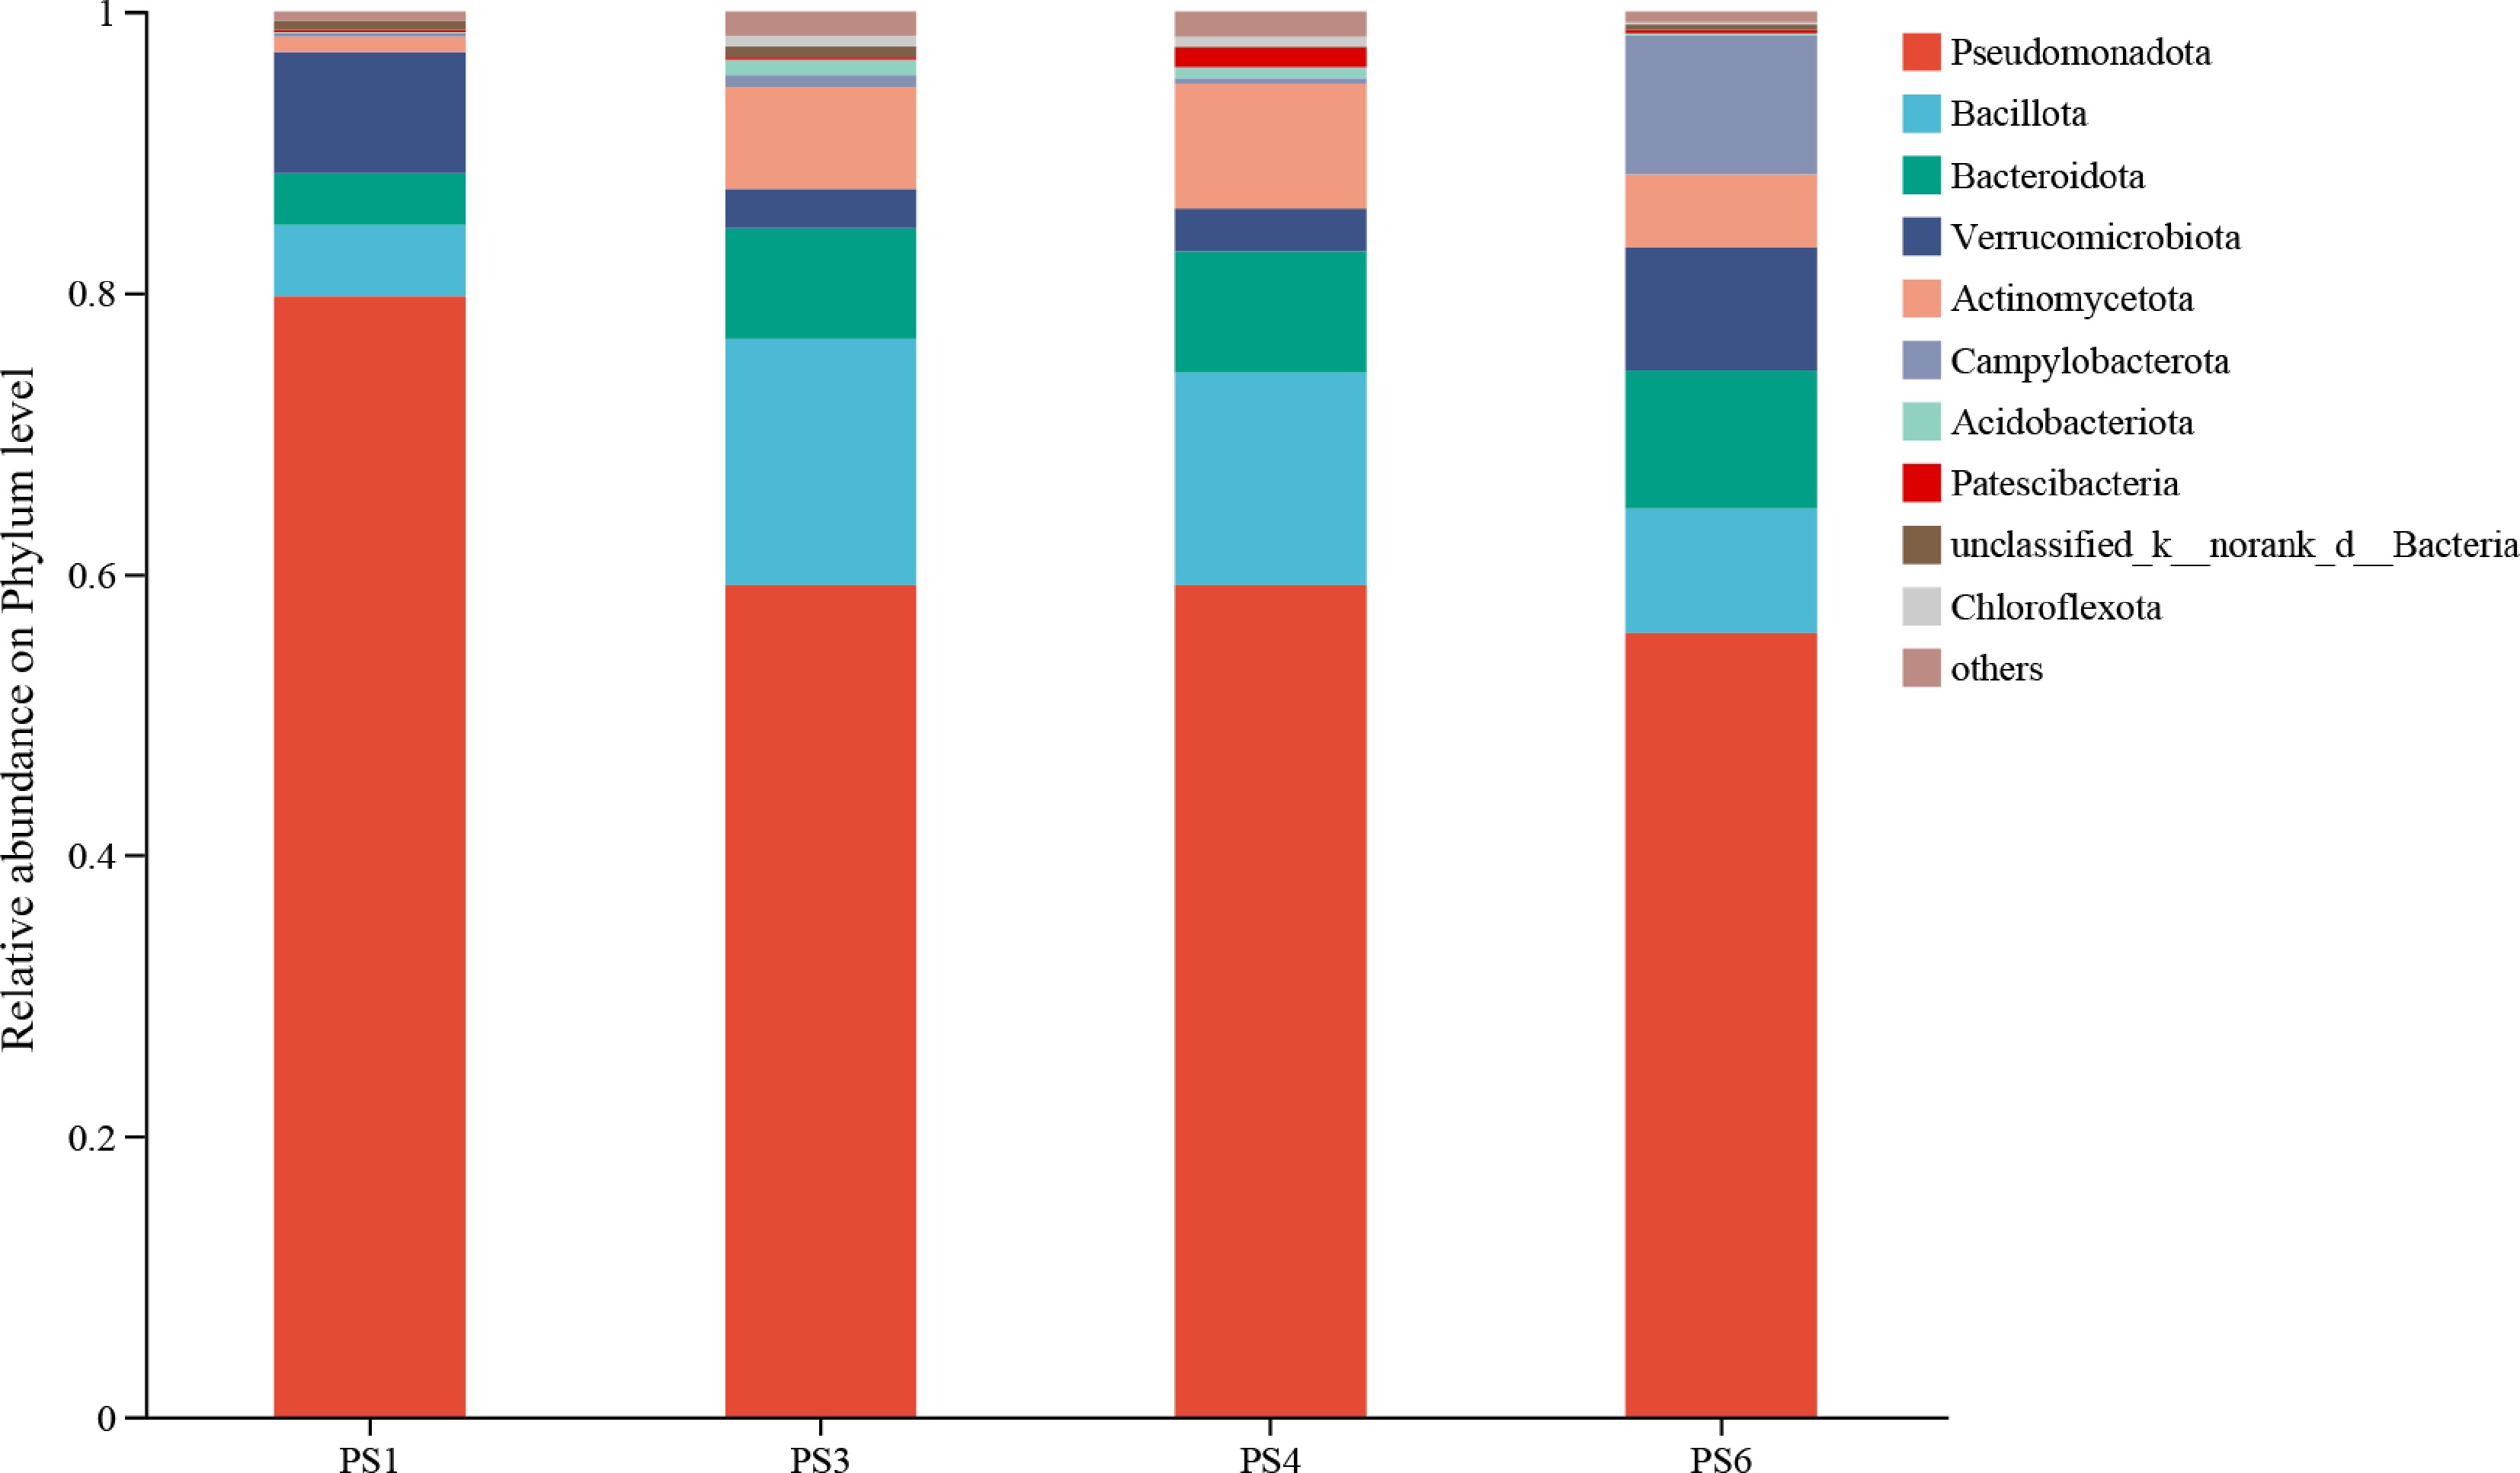
Figure 5.
Composition of intestinal microbial flora of A. japonicus at the phylum level.
-
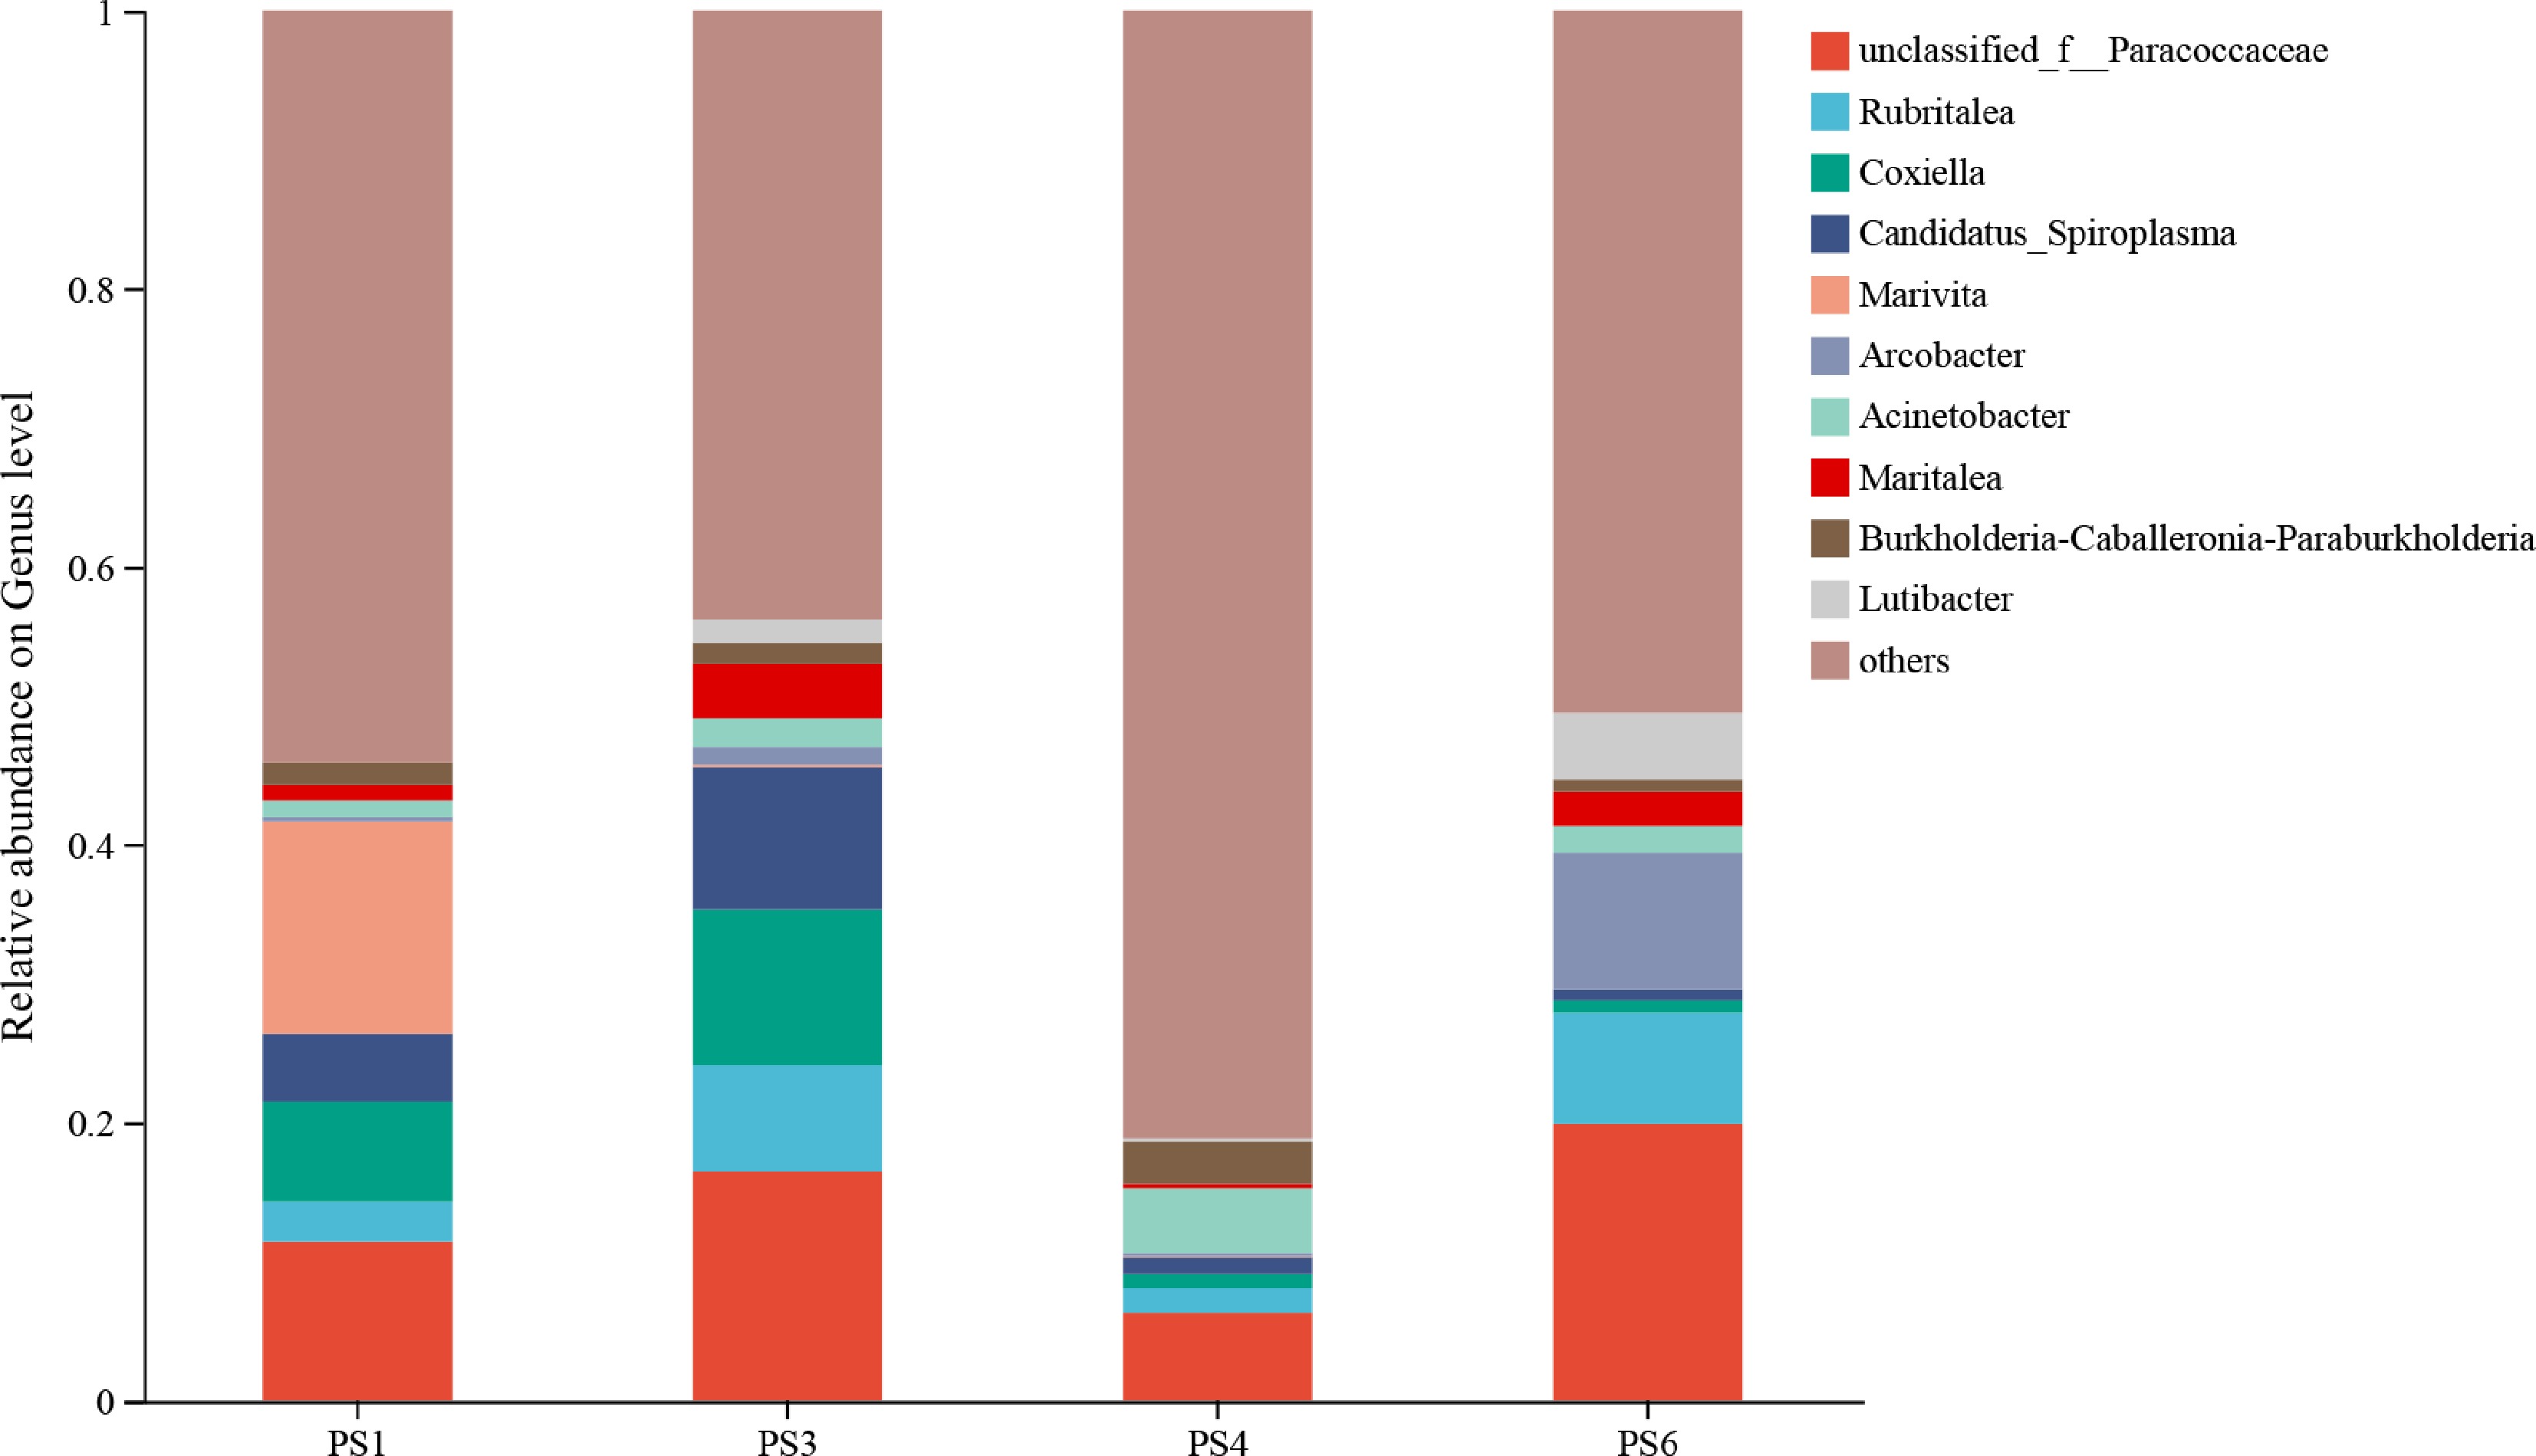
Figure 6.
Composition of intestinal microbial flora of A. japonicus at the genus level.
-
Ingredients (%) PS no. (protein/sea mud) PS1(10/30) PS2(10/45) PS3(10/60) PS4(13/30) PS5(13/45) PS6(13/60) Sea mud 30.00 45.00 60.00 30.00 45.00 60.00 Sargassum meal 40.00 30.00 20.00 40.00 30.00 20.00 Fish meal1 2.00 2.00 2.00 3.00 3.00 3.00 Soybean meal 3.00 3.00 3.00 4.00 4.00 4.00 Wheat flour 23.00 14.2 6.00 18.00 9.20 1.00 Casein 0.00 3.00 5.50 3.00 6.00 8.50 Microcrystalline cellulose 0.00 0.80 1.50 0.00 0.80 1.50 Vitamin premix2 1.00 1.00 1.00 1.00 1.00 1.00 Mineral premix3 1.00 1.00 1.00 1.00 1.00 1.00 Proximate composition (%) Crude protein 10.50 10.70 10.22 13.20 13.60 13.20 Crude lipid 1.46 1.85 2.76 2.09 2.06 2.55 Protein/sea mud 0.34 0.23 0.17 0.44 0.30 0.22 1 Fish meal, Xiamen Jiakang feeds group Corp., Ltd, imported from Peru. 2, 3 Mineral premix and vitamin premix were prepared following our recent study[15]. Table 1.
Formulation and proximate composition of the experimental diets (% dry matter).
-
Item PS no. (protein/sea mud) ANOVA (p value) PS1(10/30) PS2(10/45) PS3(10/60) PS4(13/30) PS5(13/45) PS6(13/60) Protein Sea mud Protein x sea mud IBW (g)1 5.37 ± 0.01 5.40 ± 0.02 5.42 ± 0.02 5.40 ± 0.01 5.40 ± 0.03 5.39 ± 0.03 FBW (g)2 4.74 ± 0.72b 5.36 ± 0.14b 5.76 ± 0.84b 5.29 ± 0.34b 7.55 ± 0.93a 7.78 ± 0.45a 0.005 0.022 0.321 WGR (%)3 −11.67 ± 13.59b −0.71 ± 2.30b 6.31 ± 15.67b −2.22 ± 6.10b 39.57 ± 16.68a 44.28 ± 7.80a 0.005 0.021 0.297 SGR (%)4 −0.27 ± 0.30c −0.01 ± 0.04bc 0.07 ± 0.28abc −0.05 ± 0.11c 0.58 ± 0.24ab 0.65 ± 0.10a 0.011 0.038 0.553 IBR (%)5 2.69 ± 1.22c 4.13 ± 0.36bc 3.94 ± 0.45bc 3.46 ± 0.44bc 4.82 ± 0.16ab 6.48 ± 0.20a 0.017 0.011 0.245 SR (%)6 100.00 ± 0.00a 100.00 ± 0.00a 93.33 ± 1.67b 96.67 ± 1.67ab 96.67 ± 3.33ab 98.33 ± 1.67ab 0.712 0.312 0.061 Values in the same row (multiple comparisons or main effects analysis) with different superscript letters are significantly different (p < 0.05), while the values for two-factor analysis of variance are less than 0.05, indicating significant differences at p < 0.05. Data are presented as mean ± S.E.M. (n = 3).1 IBW (g) = initial body weight. 2 FBW (g) = final body weight. 3 Weight gain rate (WGR, %) = (final body weight–initial body weight)/initial body weight × 100. 4 Specific growth rate (SGR, % day−1) = (ln final body weight–ln initial body weight)/feeding days × 100. 5 Intestinal to body wall ratio (IBR, %) = intestinal weight/body weight (wet weight). 6 Survival rate (SR, %) = 100 × (final number/initial number of sea cucumbers).wall Table 2.
Effects of dietary protein-to-sea mud ratio on growth performance of A. japonicus.
-
Item PS no. (protein/sea mud) ANOVA (p value) PS1(10/30) PS2(10/45) PS3(10/60) PS4(13/30) PS5(13/45) PS6(13/60) Protein Sea mud Protein × sea mud Moisture 89.50 ± 0.17ab 89.39 ± 0.10ab 89.80 ± 0.09a 88.95 ± 0.49b 90.03 ± 0.06a 90.19 ± 0.27a 0.441 0.027 0.074 Crude protein 54.83 ± 0.75b 57.17 ± 1.41ab 61.67 ± 1.58a 58.53 ± 2.03ab 57.30 ± 1.67ab 54.57 ± 0.97b 0.381 0.626 0.009 Crude lipid 2.30 ± 0.34 3.12 ± 0.21 2.84 ± 0.83 2.52 ± 0.23 2.60 ± 0.23 2.43 ± 0.09 0.481 0.544 0.625 Values in the same row (multiple comparisons or main effects analysis) with different superscript letters are significantly different at p < 0.05, while the values for two-factor analysis of variance are less than 0.05, indicating significant differences at p < 0.05. Data are presented as mean ± SEM (n = 3). Table 3.
Effects of dietary protein-to-sea mud ratio on body-wall composition of A. japonicus (%).
-
Item PS no. (protein/sea mud) ANOVA (p value) PS1(10/30) PS2(10/45) PS3(10/60) PS4(13/30) PS5(13/45) PS6(13/60) Protein Sea mud Protein × sea mud TPS 196.35 ± 60.27c 324.31 ± 30.08bc 362.3 ± 103.23bc 385.85 ± 29.88bc 570.93 ± 47.55ab 736.57 ± 194.26a 0.005 0.059 0.631 LPS 1.52 ± 0.12b 1.34 ± 0.01b 2.07 ± 0.10ab 1.97 ± 0.29ab 2.51 ± 0.40a 2.56 ± 0.19a 0.002 0.071 0.245 AMS 0.12 ± 0.01 0.13 ± 0.07 0.12 ± 0.01 0.13 ± 0.01 0.14 ± 0.01 0.16 ± 0.01 0.506 0.841 0.807 Values in the same row (multiple comparisons or main effects analysis) with different superscript letters are significantly different at p < 0.05, while the values for two-factor analysis of variance are less than 0.05, indicating significant differences at p < 0.05. Data are presented as mean ± SEM (n = 3). TPS, Trypsin; LPS, Lipase; AMS, Amylase. The unit 'U/(mg prot)' indicates the amount of enzyme activity units per mg of soluble protein in the sample, reflecting the specific activity of the enzyme. Table 4.
Effects of dietary protein-to-sea mud ratio on digestive enzyme activity in the intestine of A. japonicus (U/[mg prot]).
-
Item PS no. (protein/sea mud) ANOVA (p value) PS1(10/30) PS2(10/45) PS3(10/60) PS4(13/30) PS5(13/45) PS6(13/60) Protein Sea mud Protein × sea mud MT (μm) 5.08 ± 0.33c 6.65 ± 0.52bc 5.68 ± 0.25c 5.72 ± 0.49c 9.34 ± 0.61a 7.44 ± 0.79b 0.002 0.001 0.194 FH (μm) 192.3 ± 45.58 215.64 ± 52.19 163.72 ± 24.81 187 ± 12.49 247.88 ± 36.67 224.01 ± 18.91 0.327 0.437 0.650 Values in the same row (multiple comparisons or main effects analysis) with different superscript letters are significantly different at p < 0.05, while the values for two-factor analysis of variance are less than 0.05, indicating significant differences at p < 0.05. Data are presented as mean ± SEM (n = 3). MT, muscularis thickness, FH, fold height. Table 5.
Effects of dietary protein-to-sea mud ratio on intestinal structure of A. japonicus.
-
Item PS no. (protein/sea mud) ANOVA (p value) PS1(10/30) PS2(10/45) PS3(10/60) PS4(13/30) PS5(13/45) PS6(13/60) Protein Sea mud Protein × sea mud ACP (King unit/[L]) 2.20 ± 0.18c 2.36 ± 0.42c 2.72 ± 0.35c 4.98 ± 0.28b 5.02 ± 0.25b 6.15 ± 0.47a 0.000 0.057 0.494 AKP (King unit /[L]) 0.23 ± 0.02bc 0.16 ± 0.01c 0.16 ± 0.03c 0.22 ± 0.02c 0.32 ± 0.01ab 0.36 ± 0.05a 0.000 0.420 0.003 SOD (U/[ml]) 10.72 ± 0.24 10.72 ± 0.77 10.62 ± 0.70 11.64 ± 0.24 12.32 ± 0.3 11.20 ± 0.78 0.045 0.571 0.667 CAT (U/[ml]) 1.64 ± 0.08c 2.20 ± 0.02b 2.11 ± 0.07b 2.14 ± 0.03b 3.10 ± 0.29a 2.17 ± 0.16b 0.001 0.000 0.034 LZM (U/[ml]) 120.83 ± 7.13bc 89.92 ± 9.78c 137.5 ± 18.29b 107.93 ± 4.22bc 169.74 ± 4.66a 89.38 ± 8.98c 0.458 0.226 0.000 Values in the same row (multiple comparisons or main effects analysis) with different superscript letters are significantly different at p < 0.05, while the values for two-factor analysis of variance are less than 0.05, indicating significant differences at p < 0.05. Data are presented as mean ± SEM (n = 3). ACP, Acid phosphatase; AKP, Alkaline phosphatase; SOD, Superoxide dismutase, CAT, Catalase, LZM, Lysozyme. The unit 'U/mL' indicates the number of enzyme activity units per mL of sample, reflecting the absolute enzyme activity concentration. The unit 'King unit/L' indicates the number of King units of enzyme activity per L of sample, based on the classic colorimetric assay method. Table 6.
Effects of dietary protein-to-sea mud ratio on antioxidant capacity in coelomocytes lysate of A. japonicus.
-
Item PS no. (protein/sea mud) ANOVA (p value) PS1(10/30) PS3(10/60) PS4(13/30) PS6(13/60) Protein Sea mud Protein × sea mud ACE 276.55 ± 28.53 323.05 ± 19.12 532.17 ± 153.18 447.06 ± 32.58 0.045 0.816 0.435 Chao 276.38 ± 28.52 322.80 ± 18.91 532.18 ± 153.11 446.80 ± 32.56 0.045 0.814 0.435 Shannon 2.99 ± 0.68 3.54 ± 0.09 4.62 ± 0.69 4.38 ± 0.12 0.036 0.758 0.442 Coverage 0.99 0.99 0.99 0.99 Table 7.
Effects of different dietary protein-to-sea mud ratio on gut microbial diversity of A.japonicus.
Figures
(6)
Tables
(7)