


-
The sea cucumber (Apostichopus japonicus) is an echinoderm of high economic importance, highly valued in the global aquatic market for its distinctive nutritional and medicinal properties[1]. With the growing market demand, intensive aquaculture of sea cucumber has become increasingly dependent on formulated feeds, which have progressively replaced or supplemented traditional substrates such as sea mud. Although this transition has markedly improved aquaculture yields, it has also led to several challenges, including environmental degradation in culture systems[2,3]. Therefore, developing efficient, environmentally friendly and sustainable feeds has become a critical goal for ensuring the high-quality and sustainable growth of the sea cucumber industry.
In formulated feeds for sea cucumber, protein is the most critical and costly nutrient, playing a direct role in regulating growth and tissue repair[4]. However, as a benthic deposit feeder, A. japonicus possesses a digestive system evolutionarily adapted to process organic-rich sediments[5]. This creates a fundamental challenge in feed formulation: balancing the inclusion of high-cost, protein-rich ingredients with the animal's physiological dependence on sediment components, particularly sea mud. From a nutritional standpoint, protein serves not only as a structural and functional nutrient, but also provides hydrolyzed products that supply essential amino acids and metabolic energy[6,7]. In contrast, sea mud is far more than a feed filler; it contributes to normal intestinal function by facilitating the mechanical breakdown of feed, while also providing micro-organisms, trace elements, and undefined growth factors beneficial to the host[8,9].
Nevertheless, excessive reliance on sea mud in aquaculture systems can lead to sediment degradation and environmental stress. The dietary protein-to-sea mud ratio must therefore be optimized according to the feeding habits, body size, and physiological condition of the sea cucumber[10]. Either excessively high or low ratios can induce digestive dysfunction, nutrient imbalance, or reduced feed intake[11,12]. Furthermore, feeding strategies substantially affect intestinal microbiota composition, which plays a pivotal role in modulating digestion, nutrient absorption, and immune regulation, ultimately influencing growth and overall health[13,14]. Although previous studies have examined the individual effects of dietary protein and sea mud levels, their interactive influence on sea cucumber physiology remains largely unexplored. This knowledge gap limits the development of precision feed formulations. Importantly, determining the optimal dietary protein-to-sea mud ratio is not only a nutritional concern, but also ecologically relevant—it directly affects nutrient utilization efficiency, waste output, and intestinal health, all of which are critical to sustainable aquaculture practices.
This study aimed to determine the optimal dietary protein-to-sea mud ratio for A. japonicus by evaluating growth performance, digestive and immune responses, and intestinal health under different protein and sea mud levels. To achieve this goal, we first proposed the hypothesis that an appropriate dietary protein-to-sea mud ratio would optimize gut microbiota and digestive physiology, thereby synergistically enhancing the growth and immune performance of A. japonicus. The findings are expected to provide a theoretical basis for formulating nutritionally balanced and environmentally sustainable diets to support the sustainable intensification of sea cucumber aquaculture.
-
Sargassum meal, fish meal, soybean meal, and wheat flour were used as the main protein sources. Dietary protein and sea mud levels were used as the experimental factors. Two protein levels (10% and 13%) and three sea mud levels (30%, 45%, and 60%) were designed, producing six experimental diets designated as PS1, PS2, PS3, PS4, PS5, and PS6 (Table 1). The sea mud used in this study was obtained from Weihai Andong Marine Aquaculture Co., Ltd (Xiapu, Fujian Province, China). All powdered ingredients were passed through a 60-mesh sieve before use. The ingredients were weighed according to their respective formulations and pre-blended using a stepwise dilution method. Distilled water was added to achieve a suitable consistency, and the mixture was thoroughly homogenized using a mixer. The resulting dough was oven-dried at 45 °C, then hermetically sealed and stored at −20 °C until use.
Table 1. Formulation and proximate composition of the experimental diets (% dry matter).
Ingredients (%) PS no. (protein/sea mud) PS1(10/30) PS2(10/45) PS3(10/60) PS4(13/30) PS5(13/45) PS6(13/60) Sea mud 30.00 45.00 60.00 30.00 45.00 60.00 Sargassum meal 40.00 30.00 20.00 40.00 30.00 20.00 Fish meal1 2.00 2.00 2.00 3.00 3.00 3.00 Soybean meal 3.00 3.00 3.00 4.00 4.00 4.00 Wheat flour 23.00 14.2 6.00 18.00 9.20 1.00 Casein 0.00 3.00 5.50 3.00 6.00 8.50 Microcrystalline cellulose 0.00 0.80 1.50 0.00 0.80 1.50 Vitamin premix2 1.00 1.00 1.00 1.00 1.00 1.00 Mineral premix3 1.00 1.00 1.00 1.00 1.00 1.00 Proximate composition (%) Crude protein 10.50 10.70 10.22 13.20 13.60 13.20 Crude lipid 1.46 1.85 2.76 2.09 2.06 2.55 Protein/sea mud 0.34 0.23 0.17 0.44 0.30 0.22 1 Fish meal, Xiamen Jiakang feeds group Corp., Ltd, imported from Peru. 2, 3 Mineral premix and vitamin premix were prepared following our recent study[15]. Sea cucumbers and feeding trial
-
Juvenile sea cucumbers were obtained from Weihai Andong Marine Aquaculture Co., Ltd (Xiapu, Fujian Province, China), and were temporarily reared in cleaned, disinfected culture tanks at the Fujian Fisheries Research Institute. They were acclimated to a commercial feed for 2 weeks. Prior to the trial, sea cucumbers were fasted for 24 h. A total of 360 healthy individuals with similar body weights (5.40 ± 0.03 g) were randomly selected and assigned to six dietary treatments, each with three replicates (20 individuals per replicate). The feeding trial was conducted in 45-L recirculating aquaculture tanks (45 cm × 40 cm × 40 cm) at the experimental base of the Fujian Fisheries Research Institute.
The sea cucumbers were fed to apparent satiation once daily at 10:00 for 60 d. Before feeding, diets were mixed with seawater to form a uniform slurry for better dispersion and palatability. The initial feeding rate was set at 5% of the total body weight and was adjusted daily based on the previous day's consumption. Residual feed and feces were removed daily, and ⅓ of the water volume was replaced. Tanks were thoroughly cleaned every 2 weeks. The culture environment was maintained under low light, with water temperature at 20–22 °C, pH 7.6–8.3, dissolved oxygen above 5 mg/L, and ammonia-nitrogen and nitrite concentrations below 0.05 mg/L.
Sample collection
-
At the end of the feeding trial, sea cucumbers were fasted for 24 h. The number of survivors in each tank was recorded, and all individuals were weighed to calculate survival rate (SR), weight gain rate (WGR), and specific growth rate (SGR). Ten individuals from each tank were randomly selected and anesthetized in an ice bath. Excess surface moisture was removed with a sterile gauze, and each individual was weighed. Coelomic fluid was collected using 1-mL sterile syringes, left to stand at 4 °C for 2 h, and then centrifuged at 6,000 × g for 10 min. The supernatant was stored at −80 °C for subsequent analysis. Immediately after coelomic fluid collection, the sea cucumbers were dissected. The visceral mass, body wall, and intestine were weighed to calculate the intestinal-to-body wall ratio (IBR). Portions of intestinal tissue were stored at −80 °C for subsequent analyses of digestive enzyme activities, antioxidant indices, and intestinal microbiota. A 0.3–0.5 cm segment of the anterior intestine was also fixed in tissue fixative for 24 h and then stored at 4 °C for histological examination.
Analytical methods
Proximate composition
-
The proximate composition of feeds and body wall samples was determined according to AOAC (1995) methods[16]: moisture by oven-drying at 105 °C, crude protein by Dumas combustion, and crude lipid by ether extraction.
Biochemistry analyses
-
Lysozyme (LZM) activity, and antioxidant parameters—including superoxide dismutase (SOD), alkaline phosphatase (AKP), acid phosphatase (ACP), catalase (CAT)— were measured in coelomic fluid using commercial assay kits (Jiancheng Biotech. Co., Nanjing, China).
Intestinal tissue samples were homogenized on ice with nine volumes (w/v) of 0.86% NaCl solution, and centrifuged at 2,000 × g for 10 min. The supernatant was collected for enzyme assays. Protein concentration was determined using a BCA protein assay kit (Solarbio Co., Beijing, China). The activities of lipase (LPS), amylase (AMS), and trypsin (TPS) were determined using commercial assay kits (Jiancheng Biotech. Co., Nanjing, China). All enzyme activities were measured using a multifunctional microplate reader (Infinite Nano Quant, TECAN, Vienna, Austria).
Histological examination
-
The fixed intestinal tissues were dehydrated in graded ethanol, cleared with xylene, and embedded in paraffin. Tissue blocks (0.5 cm × 0.3 cm × 0.3 cm) were sectioned and stained with hematoxylin-eosin (H&E), then mounted with neutral balsam. For each sample, nine non-consecutive sections were observed under a 40 × objective lens using an upright microscope (Leica D5500B, Wetzlar, Germany). The muscularis thickness (MT) and fold height (FH) were measured using Shortline image analysis software.
Gut microbiota
-
Based on the distinct growth performance, four groups (PS1, PS2, PS3, and PS4) were selected for 16S rRNA high-throughput sequencing. Intestinal microbial DNA was extracted from six pooled samples (three replicates per group) using a commercial extraction kit (Vazyme Biotech Co., Nanjing, China). Tag Illumina sequencing was performed on the V3-V4 region of the 16S rRNA gene using an ABI GeneAmp® 9700 PCR System (Thermo Fisher Scientific, Singapore) to construct a microbial community library. PCR amplification of the bacterial 16S rDNA was performed using universal primers 338F(5'-ACTCCTACGGGAGGCAGCAG-3'), and 806R(5'-GACTACHVGGGTATCTAATCC-3'). The amplification protocol consisted of initial denaturation at 95 °C for 3 min, followed by 30 cycles of denaturation (95 °C, 30 s), annealing (53 °C, 30 s), and extension (72 °C, 45 s), with a final extension at 72 °C for 10 min.
Sequencing and library construction was performed by Shanghai MajorBio Technology Co., Ltd. (Shanghai, China). Bioinformatics analysis was carried out on the MajorBio Cloud platform. Raw FASTQ files were processed using QIIME 2.0. Sequences were clustered into operational taxonomic units (OTUs) at 97% similarity using UPARSE, and denoised using the DADA2 algorithm to generate amplicon sequence variants (ASVs). Alpha-diversity indices (Ace, Chao, and Shannon) were calculated using Mothur v1.43.0. R software v3.6.0 was used for statistical analysis and visualization of microbial community structures across taxonomic levels.
Statistical analysis
-
All statistical analysis and figures were produced using SPSS 27.0 (IBM Corp., Armonk, NY, USA) and GraphPad Prism 8.0.2 (GraphPad Software, San Diego, USA). Data normality and homogeneity of variance were verified using the Shapiro–Wilk and Levene's tests, respectively. One-way and two-way analyses of variance (ANOVA) were performed to evaluate the effects of protein levels, sea mud levels, and their interactions. When significant differences were detected, Duncan's multiple range test was applied for post hoc comparisons. Differences were considered statistically significant at p < 0.05. All results are expressed as mean ± standard error of the mean (SEM).
-
At the same dietary protein level, FBW, WGR, and SGR of sea cucumber increased with rising dietary sea mud levels, with all three parameters peaking in the PS6 group (p < 0.05; Table 2). At the same dietary sea mud level, the 13% dietary protein group exhibited significantly higher FBW, WGR and SGR than the 10% protein group (p < 0.05). Notably, the 10% protein diets failed to promote growth at low sea mud levels (30%–45%).
Table 2. Effects of dietary protein-to-sea mud ratio on growth performance of A. japonicus.
Item PS no. (protein/sea mud) ANOVA (p value) PS1(10/30) PS2(10/45) PS3(10/60) PS4(13/30) PS5(13/45) PS6(13/60) Protein Sea mud Protein x sea mud IBW (g)1 5.37 ± 0.01 5.40 ± 0.02 5.42 ± 0.02 5.40 ± 0.01 5.40 ± 0.03 5.39 ± 0.03 FBW (g)2 4.74 ± 0.72b 5.36 ± 0.14b 5.76 ± 0.84b 5.29 ± 0.34b 7.55 ± 0.93a 7.78 ± 0.45a 0.005 0.022 0.321 WGR (%)3 −11.67 ± 13.59b −0.71 ± 2.30b 6.31 ± 15.67b −2.22 ± 6.10b 39.57 ± 16.68a 44.28 ± 7.80a 0.005 0.021 0.297 SGR (%)4 −0.27 ± 0.30c −0.01 ± 0.04bc 0.07 ± 0.28abc −0.05 ± 0.11c 0.58 ± 0.24ab 0.65 ± 0.10a 0.011 0.038 0.553 IBR (%)5 2.69 ± 1.22c 4.13 ± 0.36bc 3.94 ± 0.45bc 3.46 ± 0.44bc 4.82 ± 0.16ab 6.48 ± 0.20a 0.017 0.011 0.245 SR (%)6 100.00 ± 0.00a 100.00 ± 0.00a 93.33 ± 1.67b 96.67 ± 1.67ab 96.67 ± 3.33ab 98.33 ± 1.67ab 0.712 0.312 0.061 Values in the same row (multiple comparisons or main effects analysis) with different superscript letters are significantly different (p < 0.05), while the values for two-factor analysis of variance are less than 0.05, indicating significant differences at p < 0.05. Data are presented as mean ± S.E.M. (n = 3).1 IBW (g) = initial body weight. 2 FBW (g) = final body weight. 3 Weight gain rate (WGR, %) = (final body weight–initial body weight)/initial body weight × 100. 4 Specific growth rate (SGR, % day−1) = (ln final body weight–ln initial body weight)/feeding days × 100. 5 Intestinal to body wall ratio (IBR, %) = intestinal weight/body weight (wet weight). 6 Survival rate (SR, %) = 100 × (final number/initial number of sea cucumbers).wall SR across all groups ranged from 93.3% to 100%, with the highest values observed in PS1 and PS2; no significant differences were detected among the remaining groups (p > 0.05). The IBR increased significantly with a simultaneous increase in dietary protein and sea mud levels (p < 0.05).
No significant differences were observed in body-wall crude lipid content among all treatments (p > 0.05; Table 3). Moisture content differed significantly only in the PS4 group (p < 0.05), while no differences were detected among the other groups (p > 0.05). Changes in body-wall crude protein content was related to dietary protein levels: at 10% protein, crude protein content increased significantly with higher sea mud levels (p < 0.05); however, at 13% protein, it showed a decreasing but non-significant trend as sea mud levels increased (p > 0.05).
Table 3. Effects of dietary protein-to-sea mud ratio on body-wall composition of A. japonicus (%).
Item PS no. (protein/sea mud) ANOVA (p value) PS1(10/30) PS2(10/45) PS3(10/60) PS4(13/30) PS5(13/45) PS6(13/60) Protein Sea mud Protein × sea mud Moisture 89.50 ± 0.17ab 89.39 ± 0.10ab 89.80 ± 0.09a 88.95 ± 0.49b 90.03 ± 0.06a 90.19 ± 0.27a 0.441 0.027 0.074 Crude protein 54.83 ± 0.75b 57.17 ± 1.41ab 61.67 ± 1.58a 58.53 ± 2.03ab 57.30 ± 1.67ab 54.57 ± 0.97b 0.381 0.626 0.009 Crude lipid 2.30 ± 0.34 3.12 ± 0.21 2.84 ± 0.83 2.52 ± 0.23 2.60 ± 0.23 2.43 ± 0.09 0.481 0.544 0.625 Values in the same row (multiple comparisons or main effects analysis) with different superscript letters are significantly different at p < 0.05, while the values for two-factor analysis of variance are less than 0.05, indicating significant differences at p < 0.05. Data are presented as mean ± SEM (n = 3). Intestinal structure and digestive enzymes
-
Intestinal trypsin and lipase activities increased significantly at higher dietary protein and sea mud levels (p < 0.05; Table 4). Although intestinal amylase activity showed an increasing trend as protein and sea mud levels increased, differences among groups were not significant (p > 0.05). Histological observations (H&E staining) revealed a gradual thickening of the intestinal wall and an increase in fold height with rising dietary protein and sea mud levels (Fig. 1). The highest muscularis thickness was observed in the PS5 groups, which was significantly greater than the other groups (p < 0.05; Table 5).
Table 4. Effects of dietary protein-to-sea mud ratio on digestive enzyme activity in the intestine of A. japonicus (U/[mg prot]).
Item PS no. (protein/sea mud) ANOVA (p value) PS1(10/30) PS2(10/45) PS3(10/60) PS4(13/30) PS5(13/45) PS6(13/60) Protein Sea mud Protein × sea mud TPS 196.35 ± 60.27c 324.31 ± 30.08bc 362.3 ± 103.23bc 385.85 ± 29.88bc 570.93 ± 47.55ab 736.57 ± 194.26a 0.005 0.059 0.631 LPS 1.52 ± 0.12b 1.34 ± 0.01b 2.07 ± 0.10ab 1.97 ± 0.29ab 2.51 ± 0.40a 2.56 ± 0.19a 0.002 0.071 0.245 AMS 0.12 ± 0.01 0.13 ± 0.07 0.12 ± 0.01 0.13 ± 0.01 0.14 ± 0.01 0.16 ± 0.01 0.506 0.841 0.807 Values in the same row (multiple comparisons or main effects analysis) with different superscript letters are significantly different at p < 0.05, while the values for two-factor analysis of variance are less than 0.05, indicating significant differences at p < 0.05. Data are presented as mean ± SEM (n = 3). TPS, Trypsin; LPS, Lipase; AMS, Amylase. The unit 'U/(mg prot)' indicates the amount of enzyme activity units per mg of soluble protein in the sample, reflecting the specific activity of the enzyme. 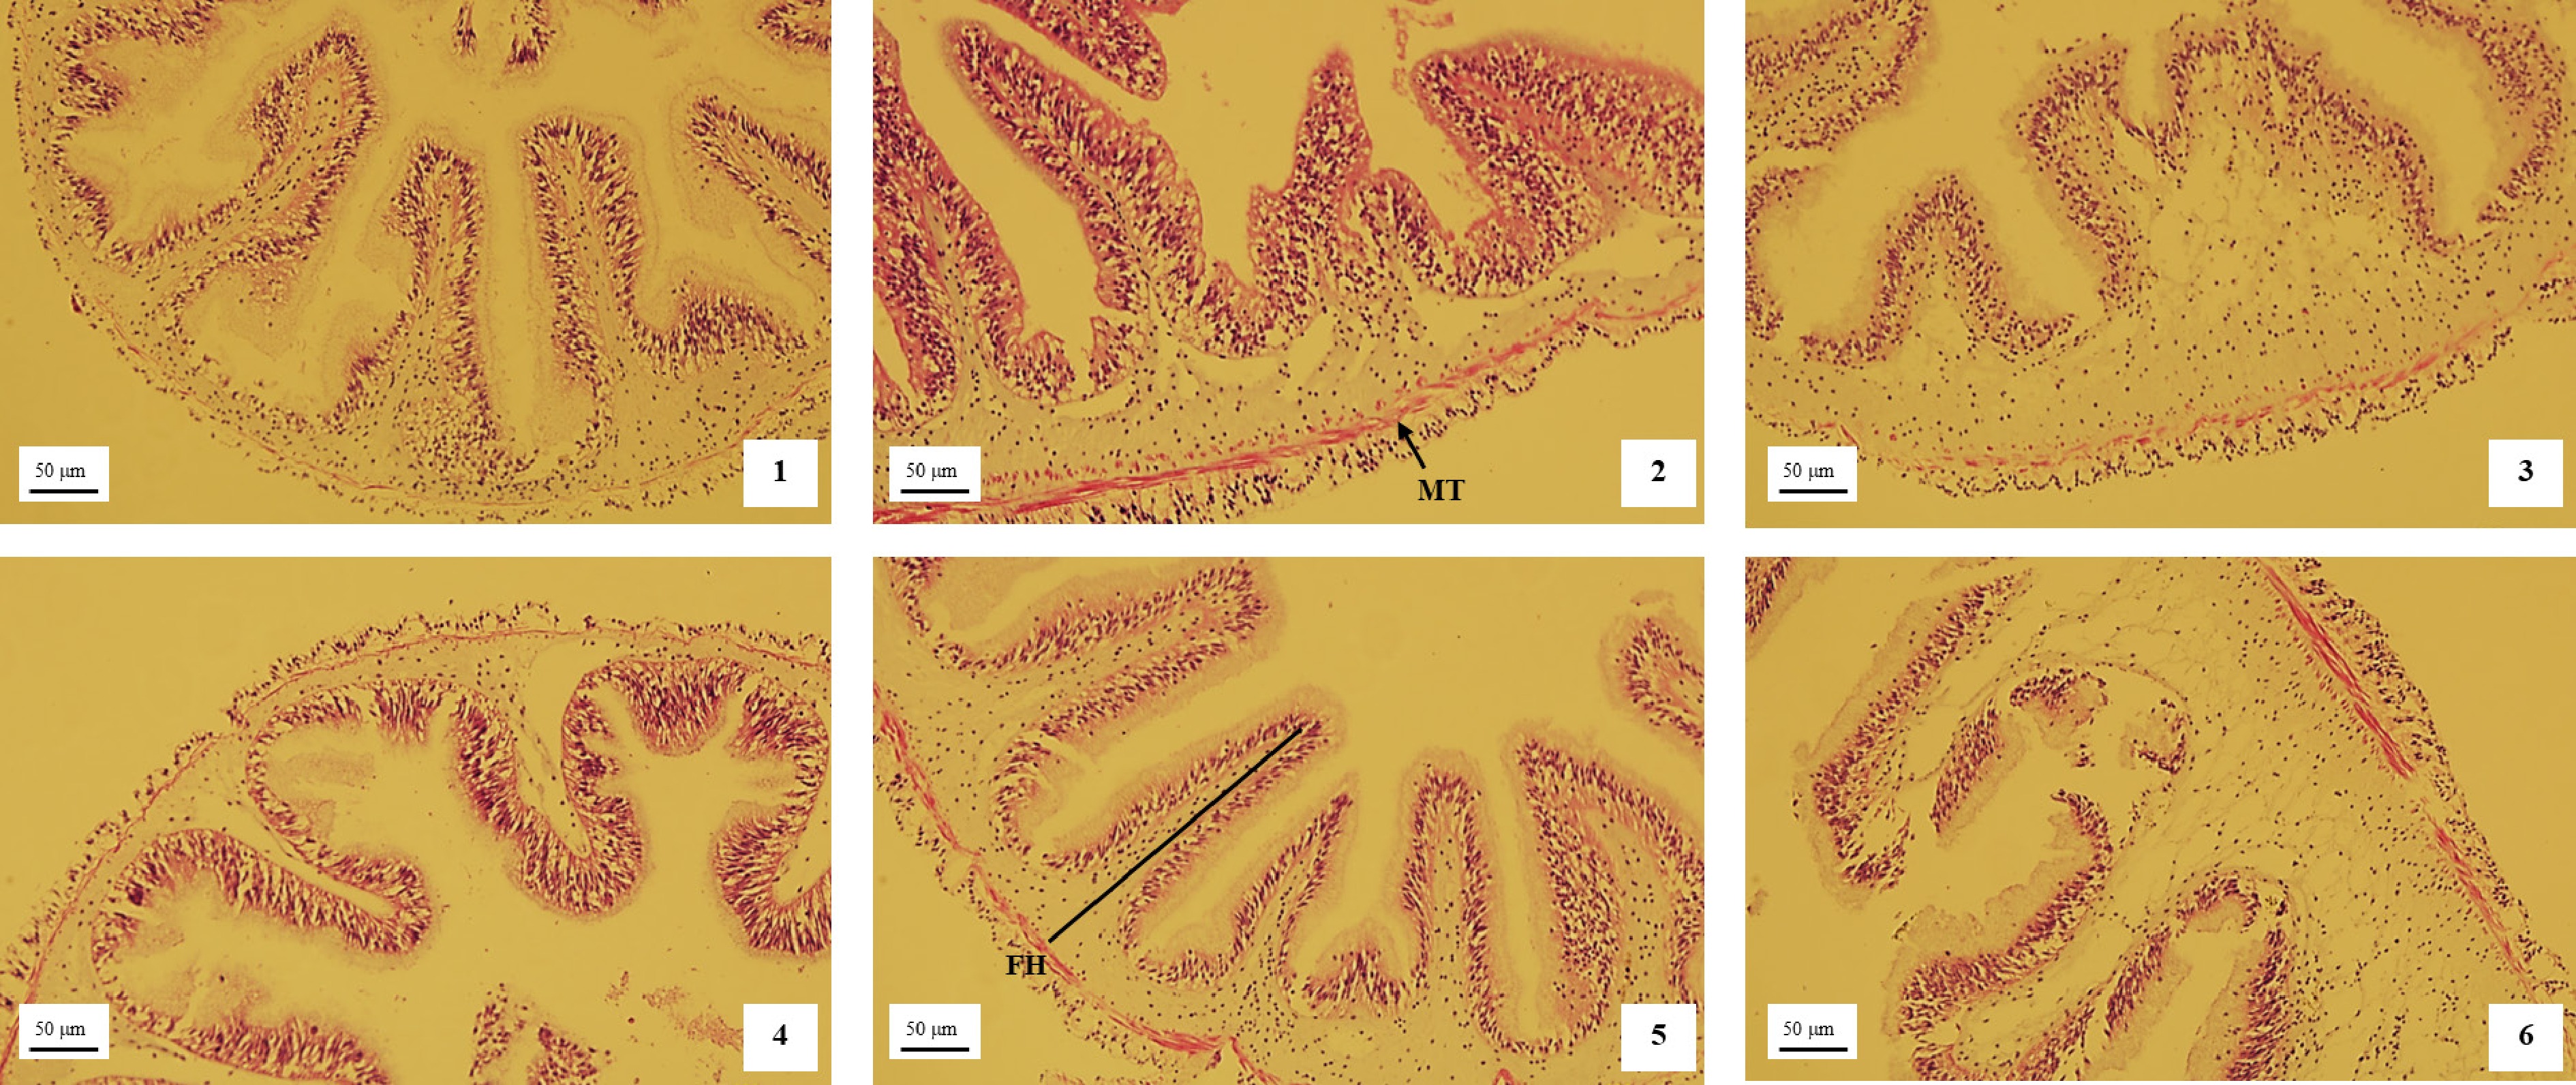
Figure 1.
Effects of dietary protein-to-sea mud ratio on intestinal morphology in A. japonicus (× 40). MT, muscularis thickness. FH, fold height. Histological observations (H&E staining) revealed a gradual thickening of the intestinal wall and an increase in fold height with rising dietary protein and sea mud levels.
Table 5. Effects of dietary protein-to-sea mud ratio on intestinal structure of A. japonicus.
Item PS no. (protein/sea mud) ANOVA (p value) PS1(10/30) PS2(10/45) PS3(10/60) PS4(13/30) PS5(13/45) PS6(13/60) Protein Sea mud Protein × sea mud MT (μm) 5.08 ± 0.33c 6.65 ± 0.52bc 5.68 ± 0.25c 5.72 ± 0.49c 9.34 ± 0.61a 7.44 ± 0.79b 0.002 0.001 0.194 FH (μm) 192.3 ± 45.58 215.64 ± 52.19 163.72 ± 24.81 187 ± 12.49 247.88 ± 36.67 224.01 ± 18.91 0.327 0.437 0.650 Values in the same row (multiple comparisons or main effects analysis) with different superscript letters are significantly different at p < 0.05, while the values for two-factor analysis of variance are less than 0.05, indicating significant differences at p < 0.05. Data are presented as mean ± SEM (n = 3). MT, muscularis thickness, FH, fold height. Coelomocyte liquid immunological enzymes
-
Coelomic fluid SOD activity tended to increase with rising dietary protein and sea mud levels, although no significant differences were detected among groups (p > 0.05; Table 6). In contrast, ACP activity increased significantly at higher protein and sea mud levels (p < 0.05). AKP activity generally showed an upward trend with the elevation of dietary protein and sea mud levels; however, within the same protein level, varying sea mud levels had no significant effect (p > 0.05). Furthermore, catalase (CAT) and lysozyme (LZM) activities in the coelomic fluid differed significantly among treatments (p < 0.05), both reaching their highest values in PS5.
Table 6. Effects of dietary protein-to-sea mud ratio on antioxidant capacity in coelomocytes lysate of A. japonicus.
Item PS no. (protein/sea mud) ANOVA (p value) PS1(10/30) PS2(10/45) PS3(10/60) PS4(13/30) PS5(13/45) PS6(13/60) Protein Sea mud Protein × sea mud ACP (King unit/[L]) 2.20 ± 0.18c 2.36 ± 0.42c 2.72 ± 0.35c 4.98 ± 0.28b 5.02 ± 0.25b 6.15 ± 0.47a 0.000 0.057 0.494 AKP (King unit /[L]) 0.23 ± 0.02bc 0.16 ± 0.01c 0.16 ± 0.03c 0.22 ± 0.02c 0.32 ± 0.01ab 0.36 ± 0.05a 0.000 0.420 0.003 SOD (U/[ml]) 10.72 ± 0.24 10.72 ± 0.77 10.62 ± 0.70 11.64 ± 0.24 12.32 ± 0.3 11.20 ± 0.78 0.045 0.571 0.667 CAT (U/[ml]) 1.64 ± 0.08c 2.20 ± 0.02b 2.11 ± 0.07b 2.14 ± 0.03b 3.10 ± 0.29a 2.17 ± 0.16b 0.001 0.000 0.034 LZM (U/[ml]) 120.83 ± 7.13bc 89.92 ± 9.78c 137.5 ± 18.29b 107.93 ± 4.22bc 169.74 ± 4.66a 89.38 ± 8.98c 0.458 0.226 0.000 Values in the same row (multiple comparisons or main effects analysis) with different superscript letters are significantly different at p < 0.05, while the values for two-factor analysis of variance are less than 0.05, indicating significant differences at p < 0.05. Data are presented as mean ± SEM (n = 3). ACP, Acid phosphatase; AKP, Alkaline phosphatase; SOD, Superoxide dismutase, CAT, Catalase, LZM, Lysozyme. The unit 'U/mL' indicates the number of enzyme activity units per mL of sample, reflecting the absolute enzyme activity concentration. The unit 'King unit/L' indicates the number of King units of enzyme activity per L of sample, based on the classic colorimetric assay method. Intestinal microbiota
-
A total of 30,537–46,596 effective sequences were obtained from the intestinal samples of A. japonicus. After denoising, 231 to 761 ASV were obtained. At different ASV levels, rarefaction curves were performed (Fig. 2). The wider the range covered by the curve on the horizontal axis, the higher the species abundance in this study.
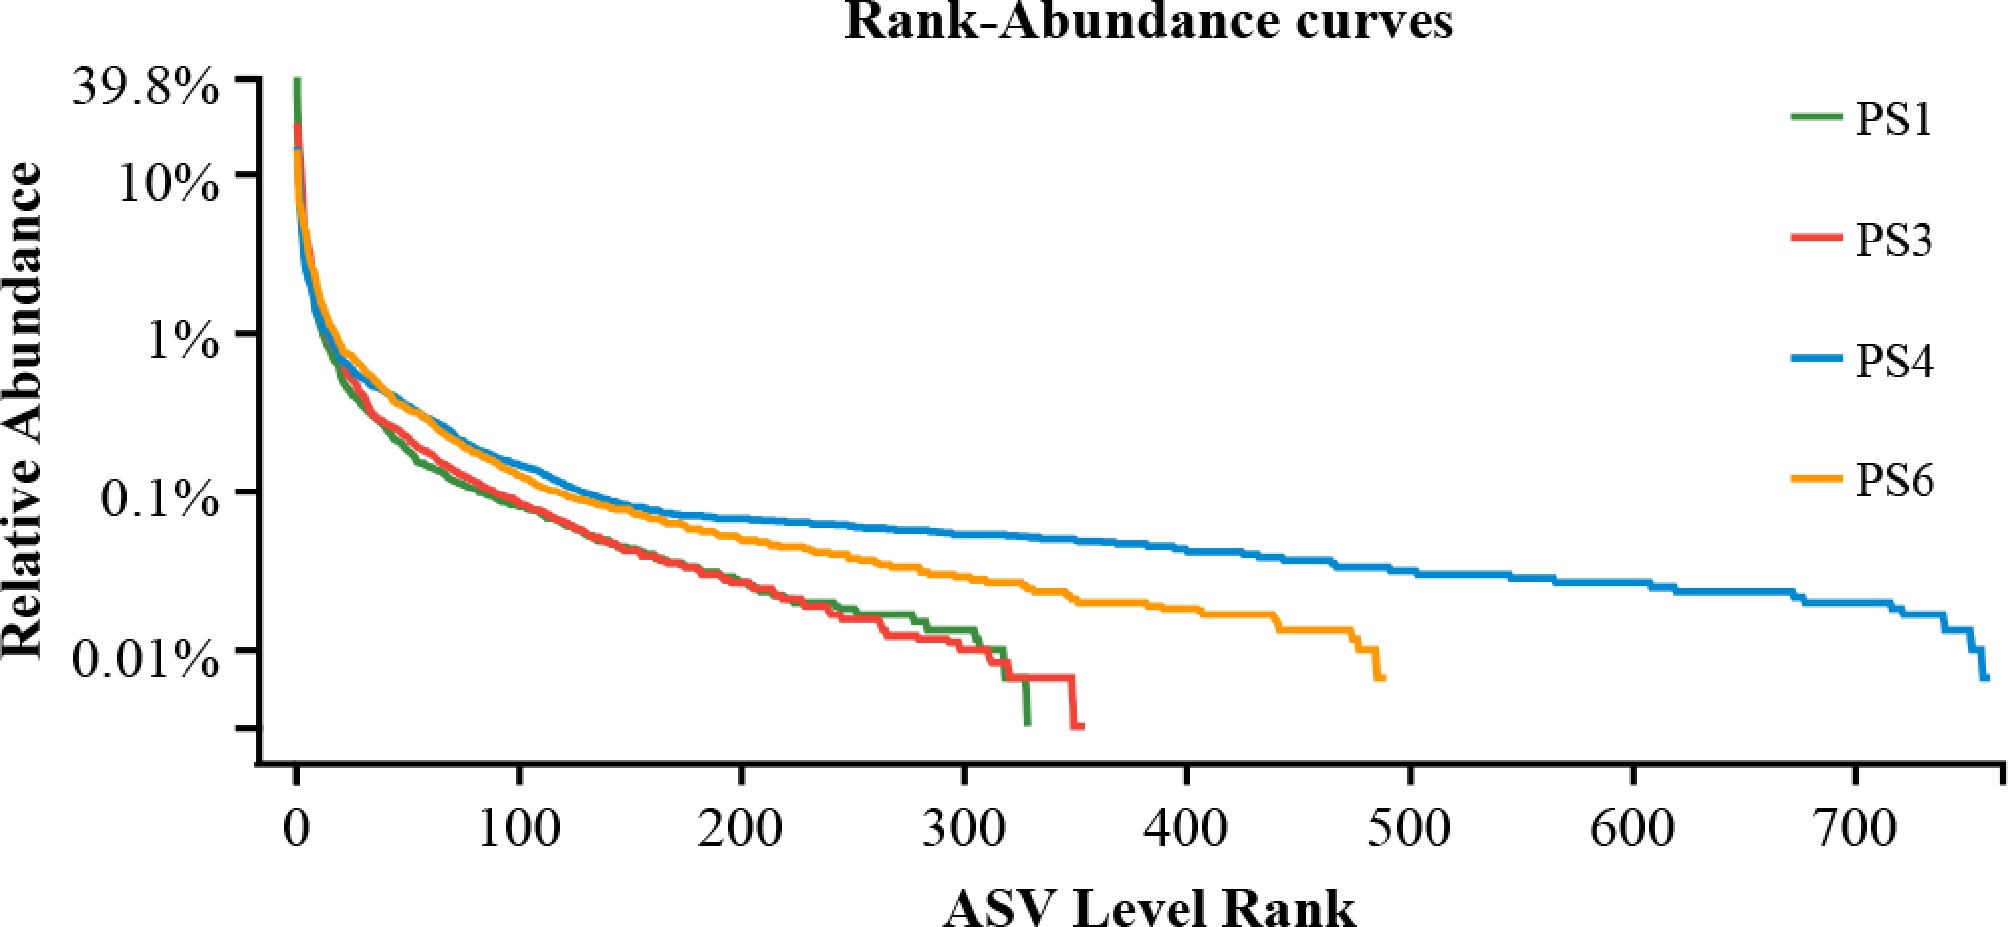
Figure 2.
Rarefaction curves of species richness and evenness in the gut samples of A. japonicus.
Alpha diversity analysis
-
Alpha diversity indices of the intestinal microbiota exhibited distinct patterns under different dietary treatments. At the dietary protein level of 10%, increasing sea mud inclusion enhanced microbial richness and diversity, as reflected by higher Observed_species, Shannon, ACE, and Chao indices (Table 7). All groups had a Coverage index exceeding 0.99, with no significant differences among treatments (p > 0.05).
Table 7. Effects of different dietary protein-to-sea mud ratio on gut microbial diversity of A.japonicus.
Item PS no. (protein/sea mud) ANOVA (p value) PS1(10/30) PS3(10/60) PS4(13/30) PS6(13/60) Protein Sea mud Protein × sea mud ACE 276.55 ± 28.53 323.05 ± 19.12 532.17 ± 153.18 447.06 ± 32.58 0.045 0.816 0.435 Chao 276.38 ± 28.52 322.80 ± 18.91 532.18 ± 153.11 446.80 ± 32.56 0.045 0.814 0.435 Shannon 2.99 ± 0.68 3.54 ± 0.09 4.62 ± 0.69 4.38 ± 0.12 0.036 0.758 0.442 Coverage 0.99 0.99 0.99 0.99 Beta diversity analysis
-
Beta diversity was used to analyze the differences in gut microbial communities. Nonmetric multidimensional scaling (NMDS) showed that there was a significant difference between different groups (stress = 0.084) (Fig. 3). Similar trends were found in cluster analysis (Fig. 4). The cluster analysis based on the Bray-Curtis distance algorithm revealed that samples PS1 and PS3 were more closely related, whereas PS4 and P6 were grouped together in a distinct cluster.
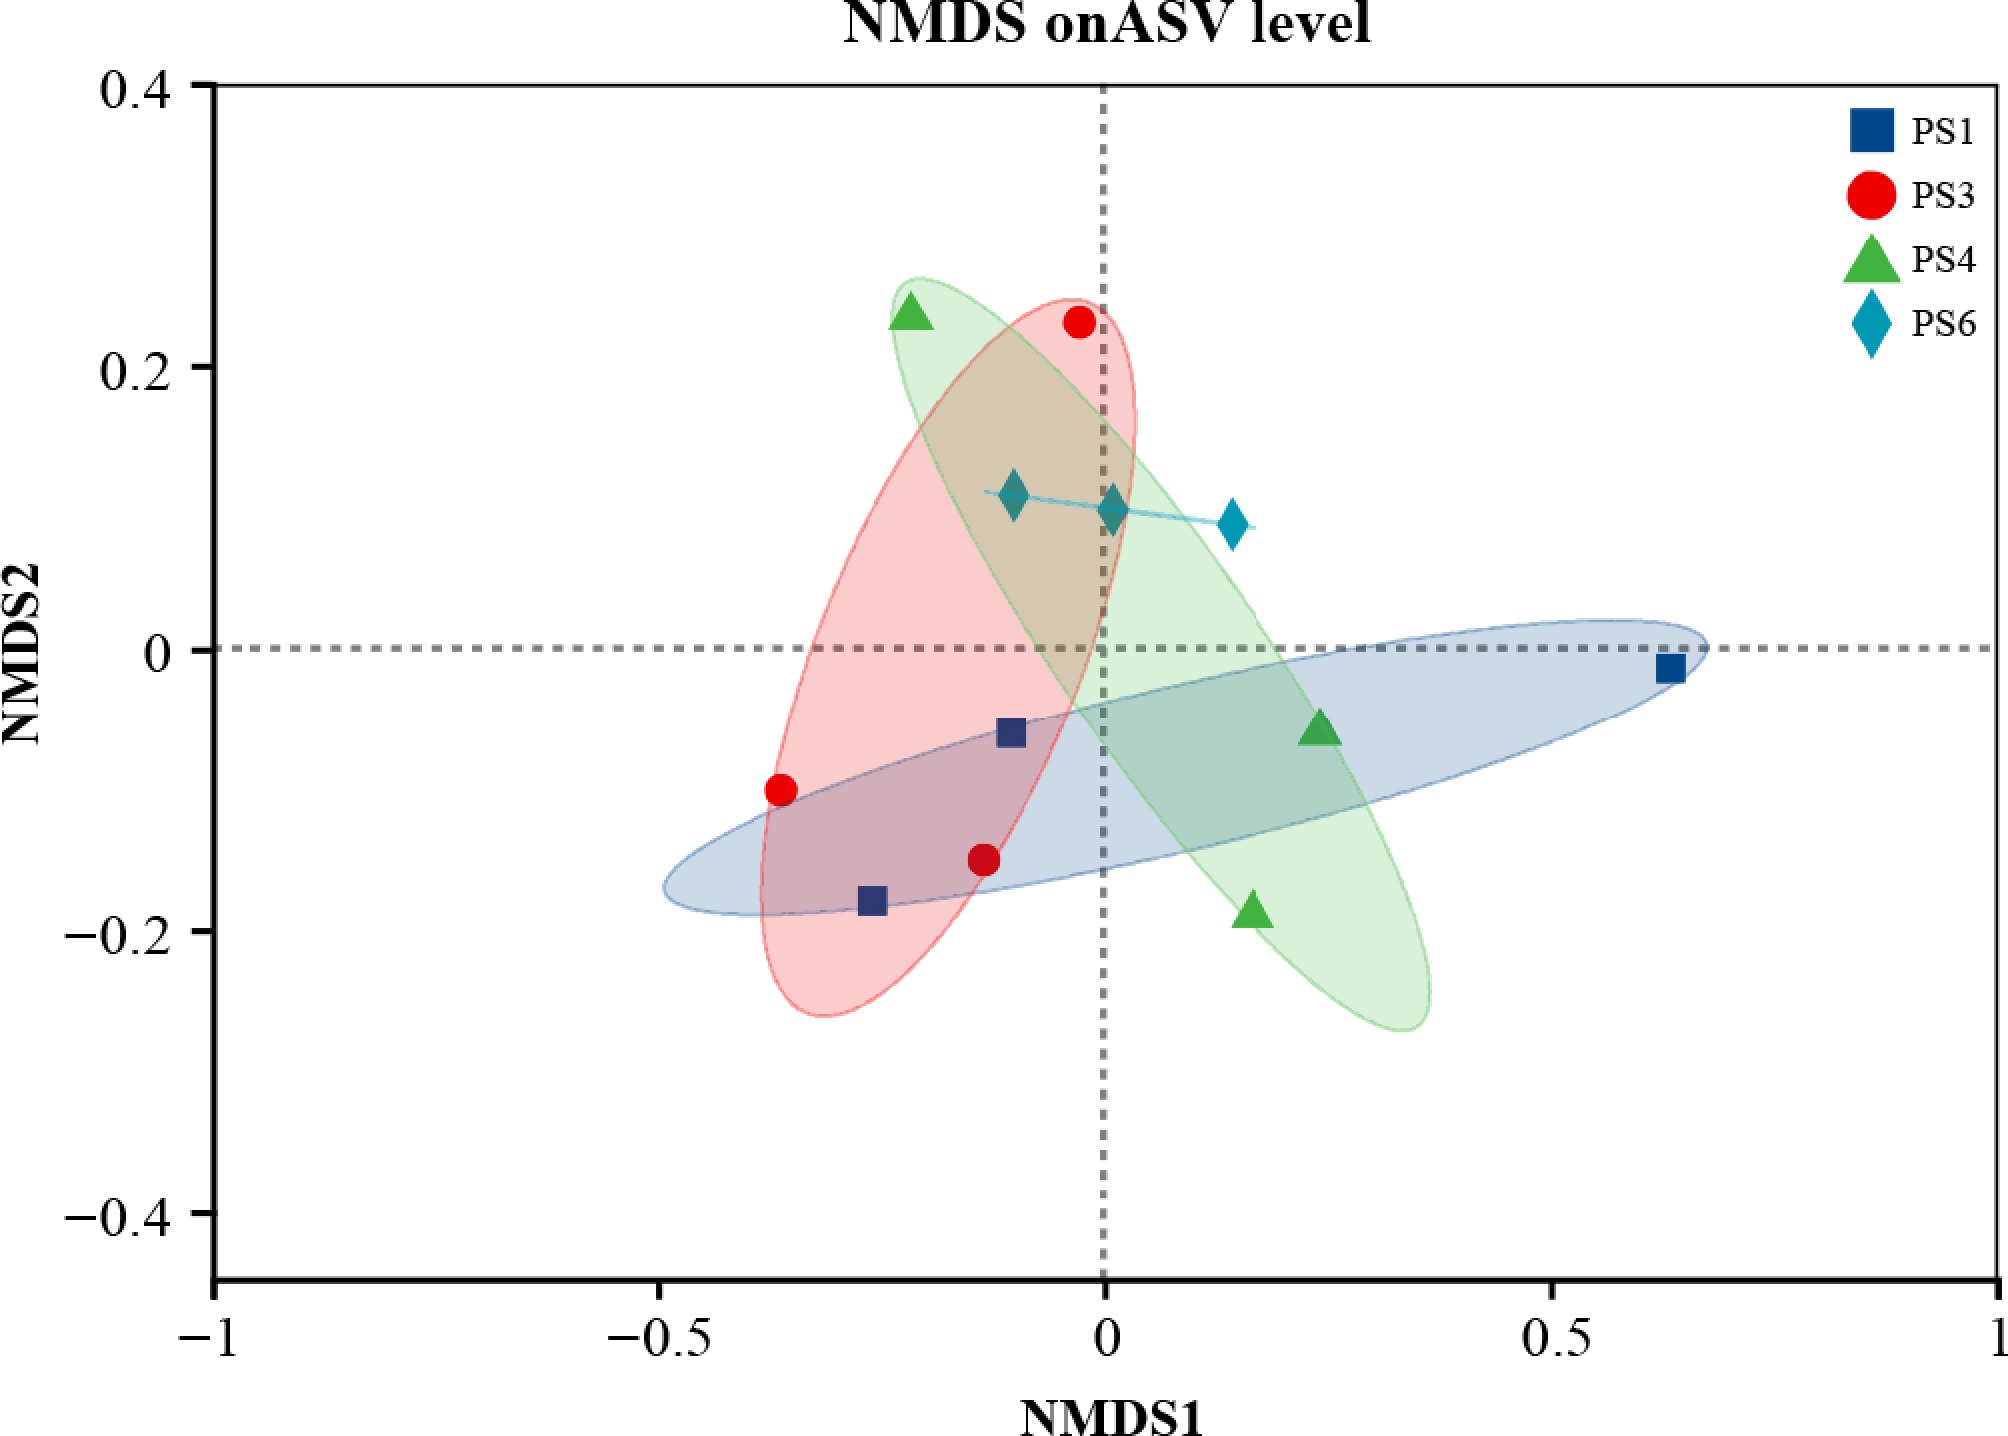
Figure 3.
Nonmetric multidimensional scaling (NMDS) analysis of the intestinal bacterial community of A. japonicus. Notes: stress < 0.2 indicates that NMDS can accurately reflect the degree of difference between samples.
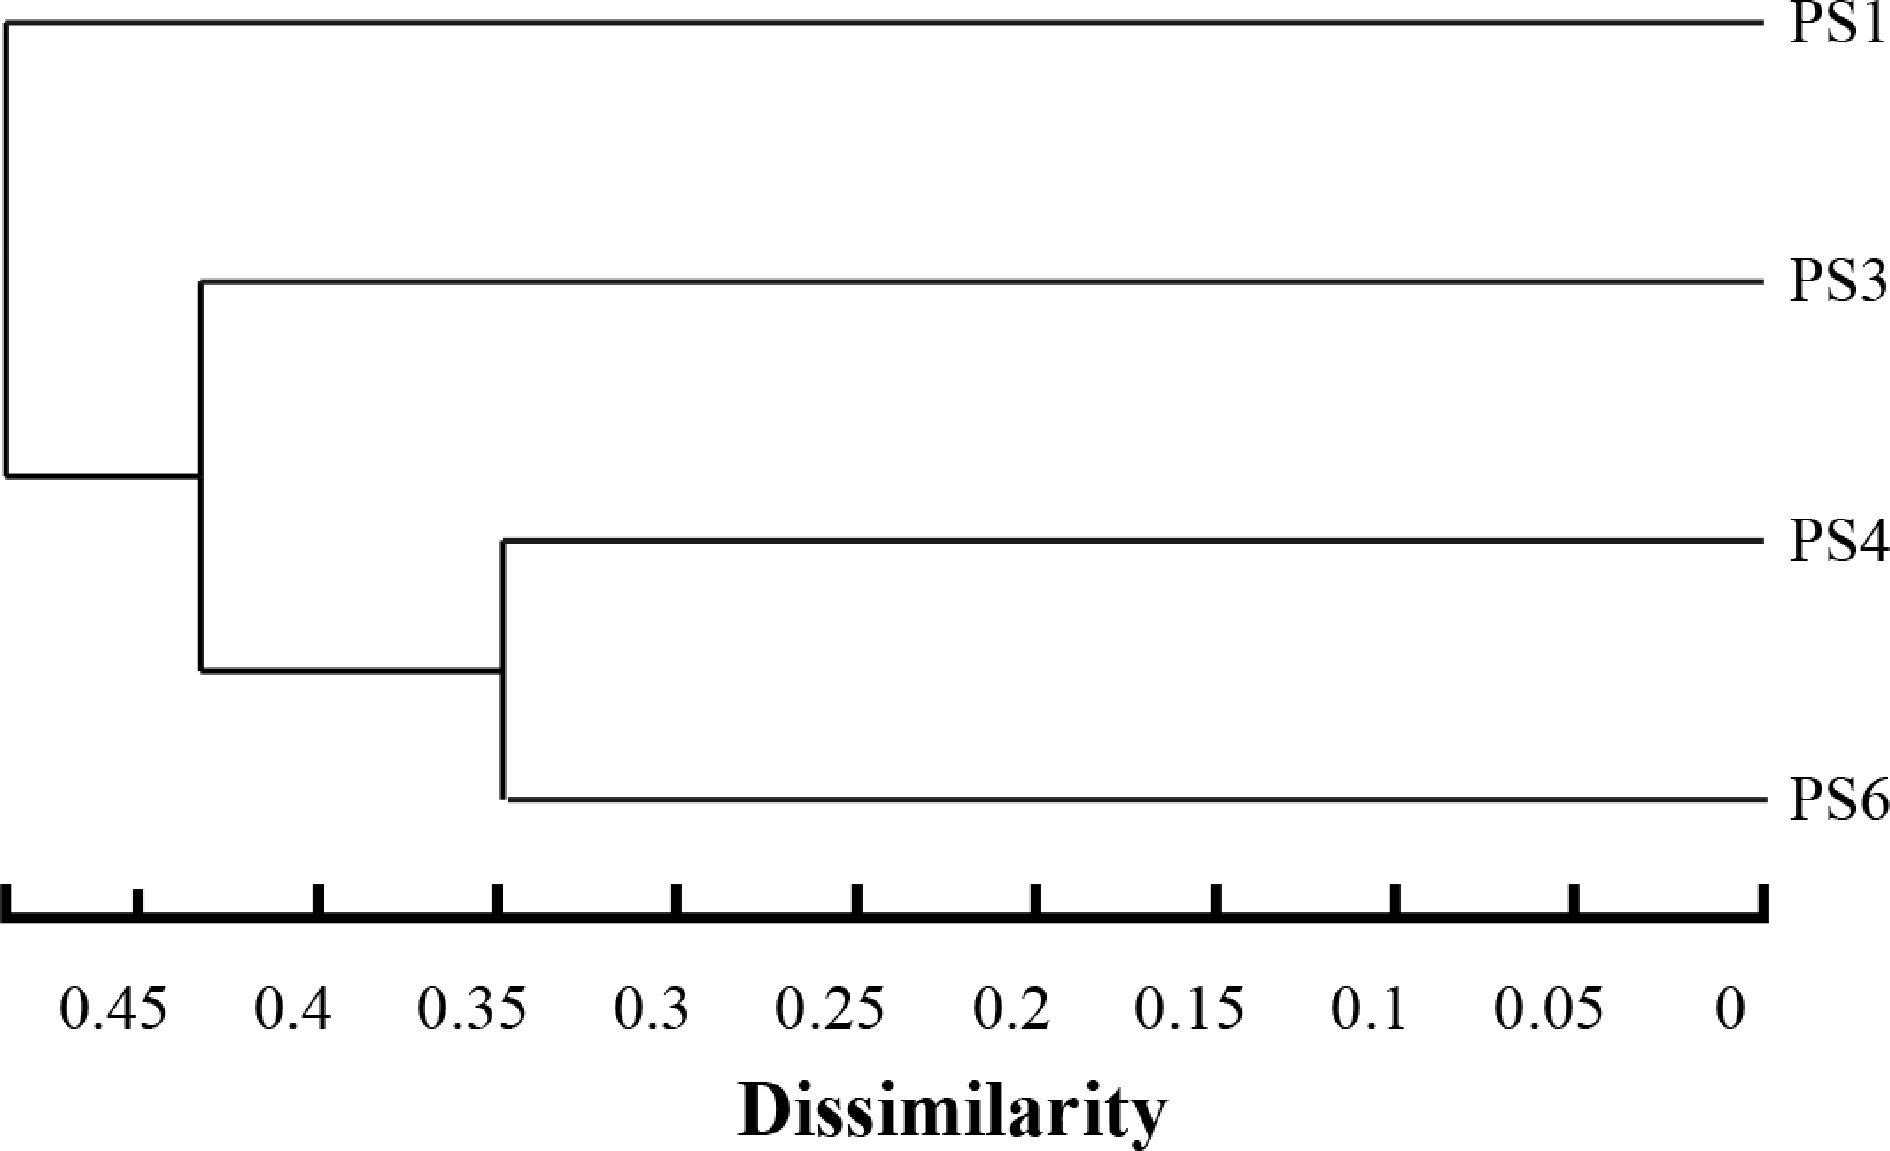
Figure 4.
Hierarchical clustering tree of the intestinal bacterial community of A. japonicus based on the Bray_Curtis distance algorithm.
Microbial composition and changes
-
At the phylum level, Proteobacteria, Bacteroidota, and Bacillota were the dominant taxa across all dietary groups (Fig. 5). Compared with the PS1 group, the relative abundance of Proteobacteria decreased as dietary protein and sea mud levels increased (from 77.37% in PS1 to 59.22%, 59.18%, and 55.75% in PS3, PS4, and PS6, respectively). Conversely, Bacteroidota increased from 4.52% to 7.85%, 8.63%, and 9.80%, while Bacillota rose from 2.65% to 17.48%, 15.12%, and 8.87%, respectively.
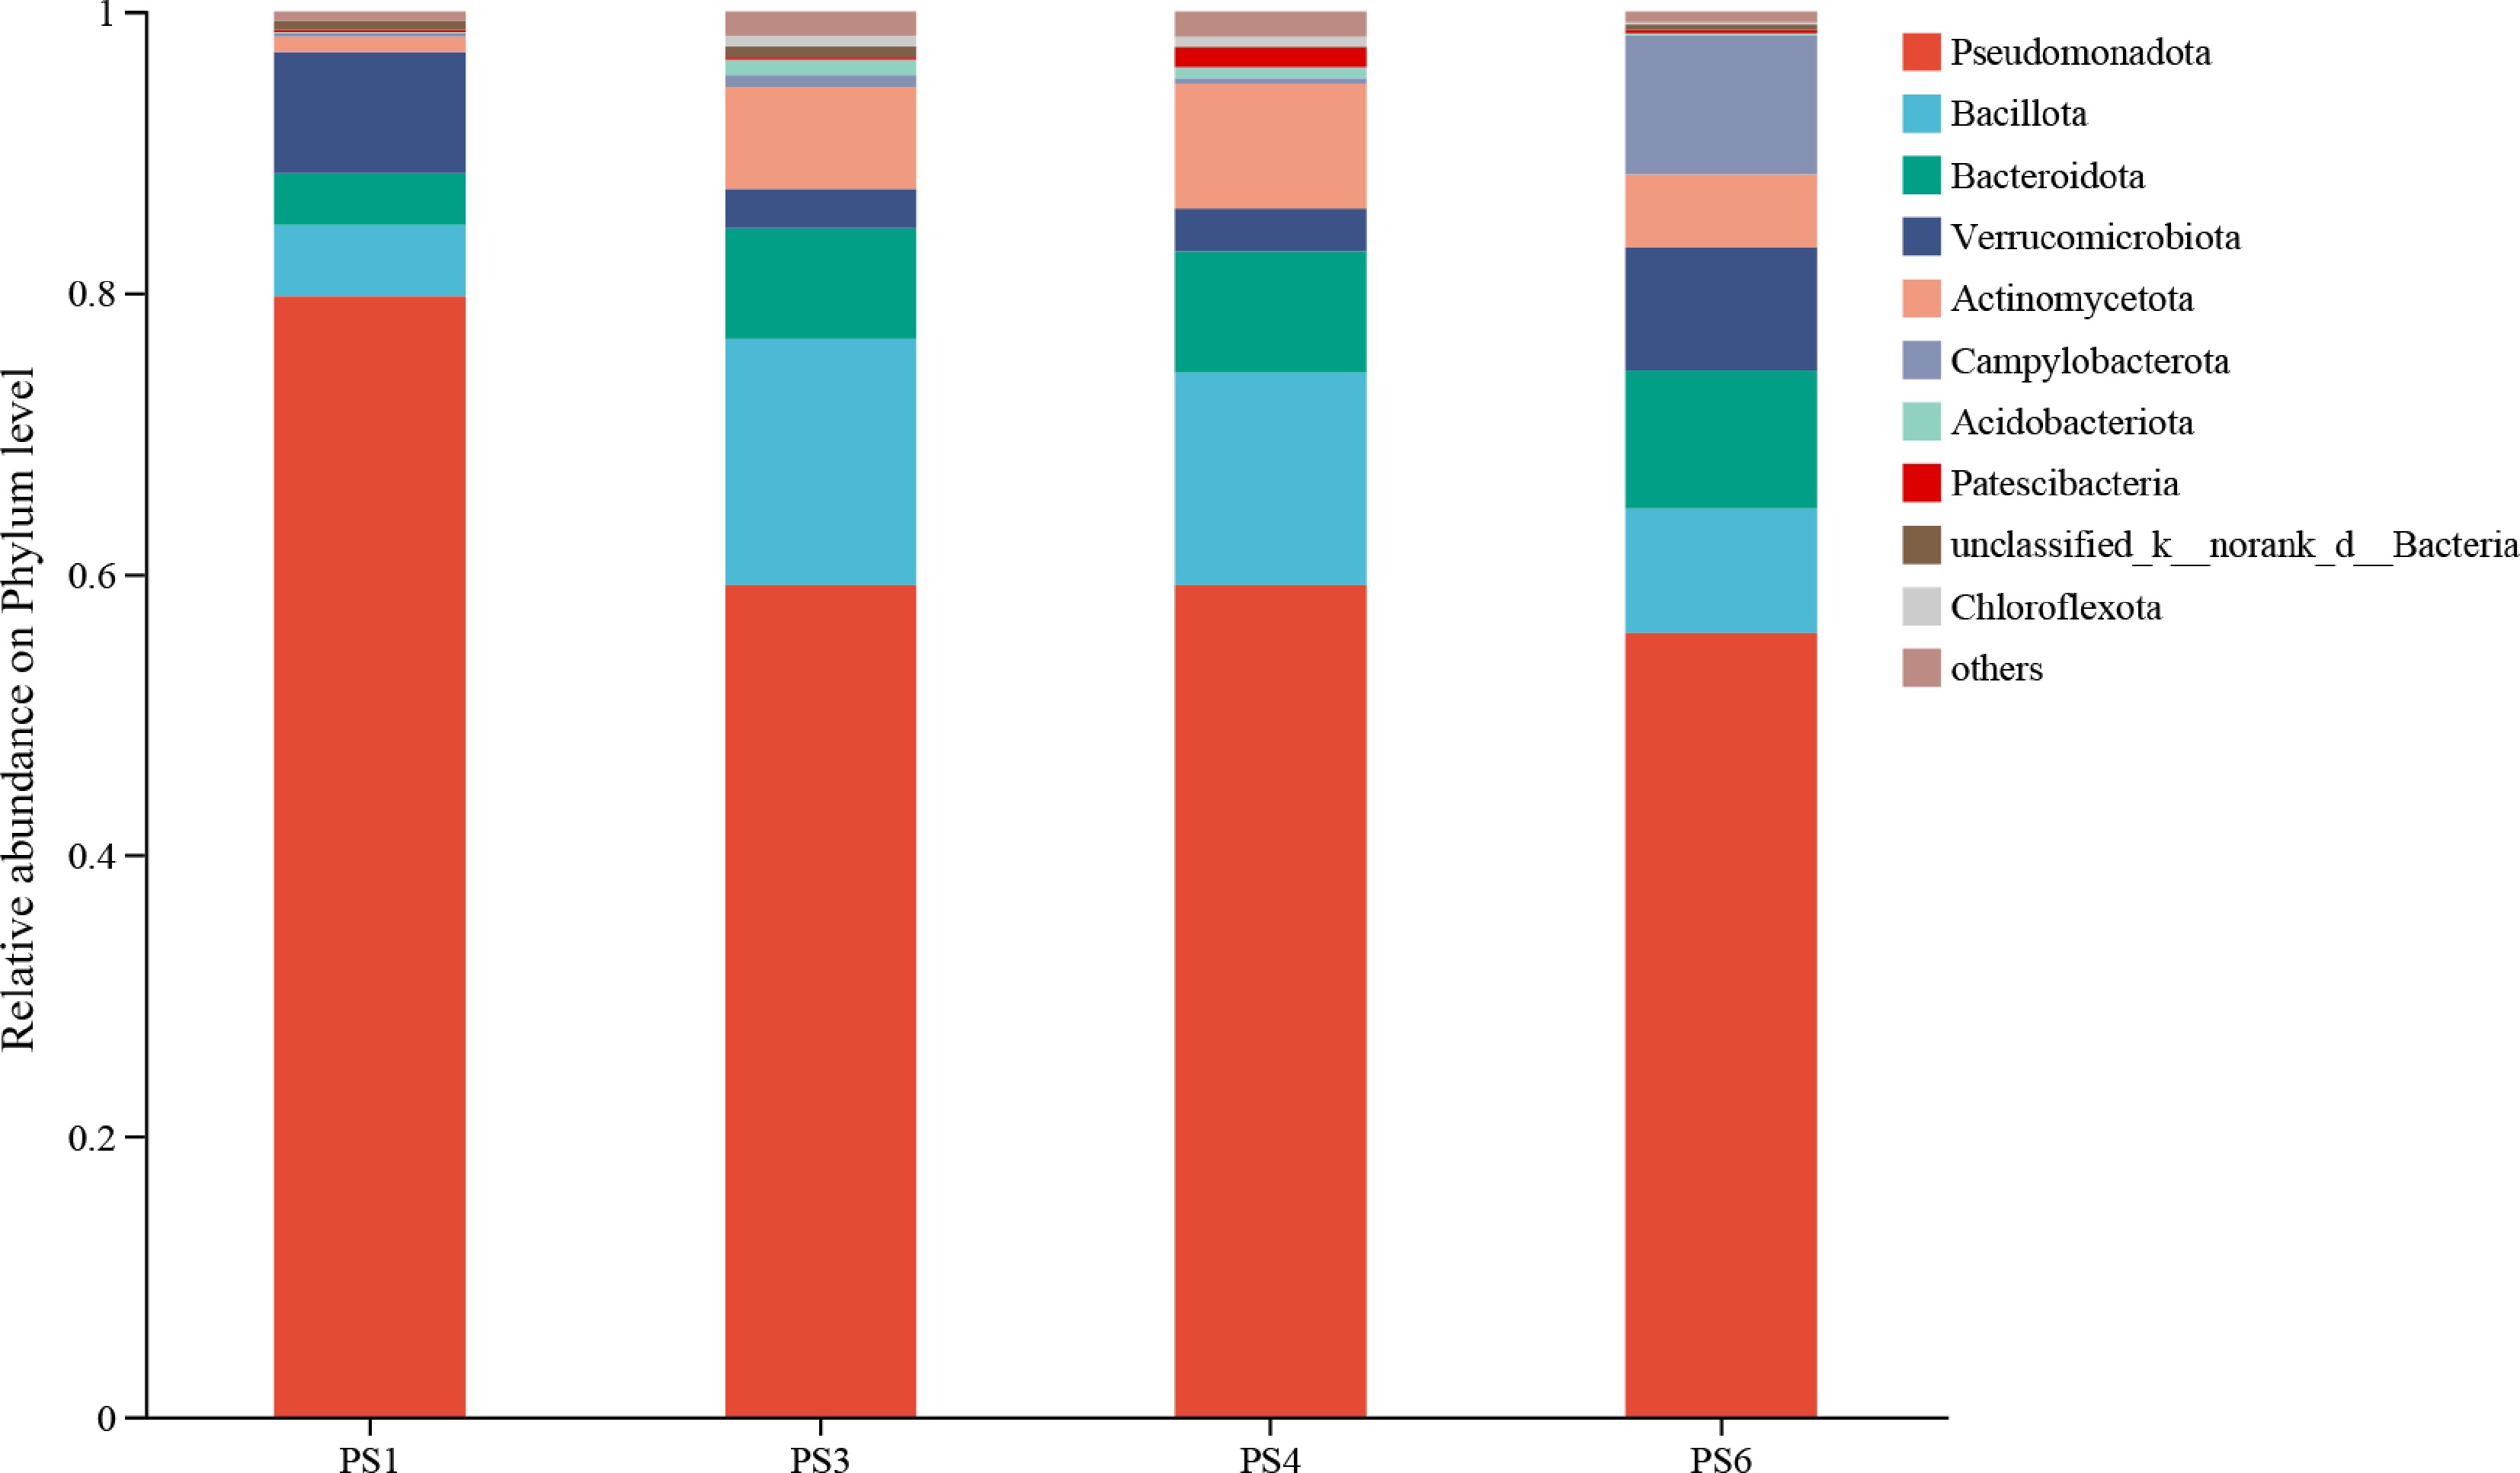
Figure 5.
Composition of intestinal microbial flora of A. japonicus at the phylum level.
At the genus level (Fig. 6), the dominant genera in PS1 were unclassified_f__Paracoccaceae, Rubritalea, and Coxiella. Compared with PS1, unclassified_f__Paracoccaceae increased from 11.39% to 16.48% and 19.92%, in PS3 and PS6 groups, respectively, but decreased from 11.39% to 6.26% in the PS4. Similarly, Rubritalea increased from 2.92% to 7.65% and 7.99% in PS3 and PS6, but decreased to 1.82% in PS4. In contrast, Coxiella decreased from 7.12% in PS1 to 0.95% and 0.87% in the PS4 and PS6, respectively, but increased to 11.15% in PS3.
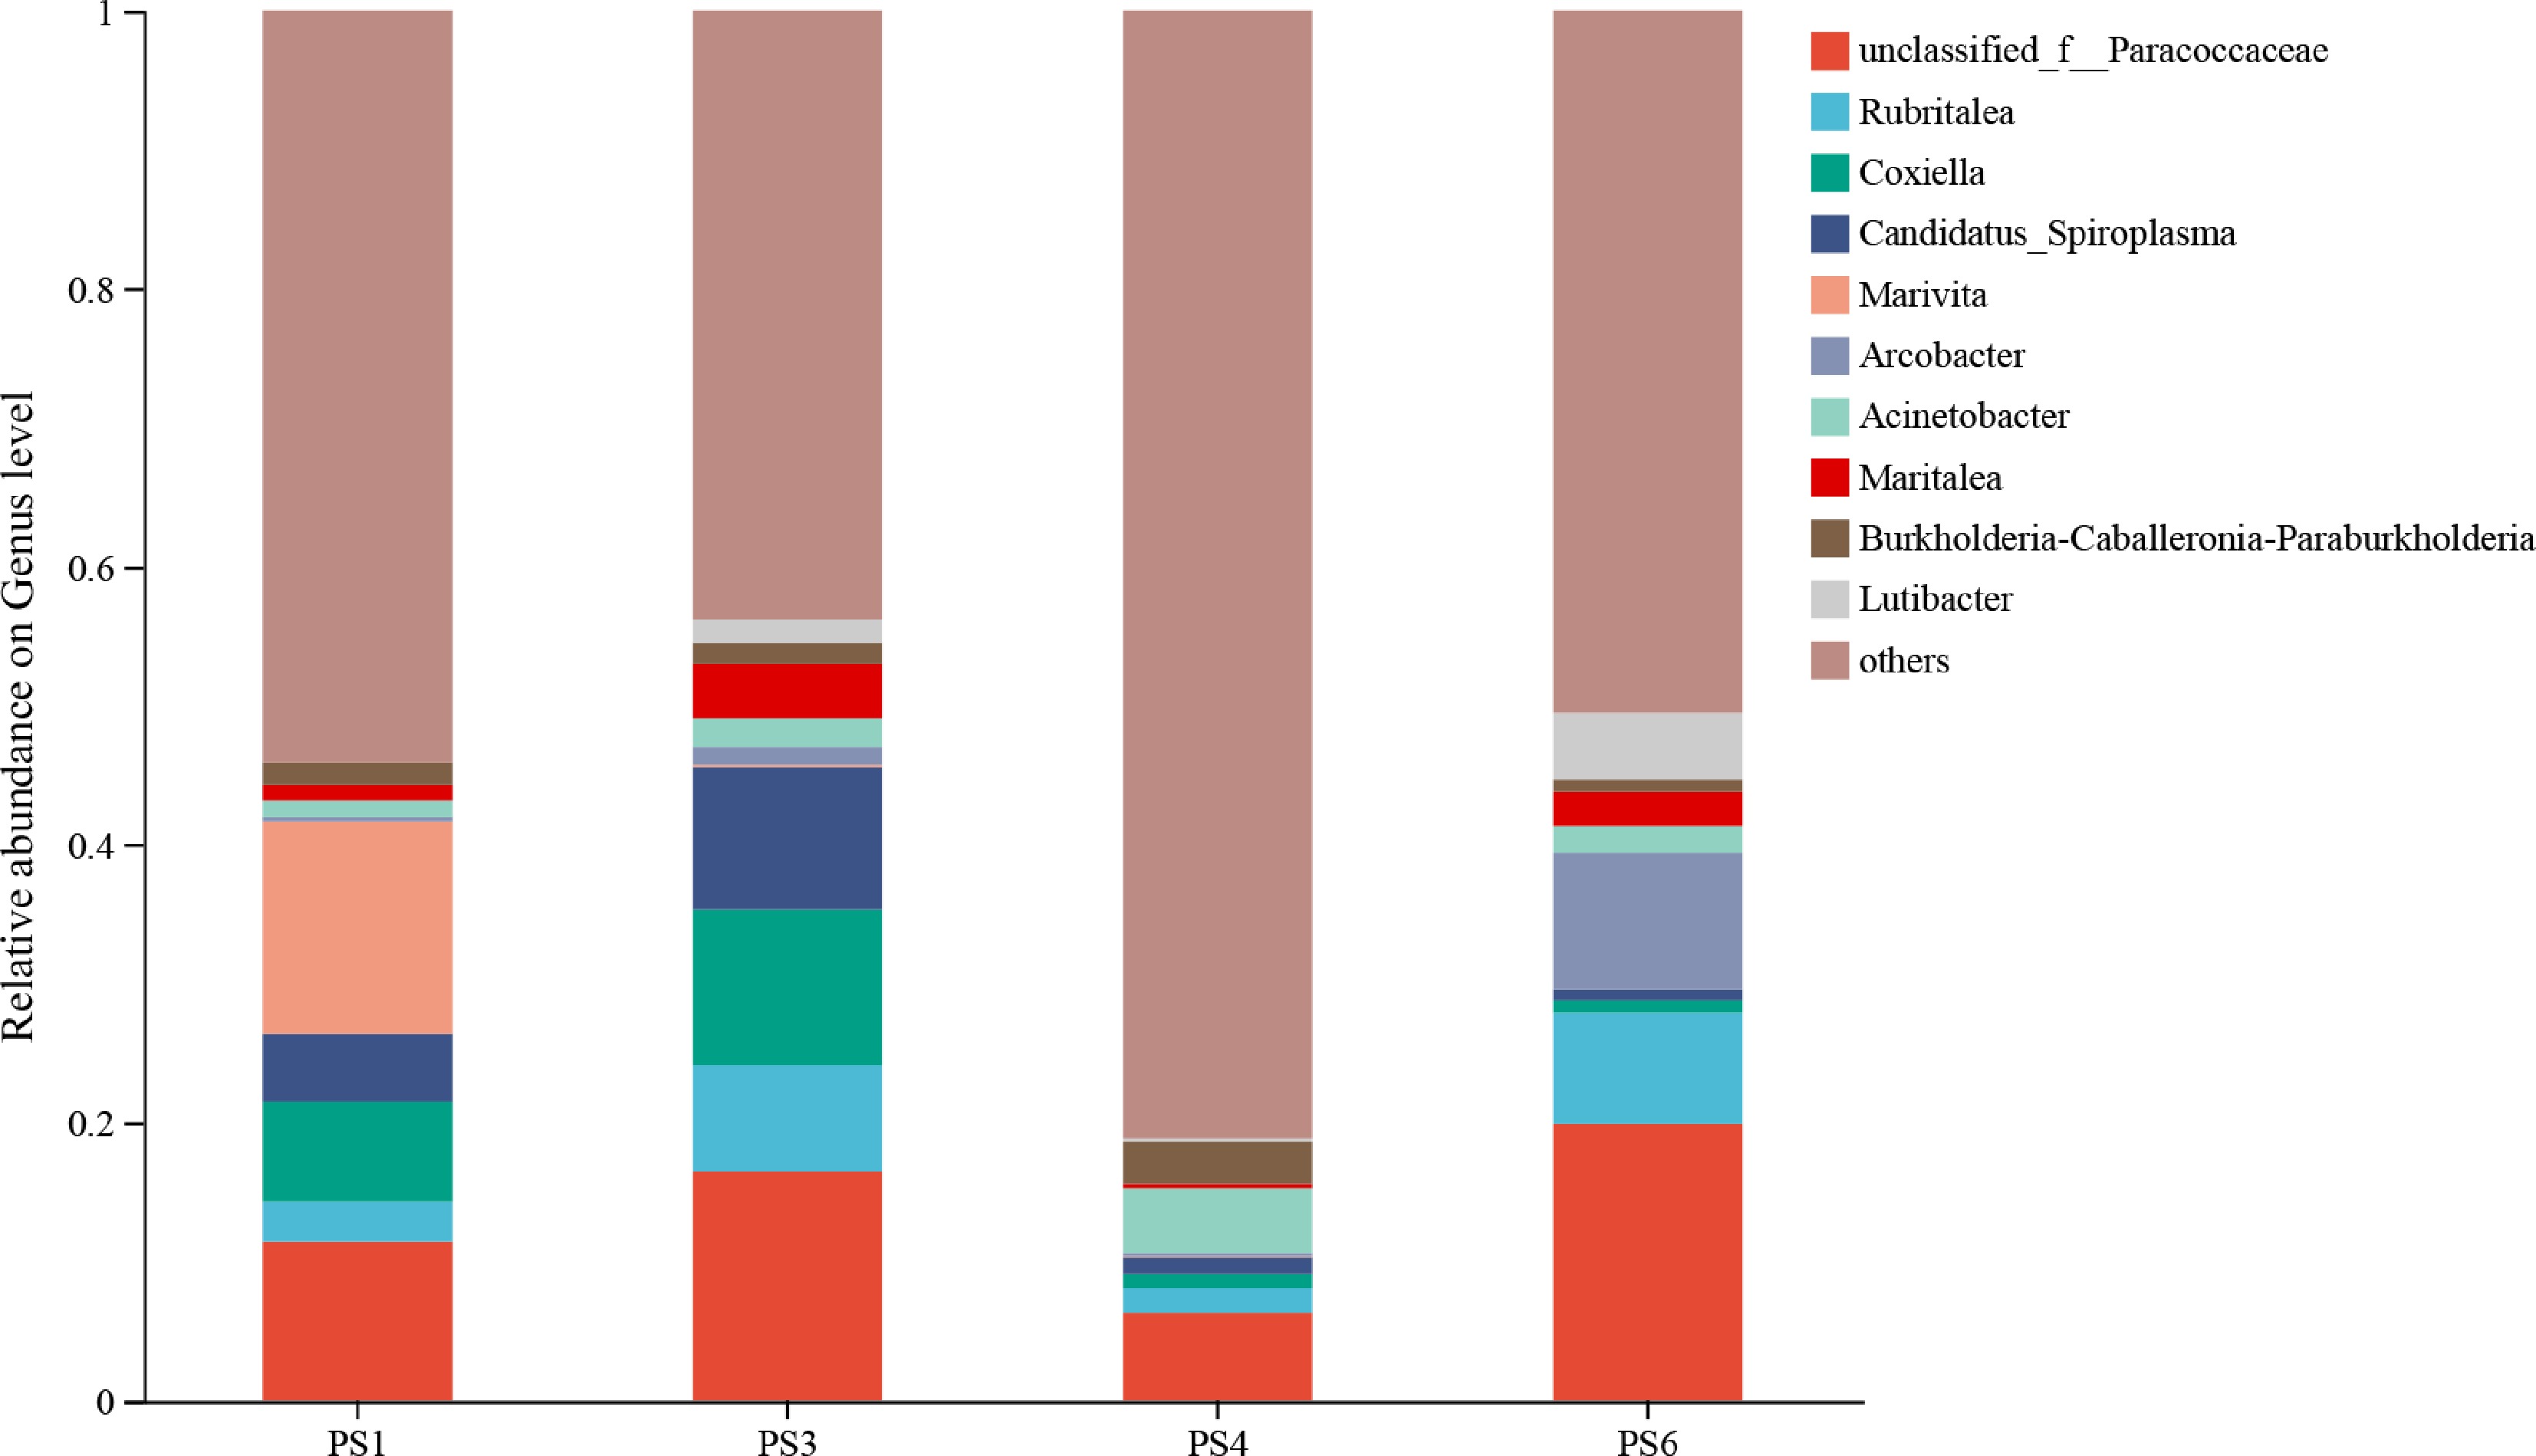
Figure 6.
Composition of intestinal microbial flora of A. japonicus at the genus level.
-
The growth performance of A. japonicus is not governed by a single nutritional factor, but rather by the complex interaction of multiple dietary nutrients[17]. Both WGR and SGR reached their highest values in the PS6 group, likely due to the regulatory role of sea mud in optimizing feed nutrient concentrations, and enhancing protein utilization efficiency[8,18]. At the same dietary protein level, WGR and SGR generally increased with rising dietary sea mud levels; however, negative growth was still recorded in groups PS1, PS2, and PS4. This outcome may be attributed to the insufficient organic matter content of sea mud in these treatments, which failed to meet the metabolic demands of A. japonicus, leading to poor feeding activity and nutrient deficiency. Prolonged malnutrition can reduce stress tolerance and induce evisceration—a physiological adaptation aimed at minimizing metabolic demand under unfavorable conditions[19,20].
Groups PS5 and PS6 displayed superior WGR and SGR, with PS6 exhibiting the highest IBR, suggesting that the optimal dietary sea mud inclusion level for supporting the growth of A. japonicus is approximately 45%–60%. A comparable trend was reported by Li et al.[21]. who observed the highest SGR when A. japonicus was fed a diet containing equal proportions (50%) of sea mud and algae powder, consistent with the present findings. Furthermore, at the same mud level, growth performance increased at higher dietary protein levels, indicating that the tested protein concentrations remained within the optimal range for A. japonicus. Adequate protein supply is essential for maintaining normal physiological functions and promoting tissue accretion in aquatic animals[22], and previous research has confirmed a positive relationship between growth rate and dietary protein level in A.japonicus[23]. Collectively, the present data suggest that the optimal protein requirement for A. japonicus may exceed 13%.
Analysis of body wall nutrient composition revealed that crude lipid content was not significantly influenced by dietary protein or sea mud levels. Differences in moisture content among treatments may reflect a varying degree of dry matter (e.g., protein) accumulation in the body wall[24]. At the 10% protein level, crude protein content of the body wall increased with increasing sea mud inclusion level, whereas at 13% protein, it exhibited a decreasing trend. This may be explained by metabolic energy partitioning: under low-protein conditions, assimilated protein is primarily allocated to growth, whereas under high-protein conditions, a portion of energy is diverted toward catabolic processes such as respiration and excretion, leading to reduced protein retention[25]. Sea mud may further influence this partitioning by modulating gut passage rate and nutrient absorption efficiency. Similar results have been reported by Liu et al[26].
In the present study, the intestinal TPS and LPS activities of A. japonicus increased significantly at higher dietary protein and sea mud levels. This outcome is consistent with the findings of Mohanta et al. and Yuan et al.[27,28], which demonstrate that an appropriate protein-to-sea mud ratio enhances the digestive capacity of A. japonicus. At a fixed protein level, TPS and LPS activities generally increased as sea mud concentrations increased; however, no significant differences were detected among groups fed high sea mud diets. This plateau may be attributed to the release of organic nutrients from sea mud following enzymatic digestion, whereas excessive organic matter can overstimulate the intestinal tract, reduce nutrient retention time, and ultimately reduce digestive enzyme activity[29].
The intestinal tract of A. japonicus consists of the mucosa, submucosa, muscularis, and serosa, and serves as the primary site for nutrient digestion and absorption[30]. Intestinal folds formed by mucosal protrusions increase the contact surface between the epithelium and ingested materials[31]. In this study, both MT and FH initially increased and then decreased as dietary protein and sea mud levels rose. This pattern suggests that a balanced nutrient composition supports improved intestinal morphology and stimulates digestive enzyme secretion, thereby enhancing digestive efficiency[32].
As an echinoderm, A. japonicus relies primarily on its non-specific immune system. Coelomocytes in its coelomic fluid play crucial roles in pathogen recognition and elimination[33]. The hydrolases ACP and AKP are important for innate immune defense, enhancing phagocytic activity and promoting tissue repair[34]. The present study found that ACP and AKP activities increased significantly at higher dietary protein levels and exhibited synergistic enhancement with sea mud inclusion, implying that sufficient protein intake supports intestinal protein metabolism and subsequently upregulates these immune-related enzymes[35].
Antioxidant enzymes such as SOD and CAT are key components of the defense system that scavenges reactive oxygen species (ROS) and protects cellular integrity[36], In this study, CAT activity first increased and then decreased with rising dietary protein and sea mud levels, while SOD activity showed a non-significant upward trend. This pattern may reflect the influence of bioactive peptides generated during protein digestion, which are known to stimulate immune cell activity and respiratory burst[37]. Furthermore, A. japonicus can adapt to different food sources by modulating intestinal function and digestive enzyme activity. A moderate increase in the proportion of sea mud appears to reduce fecal-dragging behavior, likely due to the mechanical stimulation provided by inert particles in the sea mud. Such stimulation is necessary for maintaining normal intestinal function, and may indirectly strengthen the immune competence of A. japonicus[18,38,39].
LZM degrades bacterial cell walls and works synergistically with phagocytosis to enhance antimicrobial effects[40]. In this study, LZM activity peaked in the PS5 group, suggesting that optimal protein levels strengthen both immune and antioxidant functions, potentially via modulating gut microbial composition. Higher proportions of beneficial bacteria may suppress opportunistic pathogens, reinforce intestinal barrier integrity, and elevate immune enzyme activity[41]. However, excessive sea mud inclusion resulted in reduced LZM activity, possibly due to the accumulation of undigested particles in rearing water, which can impair host physiology and weaken immune defense[42].
The intestinal function of A. japonicus depends on a diverse microbial community, which plays a central role in energy acquisition within the gut[43]. These microorganisms are essential for maintaining intestinal health and homeostasis, largely by utilizing organic detritus and contributing to the enrichment of intestinal microbial diversity[44]. In the present study, compared with groups receiving low protein and low sea mud levels (e.g., PS1), the intestinal microbiota abundance of A. japonicus generally increased as dietary protein and sea mud inclusion levels rose. This pattern suggests that different combinations of dietary protein and sea mud levels can effectively enhance intestinal microbial diversity in A. japonicus.
Results showed that at the phylum level, Proteobacteria dominated the intestinal microbiota of group PS1, whereas its dominance was progressively replaced by Bacteroidota and Bacillota in groups PS3, PS4, and PS6. Previous studies have reported that abnormally elevated Bacillota-to-Bacteroidota ratios under certain conditions may indicate intestinal microbiota dysbiosis; for instance, a similar pattern was observed in A. japonicus when different culture patterns impaired the intestinal microbiome[45]. Nevertheless, the excessively high proportion of Proteobacteria in the PS1 group warrants particular attention, as this phylum includes opportunistic pathogens such as Vibrio and Aeromonas, which can compromise the intestinal mucus barrier of A. japonicus and negatively affect host growth[46,47]. These microbial results are consistent with the earlier findings on growth performance and digestive physiological indices.
Furthermore, the genus-level analysis revealed that, compared with group PS1, the relative abundances of unclassified_f__Paracoccaceae and Rubritalea increased in groups PS3 and PS6 as dietary sea mud level increased, whereas the relative abundance of Coxiella decreased in groups PS4 and PS6 with increasing dietary protein levels. Unclassified_f__Paracoccaceae represents bacterial taxa within the Paracoccaceae family that have not yet been classified at the genus level. Previous studies indicate that members of Paracoccaceae play a key role in nitrogen cycling, including ammonia oxidation and denitrification[48]. Higher dietary sea mud inclusion may introduce more nitrogenous substrates and create favorable redox conditions for these taxa, and their increased abundance may contribute to pollutant degradation, reduced toxicity, and a more stable intestinal microenvironment supporting the growth of A. japonicus.
Rubritalea, belonging to Verrucomicrobiota, is capable of synergistically degrading complex polysaccharides in marine environments alongside Bacteroidota[49]. Moreover, it has been closely associated with host health due to its production of bioactive compounds with antioxidant and antimicrobial activities[50,51].
Although Coxiella has not been conclusively identified as a pathogen in sea cucumbers, it was found to be significantly enriched in the intestinal tract of A. japonicus in the PS1 group with poorer growth performance in this study. Notably, Coxiella has been reported as an etiological agent of crayfish rickettsiosis, significantly reducing survival in infected redclaw crayfish (Cherax quadricarinatus)[52]. This demonstrates its definitive pathogenic potential within aquatic animals. Therefore, it is plausible that under dietary imbalance-induced stress, intestinal Coxiella may act as an opportunistic pathogen in sea cucumbers, though its specific pathogenic role requires further validation.
In the present study, a higher dietary protein level (e.g., 13%) likely provided sufficient substrates for the synthesis of immune-antioxidant enzymes, whereas elevated sea-mud levels enriched beneficial taxa such as Rubritalea, which produce bioactive compounds with antimicrobial and immunomodulatory functions. These antioxidant and antimicrobial bioactive metabolites can fortify the intestinal barrier and mitigate inflammation. At the same time, the clay minerals present in sea mud may further enhance the immune response of A. japonicus, helping to alleviate oxidative stress and inflammatory reactions that could arise under high-protein dietary conditions[53].
-
Overall, the present study demonstrates that dietary protein and sea mud levels exert certain interactive effects on A. japonicus, rather than acting independently of each other. Adequate dietary protein provision (13%) provides fundamental nutrition for the growth and tissue synthesis of A. japonicus, while sea mud supplementation at 45%–60% further improves its intestinal digestive function, immune competence, and microbiota composition. Their combined effects can effectively simulate non-specific immune responses, improve intestinal microbial composition, and enhance pathogen resistance in A. japonicus.
These findings provide microbial-level evidence supporting precise nutritional regulation strategies for this species. Based on the overall assessment of growth, biochemical indices, immunological enzyme activities, and intestinal health, the dietary combinations 13P/45S (PS5) to 13P/60S (PS6) can be considered as the optimal protein-sea-mud levels for A. japonicus.
-
All experimental procedures involving animals were reviewed and preapproved by the Committee on the Ethics of Animal Experiments (CEAE) of Jimei University, China. (Permit number: 2011-58, approved date: 20 December 2011). The study strictly followed institutional and international ethical guidelines for animal research. The research also adhered to the principles of Replacement, Reduction, and Refinement to minimize animal harm. Details regarding animal housing, care, and pain management are provided to ensure minimal impact on the animals during the experiment.
-
The authors confirm their contributions to the paper as follows: formal analysis, writing − original draft: Xiong Y; data curation: Xiong Y, Li X; writing − review and editing: Xiong Y, Rahimnejad S, Wang Z; visualization: Zhang C; investigation: Zhang C, Wang L, Song K, Ma R, Li X; resources: Wang L, Song K, Ma R; methodology: Zhang C, Wang L, Song K, Ma R; project administration, funding acquisition, and supervision: Lu K. All authors reviewed the results and approved the final version of the manuscript.
-
The datasets generated during and/or analyzed during the current study are available from the corresponding author on reasonable request.
-
This work was funded by the Shandong Province Marine Aquaculture Innovation and Entrepreneurship Consortium (Grant No. YZ202509).
-
The authors declare that they have no conflict of interest.
- Copyright: © 2026 by the author(s). Published by Maximum Academic Press on behalf of Nanjing Agricultural University. This article is an open access article distributed under Creative Commons Attribution License (CC BY 4.0), visit https://creativecommons.org/licenses/by/4.0/.
-
About this article
Cite this article
Xiong Y, Zhang C, Wang Z, Wang L, Song K, et al. 2026. Effects of dietary protein-to-sea mud ratio on growth, immune response, intestinal digestion, and health of sea cucumber (Apostichopus japonicus). Animal Advances 3: e017 doi: 10.48130/animadv-0026-0004 

Effects of dietary protein-to-sea mud ratio on growth, immune response, intestinal digestion, and health of sea cucumber (Apostichopus japonicus)
- Received: 13 January 2026
- Revised: 02 February 2026
- Accepted: 10 February 2026
- Published online: 12 June 2026
Abstract: This study investigated the interactive effects of dietary protein and sea mud levels on growth performance, immune response, intestinal digestion, and health of sea cucumbers (Apostichopus japonicus), aiming to provide a theoretical basis for optimizing precise dietary formulations. Sea cucumbers with initial body weight of 5.40 ± 0.03 g were used as experimental subjects. Six experimental diets were formulated with two protein levels (10% and 13%) and three sea mud levels (30%, 45%, and 60%). The feeding trial lasted 60 d. The results showed that increasing dietary protein level from 10% to 13%, and sea mud level from 30% to 60%, significantly enhanced weight gain, intestinal wall ratio, and body wall crude protein content, as well as activities of acid phosphatase, alkaline phosphatase, catalase, and lysozyme in the coelomic fluid. Similarly, intestinal trypsin and lipase activities, and intestinal muscularis thickness were markedly elevated. At each sea mud level, the specific growth rate of sea cucumbers fed 13% protein was significantly higher than those fed 10% protein. Moreover, the 10% protein diet failed to support growth at low sea mud levels (30%–45%), indicating that 13% protein is the suitable dietary level. Additionally, higher dietary protein and sea mud levels increased the Ace, Chao, and Shannon indices of the intestinal microbiota, with Proteobacteria, Bacteroidota, and Bacillota as the dominant phyla. In conclusion, based on the integrated evaluation of growth performance, intestinal digestive capacity, coelomic fluid immune-antioxidant activity, and intestinal microbiota diversity, the optimal dietary protein to sea mud ratio for A. japonicus was determined to be 13P/45S–13P/60S.
-
Key words:
- Sea cucumbers /
- Growth /
- Digestive function /
- Immune competence /
- Gut microbiota