-
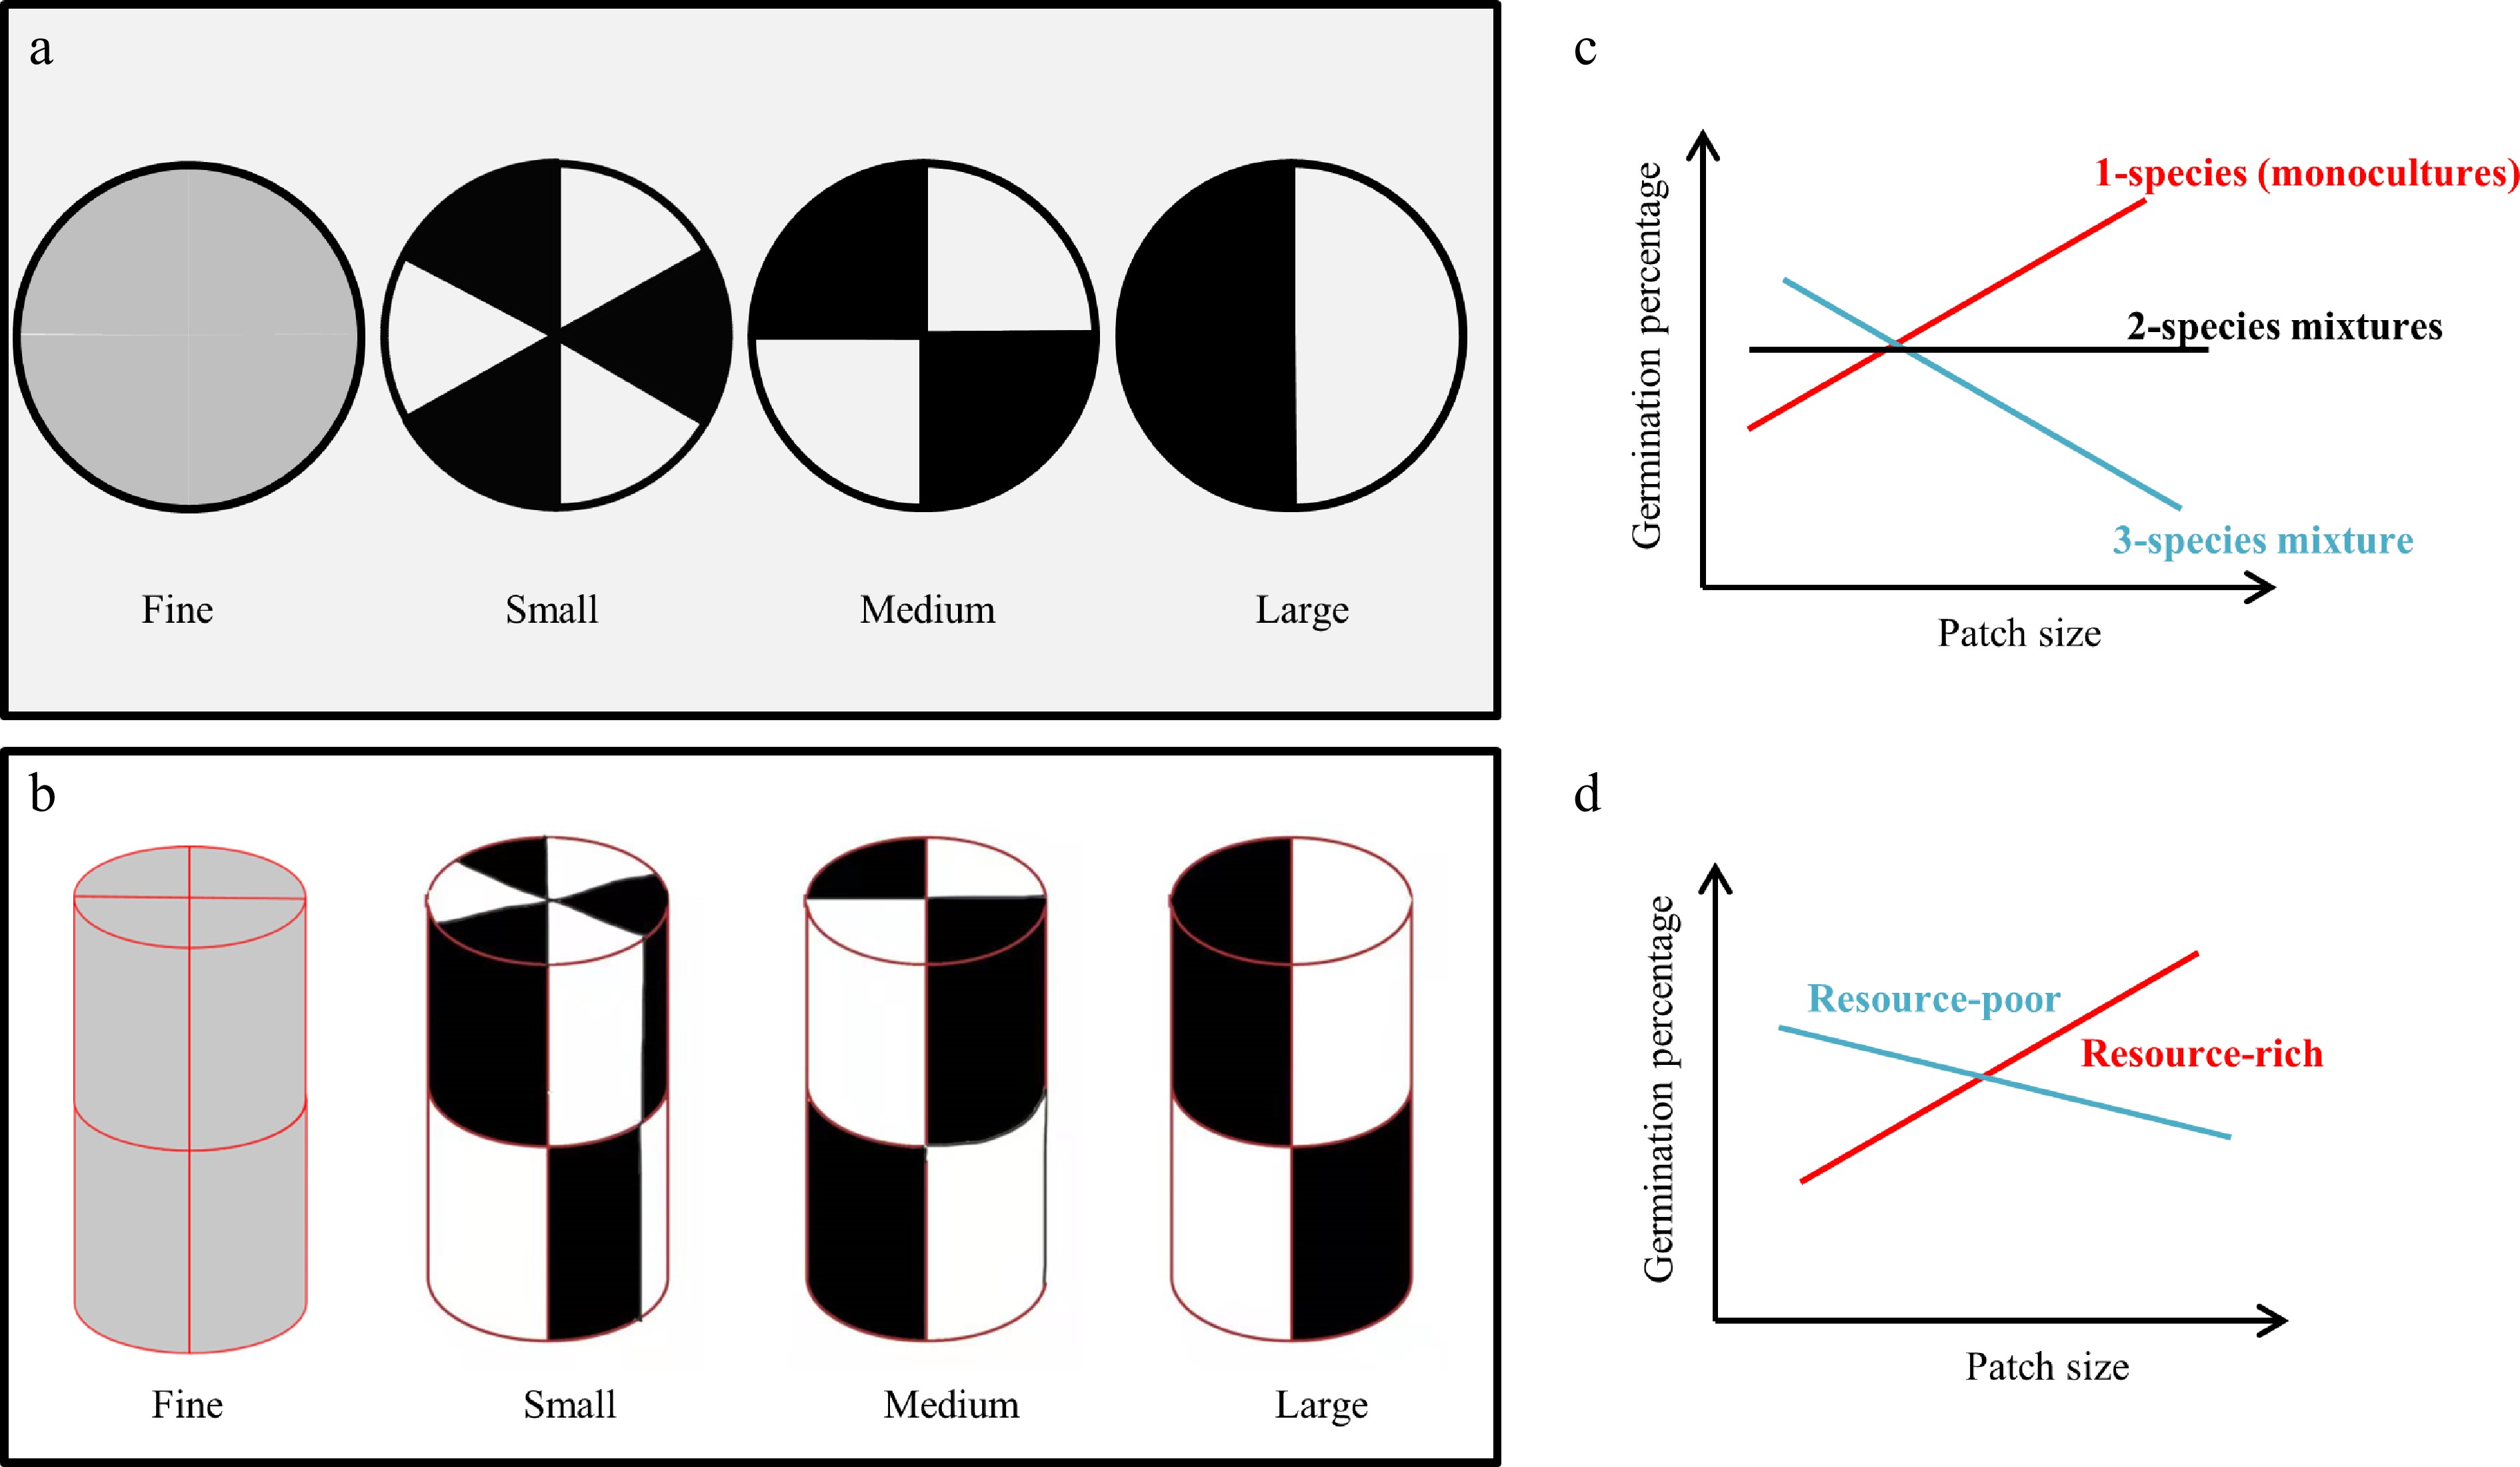
Figure 1.
Four soil heterogeneity levels were applied in this experiment, where each level was created by alternatively filling pots with resource-rich (black) and resource-poor (white) substrates, giving rise to fine, small, medium, and large patch sizes: (a) Top view; (b) lateral view. (c) Hypothesis 1 (at the pot scale): Seed germination is expected to increase with increasing patch size, and this pattern is supposed to be modified by species composition. (d) Hypothesis 2 (at the substrate scale): seed germination is hypothesized to increase in the resource-rich substrate with increasing patch size, whereas the opposite pattern is predicted to be found on the resource-poor substrate. Note that the one-species (monoculture), two-species mixtures, and three-species mixture in (c) could be any of the target species.
-
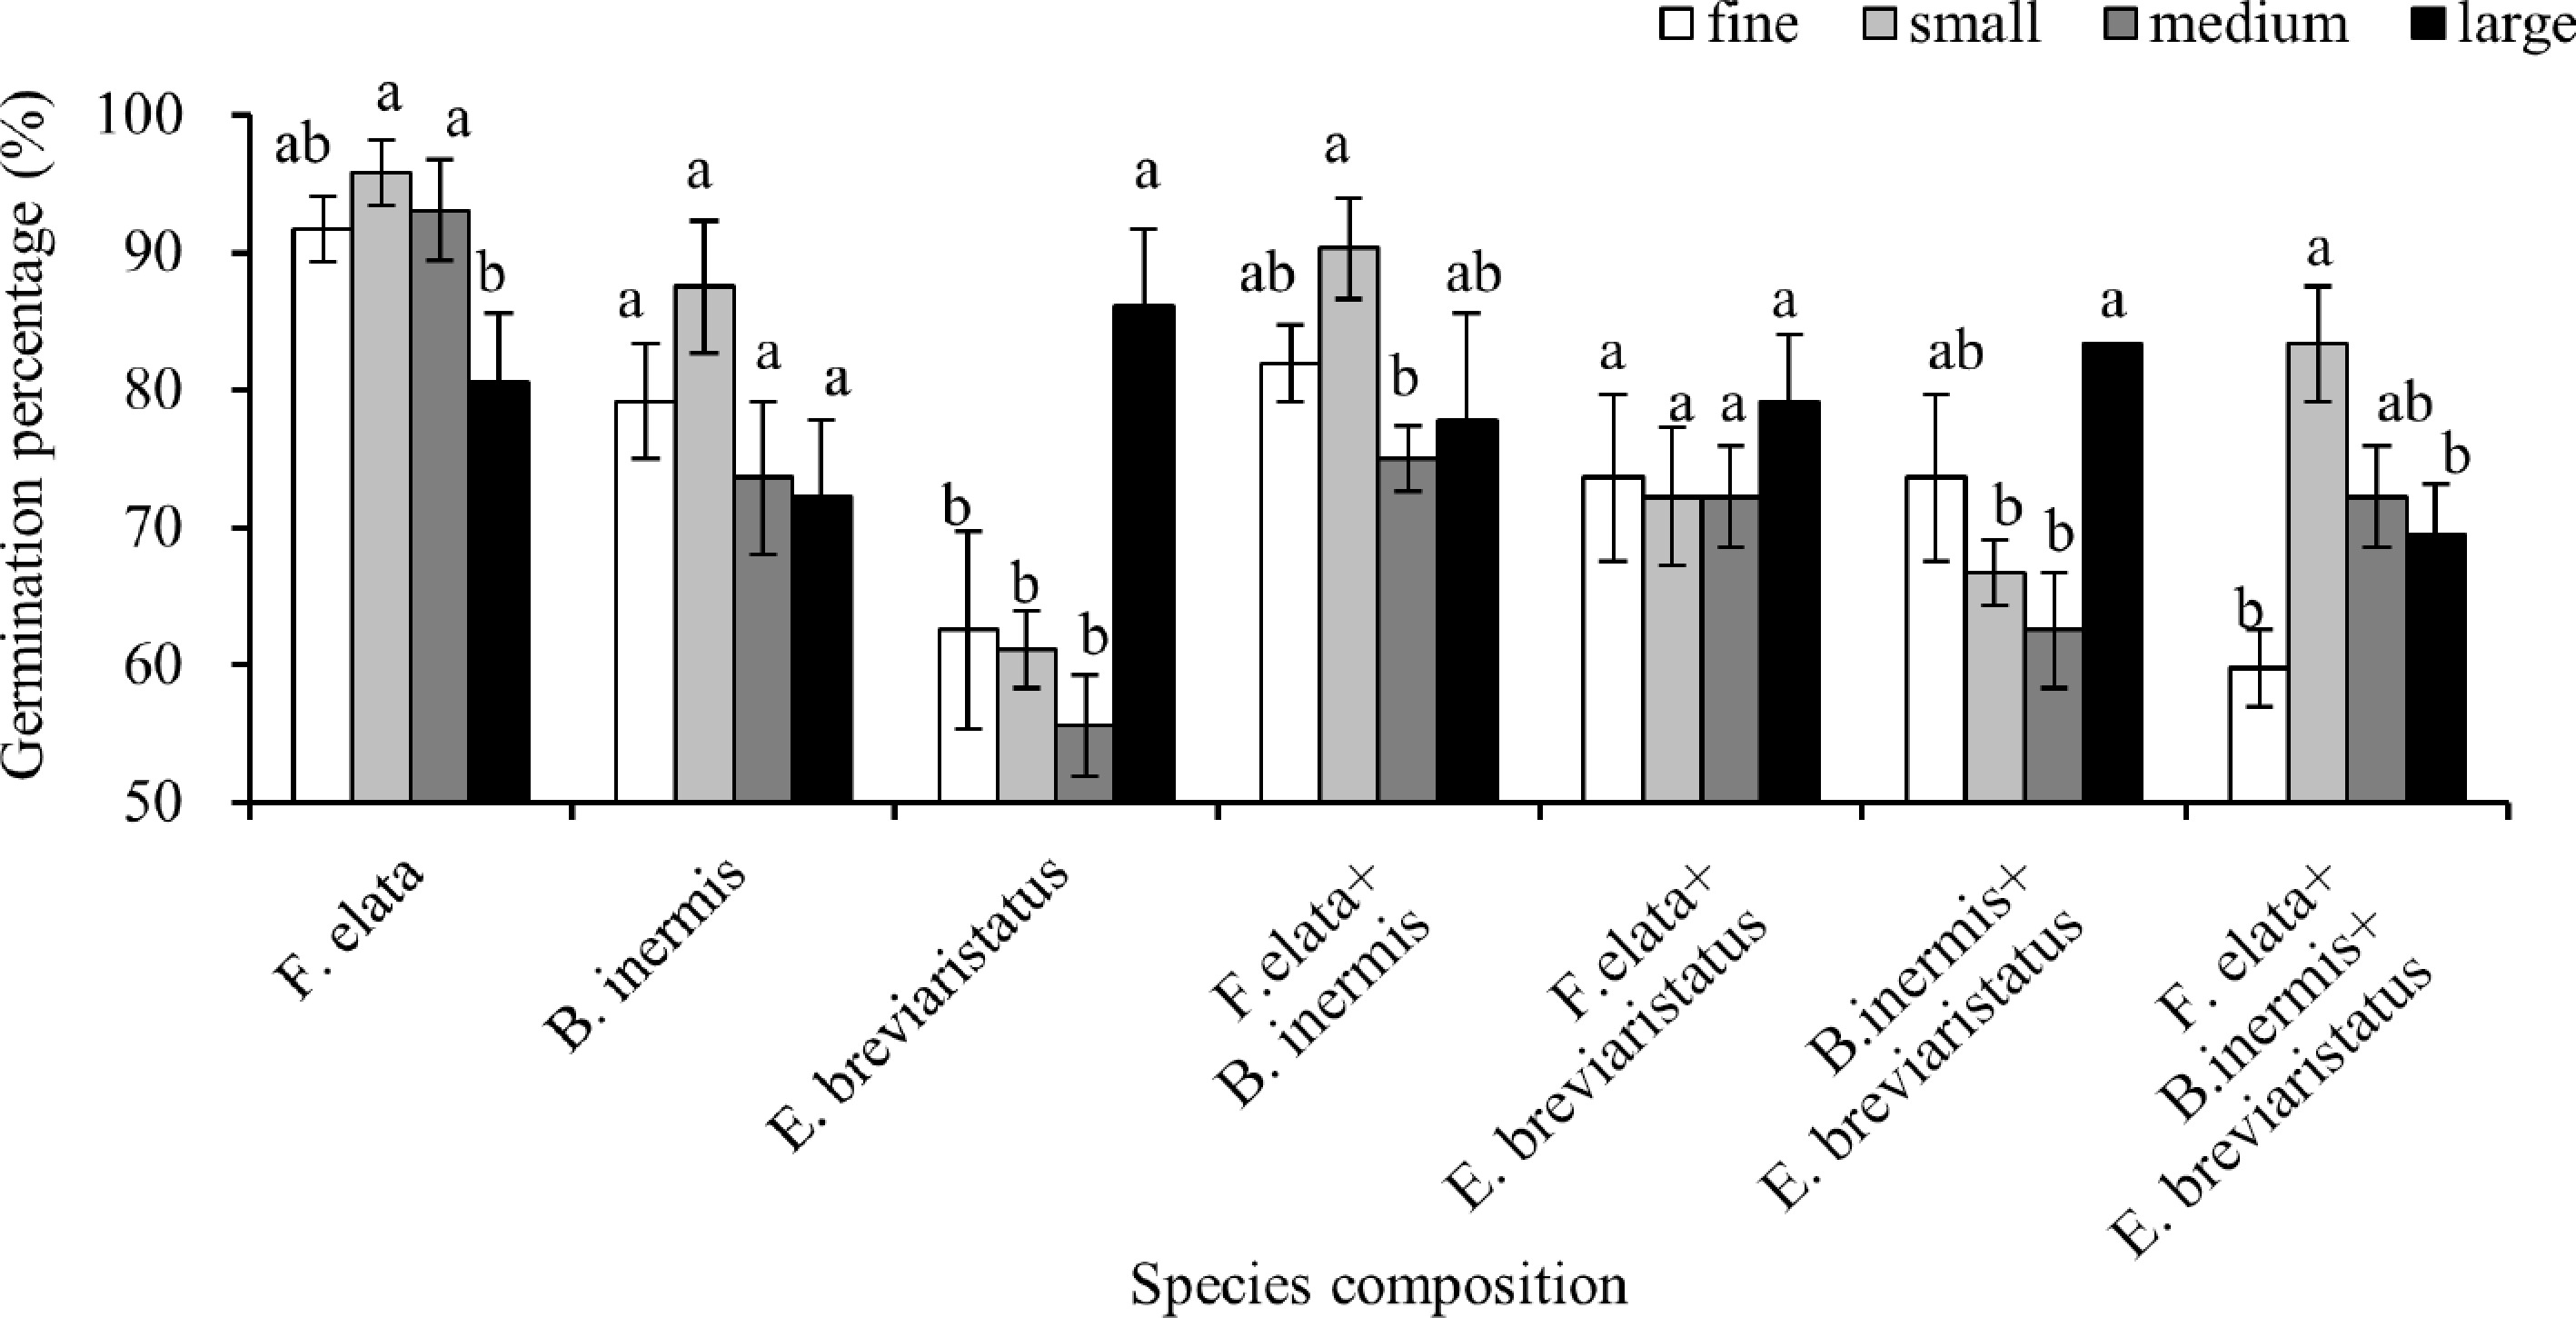
Figure 2.
Mean ± SE of seed germination percentage of the seven species compositions shown at the pot scale, separated by patch sizes (soil heterogeneity), i.e., fine, small, medium, and large. Significant differences between patch sizes for each species composition are labeled by different letters (post hoc analysis with LSD).
-
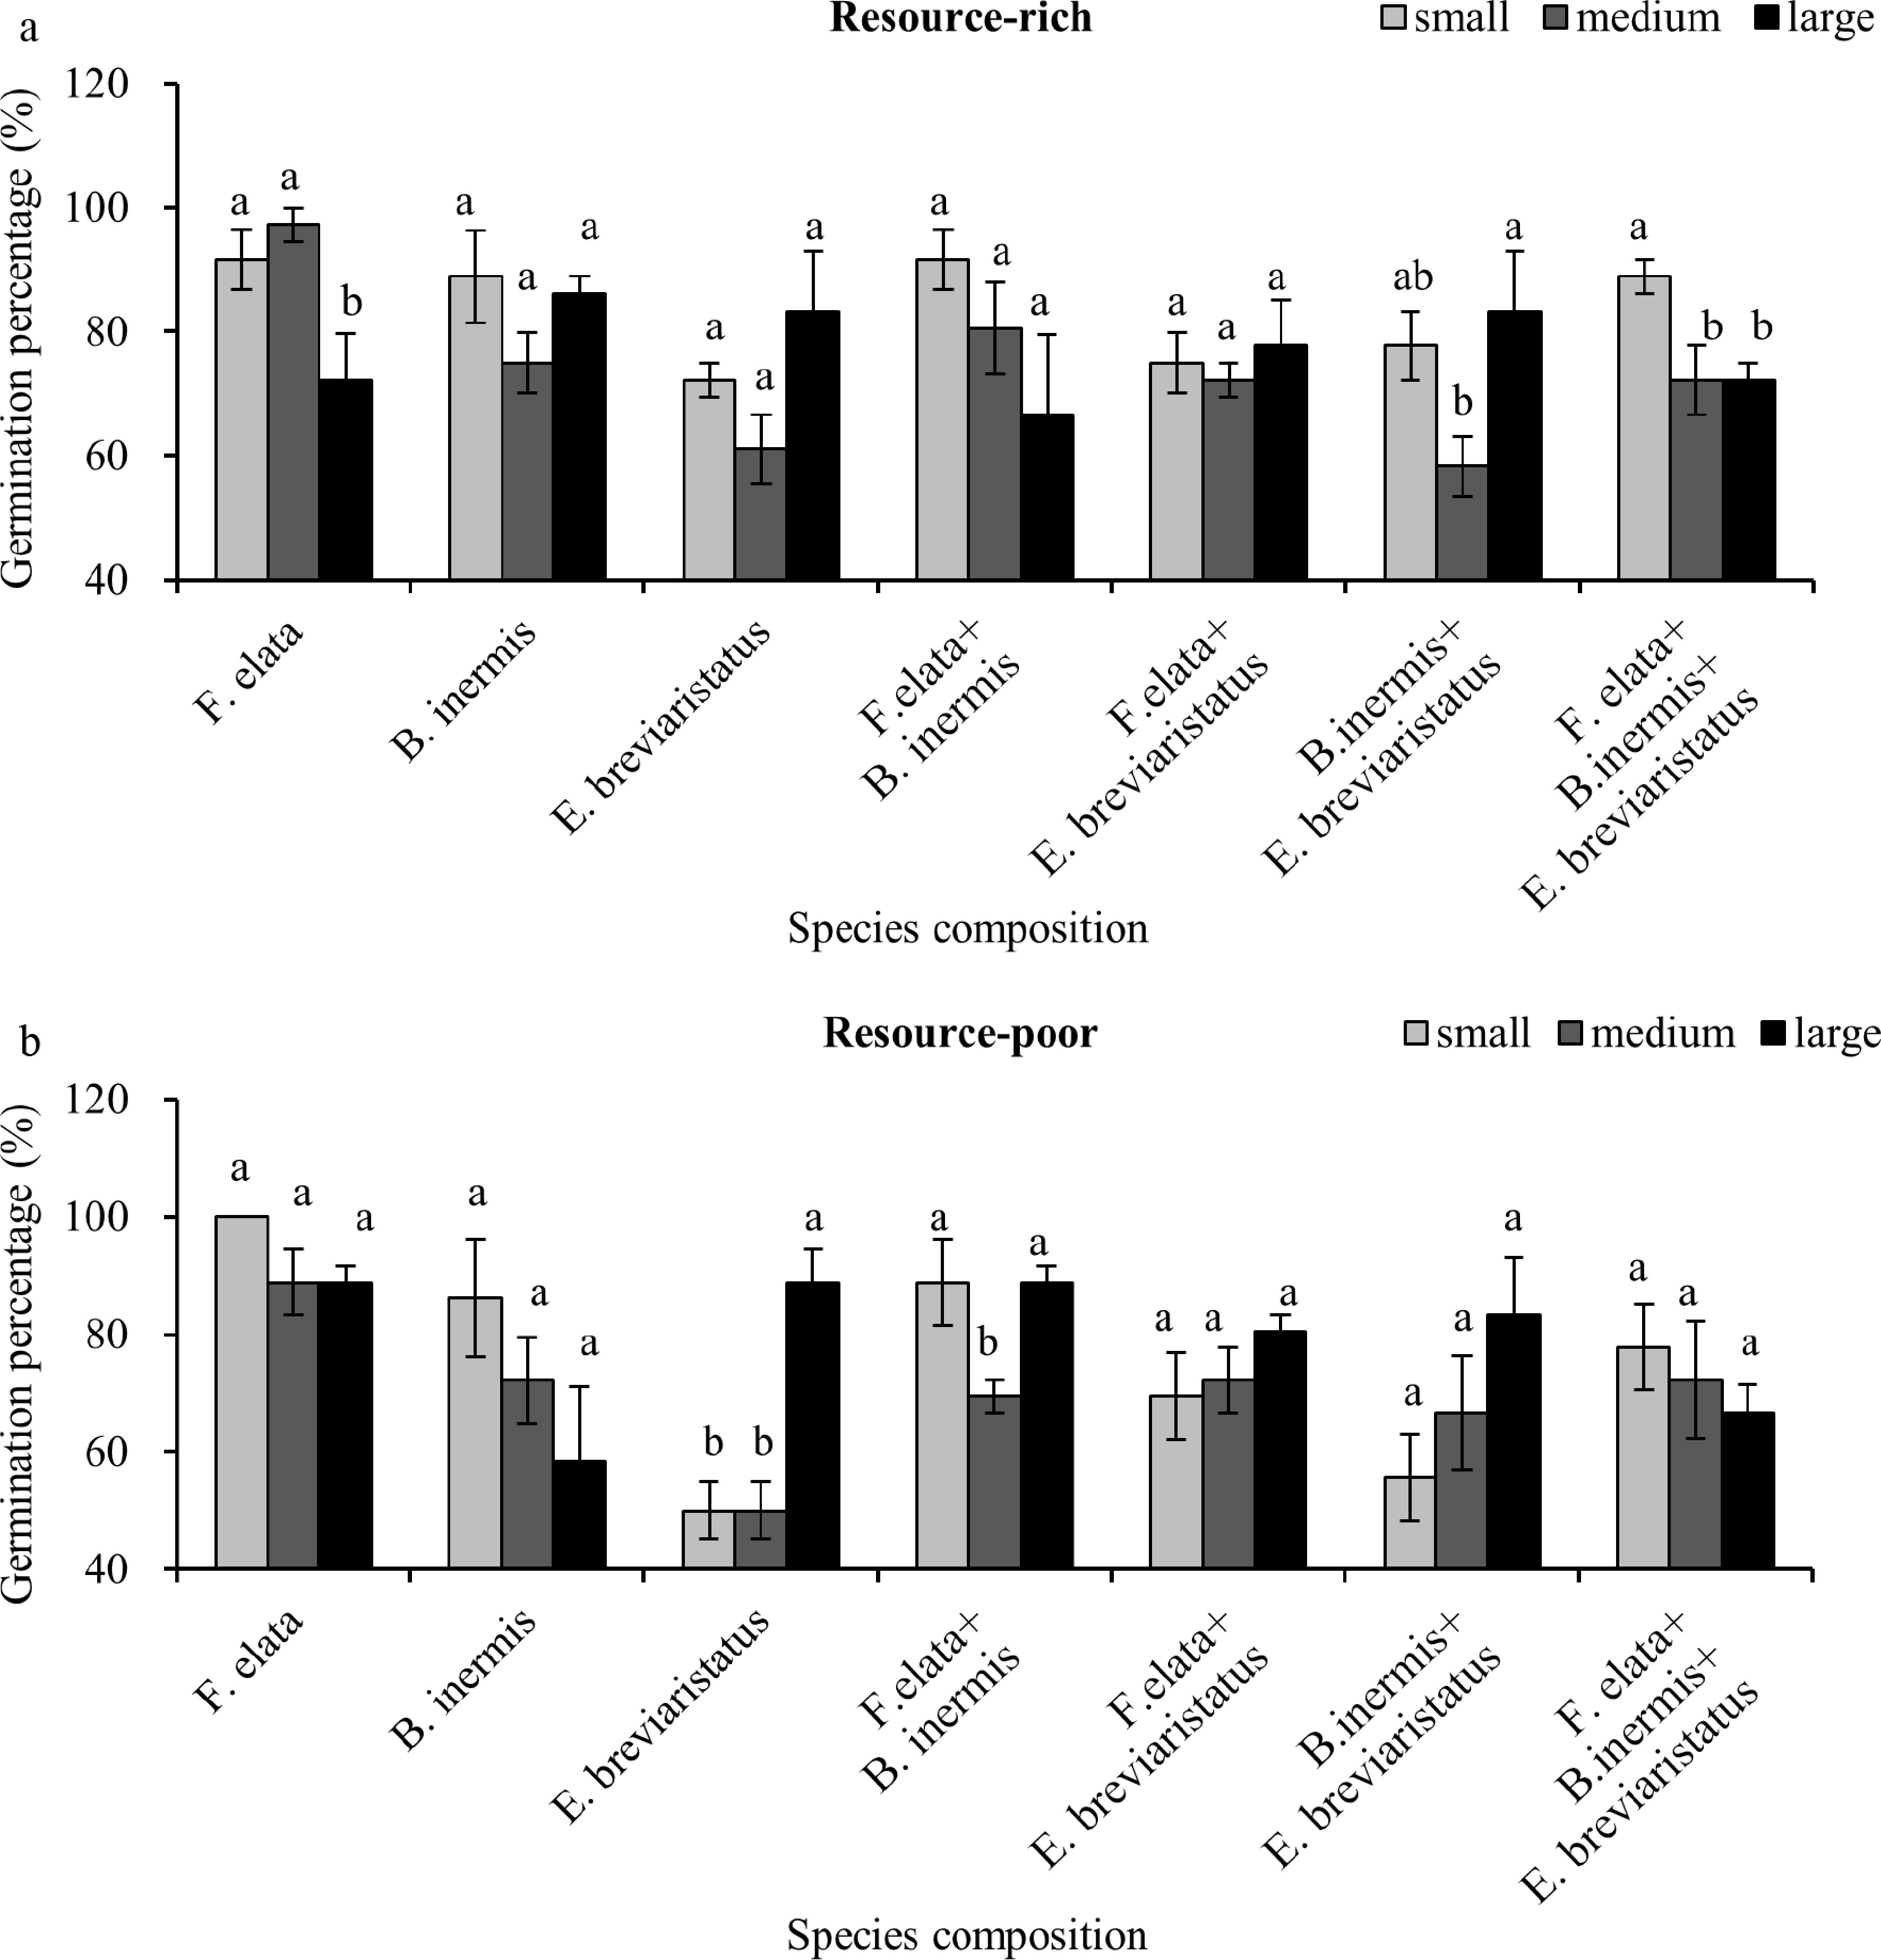
Figure 3.
Mean ± SE of seed germination percentage of the seven species compositions on (a) the resource-rich and (b) the resource-poor substrate, shown at the substrate scale and separated by patch size (soil heterogeneity; i.e., small, medium, and large). Significant differences between patch sizes for each species composition are labeled by different letters (post hoc analysis with LSD).
-
Substrate pH EC (μS·cm−1) SOC (g·kg−1) AP (mg·kg−1) Total nitrogen (g·kg−1) Resource-rich 7.1 ± 0.02 1,469 ± 38 7.52 ± 0.15 4.04 ± 0.09 0.14 ± 0.01 Resource-poor 7.2 ± 0.07 1,120 ± 102 6.73 ± 0.25 3.36 ± 0.06 0.05 ± 0.01 Note that three replicates were used in these tests, and the values in this table are shown as the mean ± standard error (SE). Table 1.
Soil pH, electrical conductivity (EC), soil organic carbon (SOC), available phosphorus (AP), and total nitrogen of the resource-rich and resource-poor substrate at the beginning of the experiment.
-
df F p Patch size 3, 56 4.3 0.009 Species composition 6, 56 12.7 < 0.001 Patch size × species composition 18, 56 3.6 < 0.001 F-values, p-values, and degrees of freedom (dfbetween-groups, dfwithin-groups) are given, with significant results (p < 0.05) in bold. Table 2.
Effects of patch size (fine, small, medium, and large), species composition, and their interaction on seed germination percentage tested by a generalized linear mixed model at the pot scale.
-
df F p Patch size 2, 92 5.3 0.007 Species composition 6, 92 7.3 < 0.001 Substrate 1, 92 2.3 0.134 Patch size × species composition 8, 92 4.3 < 0.001 Patch size × substrate 2, 92 1.9 0.160 Species composition × substrate 6, 92 1.2 0.312 Patch size × species
composition × substrate8, 92 1.8 0.064 F-values, p-values, and degrees of freedom (dfbetween-groups, dfwithin-groups) are given, with significant results (p < 0.05) in bold. Table 3.
Effects of patch size (small, medium, and large), species composition, substrate, and their interactions on seed germination percentage were explored via GLMM at the substrate scale, separated by substrate.
-
Resource-rich Resource-poor df F p df F p Patch size 2, 46 4.6 0.015 2, 46 2.8 0.070 Species composition 6, 46 2.3 0.053 6, 46 5.9 < 0.001 Patch size × species composition 8, 46 2.4 0.016 8, 46 3.4 0.001 F-values, p-values, and degrees of freedom (dfbetween-groups, dfwithin-groups) are given, with significant results (p < 0.05) in bold. Table 4.
The effects of patch size, species composition, and their interaction on seed germination percentage investigated via GLMM.
Figures
(3)
Tables
(4)