-
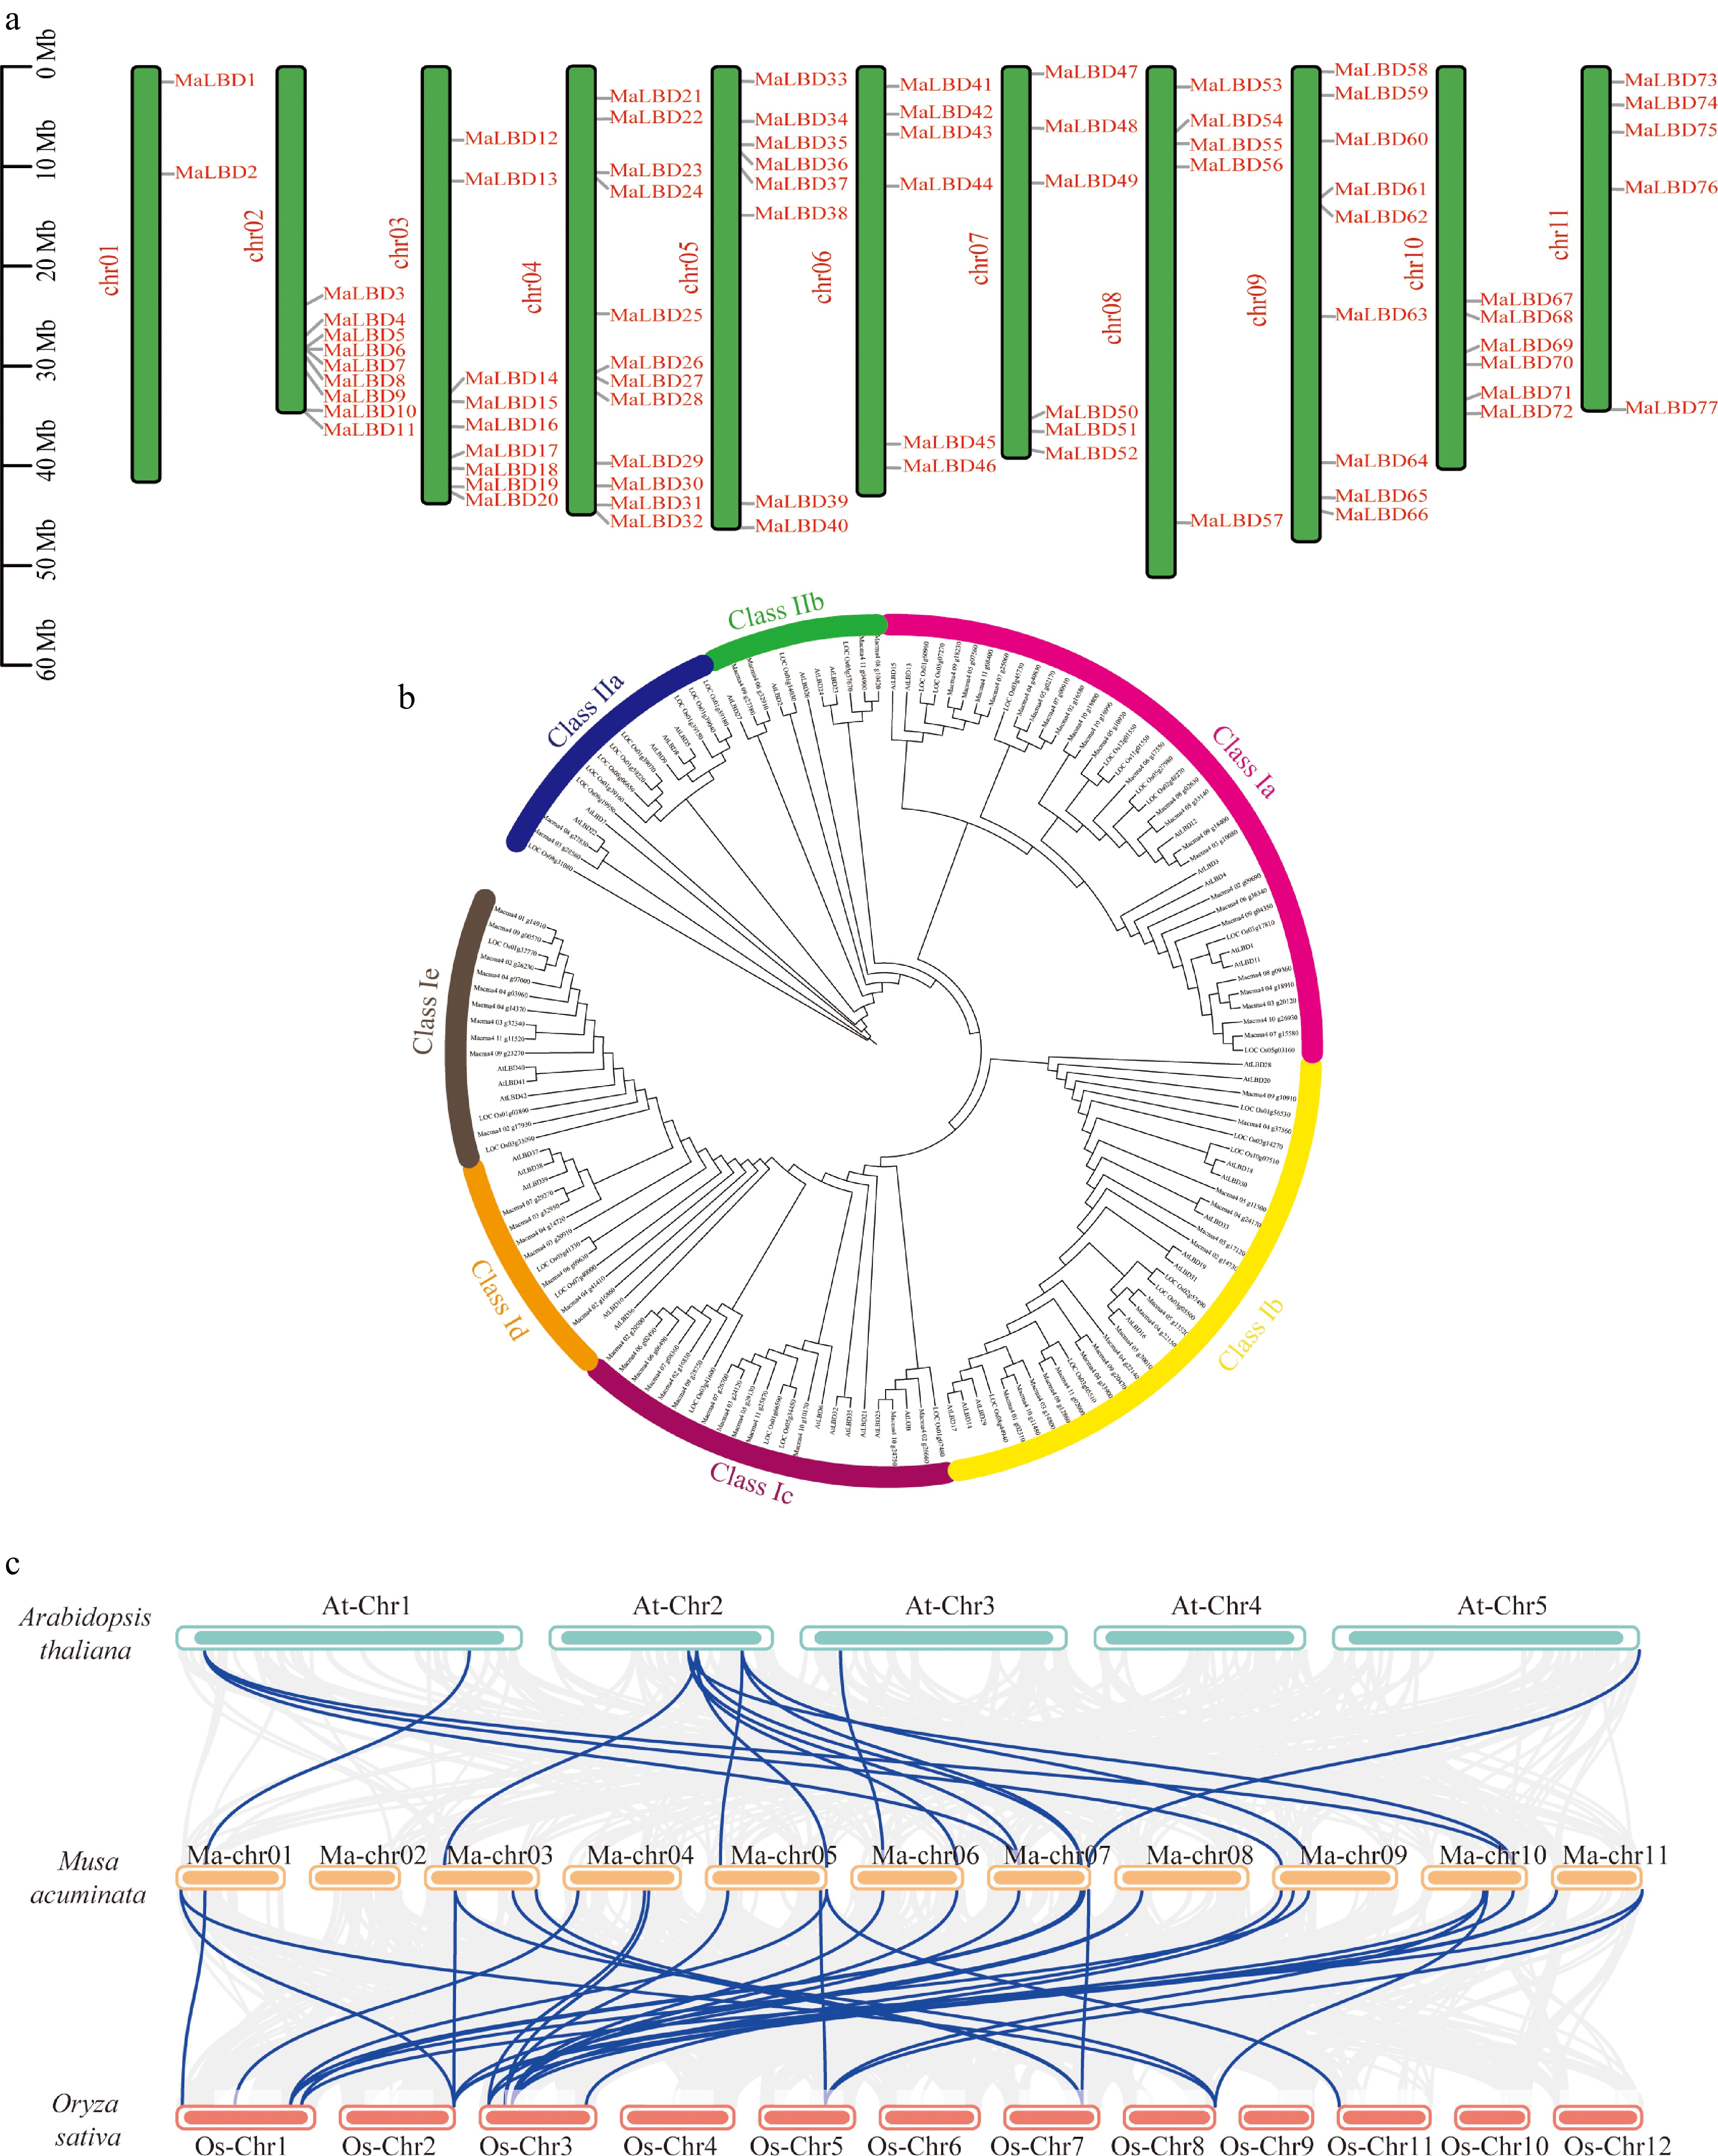
Figure 1.
Identification of MaLBD gene family members. (a) Chromosomal positions of MaLBD genes in banana. The vertical axis indicates chromosome length, chr01–11 denote chromosome numbers. (b) Phylogenetic tree for banana, A. thaliana, and rice LBD proteins. Differently colored rings represent distinct subclasses (Class Ia, Class Ib, Class Ic, Class Id, Class Ie, Class IIa, and Class IIb). (c) Synteny analysis of LBD genes among banana, A. thaliana, and rice. Gray lines indicate genome-wide syntenic gene pairs, and blue lines indicate syntenic gene pairs within the LBD gene family. Blue, yellow, and orange represent the chromosomes of A. thaliana, banana, and rice, respectively.
-
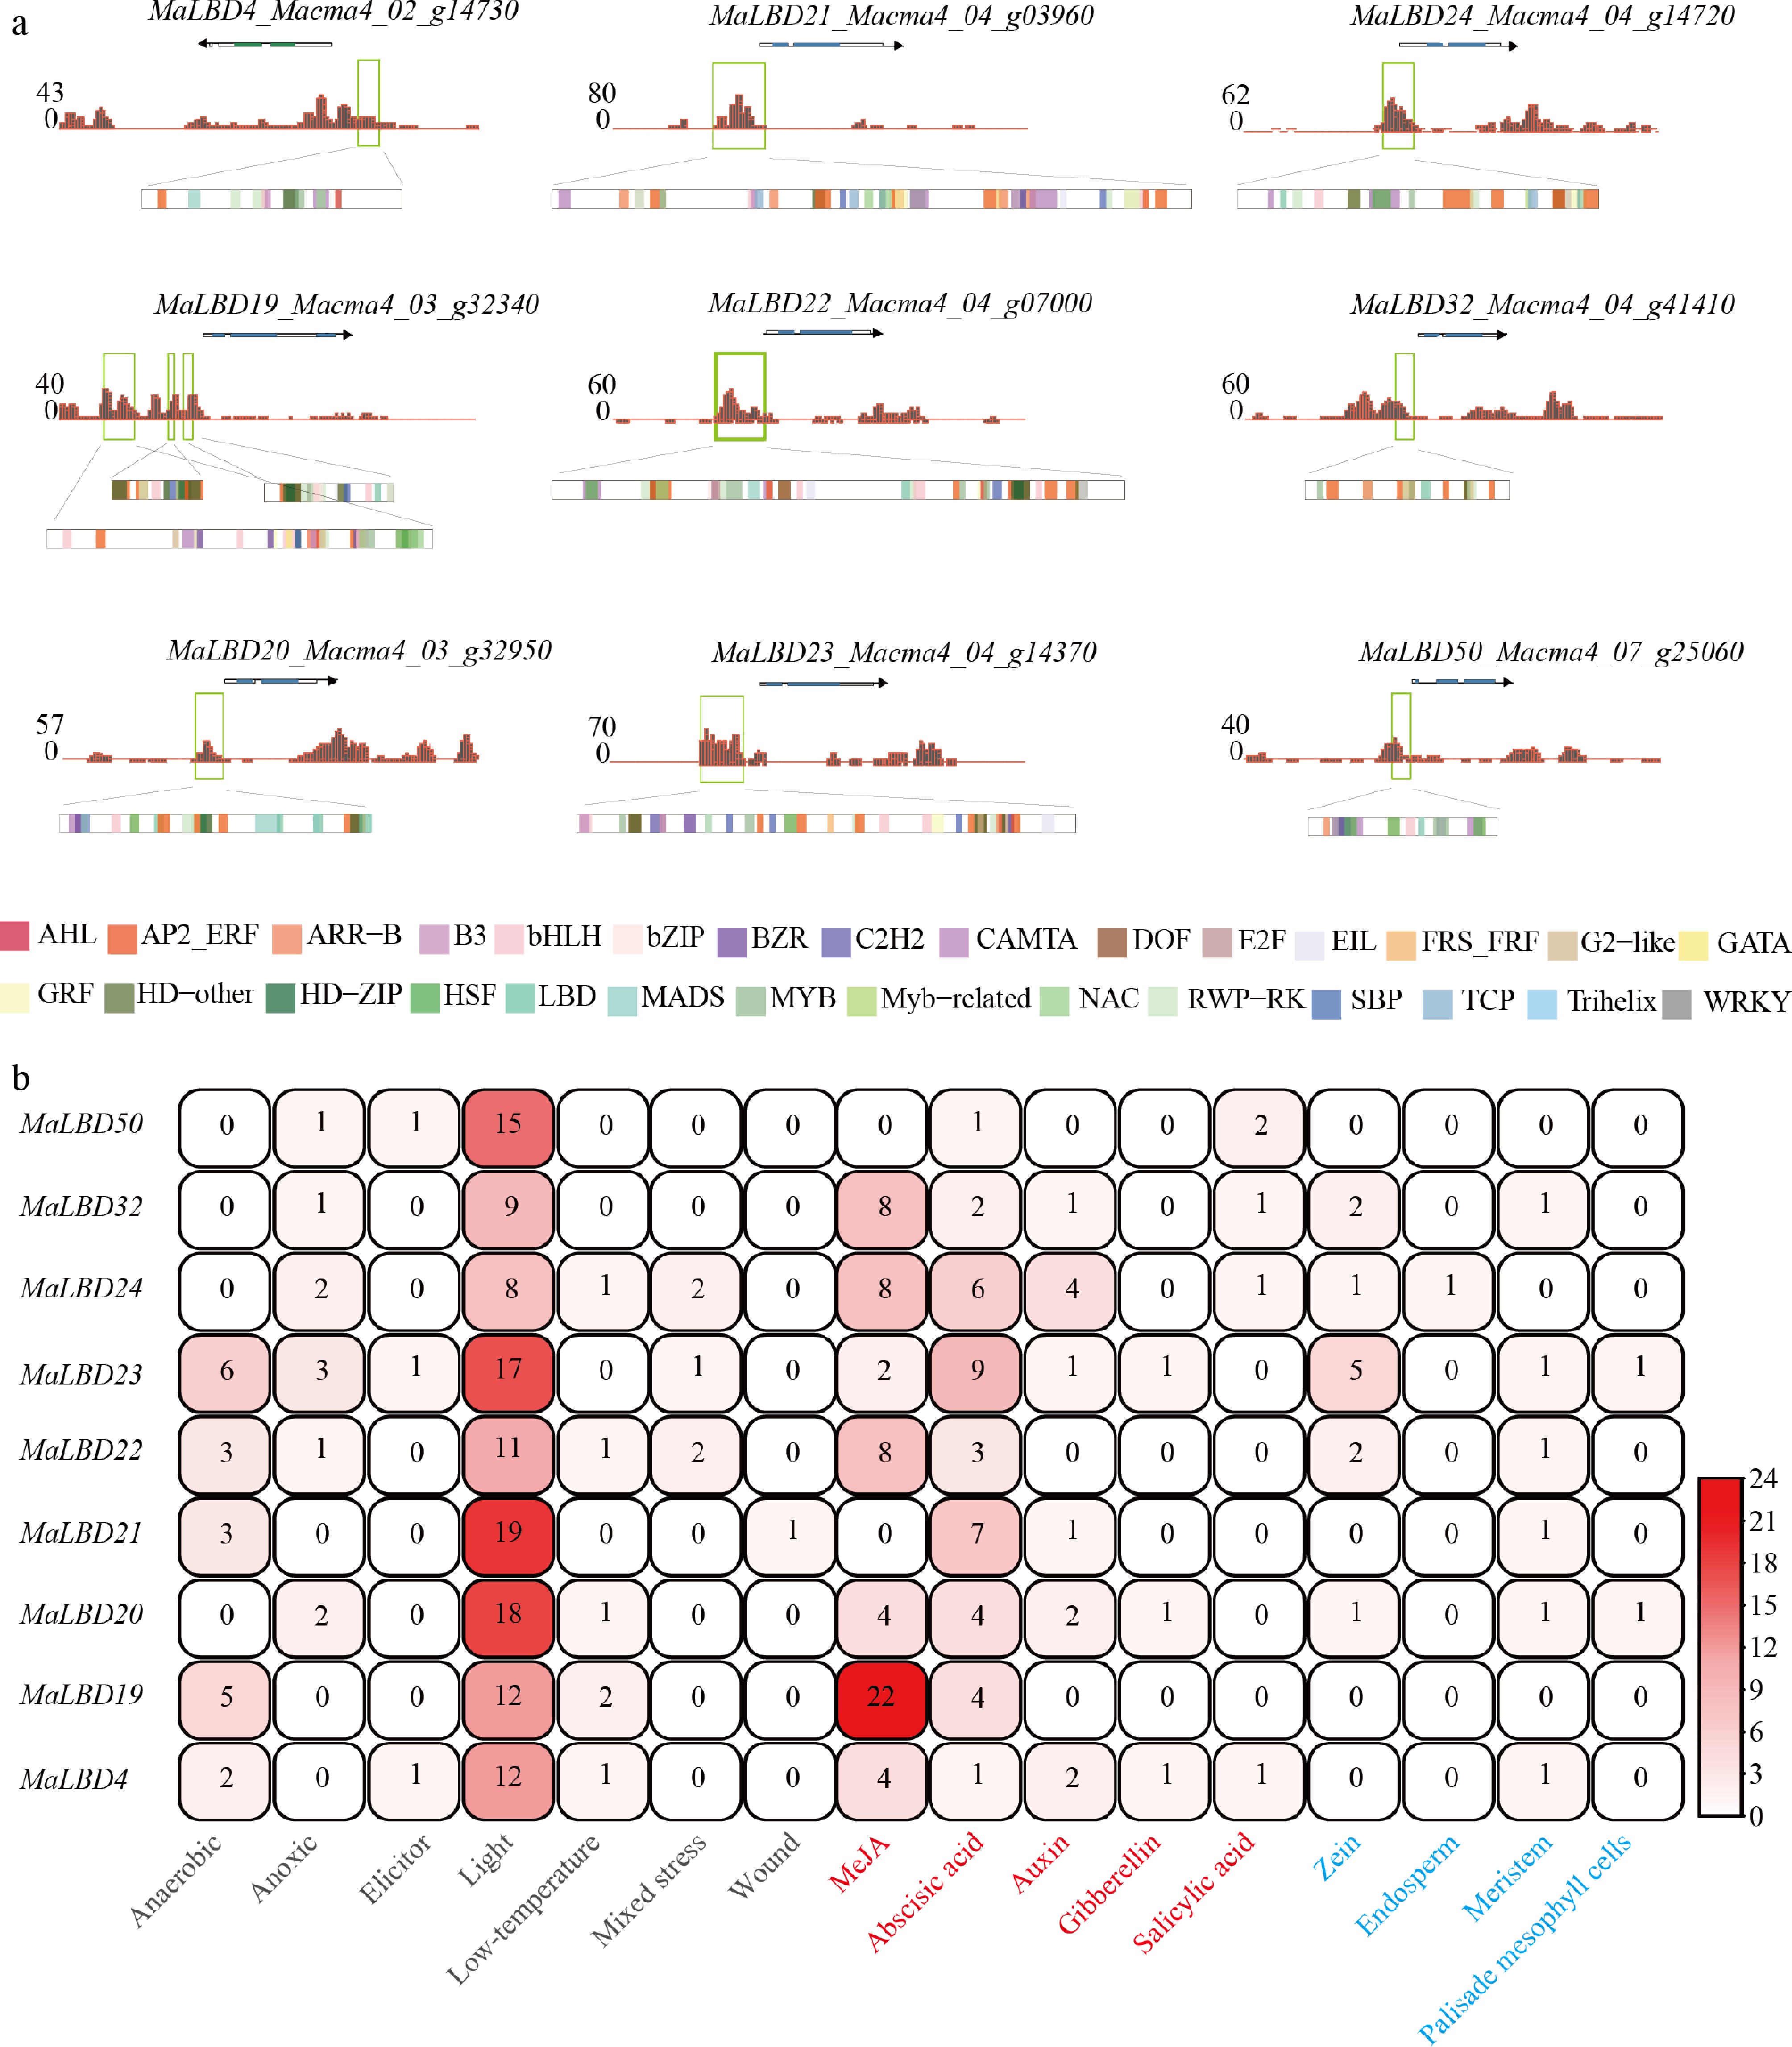
Figure 2.
Analysis of MaLBD gene promoters. (a) Chromatin accessibility and transcription factor-binding motif analysis. Brown peaks indicate DNase-seq signal intensity (open chromatin). Colored rectangles represent predicted transcription factor-binding motifs (color-coded by family). (b) Heatmap of cis-acting element numbers in MaLBD gene promoters. The color scale indicates the number of elements.
-
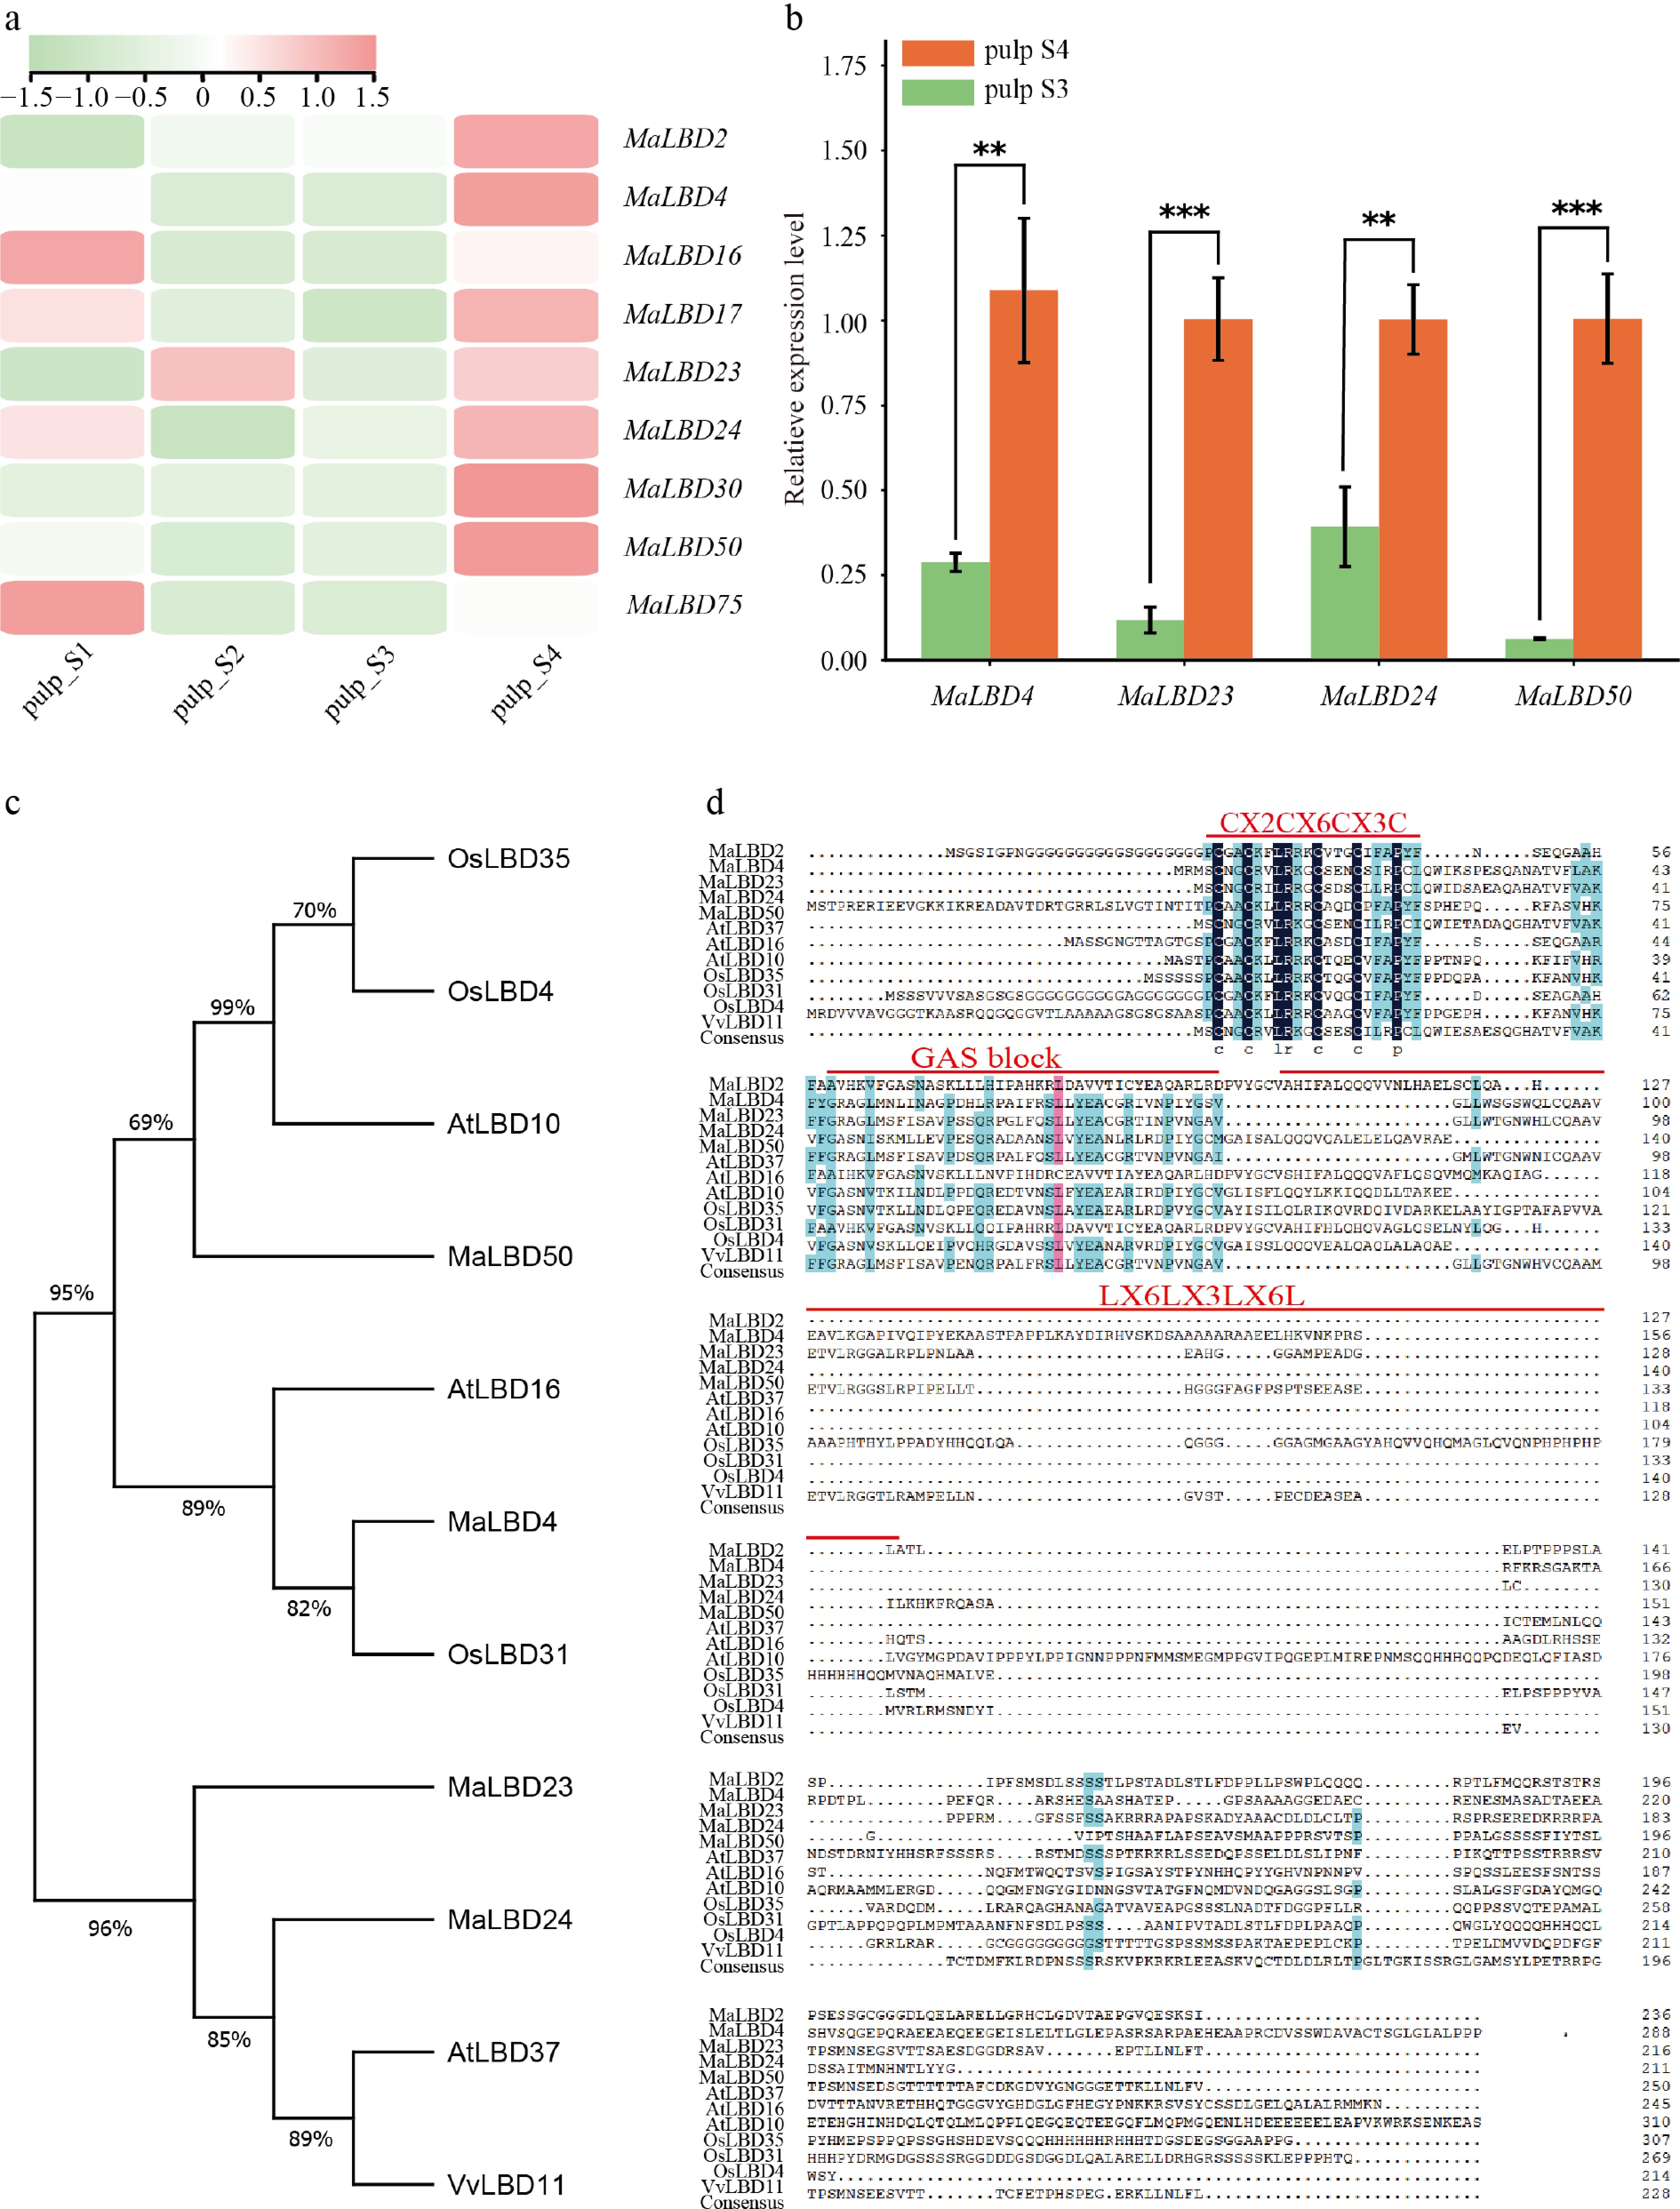
Figure 3.
Expression level of MaLBD genes during banana fruit ripening. (a) Expression heatmap of selected MaLBD genes during banana fruit development and ripening. Stage 1 (S1, fruit set), small green fruit; S2 (immature), larger green fruit; S3 (mature green), full-size green fruit, firm pulp; S4 (fully ripe), yellow peel, soft pulp. Detailed phenotypic descriptions are provided in the main text. (b) Expression levels of MaLBD4, MaLBD23, MaLBD24, and MaLBD50 at S3 and S4 as determined by qRT-PCR. Student's t-test was used for statistical analysis. ** p < 0.01, *** p < 0.005. Data are presented as the mean ± SD (n = 3). (c) Phylogenetic tree of MaLBD4, MaLBD23, MaLBD24, and MaLBD50 from Musa acuminata; AtLBD10, AtLBD16, and AtLBD37 from Arabidopsis thaliana; OsLBD31, OsLBD4, and OsLBD35 from Oryza sativa; and VvLBD11 from Vitis vinifera. (d) Multiple sequence alignment of these LBD proteins.
-
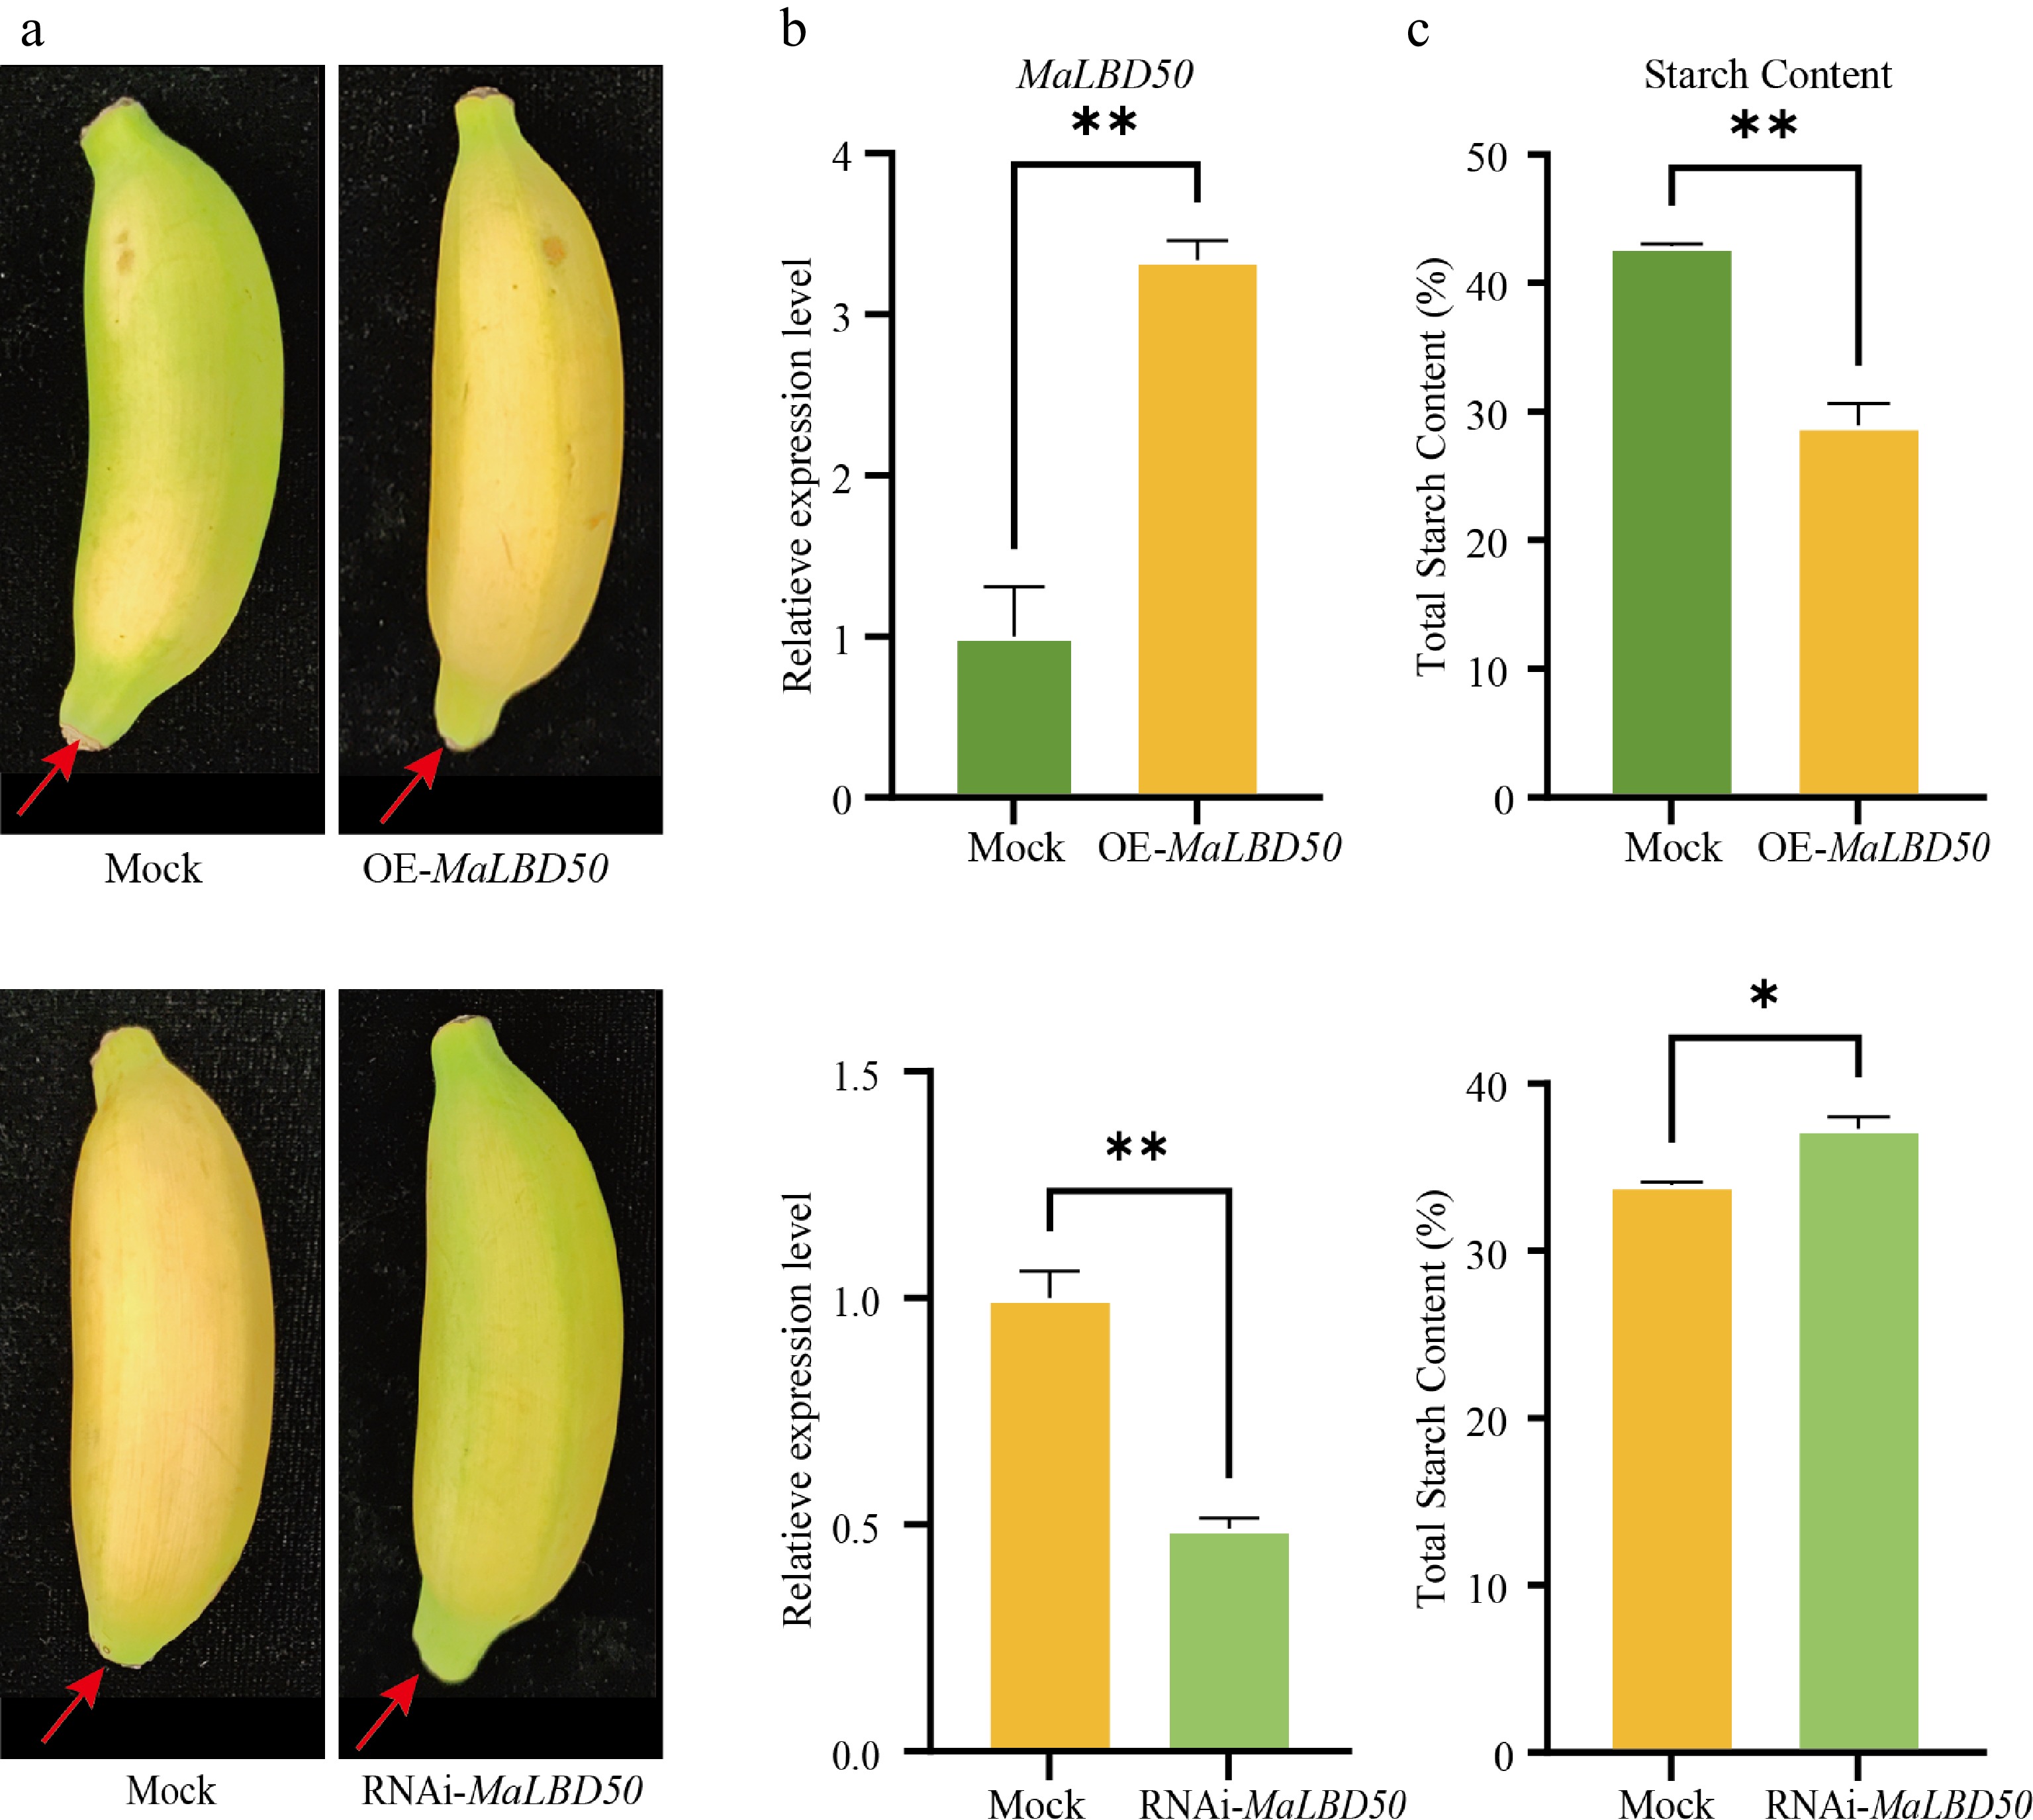
Figure 4.
Effects of MaLBD50 transient transformation on banana fruit ripening. (a) Phenotypes of banana fruits after transient transformation of MaLBD50. Red arrows indicate the injection site of the infiltration solution. (b) Expression levels of MaLBD50 after transient transformation as determined by qRT-PCR. (c) Starch content in the pulp of banana after transient transformation of MaLBD50. Student's t-test was used for statistical analysis. * p < 0.05, ** p < 0.01. Data are presented as the mean ± SD (n = 3).
-
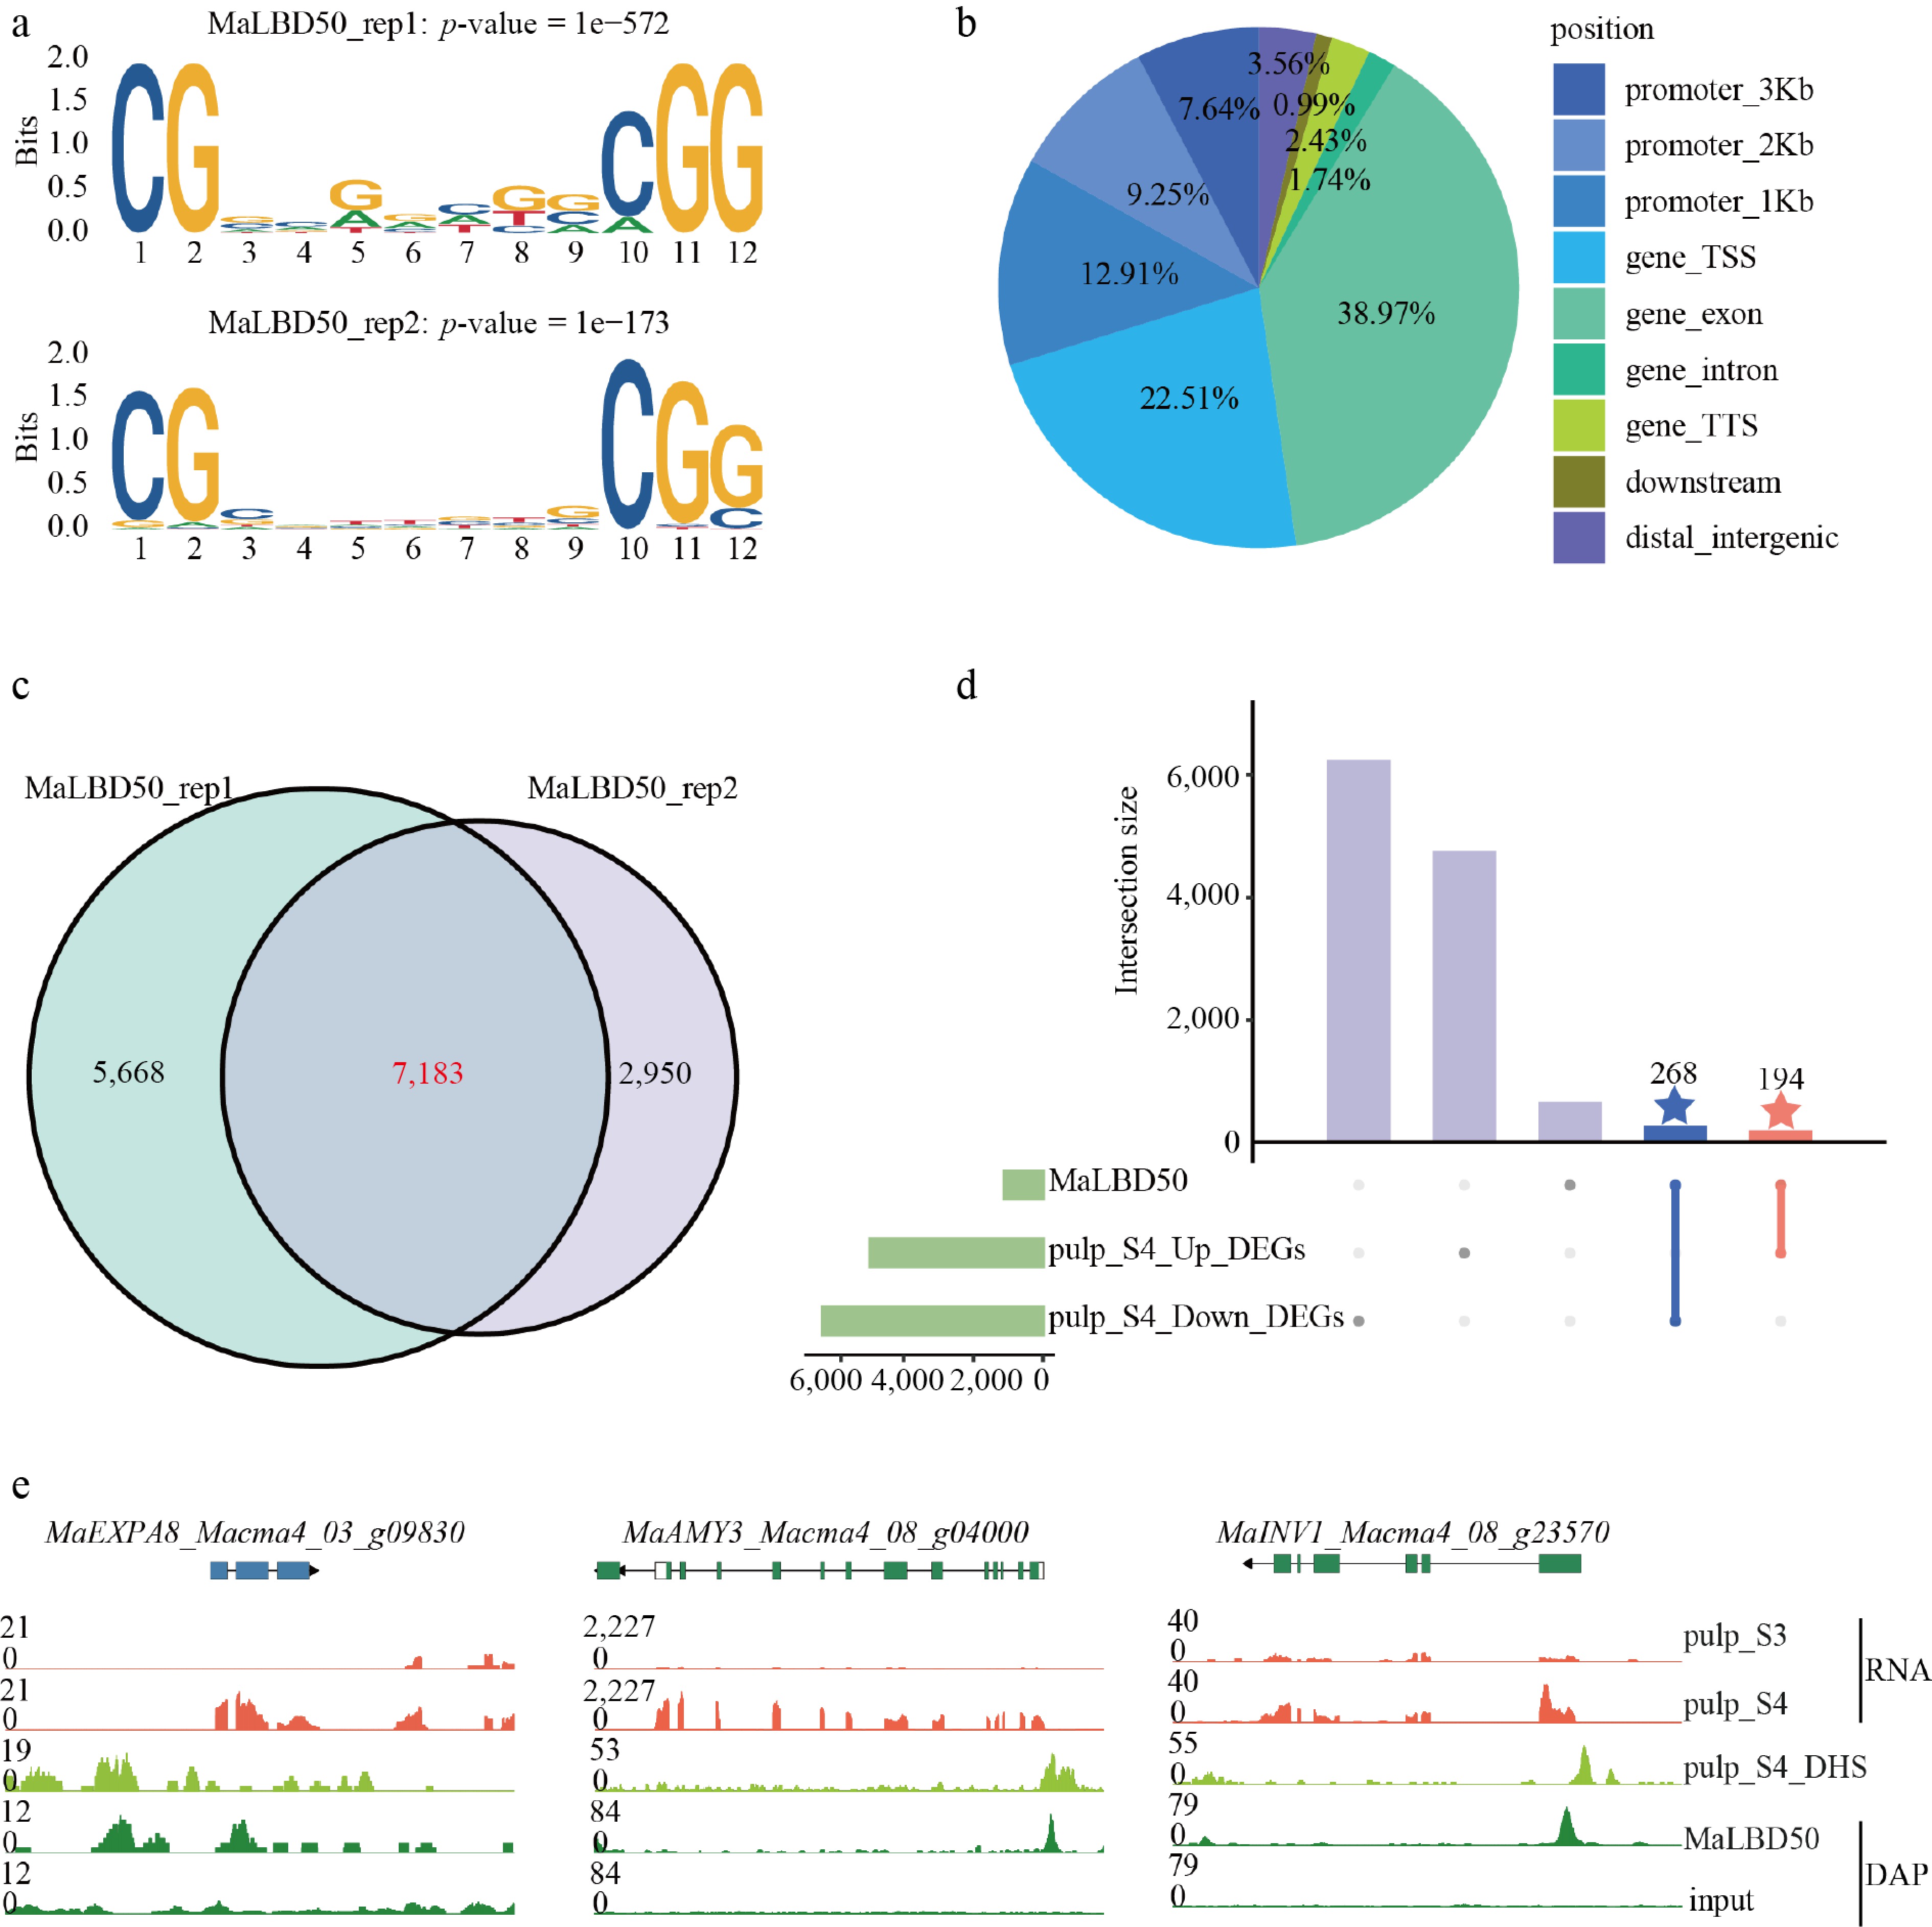
Figure 5.
Regulatory model of MaLBD50 during banana fruit ripening. (a) Binding motif of MaLBD50 revealed by DAP-seq data; rep1 and rep2 represent two biological replicates. (b) Peak distribution of MaLBD50 DAP-seq data. (c) Venn diagram of MaLBD50 target genes identified from two biological replicates. (d) UpSet plot showing overlaps between MaLBD50 target genes and upregulated (Up_DEGs) or downregulated (Down_DEGs) differentially expressed genes in ripening pulp (Stage 4, S4). (e) Dynamic changes in expression and chromatin accessibility of MaLBD50 target genes (MaEXPA8, MaAMY3, and MaINV1) in pulp during banana fruit ripening.
-
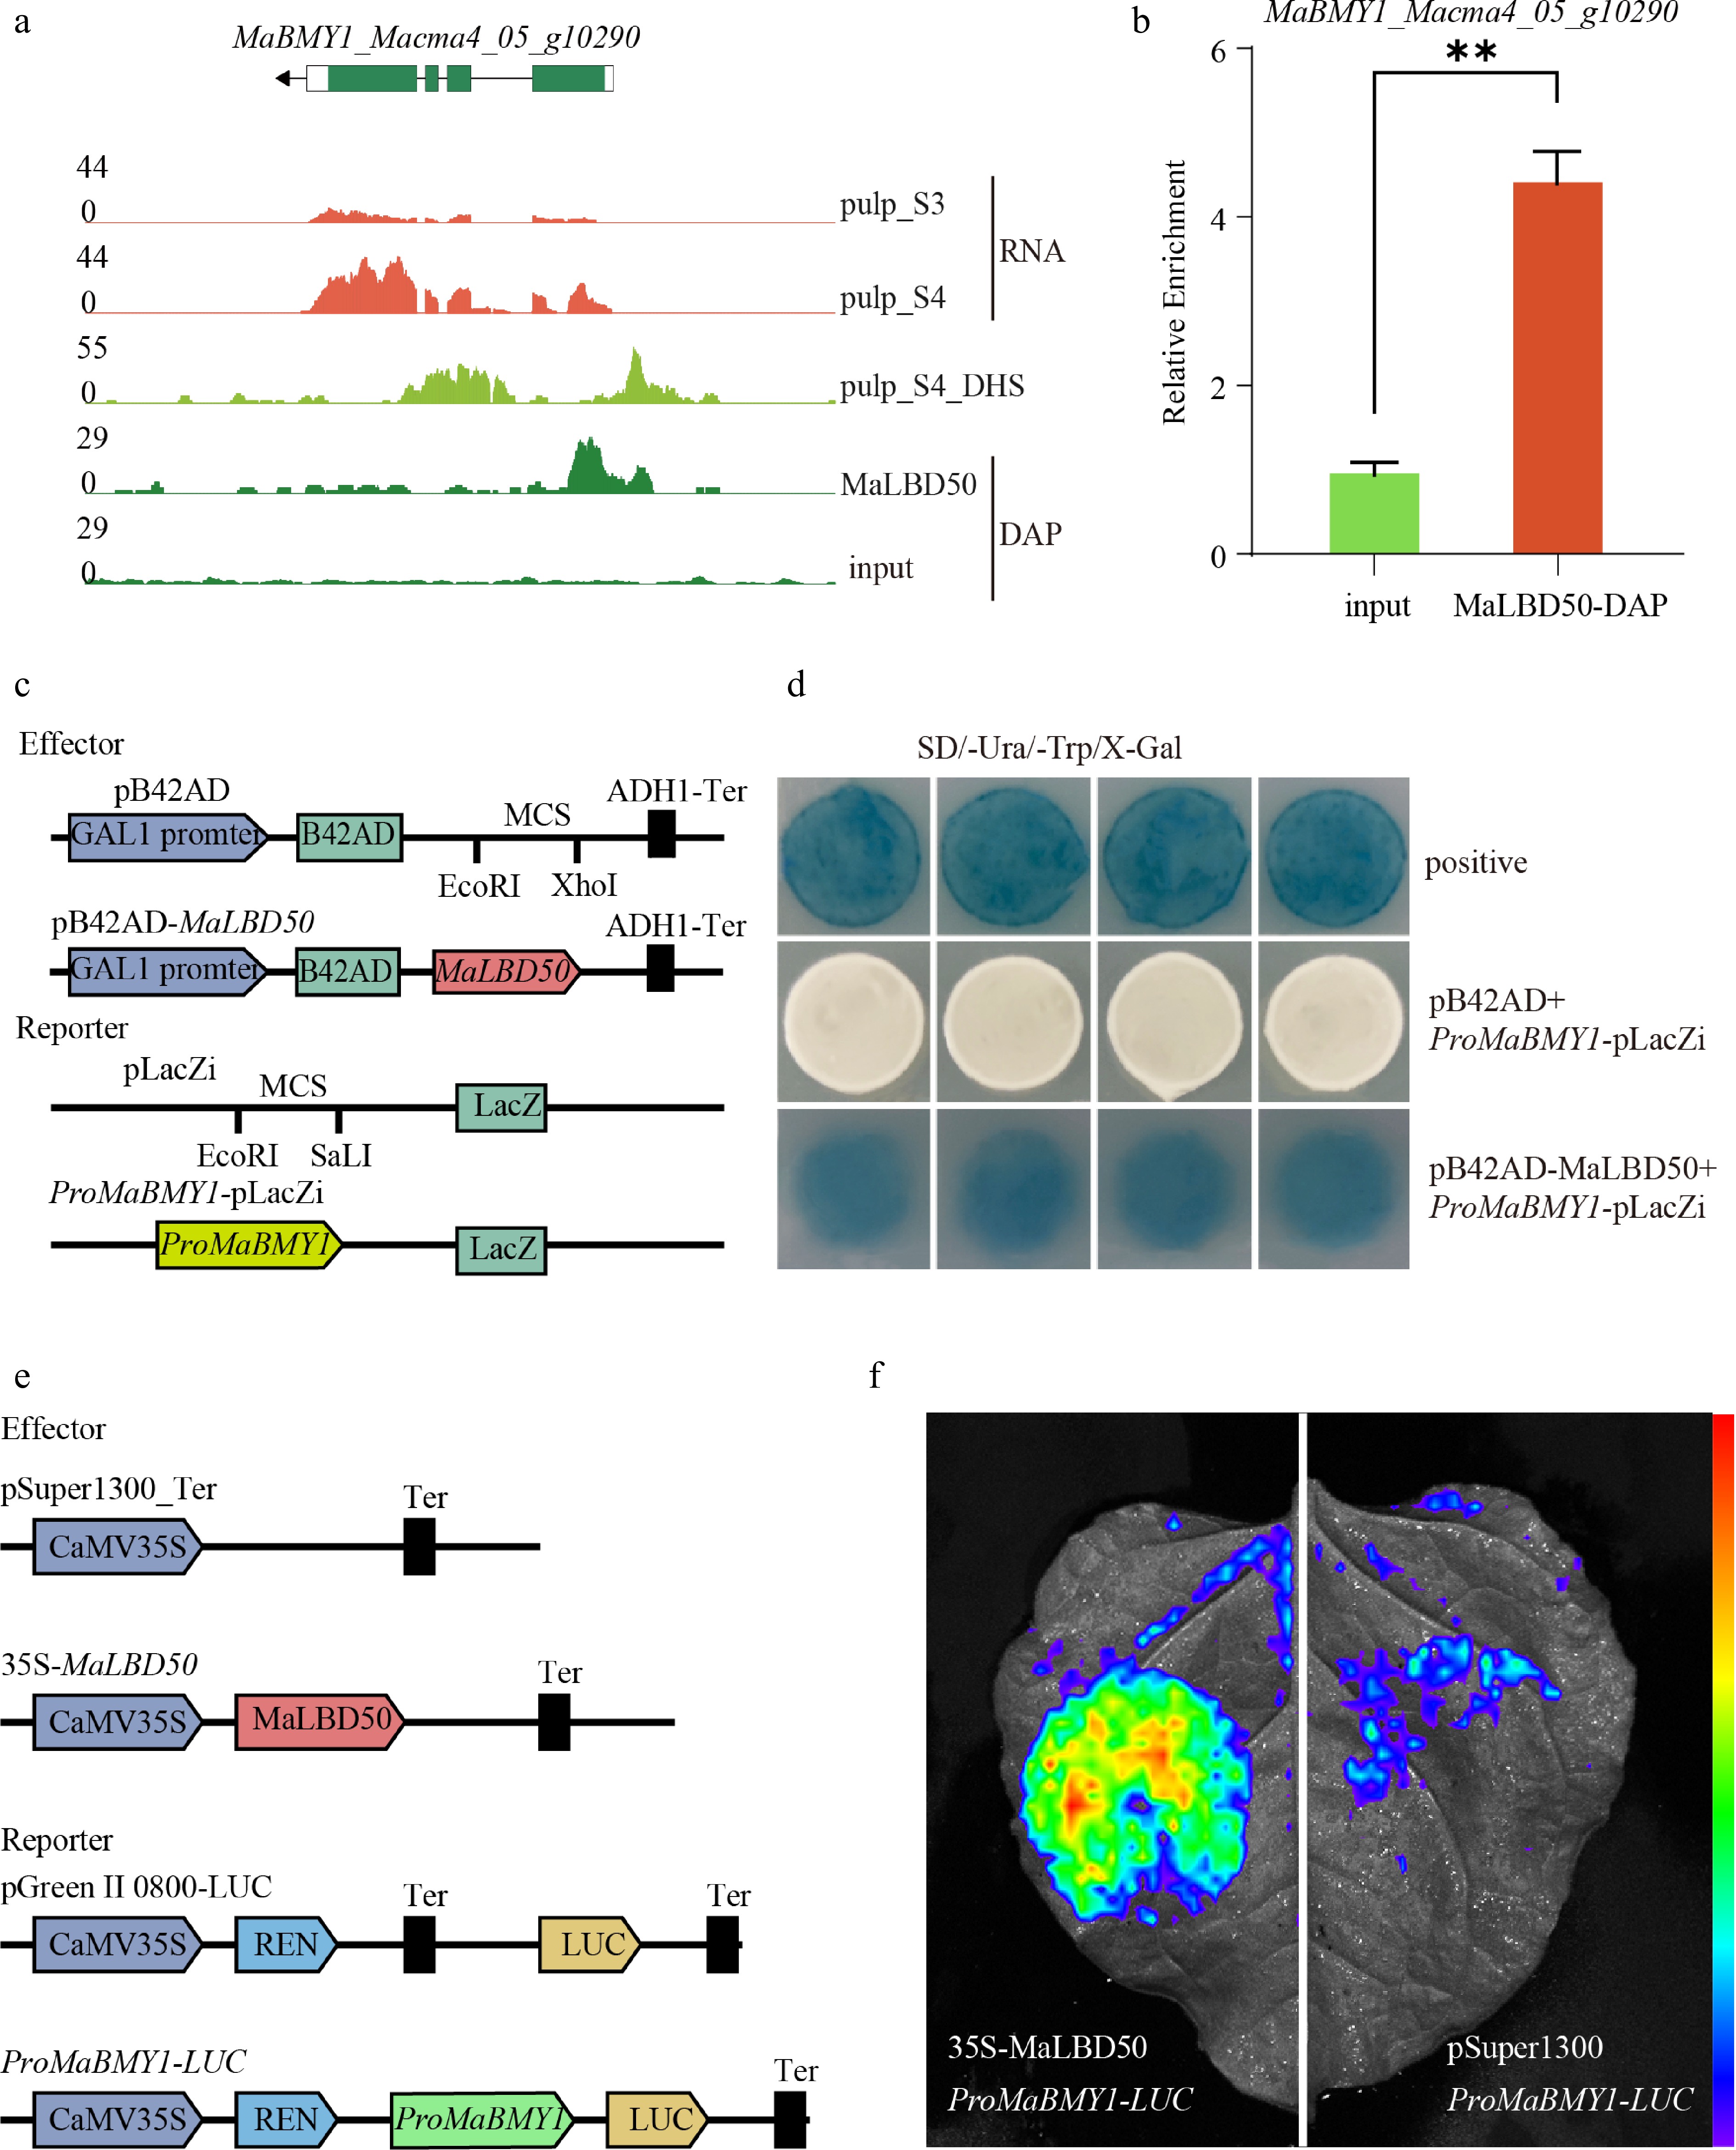
Figure 6.
Regulation of MaBMY1's expression by MaLBD50. (a) Expression levels, promoters' chromatin accessibility, and MaLBD50-binding sites of MaBMY1. (b) Enrichment of MaLBD50 binding to the MaBMY1 promoter as determined by DAP-seq qPCR. (c) Schematic diagram of yeast Y1H assays and vector construction. (d) Validation of MaLBD50 binding to the promoters of MaBMY1 by the Y1H assay. (e) Schematic diagram of the DLR reporter vector constructs. (f) Luciferase (LUC) activity detected by live imaging in tobacco leaves. Student's t-test was used for statistical analysis. ** p < 0.01. Data are presented as the mean ± SD (n = 3).
Figures
(6)
Tables
(0)