-
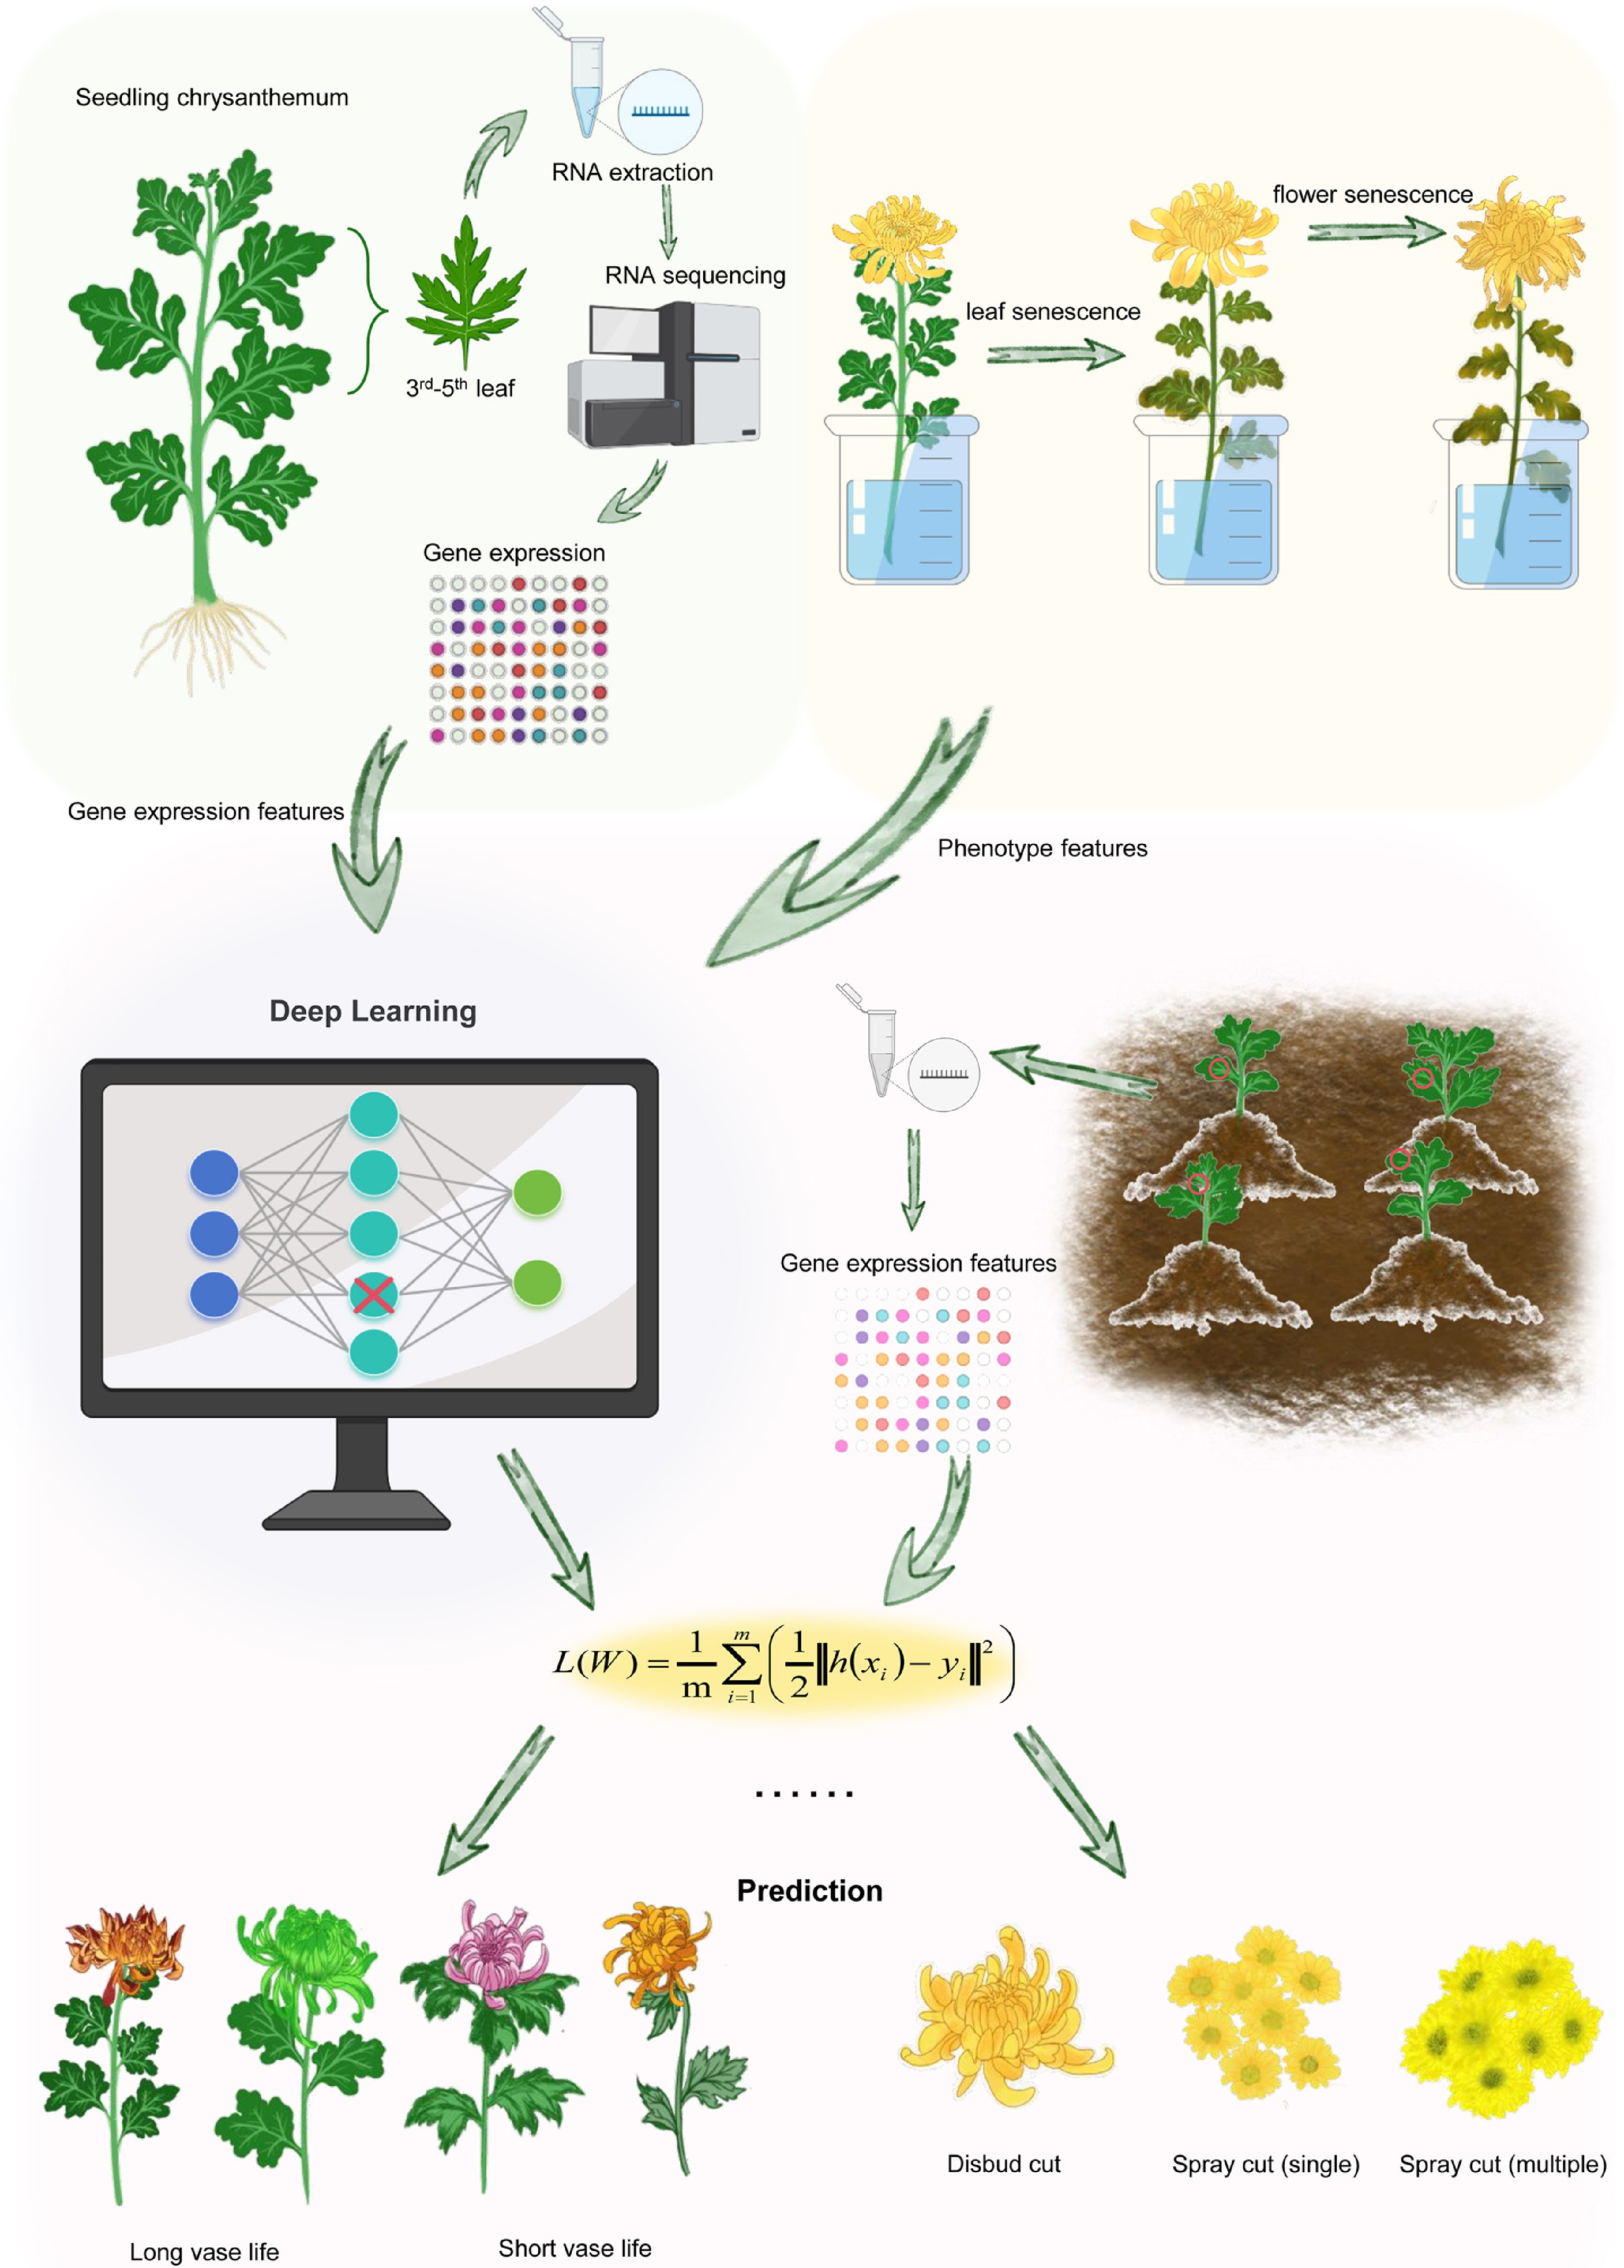
Figure 1.
The overall design of this study. Schematic representation of the predicting adult plant phenotypes using the transcriptional data from seedlings by machine learning method. For each seedling, we generated gene transcriptional data from the third to fifth leaves, and collected the leaf vase life and flower type phenotype data from adult plants. These data are used as inputs into the Keras of the TensorFlow platform to predict the phenotypes of adult plants. The performance of model was assessed using another plant population.
-
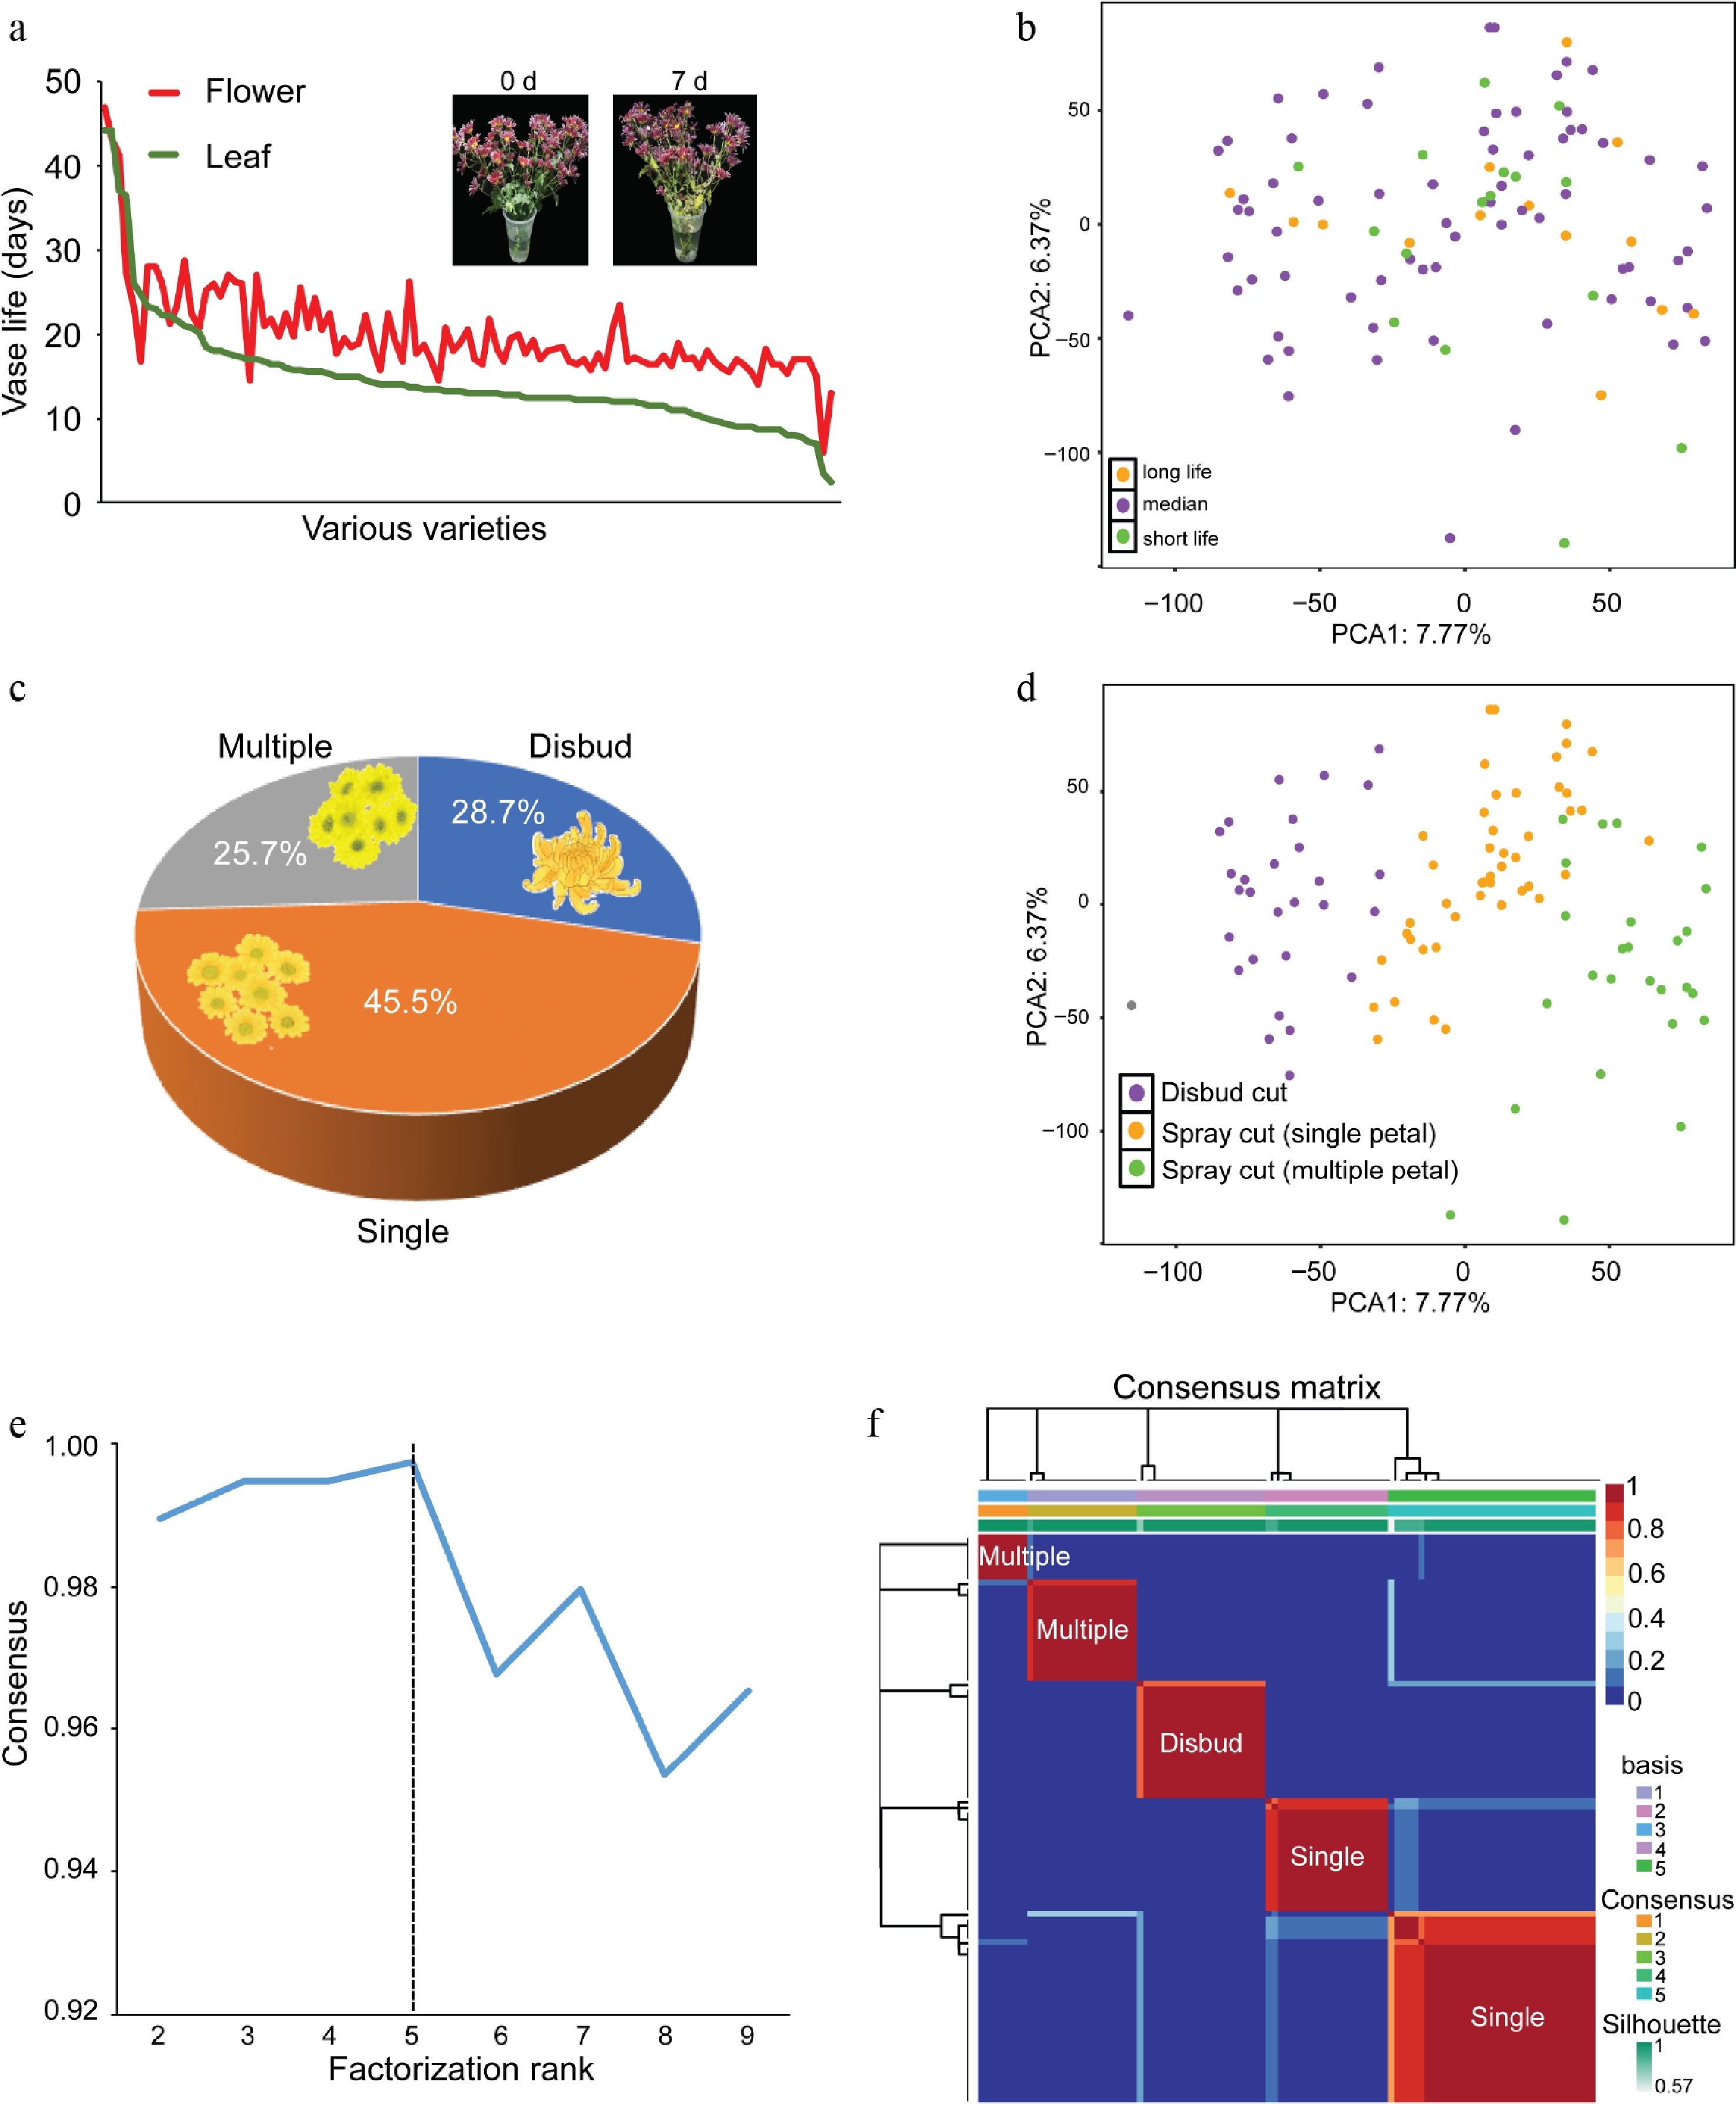
Figure 2.
The chrysanthemum population used for machine learning. (a) The leaf vase life and flower vase life of each chrysanthemum cultivar were assessed. An illustration of a vase test on cut chrysanthemums at 0 days and 7 days was presented, revealing noticeable leaf yellowing, whereas the flowers appeared unchanged during this period. (b) A PCA plot illustrating the gene expression patterns across various samples. The samples were categorized into three groups according to leaf vase life, with distinct colors representing chrysanthemum samples from each group. (c) The composition of flower types in the chrysanthemum population is shown in a pie chart. (d) PCA plot showing the gene expression patterns across various samples. The samples were categorized into three groups according to flower types, with distinct colors representing chrysanthemum samples from each group. (e) Cophenetic correlation coefficients associated with different numbers of clusters. The y-axis is the cophenetic correlation coefficient; x-axis is the number of clusters. The dashed line displays the coefficient score was the largest in the five categories (k = 5). (f) The consensus score matrix of all samples when k = 5. A higher consensus score between two samples indicates they are more likely to be grouped into the same cluster in different iterations.
-
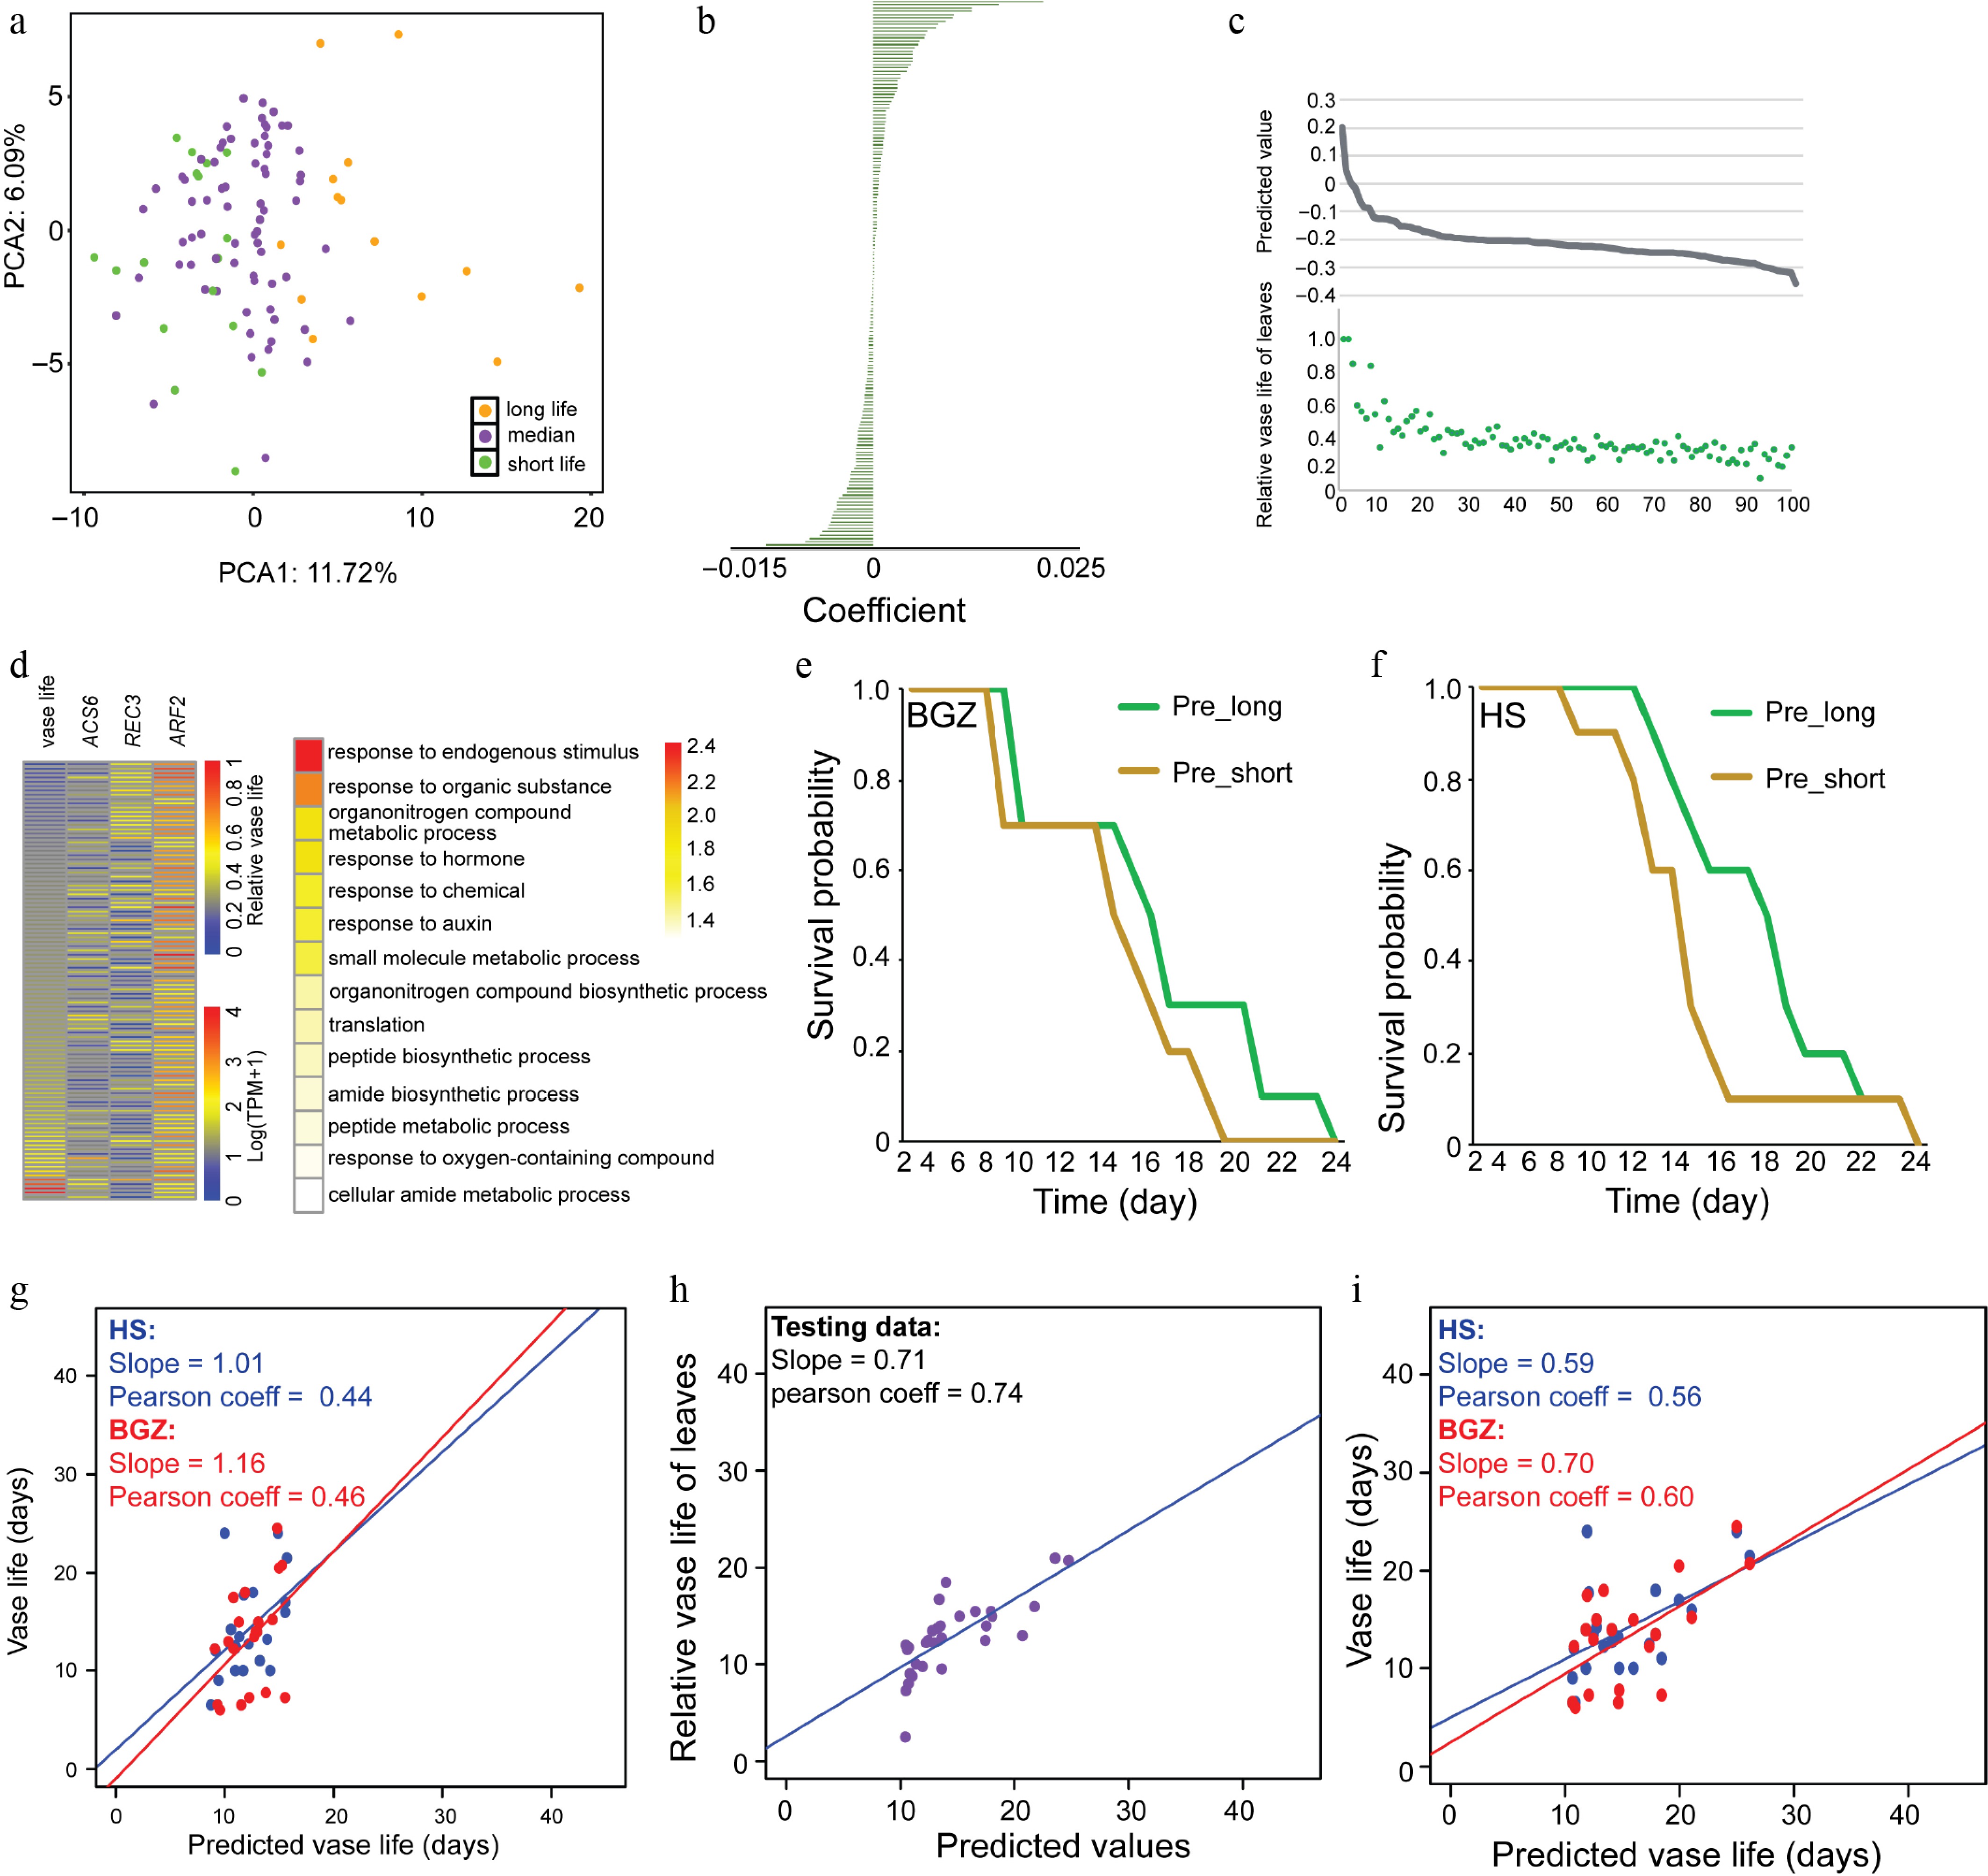
Figure 3.
Leaf vase life prediction using gene expression data from seedlings. (a) PCA plot showing the expression patterns of selected genes across various samples. The samples were categorized into three groups on the basis of leaf vase life, with distinct colors representing chrysanthemum samples from each group. (b) The order of the importance of the selected features. (c) The comparison of predicted value and relative vase leaf life of each sample. (d) Heat map of three senescence associated genes and leaf vase life in each sample (left) and GO enrichment analysis using the Arabidopsis thaliana homologs of the selected 166 genes (right). (e,f) Kaplan–Meier curves show that predicted long (pre_long) and short (pre_short) was significantly different between the long and short vase life groups in the populations grown at BGZ (e) and HS (f). (g−i) Scatterplots of predicted values versus manual measurements values of LASSO regression (g), deep learning model for testing data, (h) and other validation data (i).
-
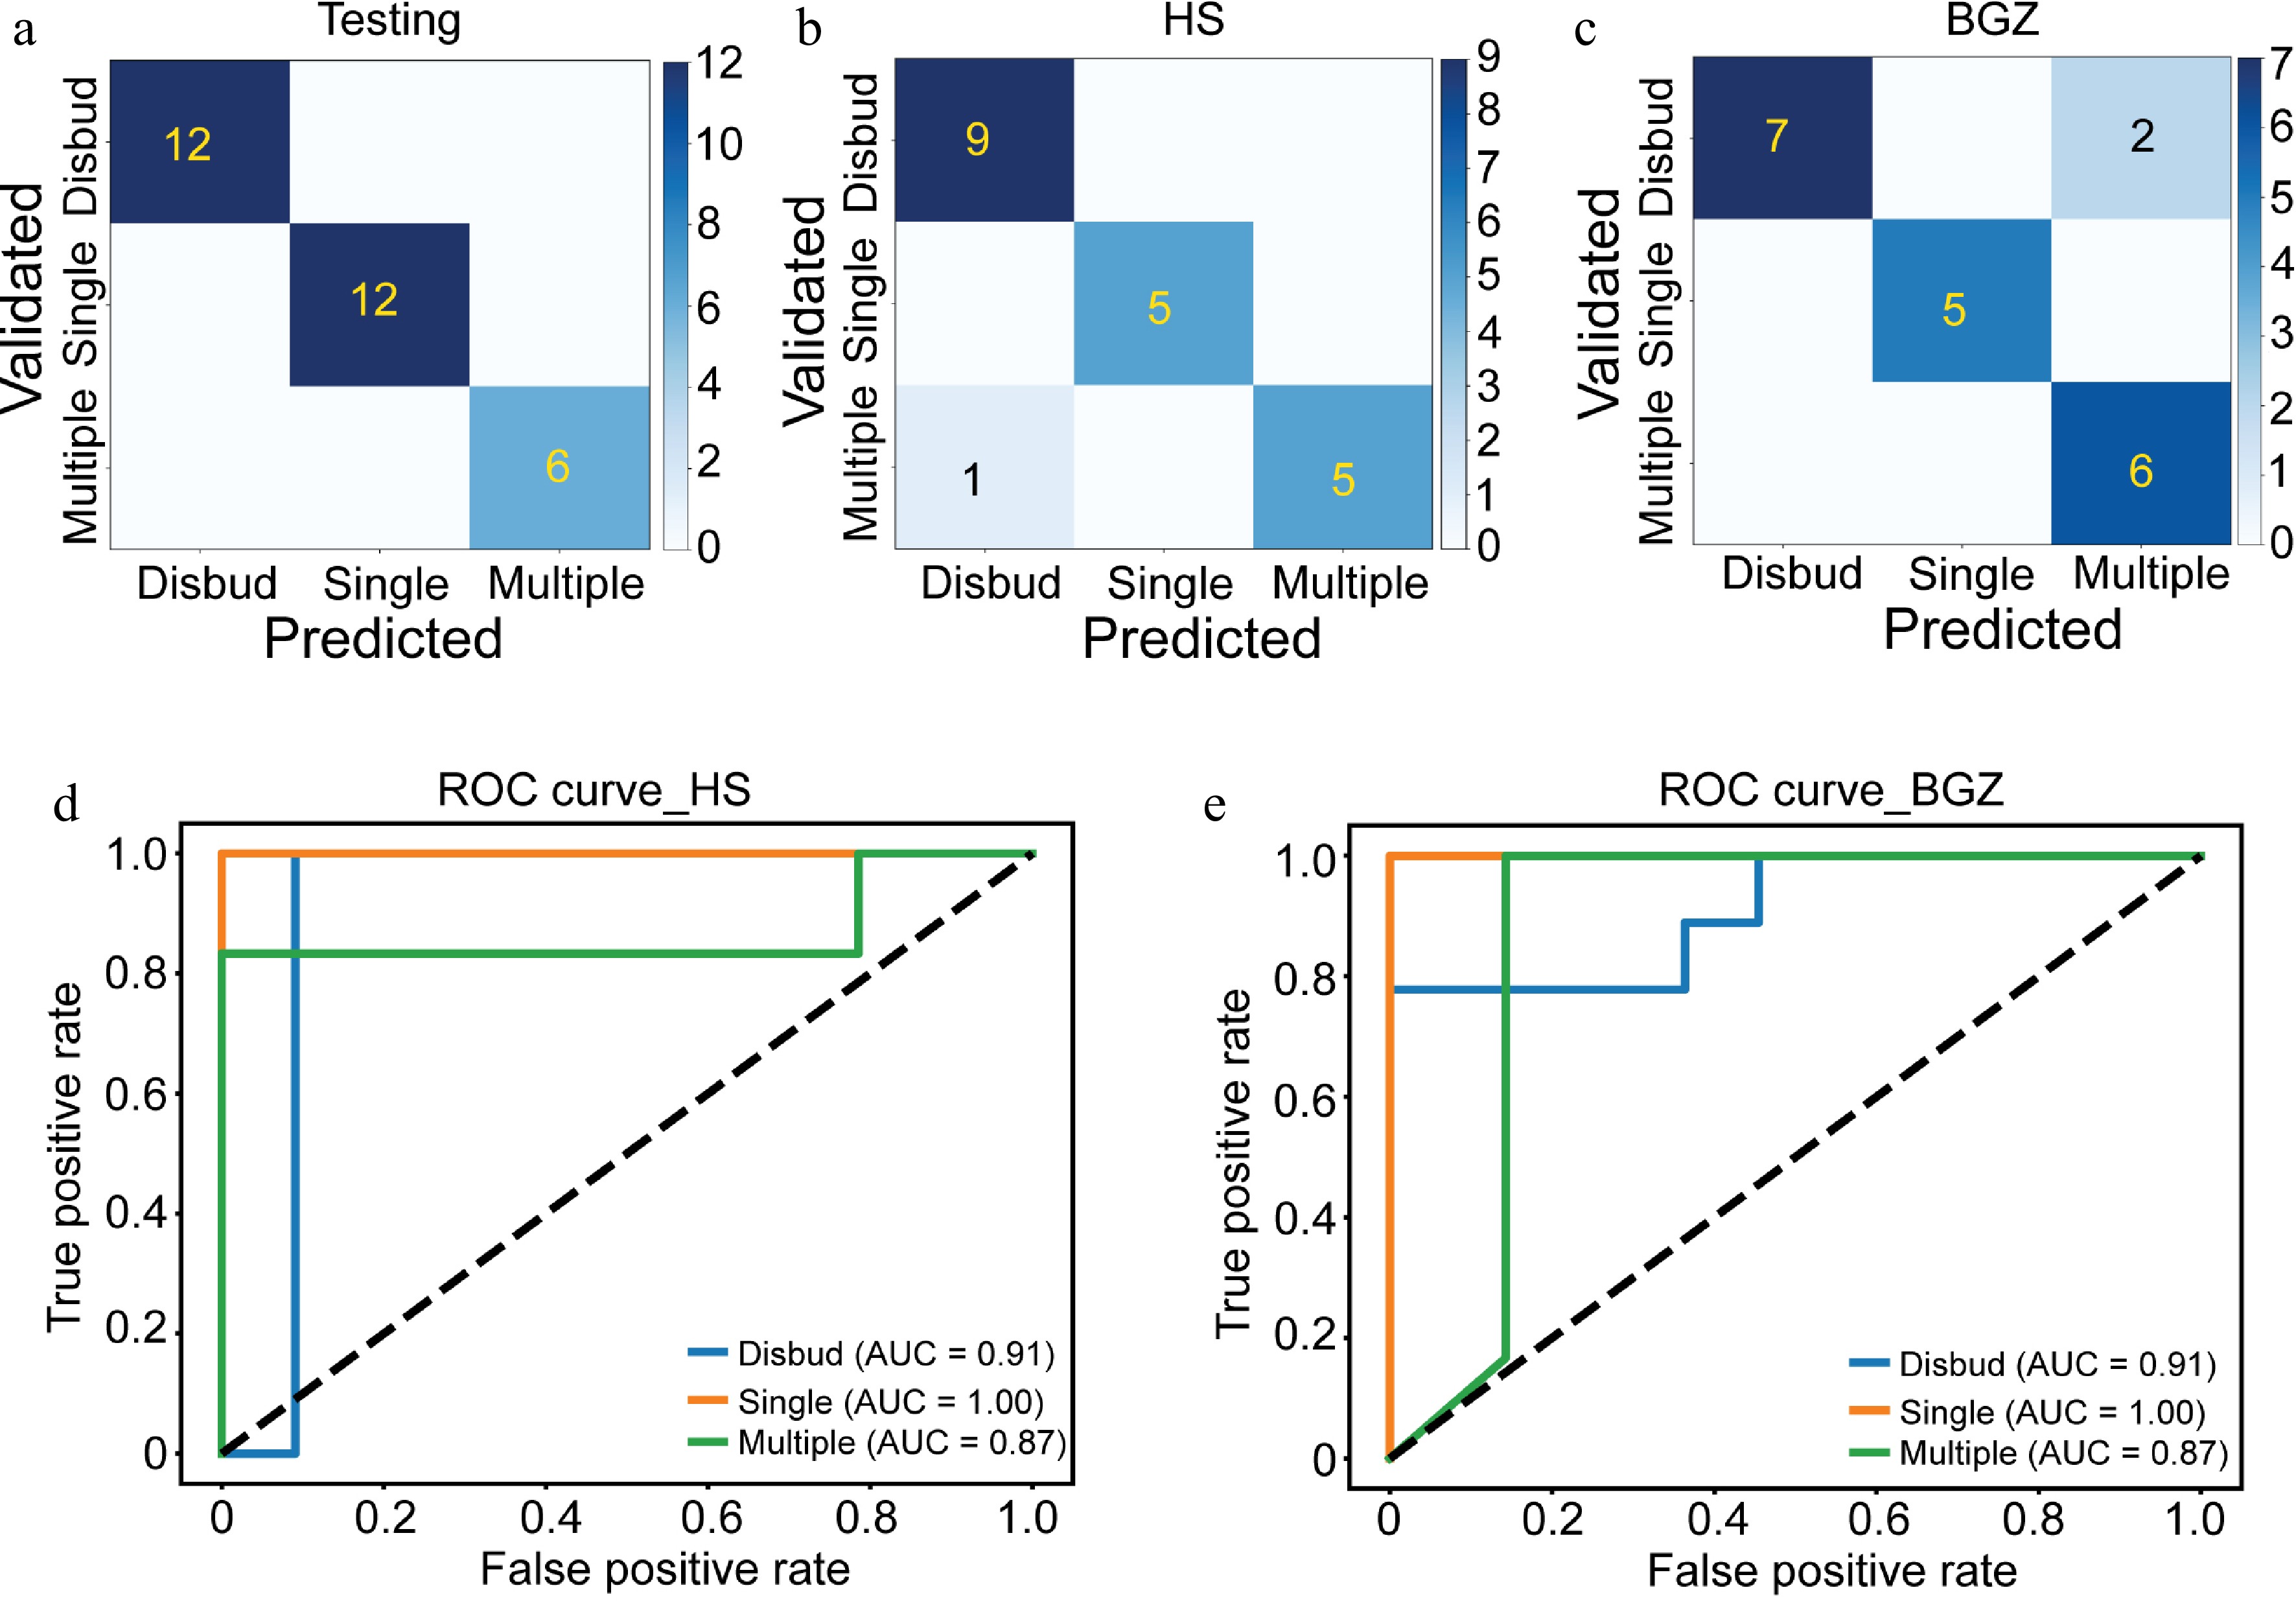
Figure 4.
Flower type prediction using gene expression data from seedlings. (a−c) Confusion matrix to evaluate the performance of the deep learning model using (a) testing data and validation data from (b) HZ and (c) BGZ. (d, e) ROC curves of deep learning model to predict the flower type in chrysanthemum population from (d) HS and (e) BGZ.
-
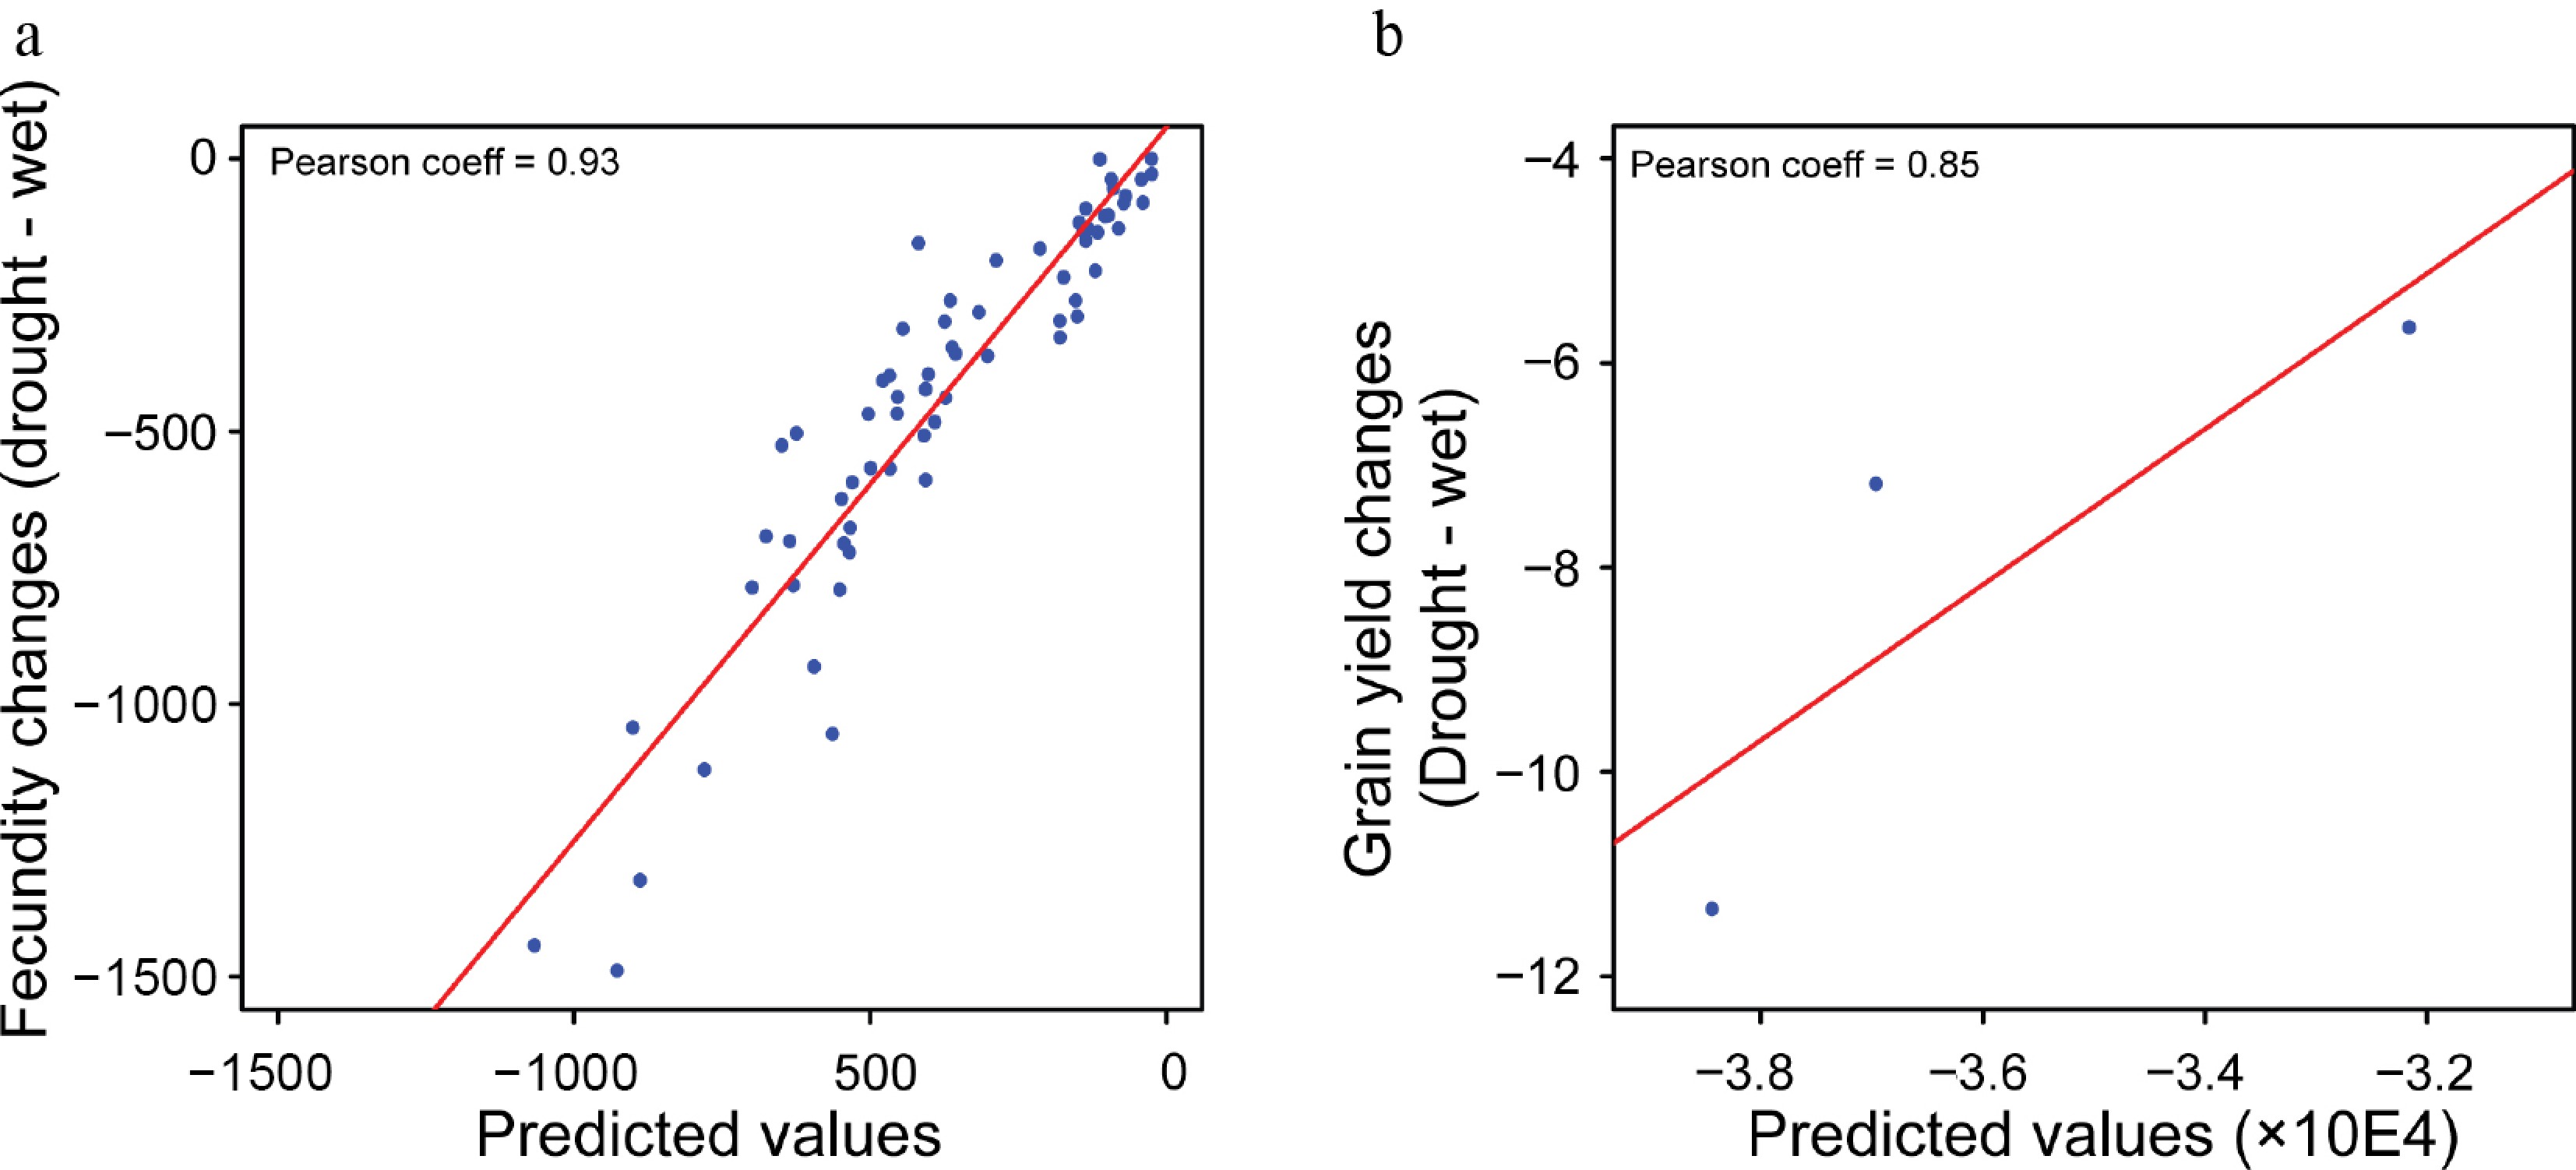
Figure 5.
Fecundity prediction using gene expression data from seedlings. (a, b) Scatterplots between the predicted values and measured values using the (a) testing data and (b) validation data.
Figures
(5)
Tables
(0)