


-
The development of an organism is intricately controlled by genetic and environmental signals. By incorporating environmental variables such as day length and temperature, along with the intricate interplay of genetic influences at the individual gene level across various environments, plant phenotypes like flowering time can be accurately predicted[1]. So far, genotype-to-phenotype prediction has emerged as a central approach to assist genomic selection-based breeding in the seed industry.
Machine learning techniques have been widely applied in predictive analytics. In the medical field, despite the underutilization of data in clinical settings, machine learning methods have been explored to aid in disease diagnosis and survival prognosis based on dozens of selected features[2−6]. For instance, the construction of immune-related long noncoding RNA (lncRNA) signatures has led to more accurate machine learning-based survival predictions using identified 43 prognostic lncRNAs compared with traditional clinical variables, molecular features, and other published signatures[3]. Within the field of food perception and evaluation, machine learning models have been leveraged to predict the flavors of specific compounds or compound combinations[7,8]. Notably, models based on the gradient boosting algorithm can accurately predict complex food features and consumer preferences, surpassing predictions based on conventional statistics[7]. In agricultural science, the utilization of complex machine learning models to link plant genotypes with phenotypes is gaining popularity. An increasing number of publications are predicting a diverse array of agronomic traits, such as yield, days to heading, and 1,000-kernel weight[9−12]. Traditional methods, including regression-based techniques, often face limitations in analyzing high-dimensional data and capturing intricate multivariate relationships between predictor and response variables[13]. In contrast, machine learning methods can effectively handle complex and nonlinear relationships within the data. Machine learning shows promise in translating biological knowledge and omics data into precision-designed plant breeding strategies, thereby accelerating crop breeding into the realm of artificial intelligence. Although artificial intelligence and machine learning have significantly influenced plant breeding, particularly for major crops, their potential applications in ornamental plant production and breeding have not been extensively explored.
Machine learning methodologies are increasingly advocated for and utilized in the realms of genomic selection and trait prediction. DNA variations, including single-nucleotide polymorphisms (SNPs), insertions and deletions (indels), and structural variations (SVs), serve as primary explanatory variables for predictive modeling[14]. Supplementary data sources, such as environmental information[15] and spectral information[16], have been harnessed to enhance predictive accuracy. Given that DNA markers and final phenotypes signify the endpoints of information flow, the incorporation of intermediary layers like transcriptomic and proteomic data into machine learning frameworks may better capture information dynamics, thereby enhancing the accuracy of predictions. Additionally, strategies aimed at reducing noise-introducing factors, such as restricting analyses to functionally annotated variants or evolutionarily conserved genes, have been proposed to optimize machine learning's performance[17,18]. Despite these advancements, the performance of machine learning-based predictions utilizing gene expression data remains largely unexplored.
Chrysanthemum species exhibit a complex genetic background characterized by high repetitiveness, heterozygosity, and genome size, and they are recognized as segmental allopolyploids[19]. In polyploid species, identifying SNPs, indels, and SVs is particularly challenging because it requires one to distinguish homologous variants from allelic ones, especially given the high genetic similarity among subgenomes[20]. The intricacies of SNP/indel/SV mining pose challenges for the accurate implementation of DNA variation-based machine learning predictions. Gene expression reflects both genetic regulatory mechanisms and environmental stimuli, offering potential as a robust alternative for phenotype prediction in plants harboring complex genomes. In this study, we propose using gene expression data from seedlings for predicting adult plant phenotypes, exemplified by its application in predicting leaf vase life and flower types in chrysanthemums. Furthermore, we evaluate the performance of this approach for predicting yield traits in rice (Oryza sativa). Collectively, our findings indicate the high sensitivity of phenotype prediction afforded by transcriptional-based deep learning methodologies.
-
Cut chrysanthemum flowers were obtained from the Chrysanthemum Germplasm Resource Conservation Center in Nanjing Agricultural University (Nanjing, China). In total, 101 cultivars were grown in HuShu (HS), with an additional 20 duplicated cultivars grown in HS and BaGuaZhou (BGZ) for validation purposes (Supplementary Fig. S1).
For plant growth conditions, chrysanthemum cuttings were transplanted into a greenhouse environment, maintaining a diurnal temperature range of 25/18 °C, a photoperiod of 16 h, light intensity set at 120 µmol/m2s, and a relative humidity of 70%.
Vase test of cut chrysanthemum
-
To assess the vase life of each cut chrysanthemum flower, a vase evaluation was conducted. Following harvest, the cut flowers were stored at 5 °C for 7 d to mimic storage and transportation conditions. Subsequently, they were recut and rehydrated in deionized water for 24 h before being arranged in vases for the vase life test. Each test group consisted of four cut chrysanthemums placed in a single vase, constituting one replication, with three replications conducted for each cultivar. The vase life of both leaves and flowers in the vases was monitored daily.
RNA extraction and RNA-seq analysis
-
From seedlings with approximately eight leaves, we collected the fourth leaf from each plant, and combined these leaves into a single sample for each cultivar. Typically, two biological replicates of leaf samples were collected per cultivar. Total RNA was extracted using the Quick RNA Isolation Kit (Waryong, Beijing, China) and sequenced on the BGI DNBSEQ-T7 platform. Adaptor sequences and low-quality reads were removed, and the clean data were aligned to the chrysanthemum transcriptome reference[19] using Kallisto (version 0.46.0; parameter: −b 100). Kallisto quantified transcript abundance from RNA-seq data without mapping the reads to reference genomes, achieving similar accuracy to existing quantification tools[21]. In this study, a gene was defined as expressed if its transcripts per million (TPM) value exceeded 10 in at least one sample within a population; only these expressed genes were used for subsequent analysis.
For the rice population, RNA-seq data were downloaded as specified in the main text and mapped to the Nipponbare reference genome IRGSP-1.0. Only samples grown under normal conditions were included in the analysis. A gene was considered expressed in a sample if it was detected in at least two of the three biological replicates.
Construction and evaluation of machine learning models
-
Basic mathematical analysis and processing were completed by Excel software. Heat maps, dot plots, receiver operating characteristic (ROC) curves, and Venn diagrams were created using R (version 4.3.3).
Flower types were converted into categorical variables to enhance the objectivity and simplicity of the model. In detail, a disbudded flower scored 0, a single-spray flower scored 1, and a multiple-spray flower scored 2. Important features were identified through feature selection using least absolute shrinkage and selection operator (LASSO) regression analysis, which was performed in R (v4.3.3) using all 101 cultivars, as we used an independent validation population of 20 cultivars grown at two separate locations. LASSO regression improves a model's accuracy and interpretability while addressing issues of multicollinearity among independent variables[22]. Multivariate regression analysis was conducted to derive regression coefficients for the independent gene features. The phenotype was initially predicted using the multivariate regression coefficients, according to the following formula:
Predicted value = Gene1_exp × c1 + Gene2_exp × c2 + Gene3_exp × c3 … + geneN_exp × cN, where, 'exp' denotes the expression of each gene, and 'c' represents the regression coefficient.
For deep learning, the Keras framework with a tensorflow backend was utilized to train the models. For each population, the dataset was randomly divided into training (70%) and testing (30%) sets. We manually tested various parameters, including activation, optimizer, loss, dropout rates, number of units, regularizers, epoch, and layer configurations. The models' performance was assessed by monitoring the learning curves for both the training and testing data. The accuracy of the models was evaluated by calculating the Pearson's correlation coefficient (r) between the predicted and actual values, and the best-performing model was reported.
For leaf vase life, a fully connected deep neural network (DNN) model was developed for the regression analysis. The model architecture comprised nine layers in total, including dense fully connected layers and independent activation layers to introduce nonlinearity. The first dense layer contained 40 units followed by an exponential linear unit (ELU) activation layer; the subsequent hidden layers were set to have 40, 40, 80, 160, 320, and 640 units, activated by linear, elu, tanh, mish, relu6, and leaky_relu functions, respectively. All hidden dense layers were regularized using L2 kernel regularization with a coefficient of 0.01 to mitigate overfitting. The final output layer contained 1 unit with a linear transformation, followed by an additional ELU activation function to meet the regression's requirements. For model training, the network was compiled with the Adam optimizer (default learning rate = 0.001), using the mean squared error (MSE) as the loss function.
For flower types, the first dense layer contained 300 units with the Gaussian error linear unit (GELU) activation function; two subsequent dropout layers were applied with a fixed dropout rate of 0.2 to reduce overfitting. Two hidden dense layers were sequentially arranged, each containing 20 units and adopting the GELU activation function. Both hidden layers were regularized by L2 kernel regularization (0.01) and L1 activity regularization (0.01) to constrain the model's complexity. The output layer was designed with three units and applied the Softmax activation function for multiclass classification. For compiling each model, the RMSprop optimization algorithm was used with a default initial learning rate of 0.001, and categorical cross-entropy was selected as the loss function. The model was trained for 100 epochs with a default batch size of 32.
The source codes are publicly available at
https://github.com/lkwwang-ui/Deep-model-for-predicting-adult-traits-using-seedling-data-study.git We used Weka 3.9.7 data mining software[23] and performed machine learning analysis as described in our previously published paper[24]. In brief, all 101 samples were used for training and testing with 10-fold cross-validation, and the 20 samples from BGZ were used for model validation.
-
Numerous horticultural crops, exemplified by chrysanthemums, exhibit intricate genetic backgrounds characterized by high repetitiveness, considerable heterozygosity, and extensive genome sizes[19]. These attributes pose challenges in accurately extracting genomic variation information that is crucial for machine learning-based phenotype prediction. The primary objective of this study was to investigate the feasibility of utilizing gene expression features for machine learning-driven phenotype prediction, specifically using gene expression data obtained from seedlings to predict phenotypes in adult plants.
To this end, we collected the gene expression datasets from the leaves of individual chrysanthemum seedlings within a population (Fig. 1). Subsequently, we quantified the leaf vase life and flower types of adult plants, as these phenotypes are essential for chrysanthemum production[25,26] (Fig. 1). It is noteworthy that these phenotypes represent distinct variable types in the context of machine learning: Leaf vase life is characterized as a continuous variable, whereas flower type is classified as a categorical variable.
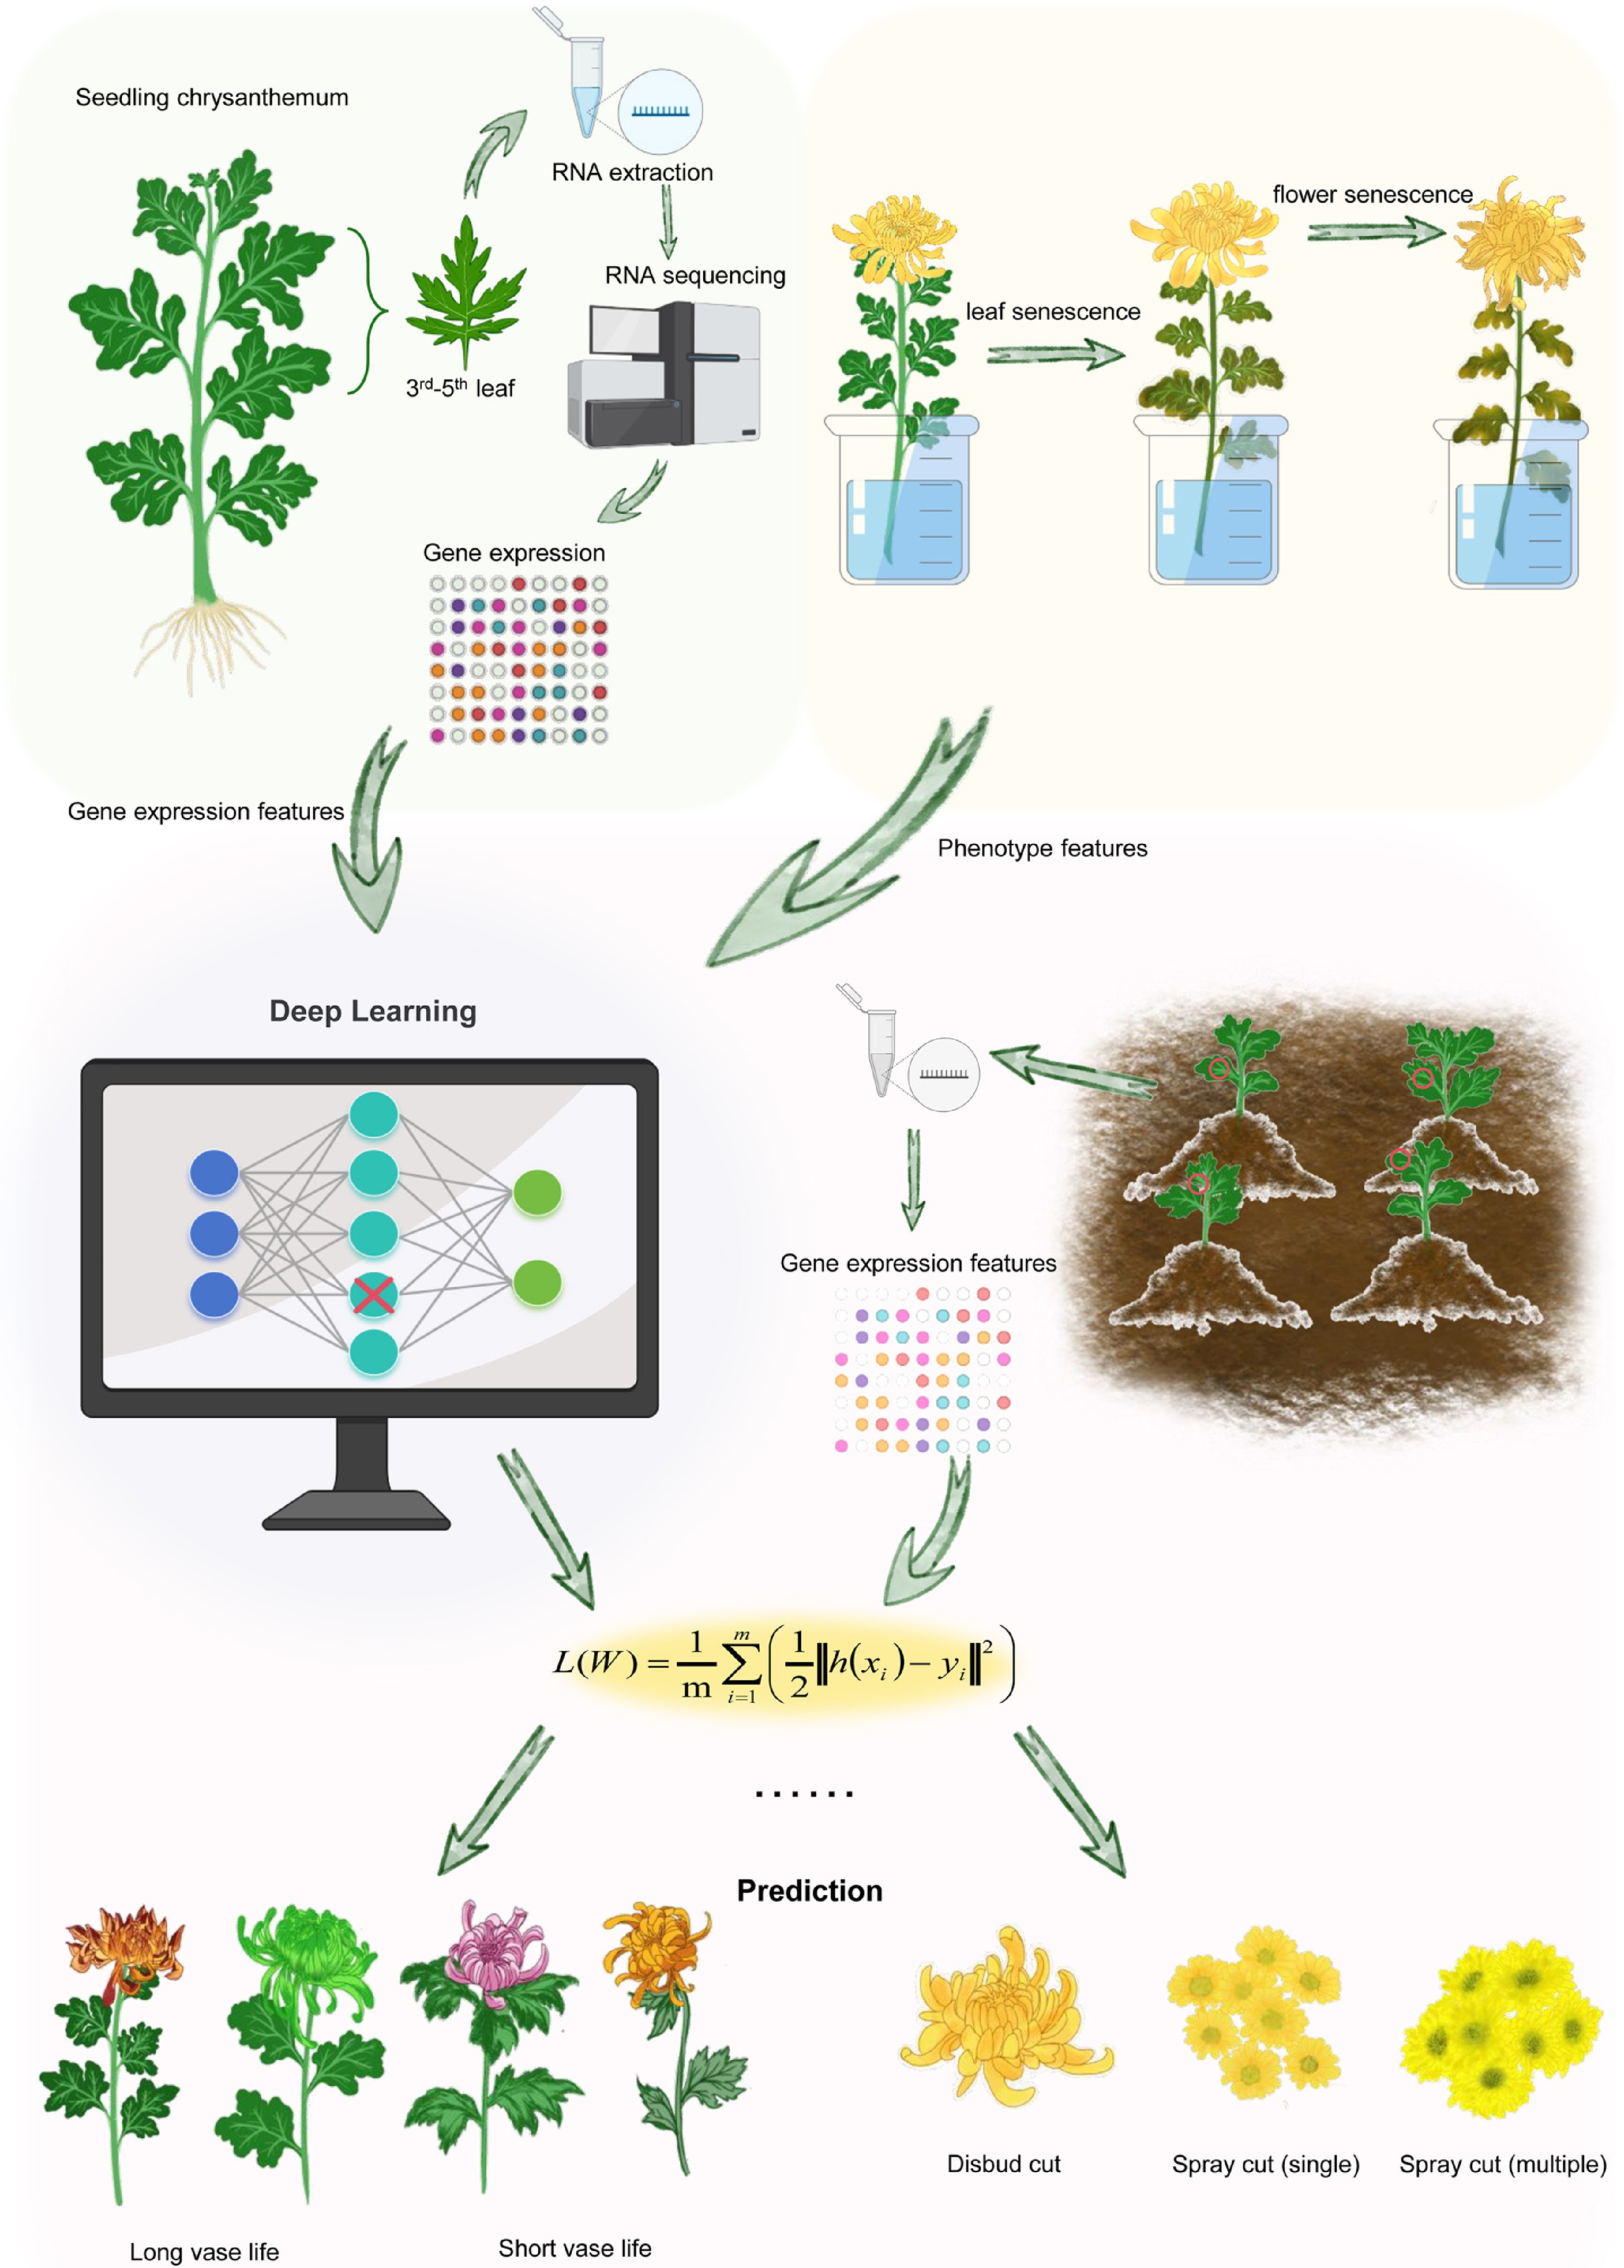
Figure 1.
The overall design of this study. Schematic representation of the predicting adult plant phenotypes using the transcriptional data from seedlings by machine learning method. For each seedling, we generated gene transcriptional data from the third to fifth leaves, and collected the leaf vase life and flower type phenotype data from adult plants. These data are used as inputs into the Keras of the TensorFlow platform to predict the phenotypes of adult plants. The performance of model was assessed using another plant population.
We first performed feature selection using the gene expression data, with the goal of minimizing the predictors, and then developed a deep learning model for predicting phenotypes. The selected features were used for model training and testing to obtain a robust model for trait prediction. For model validation, we expanded our analysis to independent validation populations of chrysanthemum. In these populations, we assessed the expression profiles of machine learning-selected genes in each seedling. Subsequently, we predicted the leaf vase life and flower types for each plant using the established deep learning models and validated our predictions through laboratory observations (Fig. 1).
The population and features used for machine learning
-
A primary population of 101 cultivars and a validation population of 20 cultivars (grown in BGZ and HS, 42 km apart) were used (Supplementary Fig. S1). The leaf and flower vase life of each chrysanthemum cultivar were assessed across three biological duplications, with four flowers per duplication. We found that the majority of chrysanthemum cultivars displayed a notably shorter leaf vase life, with leaf senescence appearing prior to the onset of flower senescence (Fig. 2a). This early leaf senescence significantly reduces the quality and economic value of cut chrysanthemums, confirming leaf senescence as the primary limitation to the postharvest life of cut chrysanthemums; thus this was focused on in this study. Transcriptional analyses were conducted on each chrysanthemum cultivar with RNAs extracted from the leaves of seedling plants, with one or two duplications per cultivar. Principal component analysis (PCA) was applied to unravel the underlying structures within the RNA-seq gene expression profiles, with an attempt to segregate samples on the basis of leaf vase life. The results, however, did not reveal a discernible clustering of vase life based on gene expression profiles (Fig. 2b). This finding suggests a potential underemphasis on leaf vase life as a breeding trait, possibly because of the complexities and resource-intensive nature of vase life assessments, which may have historically limited its incorporation into breeding programs.
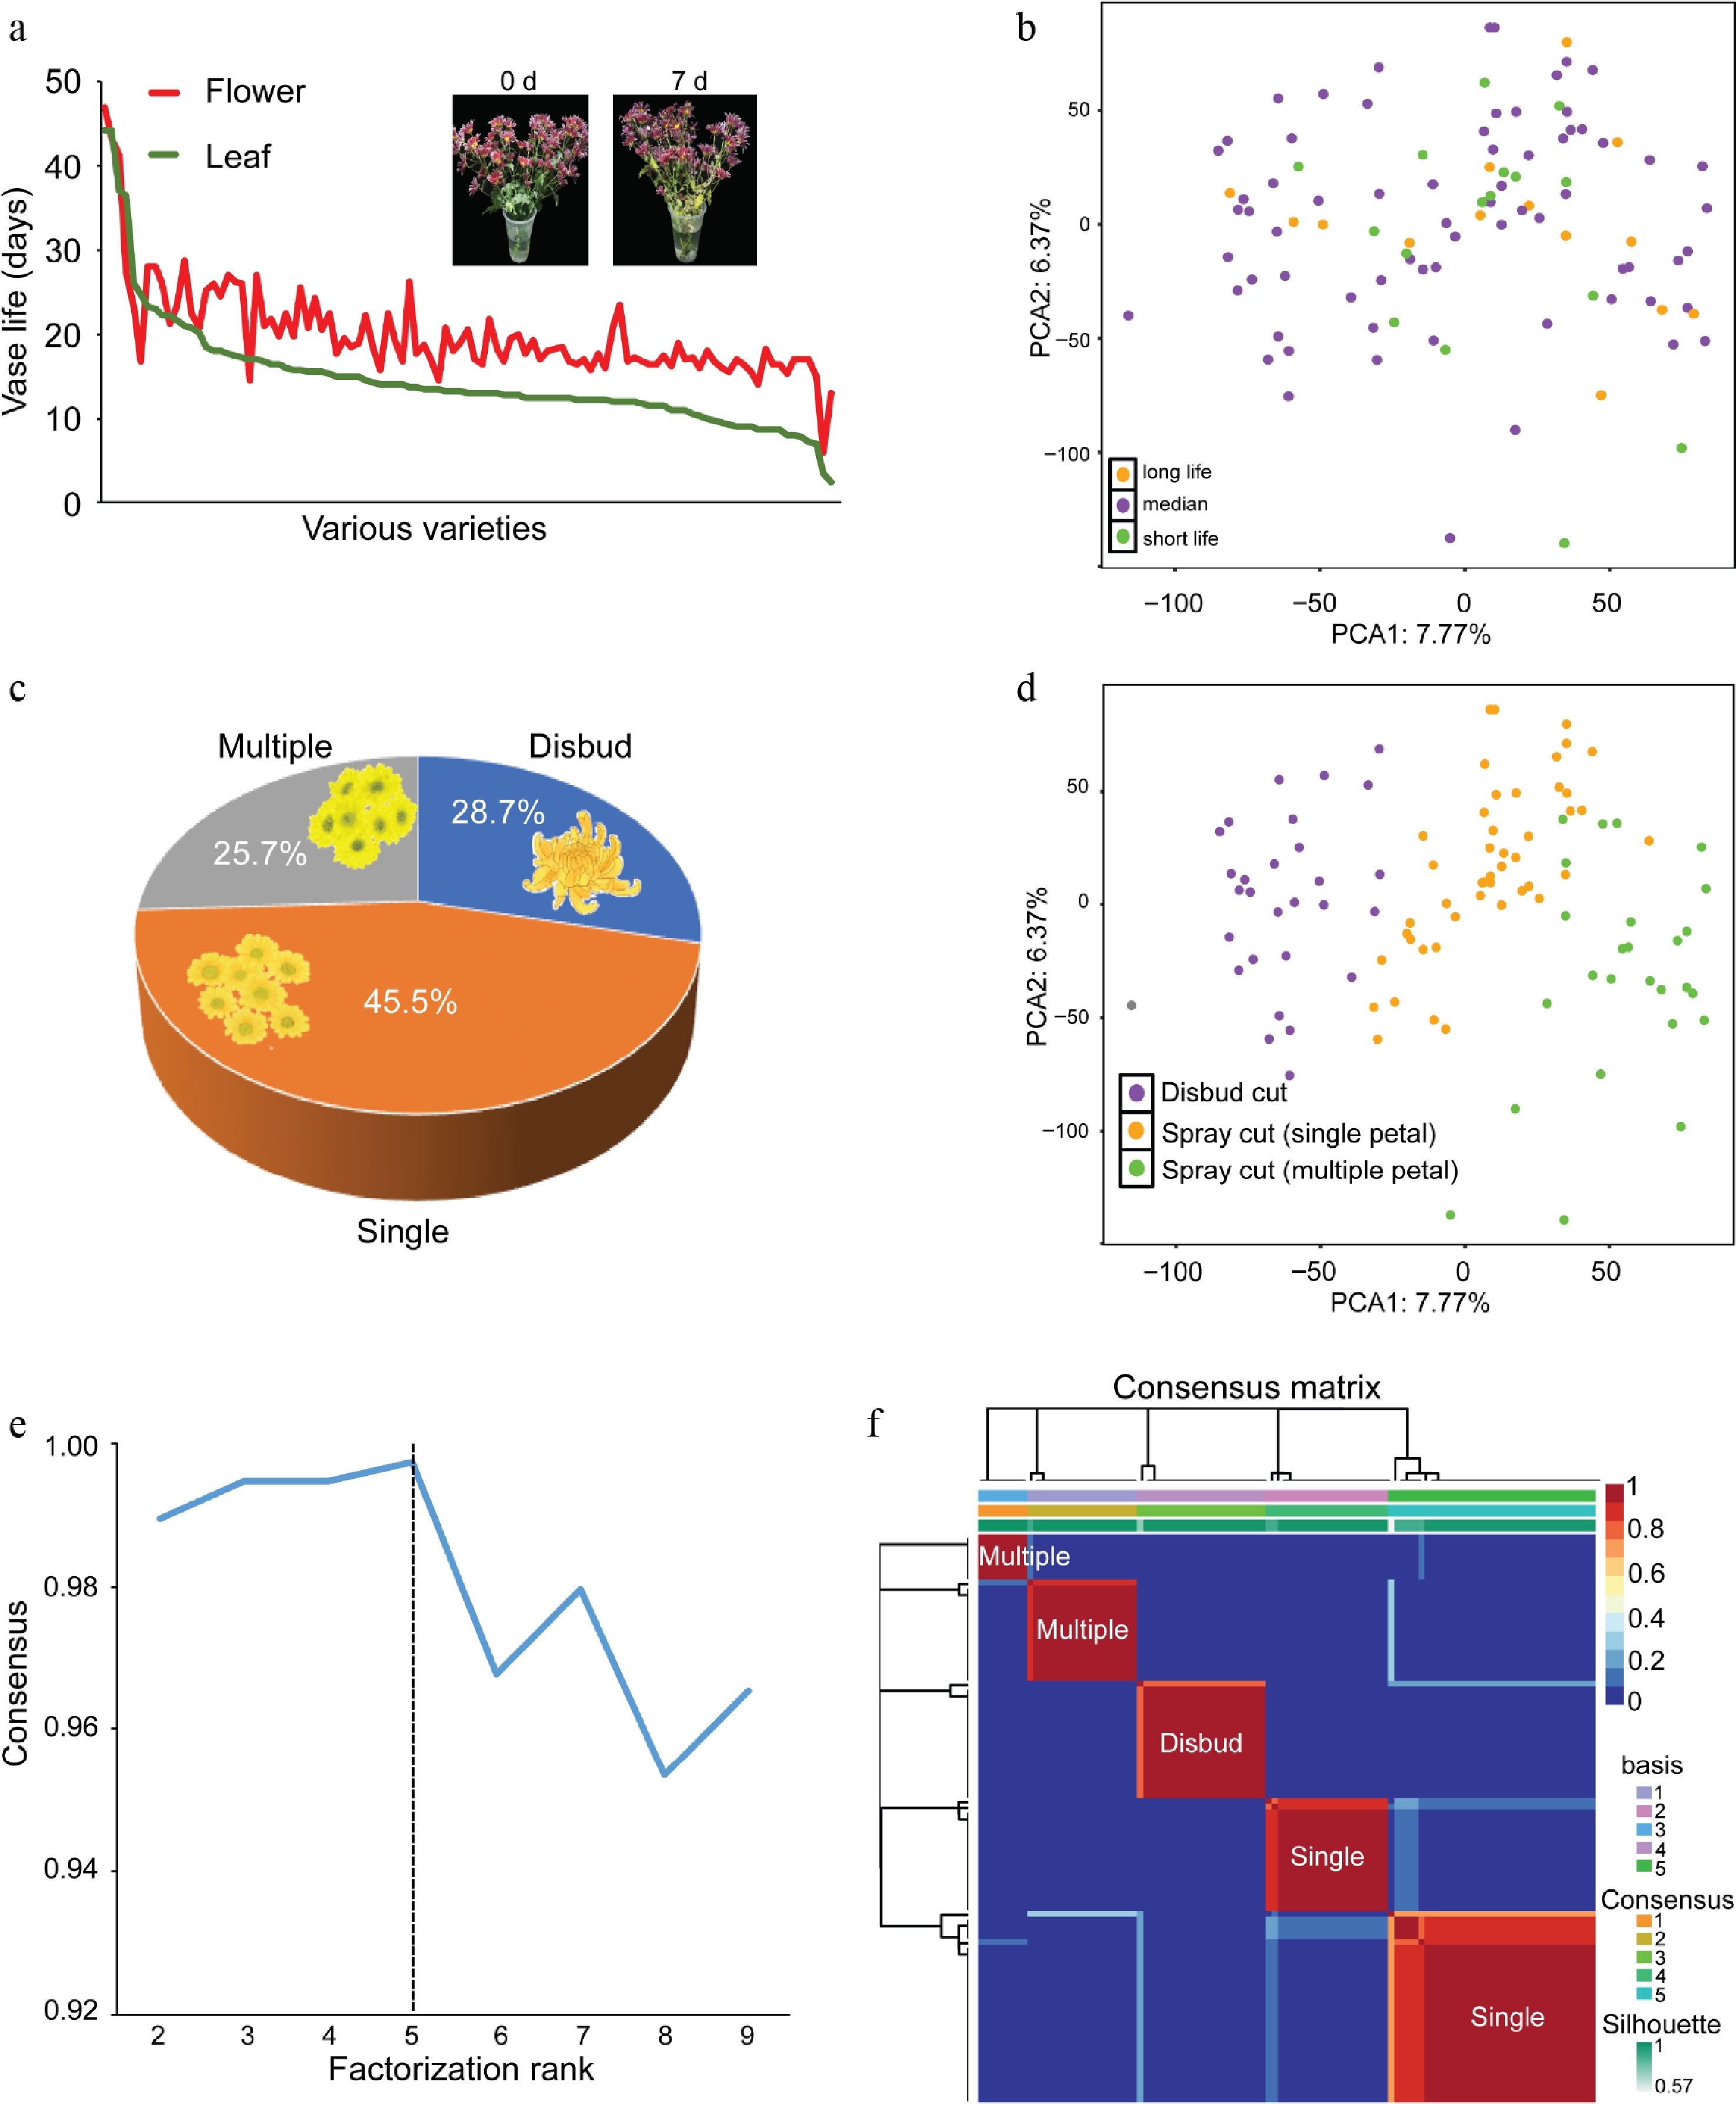
Figure 2.
The chrysanthemum population used for machine learning. (a) The leaf vase life and flower vase life of each chrysanthemum cultivar were assessed. An illustration of a vase test on cut chrysanthemums at 0 days and 7 days was presented, revealing noticeable leaf yellowing, whereas the flowers appeared unchanged during this period. (b) A PCA plot illustrating the gene expression patterns across various samples. The samples were categorized into three groups according to leaf vase life, with distinct colors representing chrysanthemum samples from each group. (c) The composition of flower types in the chrysanthemum population is shown in a pie chart. (d) PCA plot showing the gene expression patterns across various samples. The samples were categorized into three groups according to flower types, with distinct colors representing chrysanthemum samples from each group. (e) Cophenetic correlation coefficients associated with different numbers of clusters. The y-axis is the cophenetic correlation coefficient; x-axis is the number of clusters. The dashed line displays the coefficient score was the largest in the five categories (k = 5). (f) The consensus score matrix of all samples when k = 5. A higher consensus score between two samples indicates they are more likely to be grouped into the same cluster in different iterations.
Cut chrysanthemums are predominantly categorized into two main cultivated types: Spray cut and disbudded cut types[27]. Subsequently, we examined the flower types within this population and found that 28.7% were disbudded cut types, whereas the remainder comprised spray cut types, among which 25.7% exhibited multiple flowers and 45.5% displayed single flowers (Fig. 2c). By using gene expression and flower type data, PCA analyses successfully distinguished the disbudded, single-spray, and multiple-spray cut flower types (Fig. 2d), indicating the influence of artificial selection during domestication. We acknowledge that Principal Components 1 and 2 (PC1 and PC2) captured only a modest proportion of the total variance, but the clear separation among the three flower-type groups suggests that the leading PCs captured biologically meaningful structures that are relevant to flower type differentiation. To validate this observation, a consensus cluster analysis[28] was conducted, initially dividing all chrysanthemum samples into k (k = 2 – 9) clusters. The cophenetic correlation coefficients indicated optimal cluster identification at k = 5 (Fig. 2e), with the five consensus clusters exhibiting significant distinctions in flower types (Fig. 2f).
A deep learning method using transcriptional data for predicting leaf vase life
-
We initiated our investigation by selecting the vase life of leaves as a phenotype feature to evaluate the performance of deep learning methods in handling continuous variables. Initially, we applied LASSO regression by treating the expression of individual genes as independent features (Supplementary Fig. S2a, S2b). In total, 166 genes exhibiting minimal mean absolute error (MAE) values were selected for subsequent analyses (Supplementary Fig. S2b).
Conducting PCA using the expression levels of these 166 selected genes, we observed that the vase life could be broadly clustered according to the gene expression profiles of each sample (Fig. 3a). Subsequently, we ranked the selected genes according to their importance, highlighting their contributions to the phenotype within a range of approximately 0.02 to −0.01 (Fig. 3b). Next, predictions of vase life for each sample were made using the corresponding regression coefficients derived from linear regression, and their accuracy was assessed by comparing them with laboratory-tested values (Fig. 3c, Supplementary Fig. S2c). The correlation between the predicted values and manual measurements was 0.89 (Supplementary Fig. S2c). Notably, among these selected genes, we identified several genes known to regulate leaf senescence, including ACS6[29], REC3[30], and ARF2[31] (Fig. 3d). Gene Ontology (GO) enrichment analysis using the Arabidopsis thaliana homologs of these 166 selected genes revealed a significant enrichment in pathways related to 'response to endogenous stimulus,' 'response to hormone,' and 'response to auxin' (Fig. 3d).
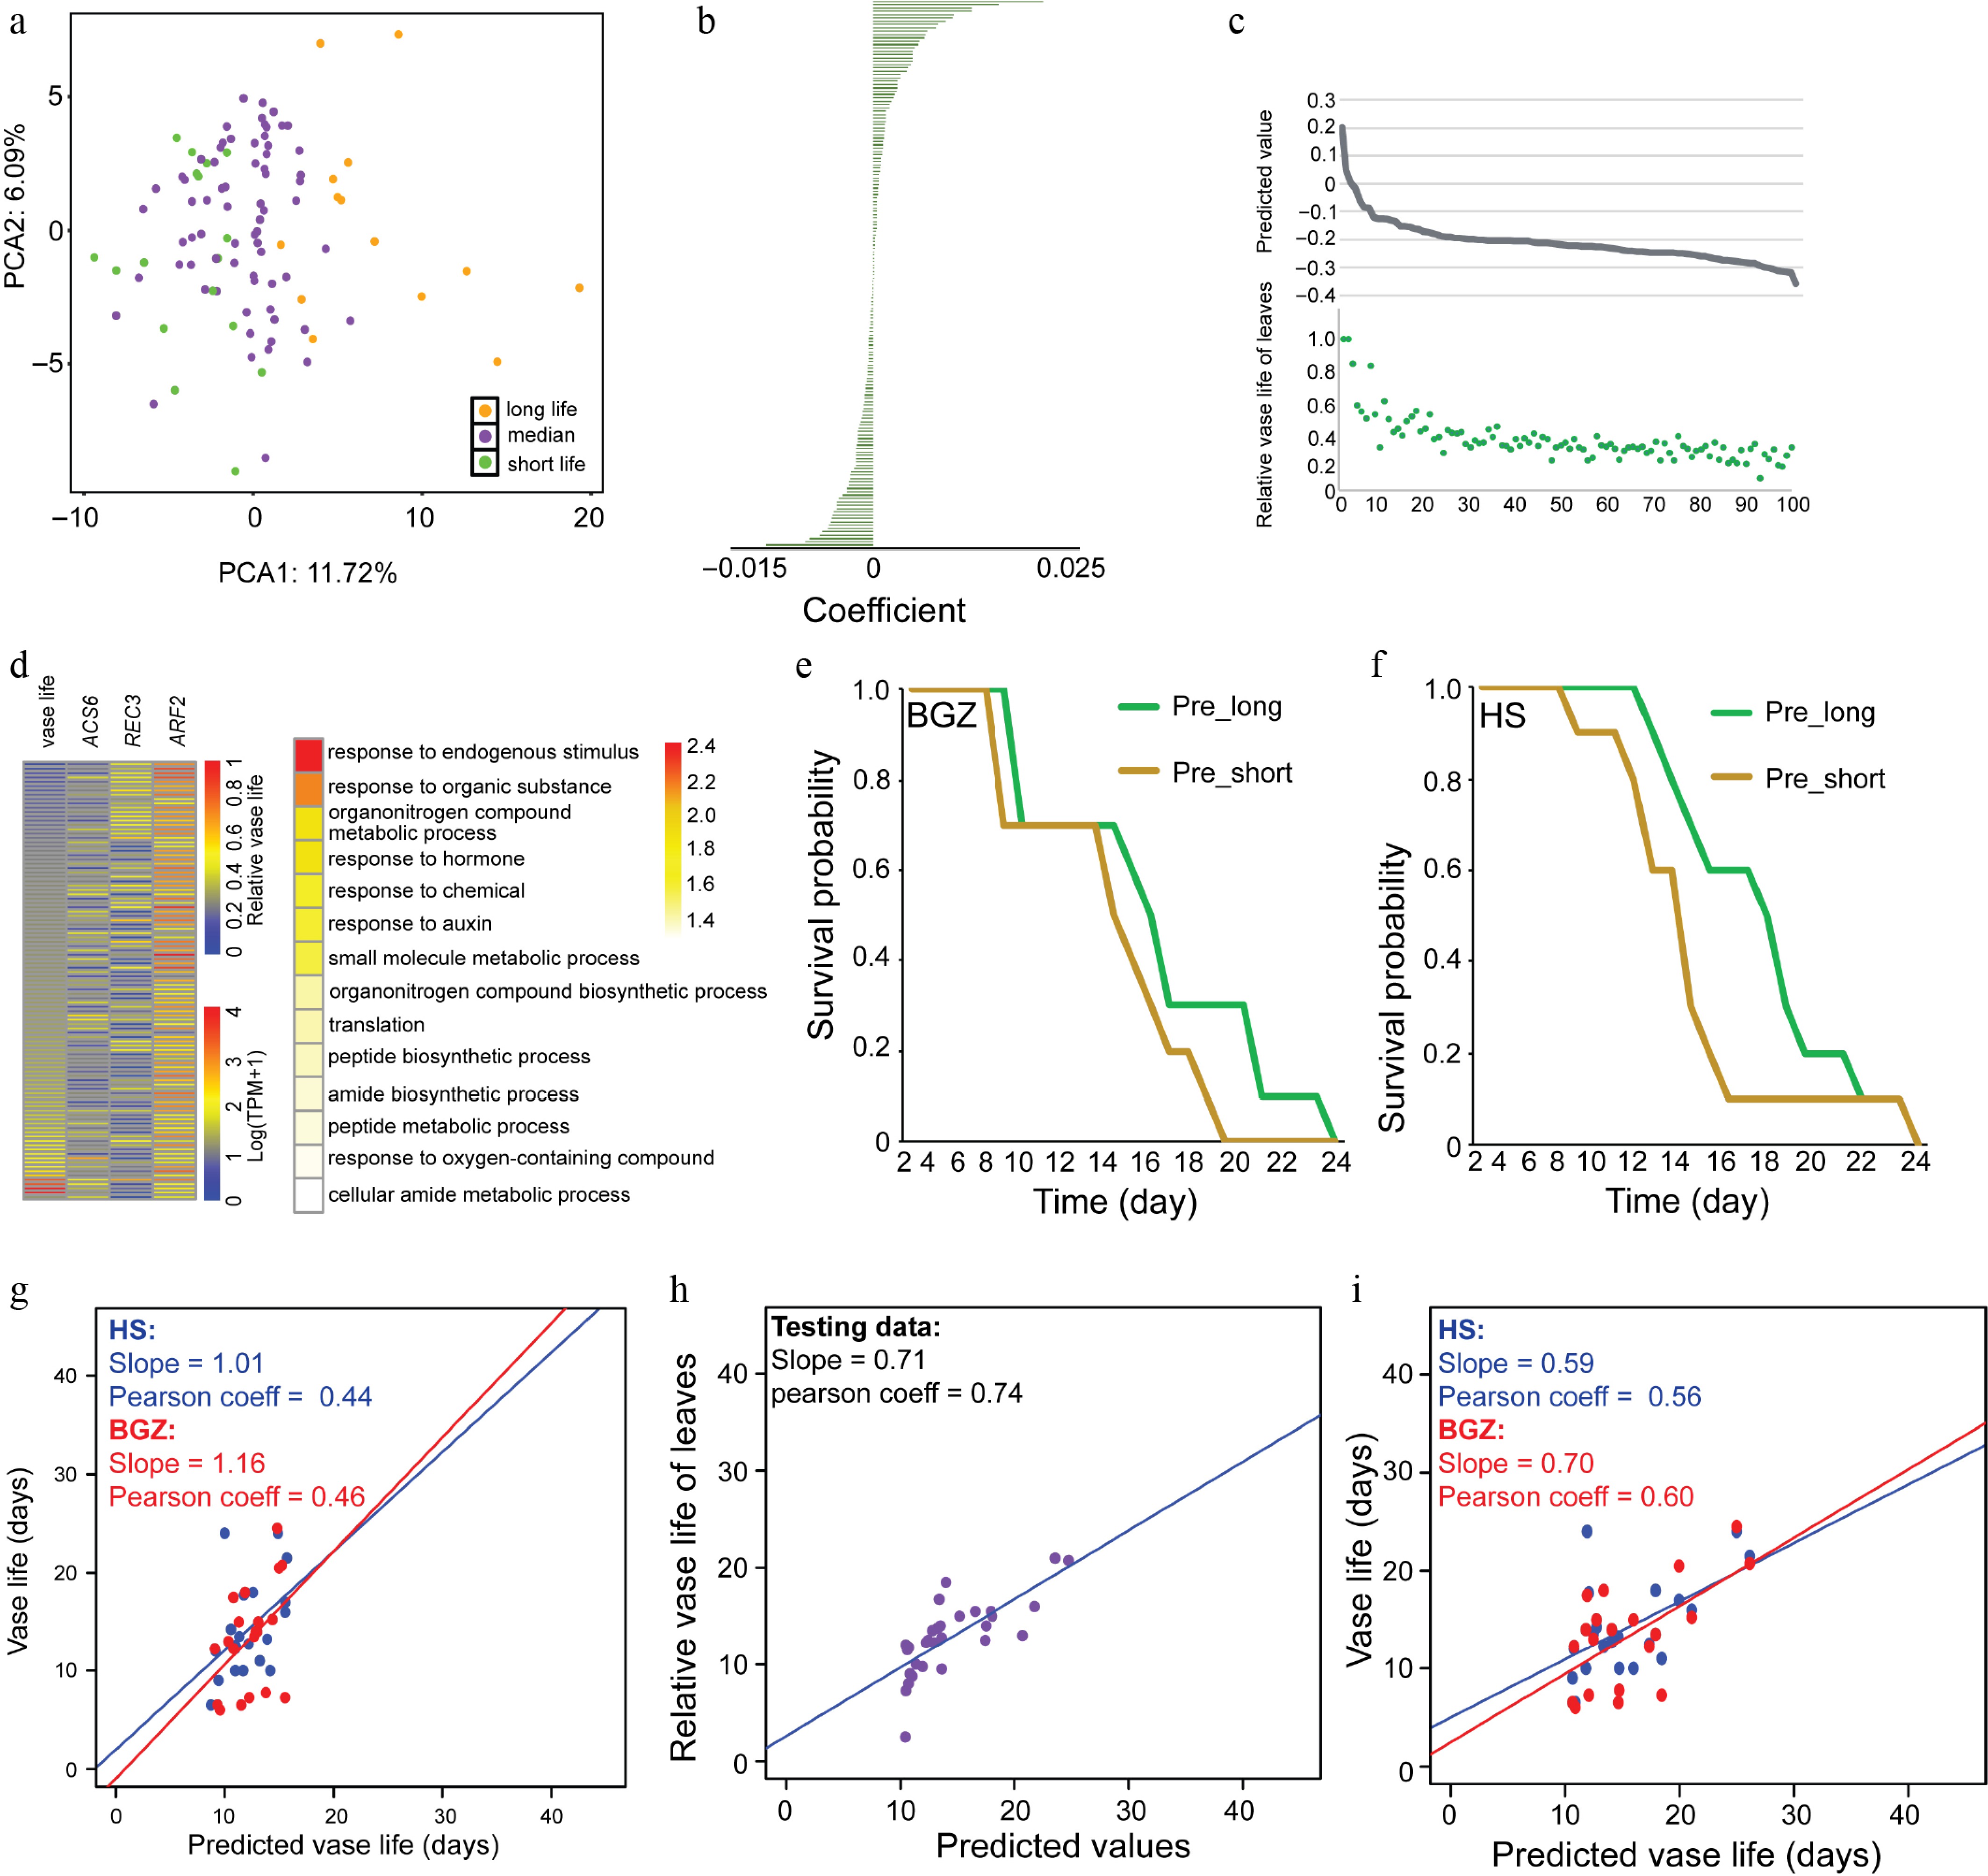
Figure 3.
Leaf vase life prediction using gene expression data from seedlings. (a) PCA plot showing the expression patterns of selected genes across various samples. The samples were categorized into three groups on the basis of leaf vase life, with distinct colors representing chrysanthemum samples from each group. (b) The order of the importance of the selected features. (c) The comparison of predicted value and relative vase leaf life of each sample. (d) Heat map of three senescence associated genes and leaf vase life in each sample (left) and GO enrichment analysis using the Arabidopsis thaliana homologs of the selected 166 genes (right). (e,f) Kaplan–Meier curves show that predicted long (pre_long) and short (pre_short) was significantly different between the long and short vase life groups in the populations grown at BGZ (e) and HS (f). (g−i) Scatterplots of predicted values versus manual measurements values of LASSO regression (g), deep learning model for testing data, (h) and other validation data (i).
Subsequently, we used these selected genes to predict the vase life of the validation population, categorizing the samples into long life (pre_long) and short life (pre_short) groups on the basis of the median predicted value. Kaplan–Meier (KM) curve analysis revealed that the pre_short group exhibited earlier senescence compared with the pre_long group in both the BGZ and HS populations (Fig. 3e, f). However, when we assessed the correlation between predicted values and manual measurements in these populations, the correlations were only 0.44 and 0.46 (Fig. 3g), indicating a limitation of linear regression in this context.
To explore alternative methodologies, we proceeded to evaluate the deep learning method outlined in Fig. 1. We randomly assigned 70% of the 101 samples as training data, reserving the remainder for testing the deep learning model. Through nonlinear regression algorithms, we developed a model yielding a correlation of 0.74 between the predictions and measurements for the testing data (Fig. 3h, Supplementary Fig. S2d). Subsequent predictions of the vase life of the validation population demonstrated correlations of 0.56 and 0.60 (Fig. 3i), surpassing the performance of both linear regression and conventional machine learning algorithms, including Random Forest and SMOreg (support vector regression) (Supplementary Fig. S3), underscoring the potency of deep learning models in prediction tasks utilizing gene expression-based features.
Deep learning method using transcriptional data for flower type prediction
-
In our subsequent analysis, we opted to utilize flower type as a phenotype feature to evaluate the effectiveness of deep learning methods on a categorical variable for classification purposes. Through feature selection using LASSO regression, we identified 122 genes that were further evaluated for subsequent analyses (Supplementary Fig. S4a). Employing LASSO regression to predict flower types in the validation population, we observed a substantial variance between the predicted values and the corresponding dummy variables (Supplementary Fig. S4b).
Transitioning to the application of deep learning methods, we utilized 70% of the randomly selected samples as training data and the remaining samples as testing data. The model thus developed exhibited a high level of accuracy in classifying samples according to flower types (Fig. 4a). To evaluate the model's performance, we predicted the flower types of the validation population (Fig. 4b, c). Notably, only one misclassified sample was observed for the HS population (Fig. 4b) and two for the BGZ population (Fig. 4c).
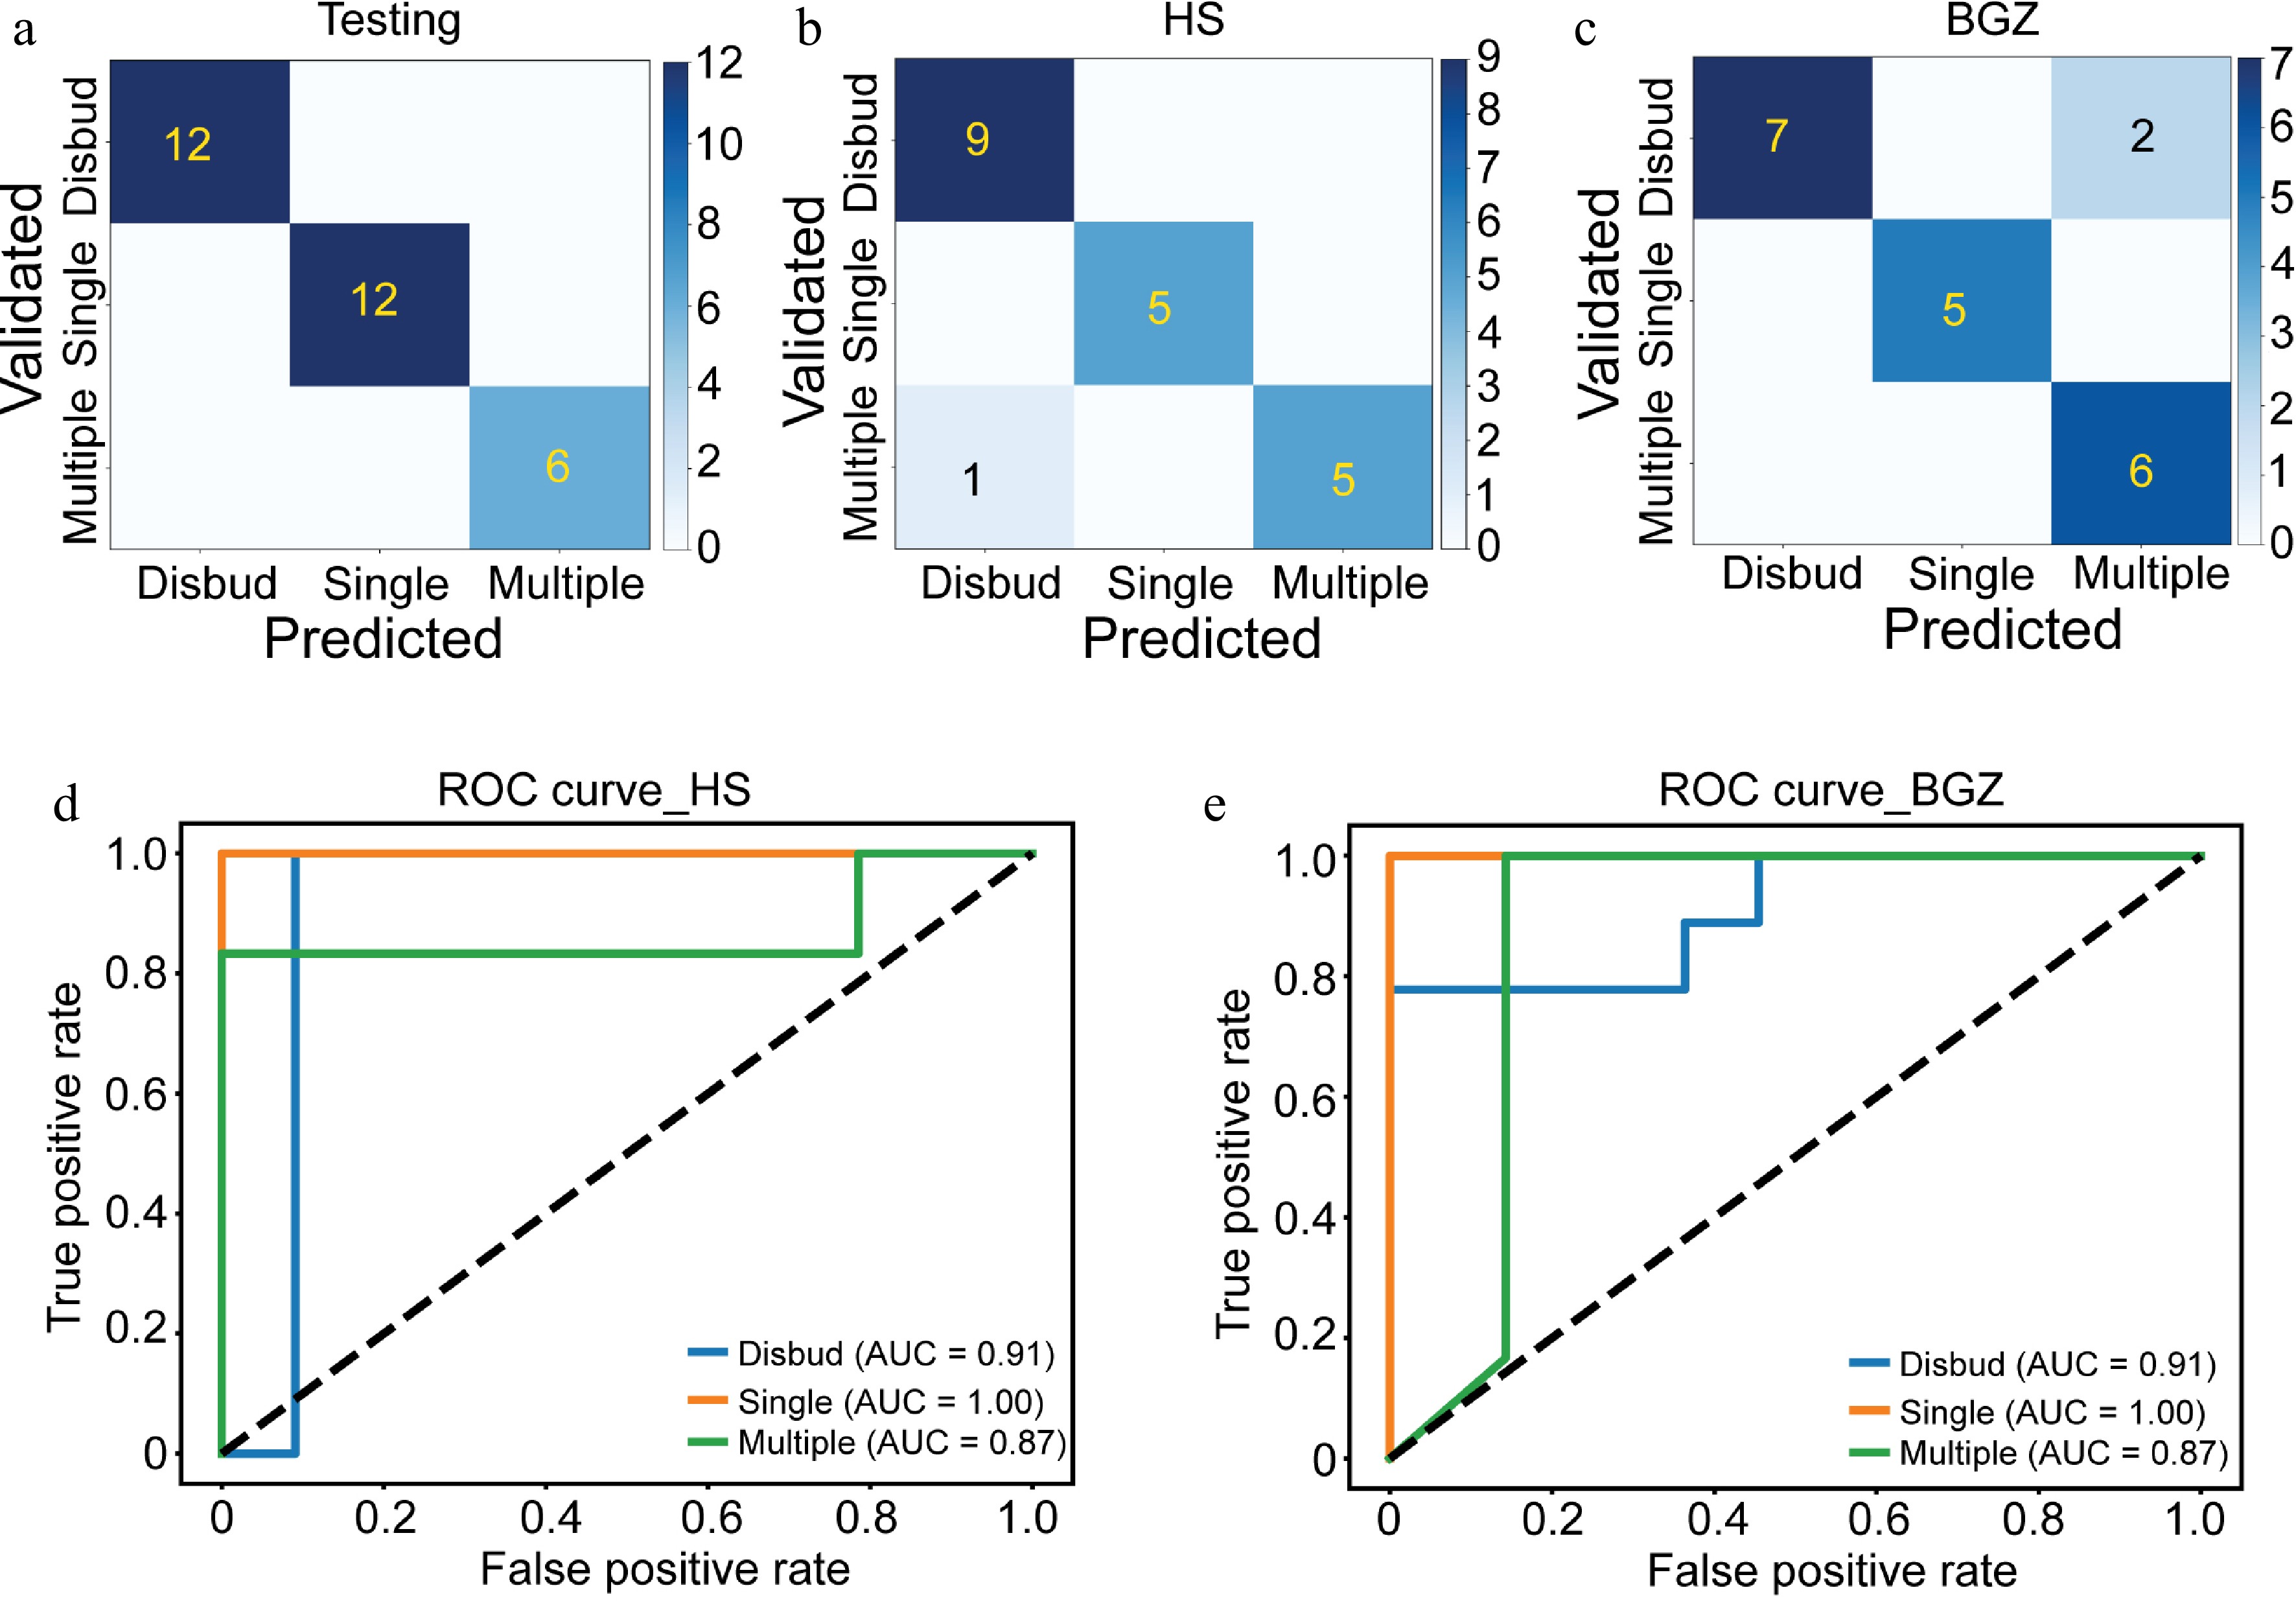
Figure 4.
Flower type prediction using gene expression data from seedlings. (a−c) Confusion matrix to evaluate the performance of the deep learning model using (a) testing data and validation data from (b) HZ and (c) BGZ. (d, e) ROC curves of deep learning model to predict the flower type in chrysanthemum population from (d) HS and (e) BGZ.
To further assess the performance of the established models in predicting flower types, ROC curves were used (Fig. 4d, e). The area under the ROC curve (AUC) values for predicting disbudded, single-spray, and multiple-spray flower types were determined to be 0.91, 1.00, and 0.87, respectively, for both the HS and BGZ populations (Fig. 4d, e). These results indicate the robustness and accuracy of the model in predicting flower types on the basis of gene expression data.
Applying deep learning methods using transcriptional data for another organism
-
In order to evaluate the performance of deep learning methods using transcriptional data on diverse organisms, we searched the data repositories across different databases, aiming to collect the publicly available datasets with transcriptional analysis of seedling plants and phenotype assessments of adult plants for the purpose of constructing deep learning models. Additionally, the chosen species should have other publications containing comparable data for model validation. The SRA BioProject with accession number PRJNA588478 was selected. We downloaded the transcriptome data that specifically focused on leaf samples from a population of seedlings of 220 rice accessions[32]. Our investigation focused on exploring changes in fecundity in response to drought treatment[32], a parameter linked to grain yield and also a phenotype commonly examined in various studies. Subsequently, we applied deep learning methodologies as outlined previously, resulting in the selection of 303 genes through LASSO regression for subsequent analyses.
We successfully developed a model capable of accurately predicting changes in fecundity in response to drought, achieving a high correlation coefficient of 0.93 for the testing data (Fig. 5a). To further validate the model's capabilities, we reanalyzed transcriptome data from the leaves from seedlings of three rice genotypes and extracted the grain yield phenotypes under both well-watered and drought conditions[33]. By predicting the changes in fecundity in response to drought treatment for these genotypes and comparing them with grain yield (measured in grams per plant), we noticed that although fecundity and grain yield are distinct metrics, fecundity is a critical trait influencing yield and typically exhibits a positive correlation with it. Notably, our analysis revealed a directional agreement between the predicted fecundity values of these rice genotypes and the changes in grain yield in response to drought treatment (Fig. 5b). However, we emphasize that n = 3 is insufficient for robust statistical inference, and this validation should be viewed as a preliminary indication of cross-species applicability.
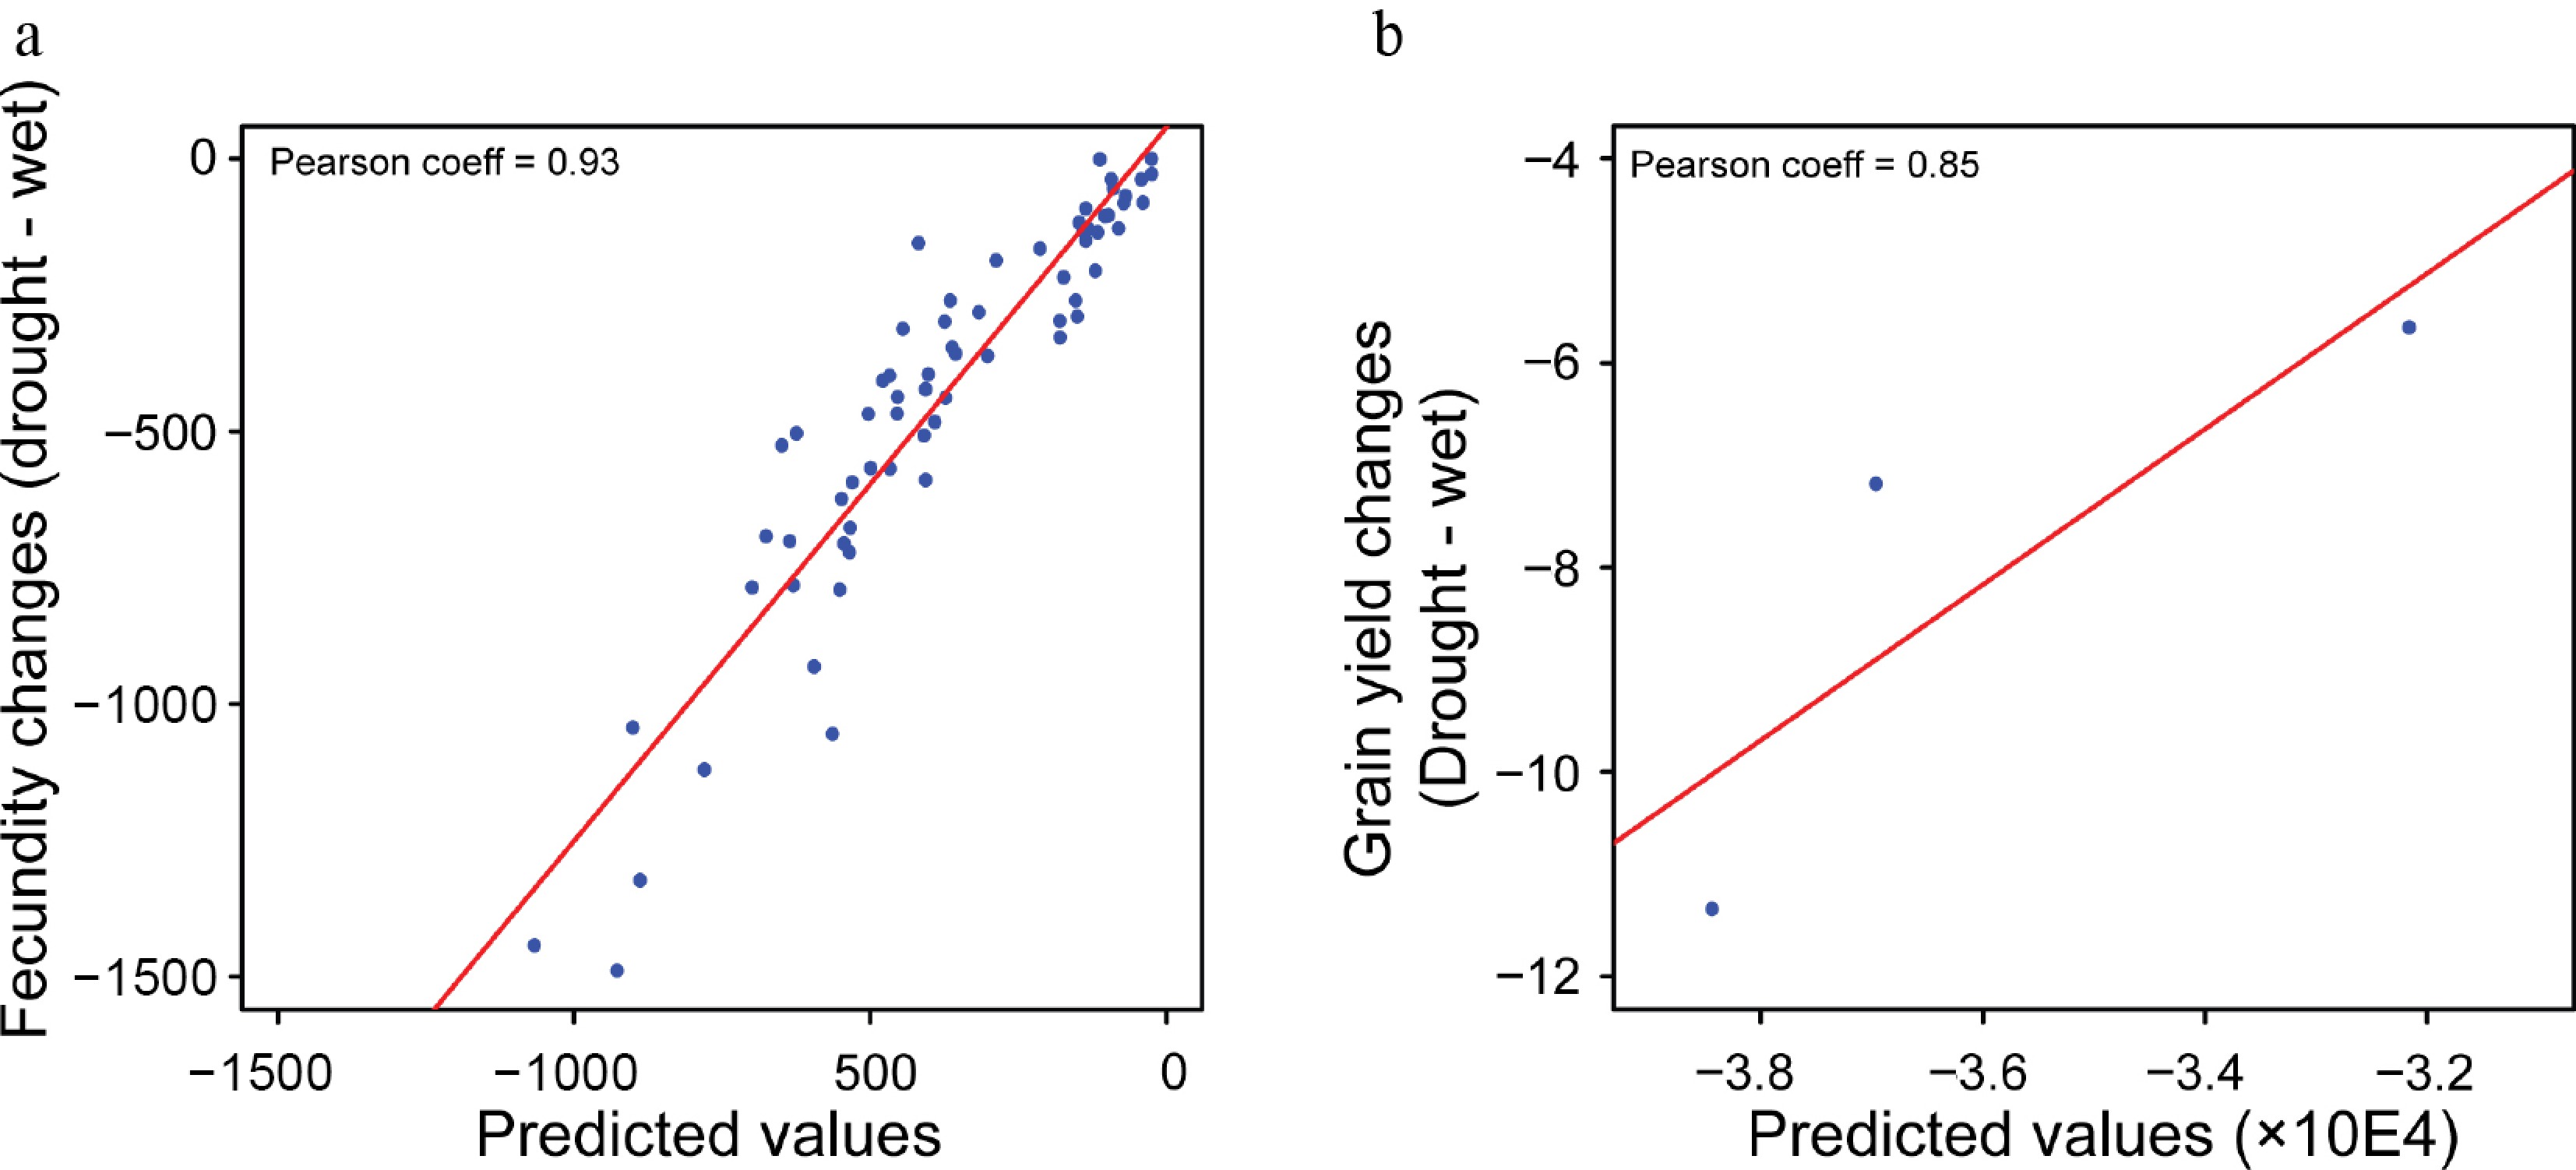
Figure 5.
Fecundity prediction using gene expression data from seedlings. (a, b) Scatterplots between the predicted values and measured values using the (a) testing data and (b) validation data.
-
Traditional marker-assisted selection, field-based leaf collection, labeling, and subsequent tracing back to the source plants after genotyping represent significant bottlenecks in leaf DNA-based genotyping processes. This entire workflow is labor-intensive procedures and time-consuming and has high associated costs. Consequently, in an effort to streamline breeder workflows and minimize expenses, an optimized genotyping approach utilizing endosperm DNA extracted from individual seeds has been developed. This method offers a viable alternative to leaf DNA-based genotyping, proving beneficial for both genetic investigations and breeding applications[34−36]. In our current research, we tried to predict the phenotypes of adult plants using gene expression data derived from seedlings, facilitating the development of a single seed-based genotyping strategy. Through feature selection, only a limited number of genes have been selected for deep learning analyses, which will be potentially utilized in gene chip-based breeding practices in the future.
Previous reports demonstrated that maize (Zea mays) seedlings' transcriptomes can predict complex adult traits such as flowering time and grain yield[37]. Our study extends this concept to polyploid horticultural crops, where the genome's complexity poses unique challenges for DNA-based prediction. Unlike maize, chrysanthemum possesses a highly heterozygous segmental allopolyploid genome that complicates accurate variant identification, making transcriptional-based prediction particularly advantageous. Furthermore, we demonstrate that the same framework can be applied to both continuous traits (leaf vase life) and categorical traits (flower type), highlighting its broader applicability. We also provide multilocation validation populations, evaluating the model's robustness under real-world environmental variation.
For genetically fixed traits such as flower type, the seedling transcriptome functions as a proxy for the underlying genotype. For species with relatively simple and well-characterized genomes, DNA-based genotyping likely provides a more stable and cost-effective approach for predicting such structural traits, as these traits are ultimately determined by DNA sequence variants that are fixed at the seed stage[38,39]. However, for species with complex genomes, such as chrysanthemum (a segmental allopolyploid with high heterozygosity), accurate identification of DNA variations poses significant challenges. Distinguishing homologous variants from allelic ones is particularly difficult when the subgenomes share high sequence similarity, and these intricacies of SNP/InDel/SV mining can compromise the accuracy of DNA variation-based machine learning predictions[20]. In this context, gene expression data which integrate both genetic regulatory mechanisms and environmental stimuli[40] offer a complementary or alternative avenue for predicting phenotypes in plants with complex genomes. The transcriptional-based approach thus holds particular promise for polyploid horticultural crops where DNA-based variant calling remains technically challenging.
Although deep learning models exhibit remarkable accuracy in predicting phenotypes, they need vast amounts of data for training, typically spanning tens to hundreds of thousands of input features[7,41−43]. For instance, in scenarios such as the use of aerial image datasets for segmentation tasks, the size of the training set assumes a pivotal role in fortifying the model against label noise, with larger training sets improving the robustness of the model against omission noise[44]. In our study, given the limited number of samples available for the deep learning algorithm, expanding the sample size emerges as an effective strategy to improve the predictive performance of the model.
Beyond enlarging the training dataset, enhancing the diversity of the training data proves pivotal for optimizing the predictive capabilities of deep learning models. In some cases, deep learning frameworks can achieve commendable predictive accuracies even with relatively compact datasets. For instance, the manipulation of sequence diversity in controlled settings leads to significant enhancements in data efficiency, resulting in enhanced prediction accuracy for deep learning models[45]. Leaf senescence is a complex trait influenced by genotype × environment (G × E) interactions; the validation populations were grown in two locations (BGZ and HS) 42 km apart, with differing soil and microclimatic conditions that may affect gene expression and phenotype independently. The postharvest life of cut flowers is also controlled by preharvest factors such as air humidity, disease infection, light conditions, nutrition, and so on[46]. In our case, integrating environmental cues such as temperature, light exposure, water availability, and nutrient intake data stands out as another promising approach to further improve the model's predictive performance.
In this study, we evaluated the performance of transcriptional-based deep learning methods for predicting adult phenotypes from transcriptional data from seedling leaves of horticultural plants. However, many adult phenotypes may be influenced by genes that are expressed in a tissue-specific manner or at specific developmental stages beyond the seedling phase[26,47]. Such regulatory patterns would not be fully captured by transcriptional analyses restricted to seedling leaves, which may partially account for the unexplained variance in our model's predictions. Future studies incorporating transcriptional data from multiple tissues and developmental time points may help address this limitation.
In our cross-species validation using rice, we used drought-induced fecundity changes as the predicted trait[32] and compared them with observed grain yield changes[33]. Although fecundity is a primary determinant of grain yield and the two traits are generally positively correlated, we acknowledge that grain yield is a more complex trait influenced by additional factors such as grain size, grain weight, panicle architecture, tiller number, and spikelet fertility[48]. These yield components may be affected by environmental conditions during later developmental stages that are not fully reflected in seedling leaves' transcriptomes, introducing biological noise into the validation. Furthermore, the predicted fecundity values and the observed grain yield values were not on the same numerical scale (Fig. 5b), which likely reflects both the inherent differences between these two metrics and the contribution of unmodeled environmental variances. We therefore interpret the rice-based validation results cautiously as a preliminary indication of cross-species applicability. Future work based on matched transcription–phenotype datasets for the exact trait of interest across larger populations would enable more rigorous cross-species validation of this approach.
For breeding practice, we wish to clarify that our proposed strategy does not rely on RNA-seq for routine breeding genotyping. Instead, once the most predictive genes have been identified through initial RNA-seq screening (e.g., 166 genes for leaf vase life, as demonstrated in this study), a customized gene expression microarray targeting this focused gene set could be developed for downstream breeding applications, as has been noted that an RNA expression microarray can be cost-effective for studies focused on well-annotated genomes when the gene set is predefined (
www.labmanager.com/microarray-vs-rna-sequencing-which-gene-expression-analysis-technique-is-more-effective-33683 ). Moreover, predictive gene sets for multiple traits can be consolidated onto a single microarray, enabling simultaneous screening of several traits in one assay and thereby further reducing the per-trait cost. This targeted approach avoids the high expense of full transcriptome sequencing while retaining the predictive power concentrated in the selected gene features. -
In summary, this study demonstrates that transcriptional-based deep learning can predict both continuous and categorical adult plant phenotypes from seedlings' gene expression data in chrysanthemum, a polyploid horticultural crop. This approach offers a complementary strategy to DNA-based genomic selection, with particular advantages for species with complex genomes where accurate variant identification is challenging. The identification of a compact set of predictive genes via feature selection provides a foundation for developing customized gene expression chips for cost-effective, high-throughput screening in breeding programs. Key limitations include the moderate predictive accuracy for continuous traits in the validation populations, the need for larger training populations, and the relatively higher cost and lower stability of RNA compared with DNA. Future improvements should focus on expanding sample sizes, integrating environmental and multi-omics data to capture additional variance, and validating the approach across a broader range of crops and traits. In future, transcriptional-based prediction could become a valuable tool in precision breeding pipelines for horticultural crops.
-
The authors confirm their contributions to the paper as follows: performed the bioinformatic analysis: Zhang H; collected the samples for RNA-seq and conducted the vase tests: Mao C, Guo Z; data curation: Sun M; conceived and designed the research: Lu J, Guan Z, Jiang J, Chen S, Chen F, Wang L; wrote the original draft: Zhang H, Mao C; supervised the project and revised the manuscript: Wang L. All authors reviewed the results and approved the final version of the manuscript.
-
The raw RNA-sequencing data reported in this paper are available at the Genome Sequence Archive in the National Genomics Data Center (https://ngdc.cncb.ac.cn/gsa/index.jsp), Chinese Academy of Sciences, with the accession number CRA022074.
-
This work was supported by grants from the National Key Research and Development Program of China (2022YFF1003104), the National Natural Science Foundation of China (32371955), and the Fundamental Research Funds for the Central Universities (KJJQ2026006). This work was supported by the high-performance computing platform of the Bioinformatics Center, Nanjing Agricultural University.
-
The authors declare that they have no conflict of interest.
-
accompanies this paper online at: https://doi.org/10.48130/gcomm-0026-0011.
-
# Authors contributed equally: Hua Zhang, Chenyuan Mao, Ziting Guo
- Supplementary Fig. S1 The geographic distance between HuShu (HS) and BaGuaZhou (BGZ).
- Supplementary Fig. S2 Feature selection using LASSO algorithm.
- Supplementary Fig. S3 Leaf vase life prediction using simple machine learning models.
- Supplementary Fig. S4 Flower prediction using LASSO regression algorithm.
- Copyright: © 2026 by the author(s). Published by Maximum Academic Press, Fayetteville, GA. This article is an open access article distributed under Creative Commons Attribution License (CC BY 4.0), visit https://creativecommons.org/licenses/by/4.0/.
-
About this article
Cite this article
Zhang H, Mao C, Guo Z, Sun M, Lu J, et al. 2026. Predicting adult phenotypes from seedling transcriptional data using deep learning: a case study in chrysanthemum. Genomics Communications 3: e013 doi: 10.48130/gcomm-0026-0011 

Predicting adult phenotypes from seedling transcriptional data using deep learning: a case study in chrysanthemum
- Received: 06 April 2026
- Revised: 05 May 2026
- Accepted: 20 May 2026
- Published online: 17 June 2026
Abstract: Genotype-to-phenotype prediction remains a fundamental challenge in current genetic research. In recent years, it has become possible to construct different predictive models based on genomic data. However, in many horticultural crops, it is difficult to accurately verify genomic variations because of the complexity of their genome, making the application of these genome-based methods challenging. Gene expression reflects both genetic regulatory mechanisms and environmental stimuli, offering potential for predicting phenotypes in plants with complex genomes. Thus, in this paper, we tested the possibility for predicting adult plant phenotypes using the gene expression data from seedlings. By applying the transcriptional-based deep learning methods on cut chrysanthemums (Chrysanthemum spp.), which exhibits a complex genetic background characterized by high repetitiveness, heterozygosity, and genome size and is recognized as a segmental allopolyploid, we found that the method is robust and accurate for predicting continuous variables such as leaf vase life, as well as categorical variables such as flower types on the basis of gene expression data. Moreover, the power and performance of transcriptional-based deep learning methods for prediction was validated in rice (Oryza sativa). Our research shows the good performance of phenotype prediction based on gene expression, with potential applications in future gene chip-based breeding practices.
-
Key words:
- Genotype-to-phenotype prediction /
- Machine learning /
- Transcriptional data