-
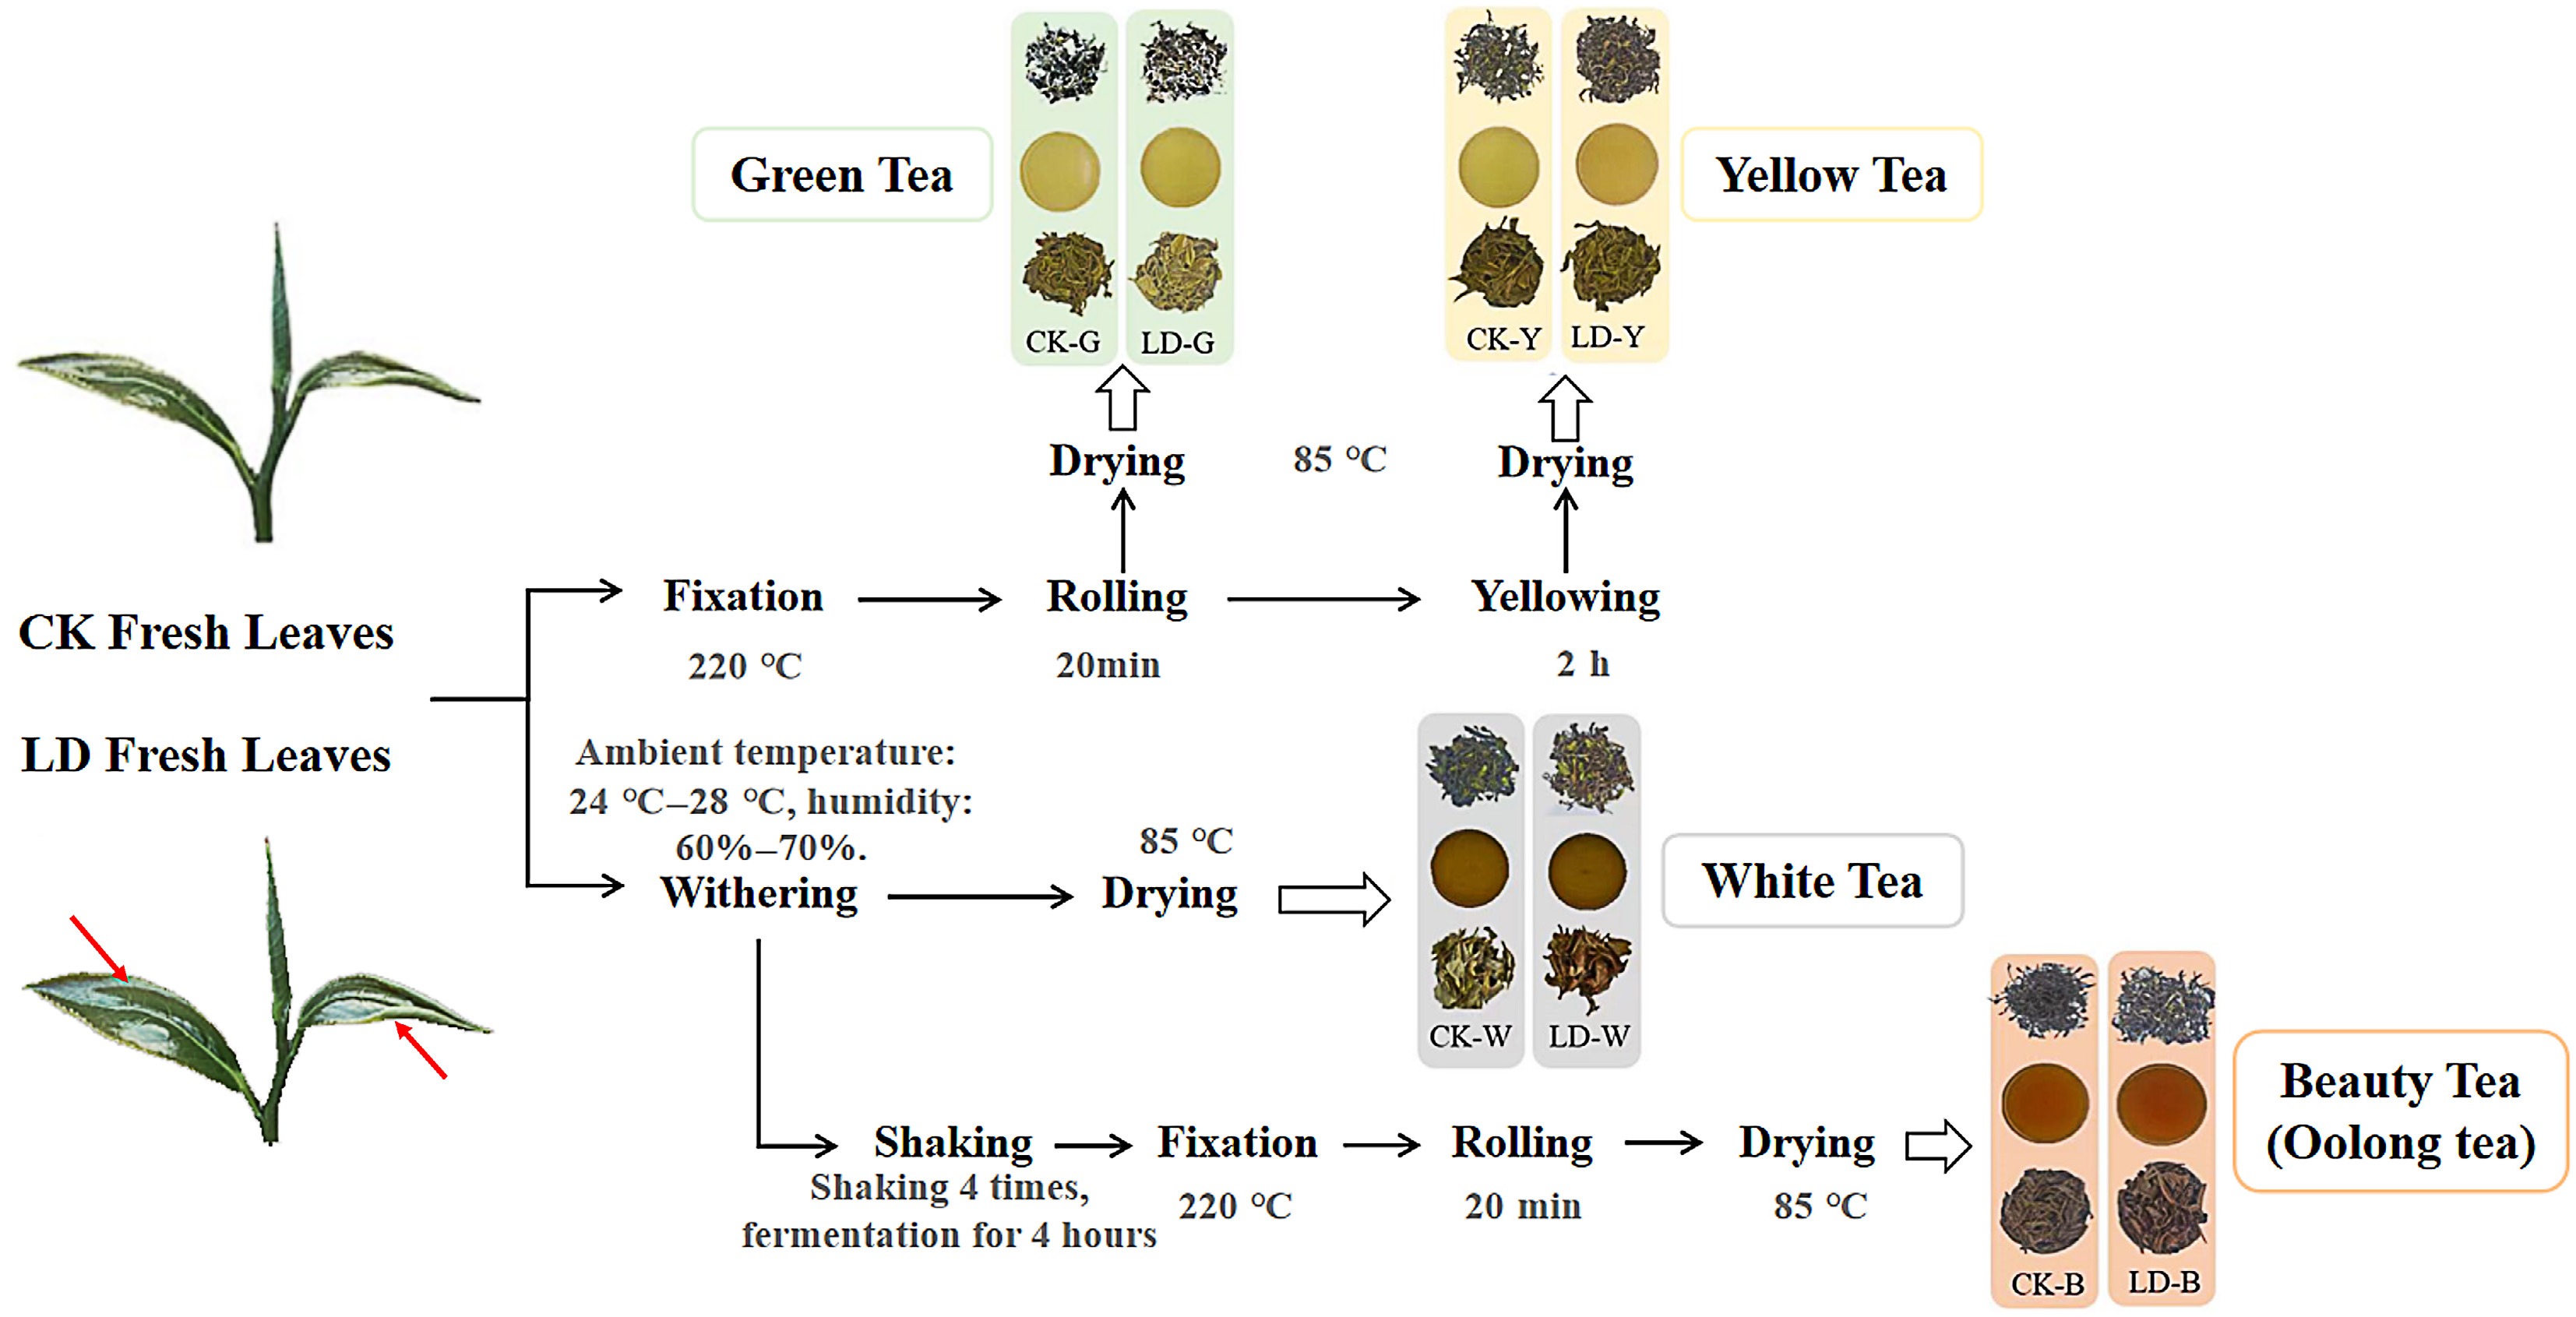
Figure 1.
Schematic diagram of tea sample processing. CK (one bud and two leaves) exhibiting a healthy, smooth surface. LD leaves with light leafhopper infestation. Red arrows indicate the locations of characteristic scattered bite spots. The LD leaves retain the overall integral shape and green color similar to CK, without necrosis or curling.
-
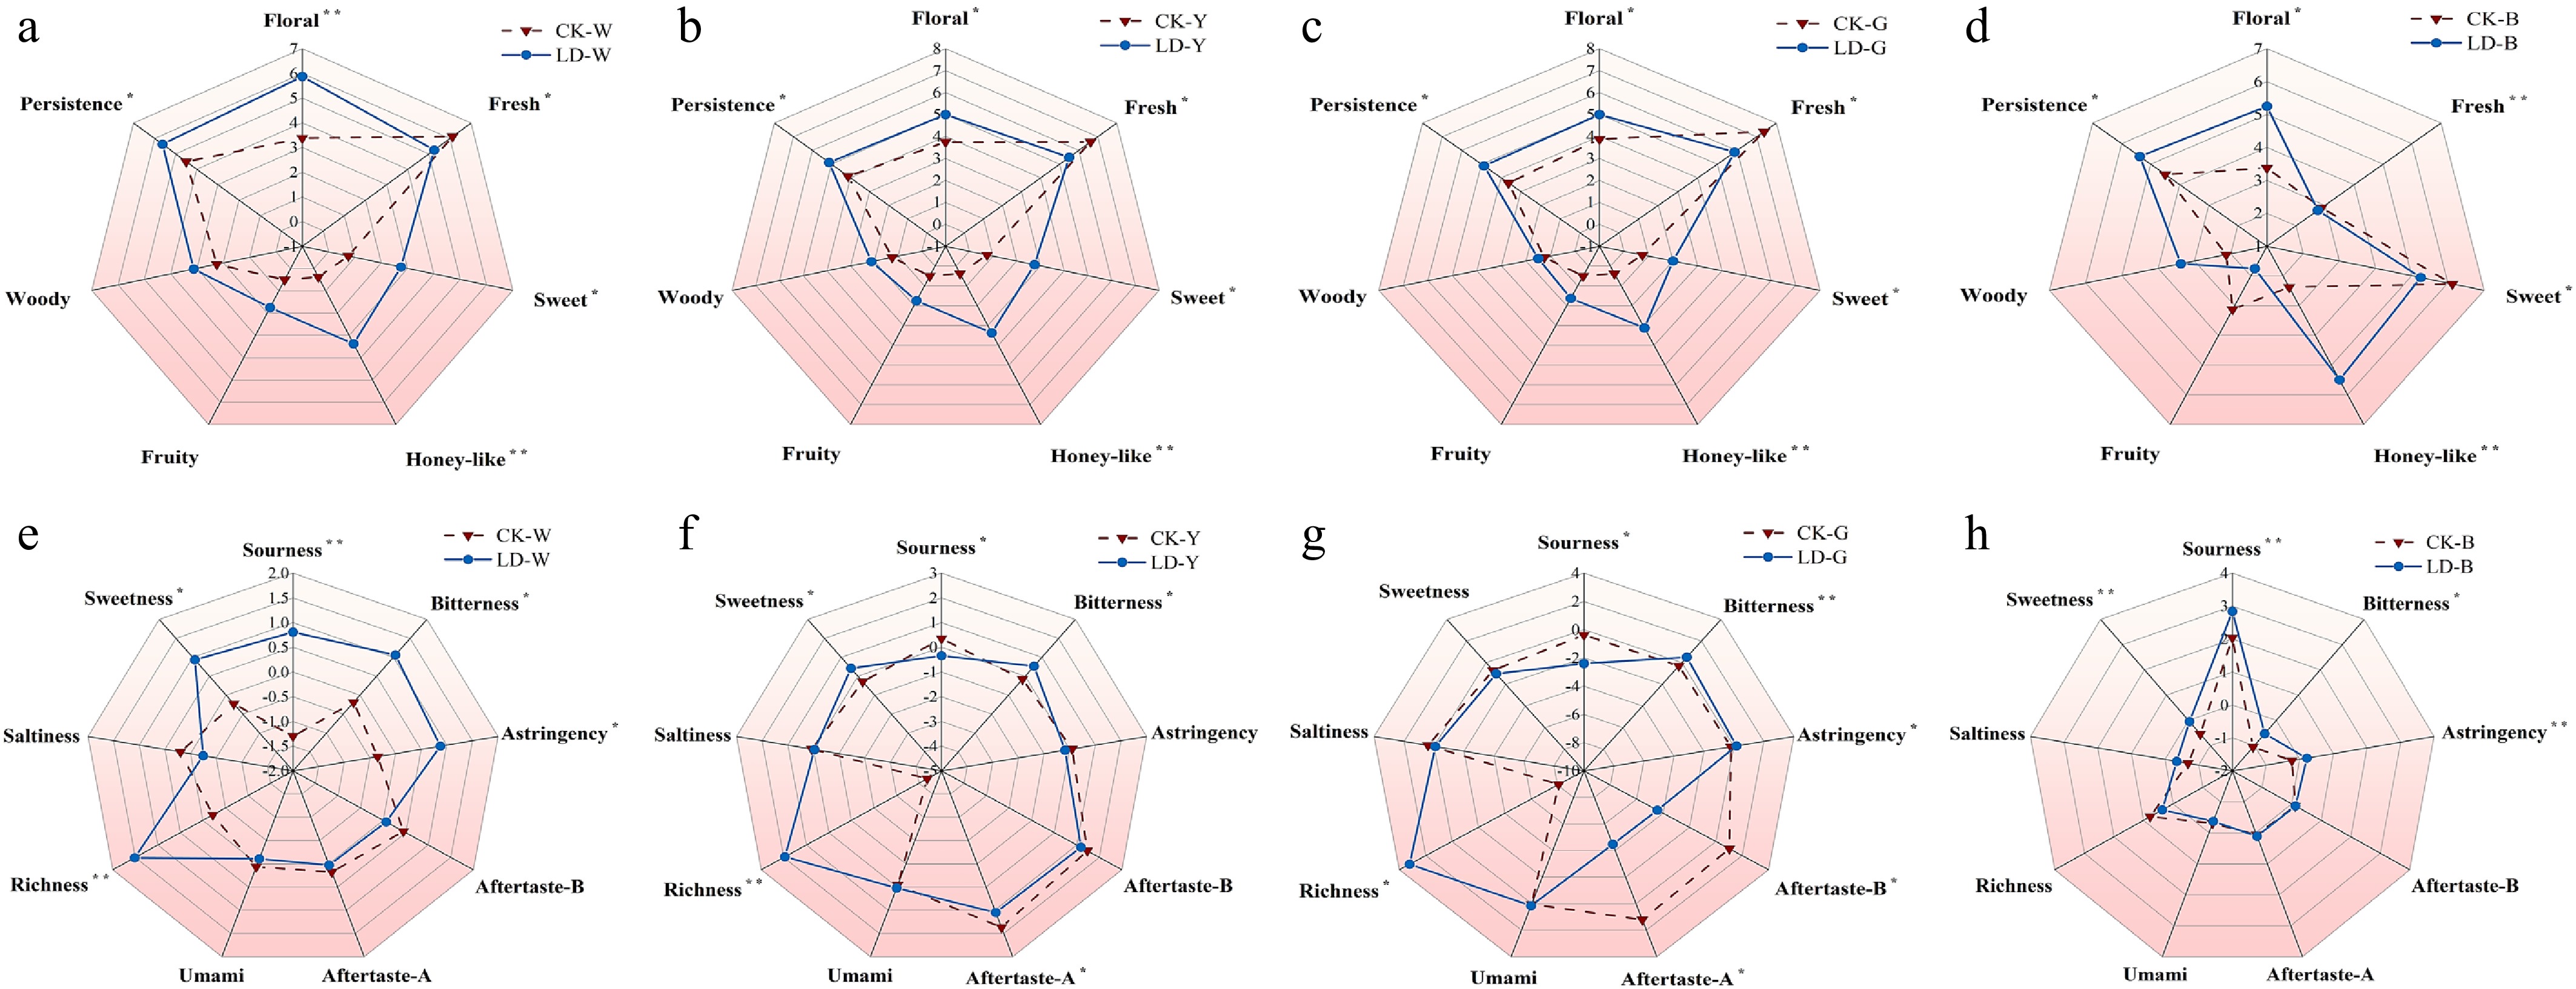
Figure 2.
Radar map of sensory properties of four types of tea. (a)−(d) Is the radar map of aroma property difference of white tea, yellow tea, green tea, and oolong tea, respectively. (e)−(h) Is the radar map of taste property difference of white tea, yellow tea, green tea, and oolong tea, respectively. * Indicates p < 0.05, ** indicates p < 0.01.
-
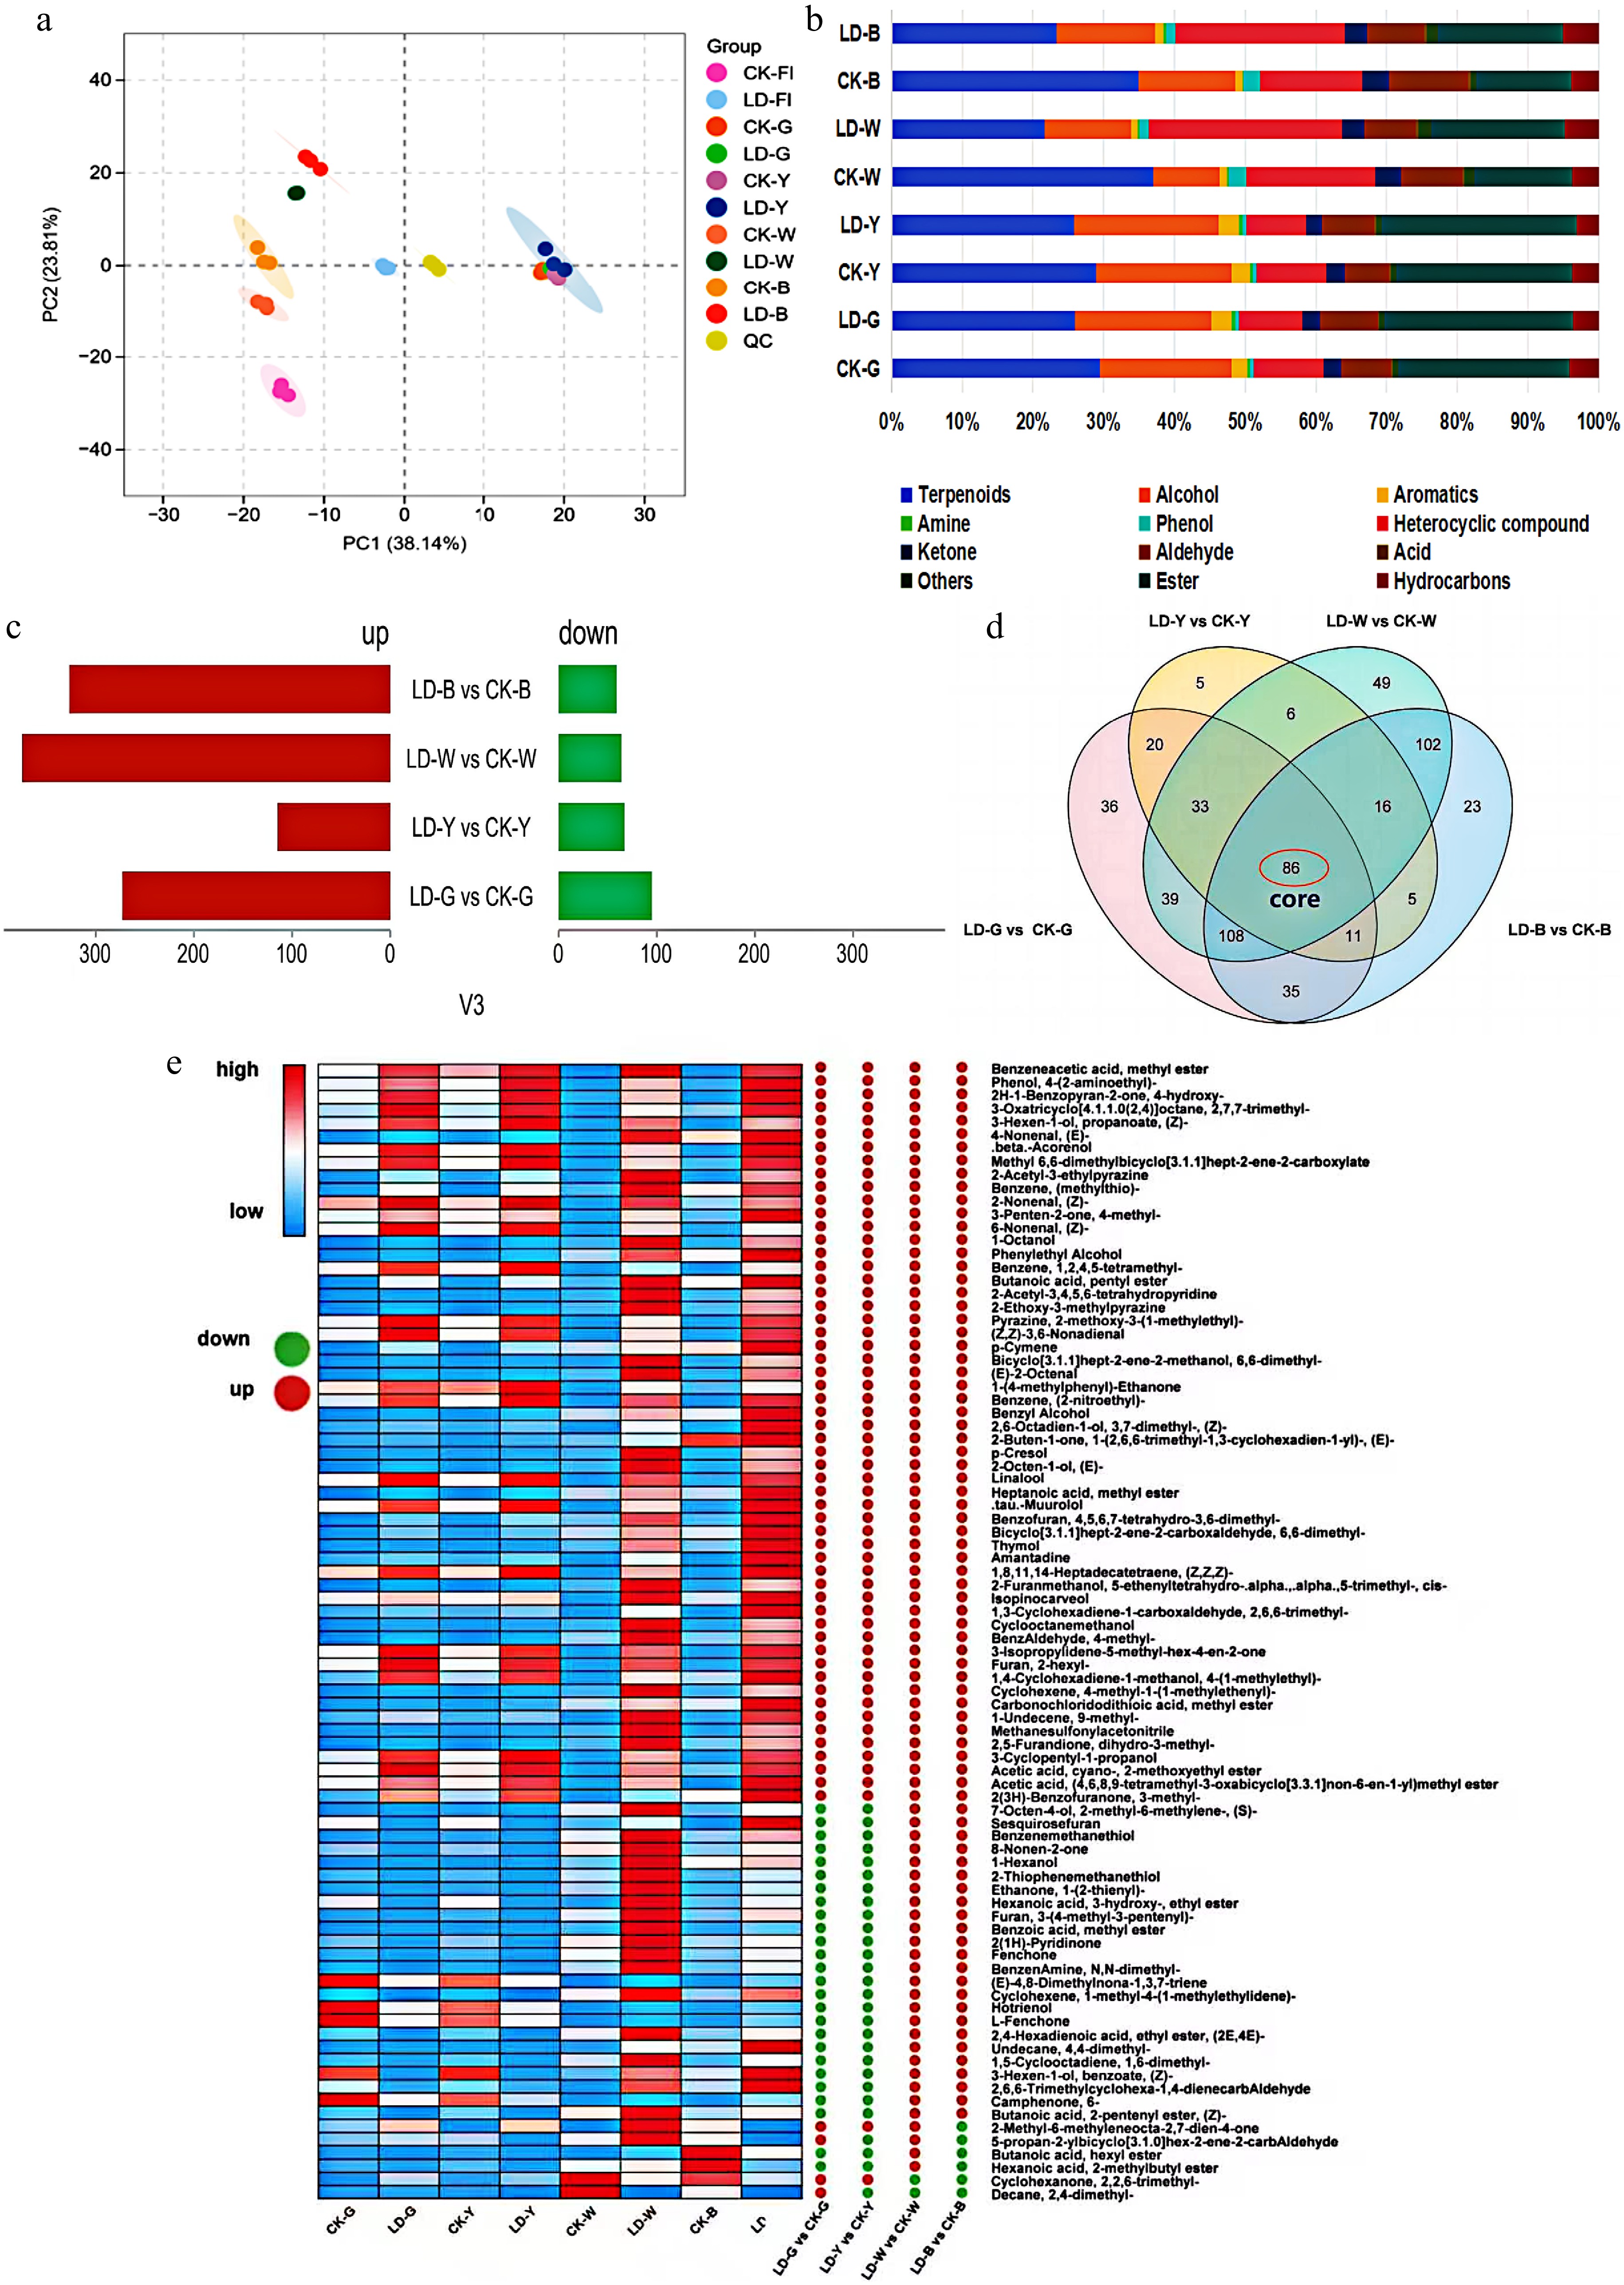
Figure 3.
Overall analysis of volatile metabolites. (a) PCA score plots of different samples. (b) Classification composition of sample volatile metabolites. (c) Differential metabolite profiles of different tea types. (d) Venn diagram of the differential metabolites across the four comparison groups. (e) Heat map of relative content of different volatile compounds in five groups of samples. The heat map shows the differences between the comparison groups, with green dots indicating a significant decrease, and red dots indicating a significant increase; the values in the heat map on the right indicate the average relative content of the volatiles in the samples (μg/g).
-
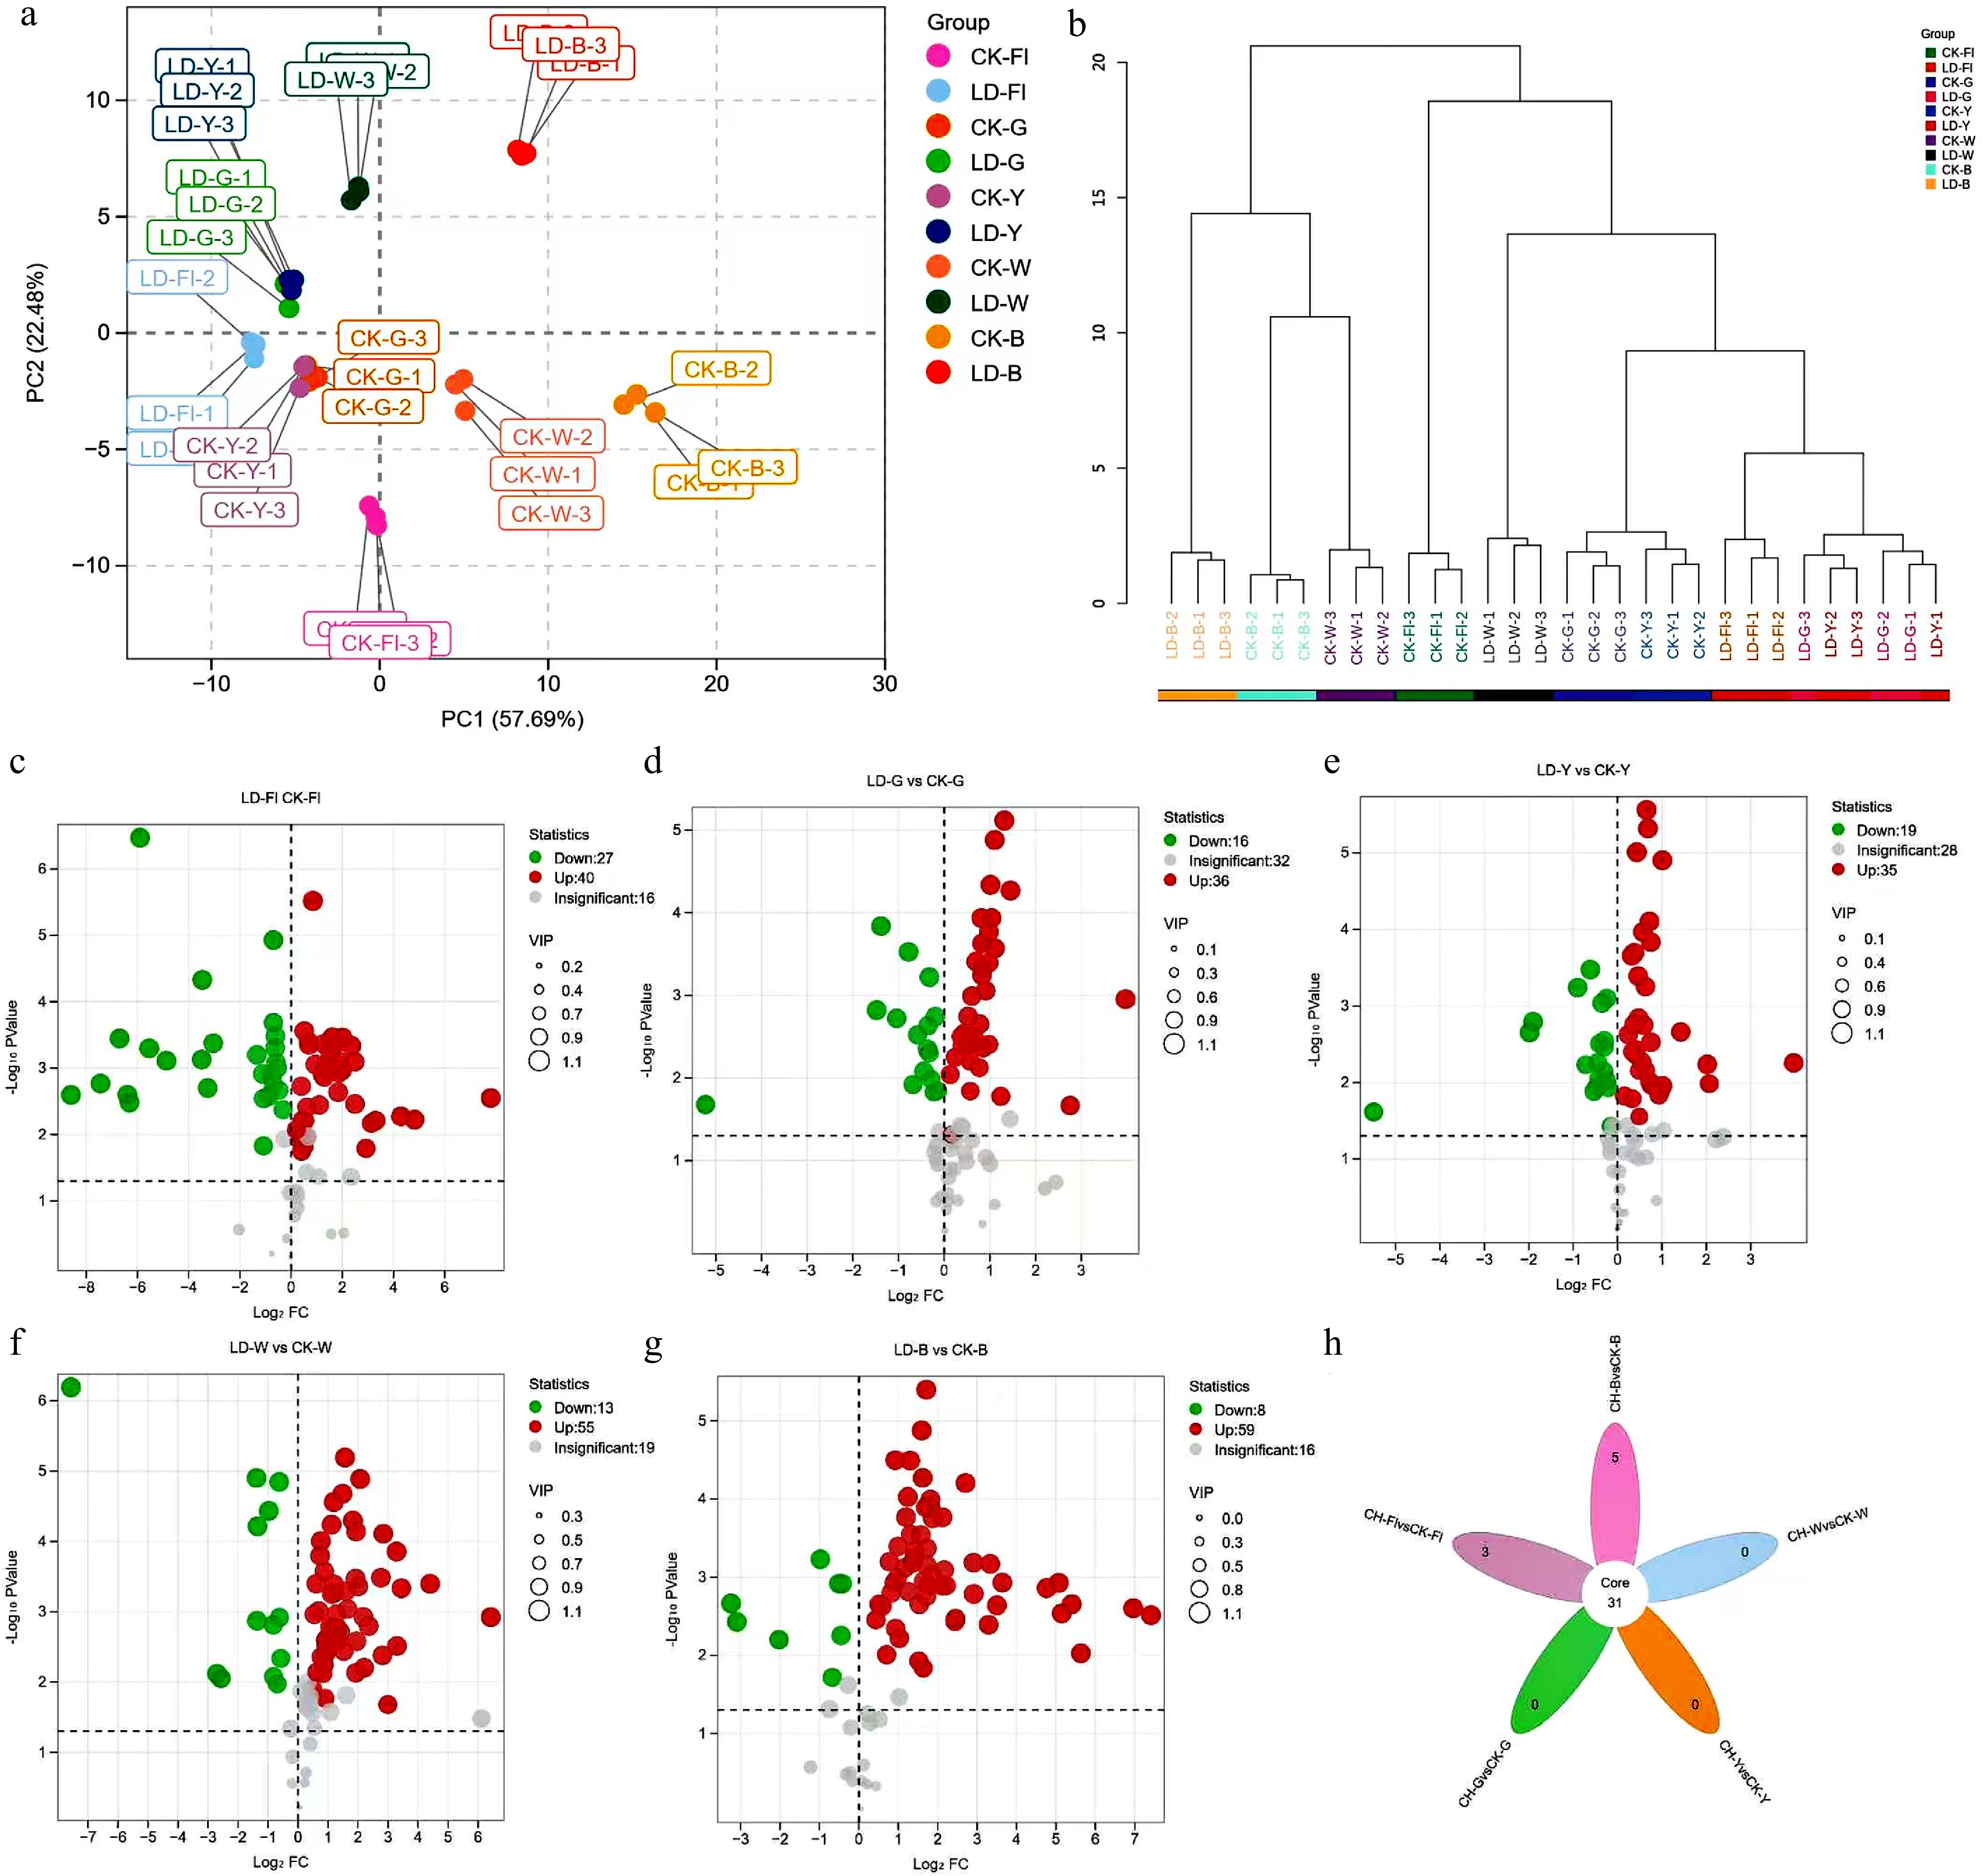
Figure 4.
Analysis of the metabolic profile of non-volatile substances between samples under different treatment. (a) PCA score plots of different samples. (b) Cluster analysis dendrogram for different treatment. (c)−(g) Cano plots for differential metabolites represent LD-Fl vs CK-Fl, LD-G vs CK-G, LD-Y vs CK-Y, LD-W vs CK-W, and LD-B vs CK-B, respectively. (h) Venn diagram of the differential metabolites across the five comparison groups.
-
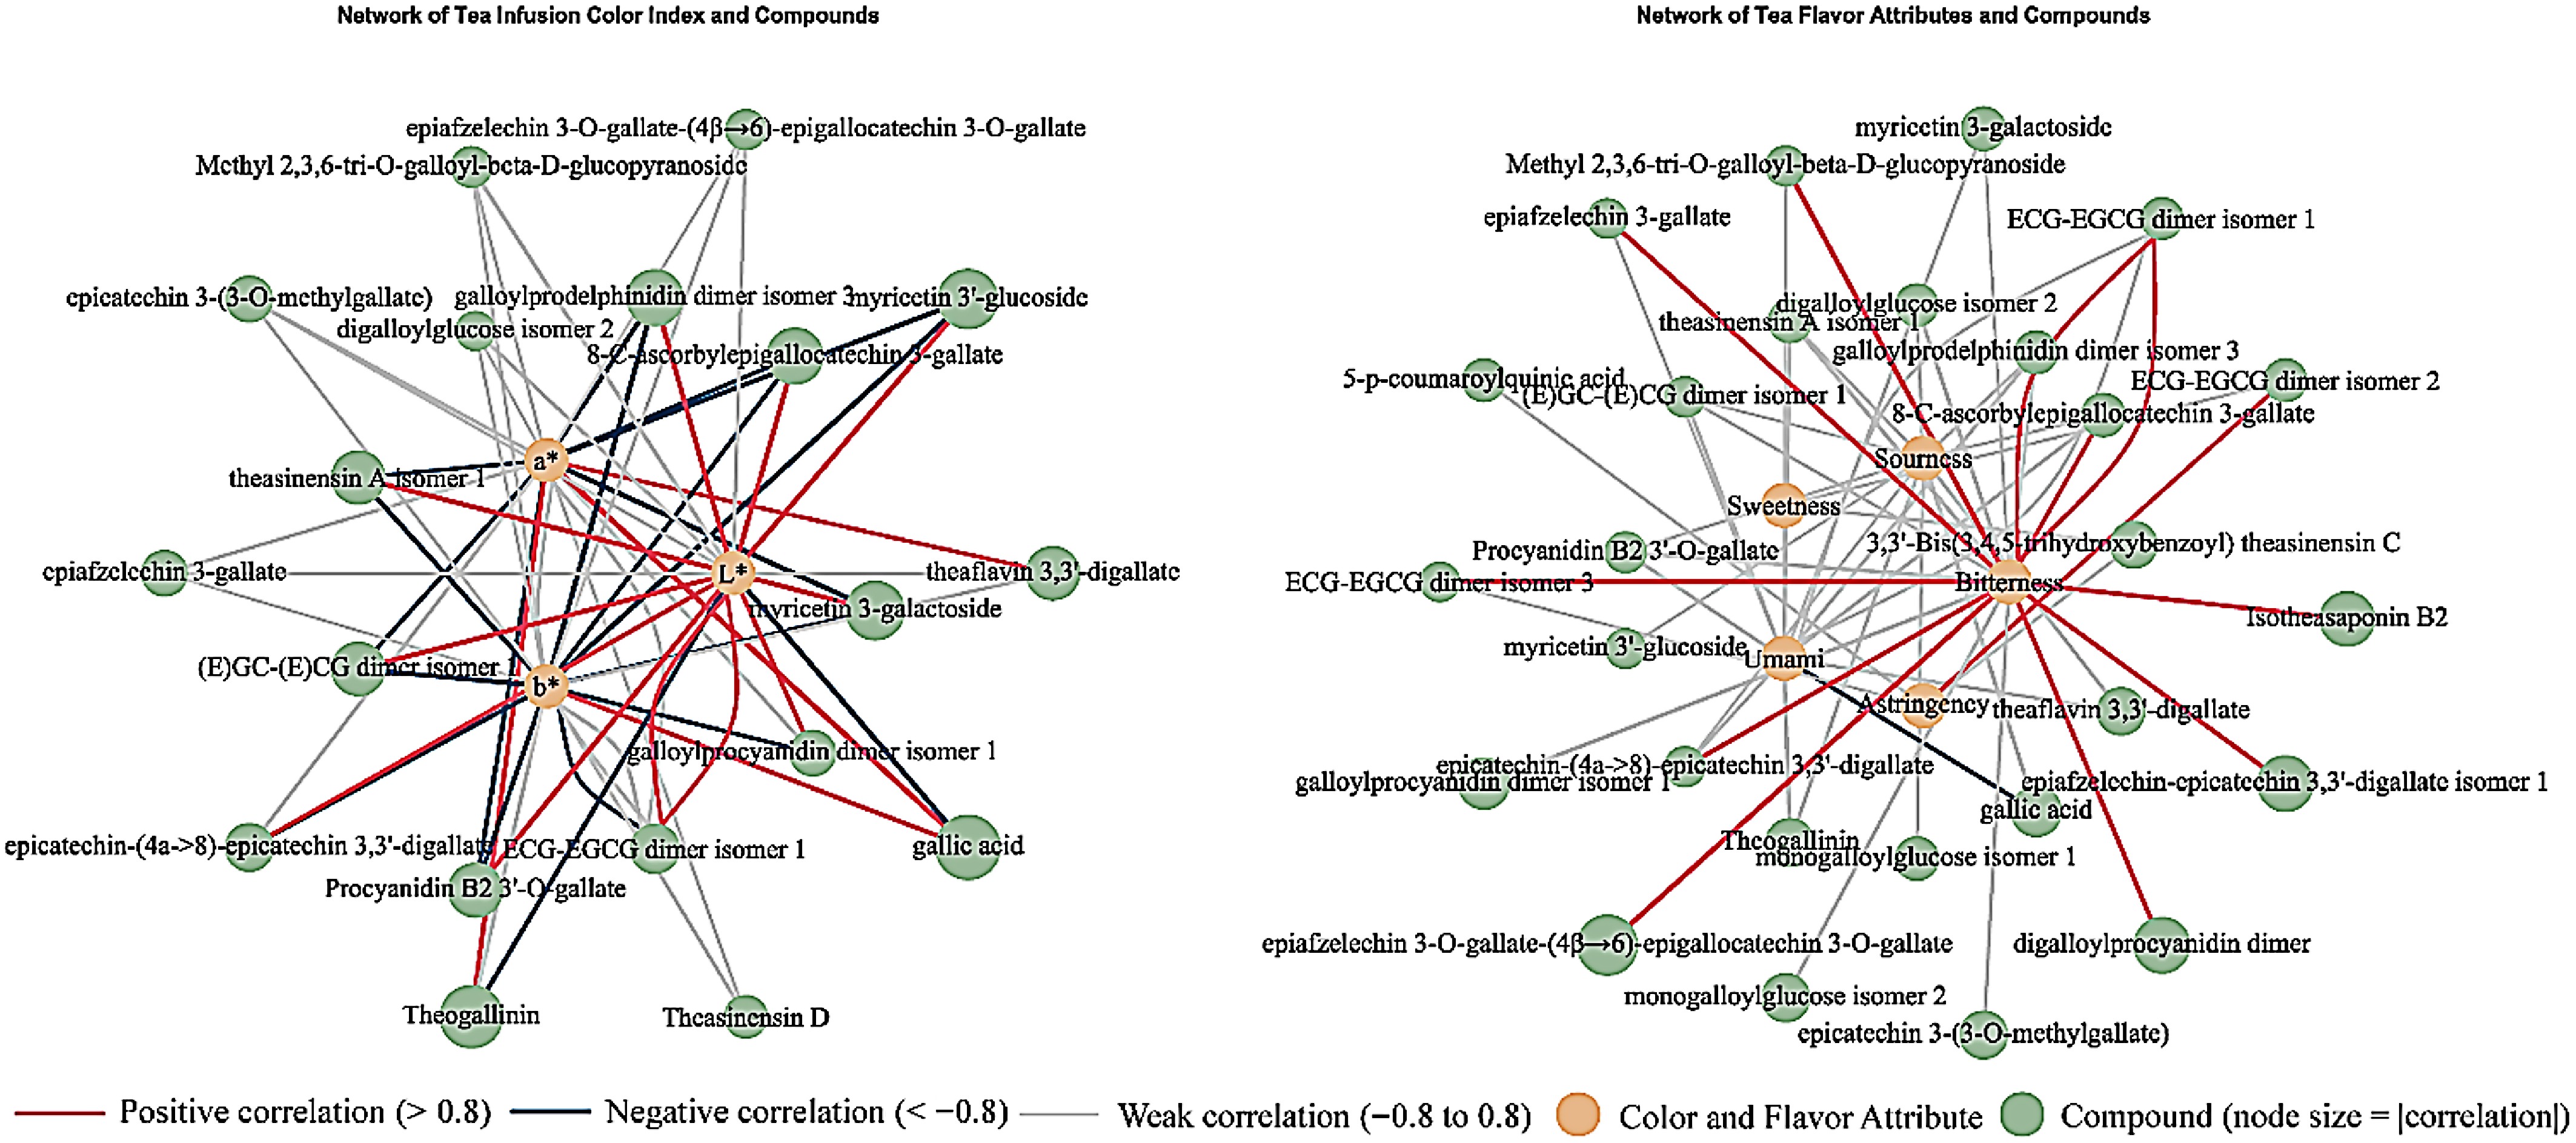
Figure 5.
Different metabolites and quality attributes of the four types of tea. (a) Color index and key metabolites. (b) Correlation network diagram between taste properties and key metabolites.
-
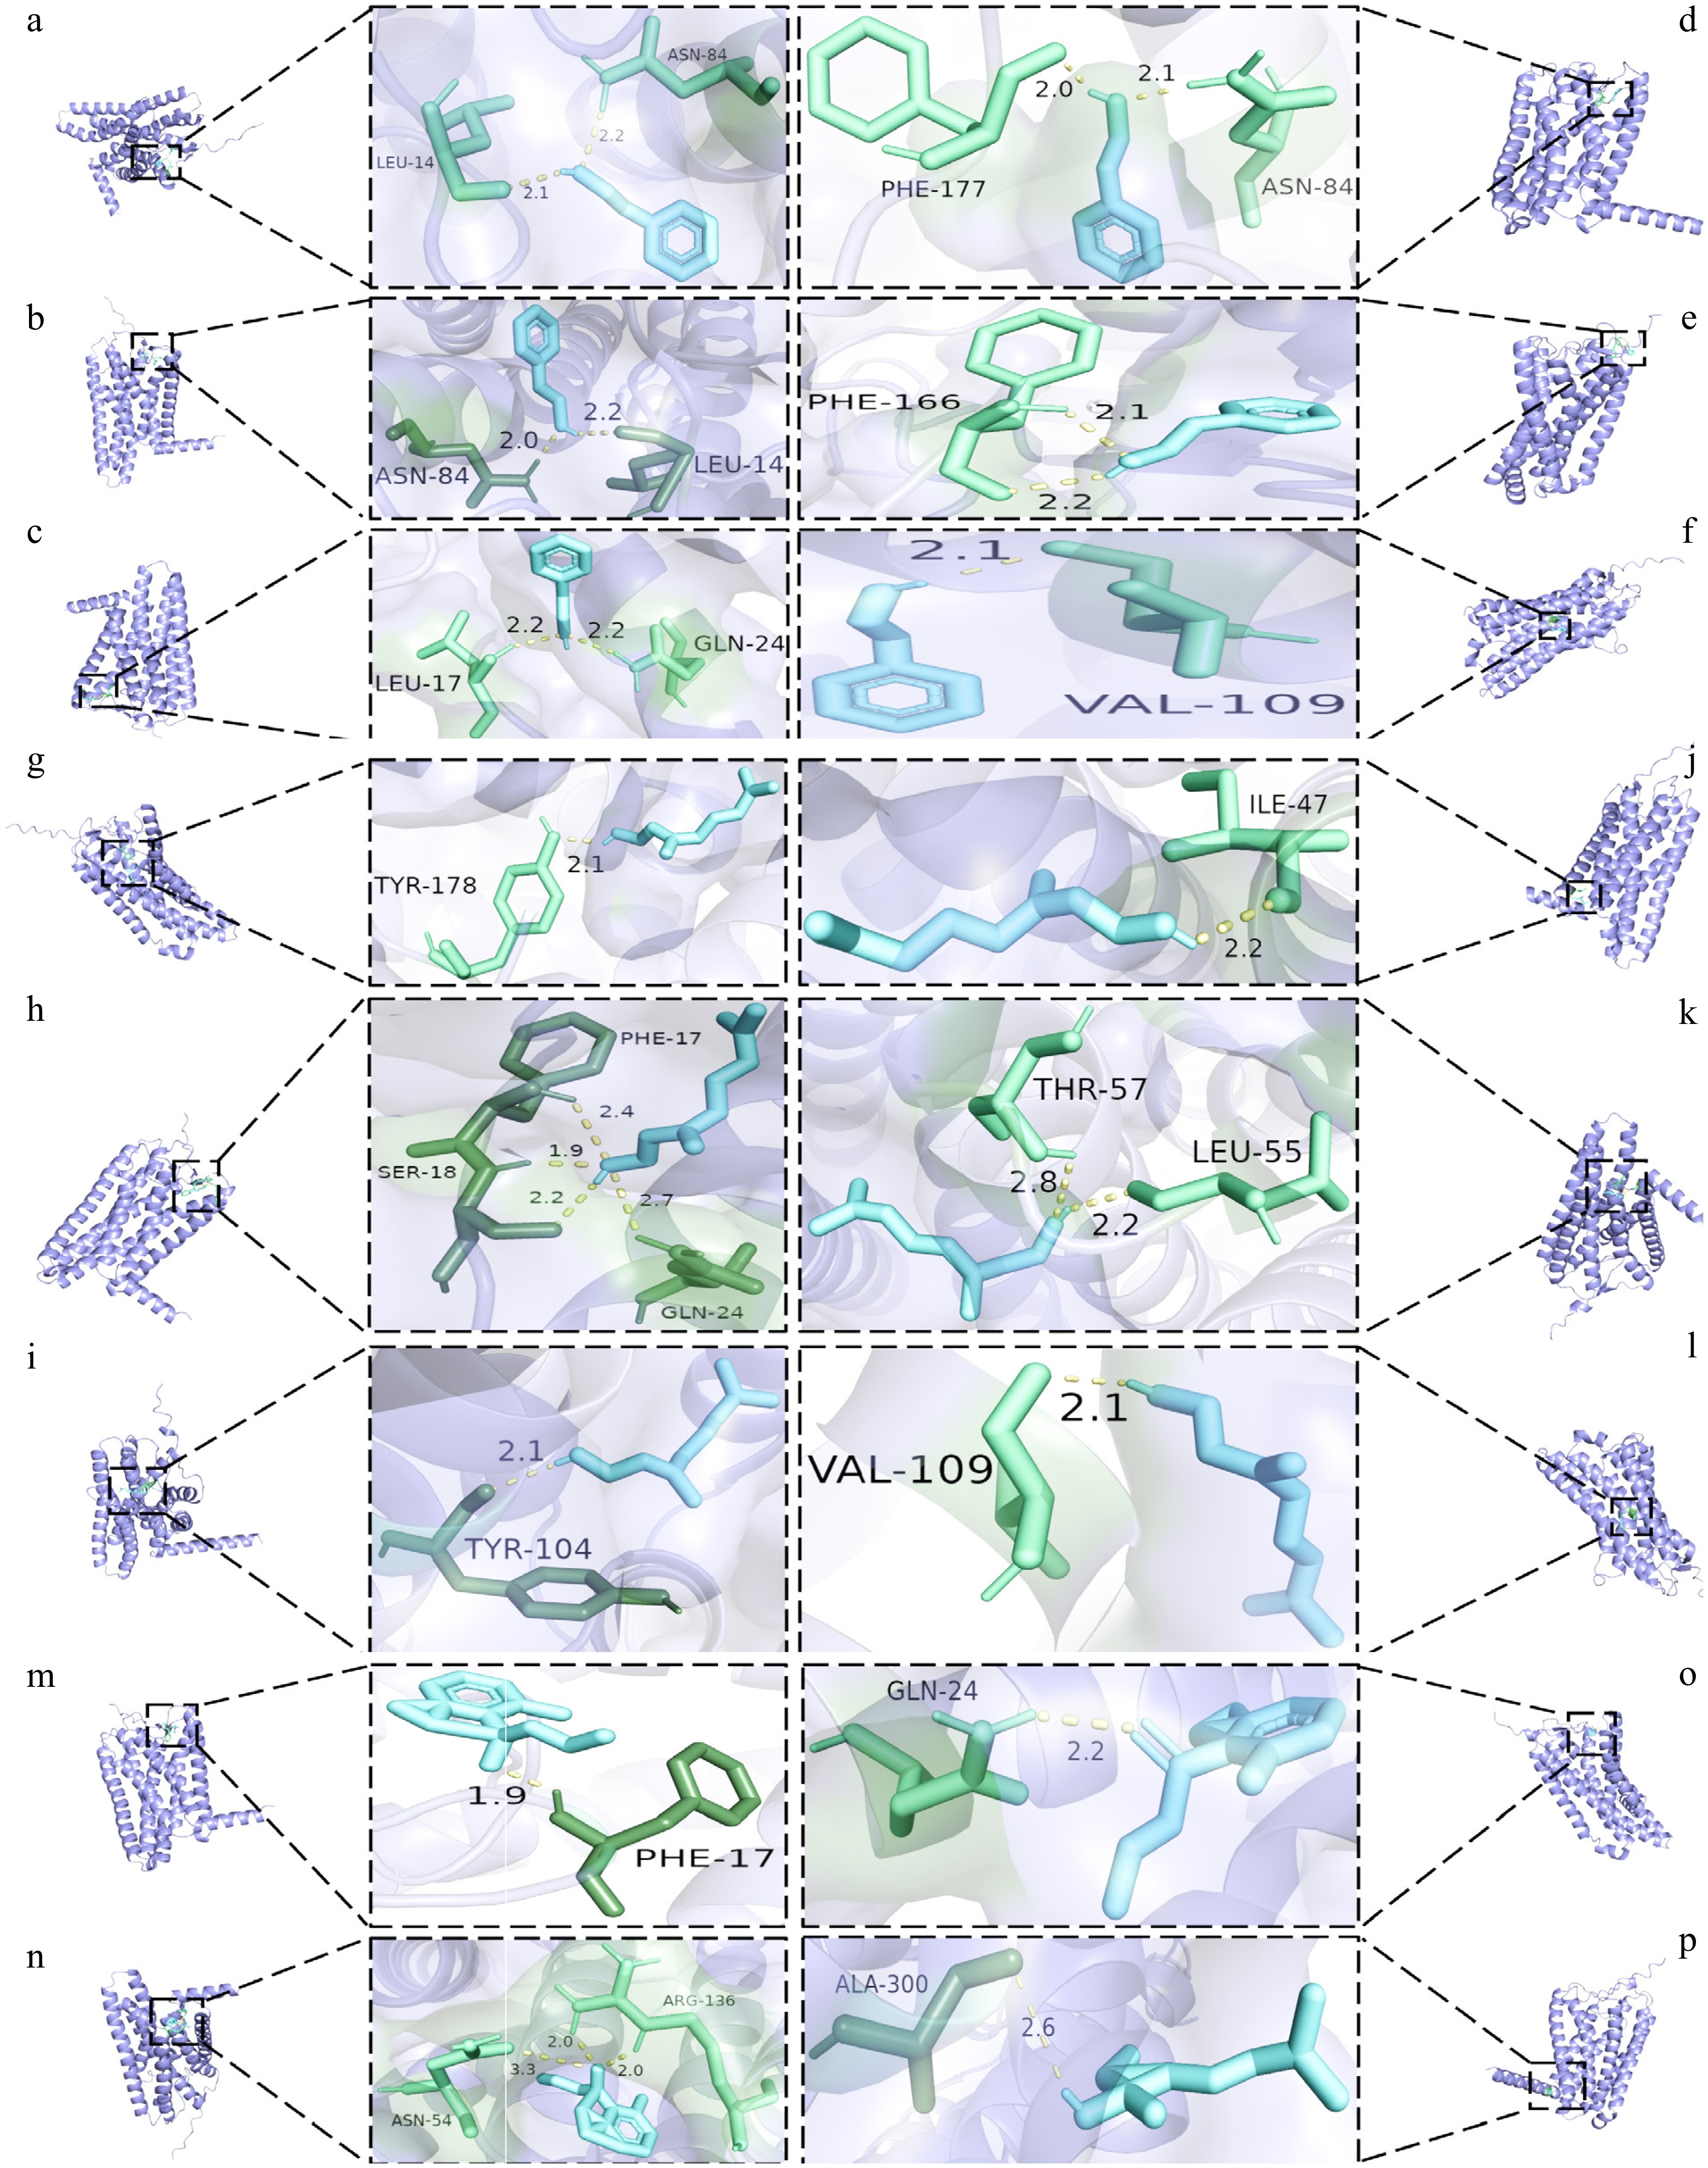
Figure 6.
Docking diagram of key aroma substances with olfactory receptor molecules. (a)−(f) The resultant maps of phenethyl alcohol docking with OR1A1, OR1G1, OR2W1, OR5M3, OR7D4, and OR8D1 olfactory receptors in order. (g)−(l) The resultant maps of geraniol docking with OR1A1, OR1G1, OR2W1, OR5M3, OR7D4, and OR8D1 olfactory receptors in order. (m)−(o) The resultant maps of damascenone docking with OR1G1, OR5M3, OR7D4 olfactory receptor in order. (p) The resultant maps of linalool docking with OR2W1 olfactory receptor in order.
-
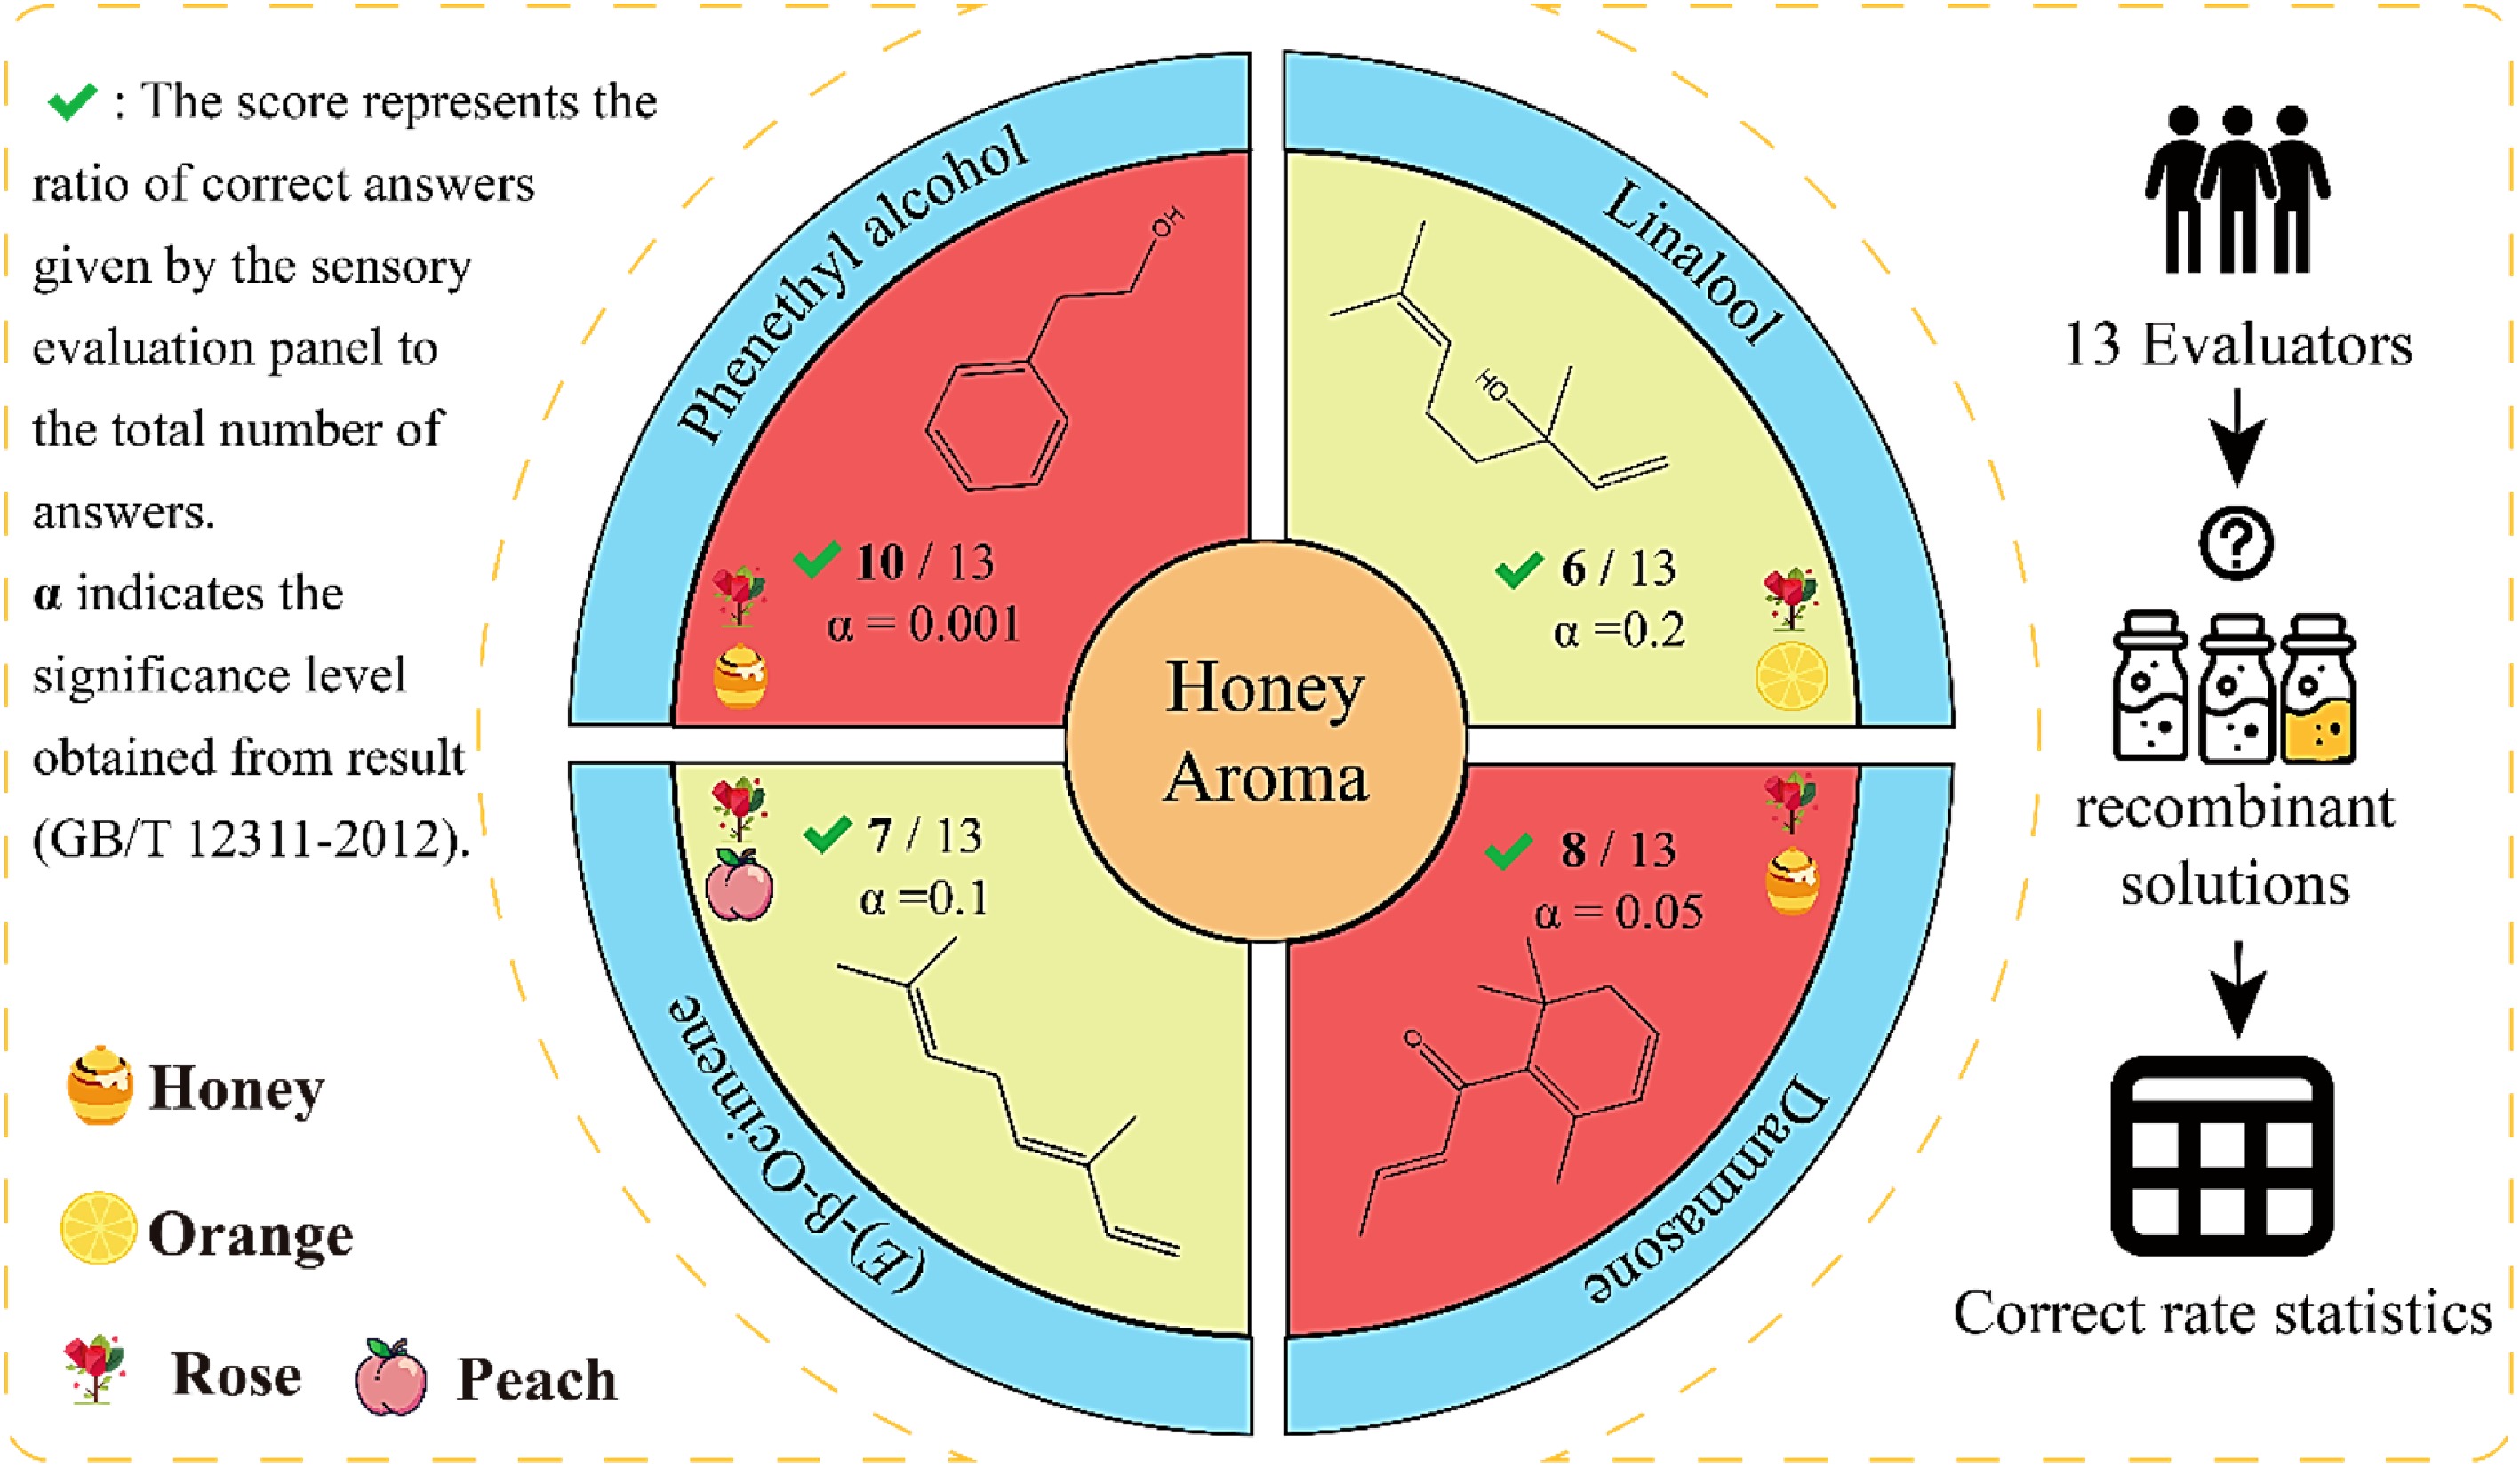
Figure 7.
Plot of the results of the experiments on the absence of key aroma components. 0.001 < α < 0.01 indicates a significant difference and 0.01 < α < 0.05 indicates a moderately significant difference[56].
-
Taste attribute Ligand proteins Compoundsa Docking score (kcal/mol) Hydrogen bond numberb Ionic interactionc Pi-Pi stackingd Sourness PKD2L1 Gallic acid −5.7 6 2 0 8-c ascorbylepigallocatechin 3-gallate −9.2 13 0 0 Umami T1R1 8-c ascorbylepigallocatechin 3-gallate −8.3 10 2 0 T1R3 −10.2 15 1 0 T1R1 Gallic acid −6.5 8 0 0 T1R3 −6.3 7 0 0 Sweetness T1R2 Cyanidin 5-o-β-D-glucoside −9.3 5 0 0 T1R3 −10.6 10 1 1 T1R2 5-p-coumaroylquinic acid −9.5 5 2 1 T1R3 −8.1 13 2 1 Bitterness T2R14 Epiafzelechin 3-o-gallate-(4β→6)-epigallocatechin 3-o-gallate −8.2 7 1 2 Gallic acid −5.8 6 0 1 a Substances in the tea infusions that have the highest correlation between their content and the response value of the electronic tongue for a particular flavour attribute. b Hydrogen-bond between strong donor and acceptor atoms. c Interactions between pairs of oppositely charged groups. d Interactions between delocalized Pi systems. Table 1.
Molecular docking energy of main differential compounds with taste receptors.
Figures
(7)
Tables
(1)