


-
The tea plant (Camellia sinensis [L.] O. Kuntze) is a key global crop native to China. China has developed six major tea types: green, white, yellow, oolong, dark, and black tea[1,2]. Empoasca onukii (Matsuda) is a piercing pest in asian tea, damaging tea plants through piercing-sucking behavior. Yield loss reaches 30%–55% in severe cases[3,4]. Moderate piercing enhances quality metabolites. This phenomenon is widely applied in processing, especially for oolong and green tea[5−7]. Leafhopper piercing up-regulated flavanol volatiles, altered amino acid and glutathione levels, and elevated salicylic and jasmonic acid contents[4]. Additionally, leafhopper piercing converted catechin and increased the accumulation of other secondary metabolites[8], these changes are essential for the flavour and quality of LT[9,10].
"Honey Flavour" is key in tea sensory evaluation, denoting thecombined honey aroma and taste found in high-quality beauty teas. It parallels rock flavour and yin rhyme. "Rock flavour" originates fromthe unique mineral uptake and roasting process of Wuyi rock tea , which imparts a distinct rocky odour and mellow character[11]. While 'Yin rhyme' is characterized by Tieguanyin's orchid fragrance andenduring sweetness, these traits are closely linked to its unique secondary metabolites[12]. The formation of honey flavour is closely linked to secondary metabolism and olfactory perception induced by leafhopper piercing. Research has demonstrated that, under leafhopper-induced stress, tea trees activate the phenylpropane pathway to synthesize aromatic compounds such as phenethyl alcohol and benzyl alcohol. Concurrently, increased glycoside hydrolase activity releases free monoterpene alcohols, contributing to the sweet and honey-like taste of tea infusion[7]. Furthermore, activation of the jasmonic acid signaling pathway in response to piercing injury induces the accumulation of sugars and amino acids, further enhancing the sweetness and freshness of the tea[4].
Molecular docking simulates protein-ligand interactions by optimizing their three-dimensional structure and evaluating affinity based on binding energy. Binding energies between −6 and −8 kcal/mol indicate moderate affinity, while values below −8 kcal/mol suggest strong binding, often linked to efficient inhibitors or natural ligands[13−16]. Taste perception in mammals relies on receptors in tongue taste buds, recognizing five basic tastes: sweet, fresh, bitter, sour, and salty. Sweetness and freshness are mediated by G Protein-Coupled Receptors (GPCRs), with the T1R2/T1R3 complex detecting sweetness and T1R1/T1R3 sensing freshness[17,18]. Bitterness is recognized by T2Rs, notably T2R14[19]. Sourness and saltiness are linked to ion channels, with PKD2L1 mediating sourness and ENaC detecting saltiness via hydrogen and sodium ions[20,21].
Olfaction can be divided into orthonasal and retronasal pathways. Orthonasal olfaction involves inhaling external odours through the nostrils, stimulating the olfactory epithelium, and enabling odour perception. This process is associated with neural circuits linked to the external environment. In contrast, retronasal olfaction involves perceiving oral-origin odours, processed similarly to taste in the brain. The neural circuits for retronasal olfaction are akin to those in the gustatory cortex, and inhibiting retronasal olfaction impedes preference learning, while not affecting orthonasal olfaction. Research suggests retronasal olfaction facilitates rapid preference development and enhances orthonasal olfaction learning, influencing eating behavior by integrating oral odour and taste into a unified flavour experience[22]. Current research on odour-induced taste enhancement focuses mainly on sweet taste perception, with less attention on other tastes. The aroma components in food are complex, with studies particularly examining floral, fruity, and sweet volatiles. For example, the inclusion of geraniol and β-ionone in tea infusion has been shown to enhance sweetness[23]. These bioactive components not only affect taste directly but also contribute to overall flavour perception through aroma compounds[24]. The interaction between odour and taste forms a complex cross-modal perception mechanism[25]. The addition of aroma compounds has been proven to replace additives in processed foods and enhance flavour perception[23,26].
In this study, fresh tea leaves pierced by leafhoppers and non-pierced controls were processed into four tea types: green, yellow, white, and oolong. By integrating sensory evaluation, quantitative descriptive analysis (QDA), electronic tongue, and colorimetric assessment, we objectively characterized differences in infusion flavor and appearance between leafhopper-pierced teas (LT) and non-LT. To further elucidate the material basis underlying these differences, metabolites influenced by leafhopper piercing were identified using HS-SPME-GC-MS and non-targeted metabolomics, enabling the preliminary screening of characteristic compounds associated with honey-like aroma and taste. The contribution of these candidate compounds was further verified through aroma recombination, omission–addition tests, molecular docking, and e-tongue validation. This work represents the first systematic comparison of LT and non-LT across multiple tea processing types, thereby minimizing interference from processing effects and revealing common flavor traits induced by leafhopper piercing. Importantly, it also provides the first systematic identification of honey flavour-related key compounds, laying a theoretical foundation for the industrial development of LT and offering new directions for exploring the biochemical and sensory mechanisms by which leafhopper piercing shapes tea quality.
-
During the peak period of leafhopper piercing, Camellia sinensis 'Jinxuan' fresh leaves (one bud and two leaves) were randomly collected in a uniform experimental plot for the study. Following the grading standard[6], samples were classified into CK (no visible infestation) and LD (typical scattered bite spots and slight yellowish halos without necrosis), ensuring distinct infestation levels within the same physiological context. The experimental samples included finished green tea, yellow tea, white tea, and oolong tea (beauty tea). These samples were stored at −20 °C until further analysis. The primary processing methods and sample numbers are depicted in Fig. 1. Three biological replicates were conducted for each type of tea.
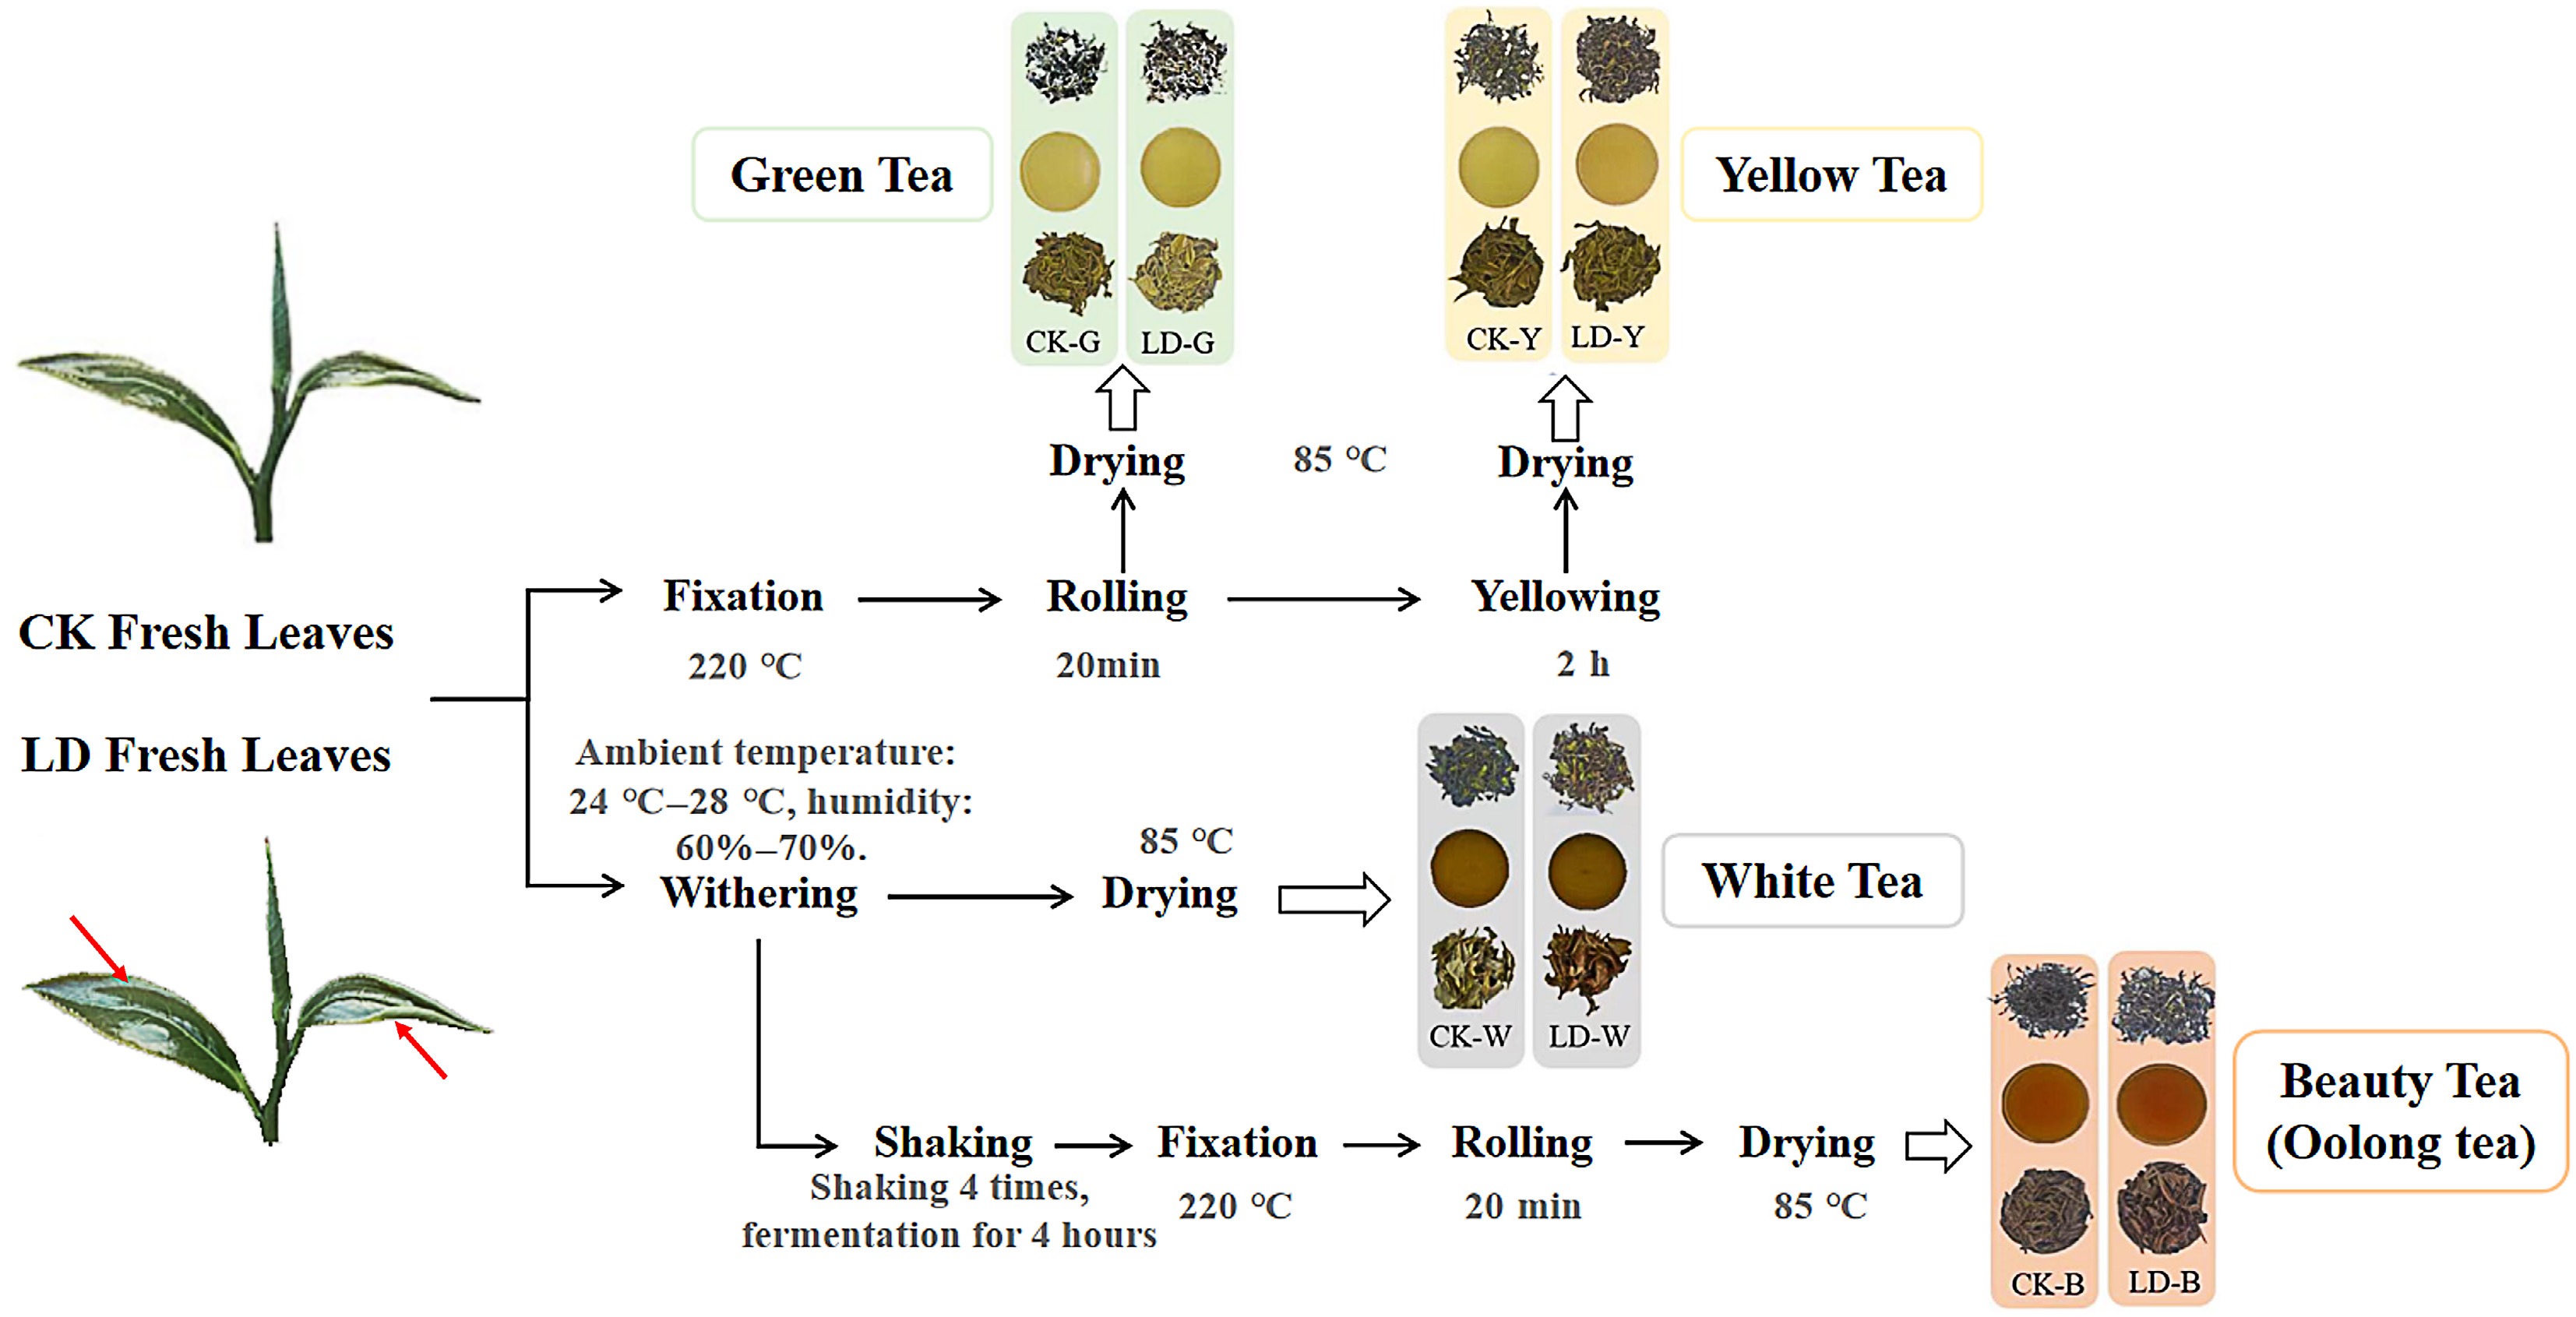
Figure 1.
Schematic diagram of tea sample processing. CK (one bud and two leaves) exhibiting a healthy, smooth surface. LD leaves with light leafhopper infestation. Red arrows indicate the locations of characteristic scattered bite spots. The LD leaves retain the overall integral shape and green color similar to CK, without necrosis or curling.
Sensory evaluation
-
In accordance with the national standard GB/T 23776-2018, the evaluation of green tea, yellow tea, and white tea was conducted using the cylindrical cup evaluation method. After accurately weighing 3.0 g of tea samples, 150 mL of boiling water was added. Green tea was brewed for 4 min, while yellow and white teas were brewed for 5 min before evaluation. Oolong tea was evaluated using the gaiwan (a traditional Chinese lidded tea-brewing bowl) evaluation method, with 5.0 g of tea samples and 110 mL of boiling water. It was brewed three times: 2 min for the first brew, 3 min for the second, and 5 min for the third. The second brewing was the main sample, combined with the first and second brews for evaluation. Sensory analysis was performed using Sun's QDA method[27]. A panel of nine assessors (four females and five males, aged 23–42 years) was recruited from the College of Horticulture, Fujian Agriculture and Forestry University. Following ISO 8586:2023 standards, candidates underwent a series of tests to validate normal sensory sensitivity, including basic taste identification, odor identification, and ranking tests. Only candidates who passed all screening tests with scores above 80% were selected for the panel. Prior to formal evaluation, selected panelists underwent rigorous two-week training. This training followed the consensus method specified in ISO 11035:1994, comprising three stages: term generation, definition and consensus, and intensity calibration. To ensure scoring consistency, specific reference standards are established for each attribute, as detailed in Supplementary Table S1. Scoring was performed (0 for none, 5 for moderate, and 9 for the strongest). Final scores were averaged for each aroma attribute. All tea samples and aroma standard substances were food-grade, and informed consent was obtained from all participants. Although our institution does not require formal ethical approval for human sensory studies, we adhered to strict protocols—including no coercion, full disclosure of risks, secured consent, data confidentiality, and the right to withdraw—to protect participants' rights and privacy. All participants signed consent forms, including 2.4.5 GC-O test and 2.7.2 aroma substance addition test.
Objective quantitative analysis of tea infusion color
E-eyes tea infusions colour measurement
-
A YS3060 portable colourimeter (Shanghai Li-Chen Technology Company, Shanghai, China) was utilised for the purpose of the experiment. The device was calibrated with standards, and deionised water served as a blank. The tea infusions' color was analyzed to monitor the degree of fermentation, which serves as a macroscopic phenotypic marker for the formation of quality-related metabolites. Five mL of tea infusion was taken into the quartz cuvette to collect data immediately after its preparation. Each test was repeated three times to take the average value, and each sample was repeated three times.
E-tongue tea infusions taste measurement
-
A taste analysis system model SA402B (INSENT, Japan) equipped with five sensors was utilised, and the sensor information is displayed in Supplementary Table S2. E-tongue used 3.00 g of tea per replicate, accurately weighed (to 0.01 g), with the tea infusions being prepared in accordance with the national standard GB/T 23776-2018. The tea infusions were then cooled to room temperature, filtered using a 0.22 μm filter membrane, and 100 mL of the filtrate was taken for the assay. Prior to commencing the analysis, the sensor was tested and corrected using each taste standard. Once the sensor response had stabilised, the test and analysis were carried out in accordance with a predetermined procedure, and the test was repeated on three separate occasions for each sample. The reagents necessary for the electronic tongue assay are enumerated in Supplementary Table S3.
Analysis of volatile substances
HS-SPME extraction conditions
-
The samples were retrieved from the refrigerator at −20 °C and subsequently ground, vortexed to ensure thorough mixing, and then diluted to the indicated concentration. 5.0 g of each sample was weighed into a headspace vial, and saturated NaCl solution and 20 μL (10 μL/mL) of ethyl caprate (Sigma Aldrich, Merck KGaA, Germany) internal standard solution were added separately. The sample was equilibrated for 5 min at 60 °C, and then the extraction head (120 μm, DVB/CWR/PDMS, SAAB-57330U, Supelco, USA) was inserted into the sample headspace vial for 15 min. The extraction was then carried out for 15 min, after which desorption was performed at 250 °C for a further five min. The GC-MS separation process was then initiated. The extraction head was subjected to a thermal treatment in a fiber conditioning station at a temperature of 250 °C for a duration of 5 min prior to the sampling process.
Conditions for GC-MS analysis
-
The identification and quantification of volatile compounds were performed using an Agilent 8890B-7000D (DB-5MS, 30 m × 0.25 mm × 0.25 μm, Agilent J&W Scientific, Folsom, CA, USA) with a carrier gas of high-purity helium (purity ≥ 99.999%) at a constant flow rate of 1.2 mL/min. The temperature of the inlet was set at 250 °C, with no shunt injection and a solvent delay of 3.5 min. The temperature increase procedure was as follows: Initially, the temperature was increased from 40 to 100 °C at a rate of 10 °C/min, followed by a subsequent increase to 180 °C at a rate of 7 °C/min. The final stage involved a decrease to 280 °C at a rate of 25 °C/min, which was held for a duration of 5 min. The mass spectrometry interface temperature was set to 280 °C, the electron energy to 70 eV, and the scanning mode to SIM. This was in accordance with the qualitative and quantitative ion precision scanning procedure outlined in GB/T 232008-2016.
Qualitative and quantitative analysis of metabolites
-
The qualitative and quantitative analysis of metabolites was conducted according to the method of Yuan et al.[28]. One quantitative ion and two to three qualitative ions were selected for each compound based on the self-generated database of identified RTs and qualitative and quantitative ions for the selective ion detection mode for accurate scanning. All ions to be detected in each group were detected separately in time intervals according to the order of the peak, and if the retention time of the detected ions was consistent with the standard reference and the selected ions all appeared in the mass spectrum of the samples after subtraction of the background, the substance was considered to be present. The peak area of the internal standard was used for relative quantification of the compounds.
OAV value calculation
-
The compounds were analysed to obtain the odour of the compounds and their thresholds to calculate the OAV values via the website (
www.thegoodscentscompany.com ,www.perflavory.com ,www.odour.org.uk/odour/index.html ,http://foodflavorlab.cn ) and the references[29,30]. Aroma compound contents were obtained by an internal standard semi-quantitative method; therefore, calculated odor activity values (OAVs) essentially represent relative odor activity values (rOAVs). For consistency with prior tea aroma studies, the term 'OAV' is used throughout, but should be understood as based on semi-quantitative data.GC-O-MS detection method
-
The GC-O detection method was adapted from the method of Wen et al.[31]. The aroma components were separated and detected using a GCMS-QP2020 NX GC-MS (Shimadzu, Japan), and the chromatographic separation of the aroma components was performed on a chromatographic column (DB-5MS, 30 m × 0.25 mm × 0.25 μm, Agilent J&W Scientific, Folsom, CA, USA) and partitioned in a 1:1 ratio between the olfactory detection port (ODE2030, Shimadzu, Japan) and the mass spectrometry. The method for enriching volatile substances is the same as that in HS-SPME extraction conditions.
The temperature increase procedure was as follows: initially, the temperature was increased to 40 °C for 3 min, followed by a subsequent increase to 120 °C at a rate of 2 °C/min for 2 min. Thereafter, the temperature was elevated to 230 °C at a rate of 10 °C/min for an additional 2 min. The mass spectrometry (MS) conditions were as follows: EI ion source employed an electron energy of 70 eV, a scanning frequency of 2.4 times/s, a detector temperature of 230 °C, and a full scanning mode of acquisition. The temperature of the transfer line was set at 230 °C, the scanning mode was configured as full scan, the mass scanning range was established at 35–350 m/z, and the solvent delay time was set to 3 min. The GC-O injector and the transfer line were set at 230 °C, and high-purity nitrogen (99.99%) was used as the carrier gas. The review team for the GC-O analyses comprised 21 testers (11 males and ten females), all of whom underwent a training programme lasting two weeks. The assessment of aroma intensity (AI) was conducted using a one to five-point intensity scale, and the assessors' sniffing results were meticulously summarised and comparatively analysed. Odours that were identified by at least two assessors within the same time interval (time deviation < 0.1 min) and that bore similar olfactory descriptions were deemed to be valid. The identification of these selected compounds was achieved through a search of the NIST mass spectral library, retention index. The standards utilised are delineated in Supplementary Table S4.
Determination of non-volatile metabolites
Sample pretreatment
-
The initial step is to accurately weigh 30 mg of ground tea powder. This is then added to 1 mL of a 70% methanol solution. The mixture is then thoroughly agitated and sonicated for 20 min. Following this, the mixture is subjected to centrifugation at 4 °C, 12,000 r/min for 10 min. The resultant liquid is then diluted to the appropriate concentration and loaded onto the UPLC-QTOF MS detector. The preparation of QC samples involved the aliquoting of all samples, with the insertion of one QC sample into every 10 samples to ensure the reliability of the data through simultaneous data acquisition[32].
UPLC-QToF-MS analysis
-
The analysis was conducted using ultra-performance liquid chromatography time-of-flight mass spectrometry (UHPLC-QTOF-MS). The instrument employed was of the I-class/SYNAPTG2-Si HDMS variety (Waters, Massachusetts, USA). The main instruments and equipment are described in (Supplementary Table S5). The chromatographic conditions employed in this study included an ACQUITY HSS T3 column (2.1 mm × 100 mm, 1.8 µm) and an injection volume of 1 µL. The mobile phase was composed of 0.1% formic acid in water (phase A) and acetonitrile plus 0.1% formic acid (phase B). The precise reagents utilised in this experiment are outlined in Supplementary Table S6, while the gradient elution conditions are detailed in Supplementary Table S7. The mass spectrometry conditions, ion source: Electrospray ionisation (ESI) in negative ion mode, with a mass spectrum (MS eramp) ranging from 10−50 eV. The scanning range is from 50−1,500 Da; capillary voltage: 2.0 kV; ion source temperature: 120 °C, desolvation temperature: 450 °C, desolvation flow rate: 800 L/h; conical-well flow rate: 50 L/h, conical-well voltage: 40 V. The ion source temperature was set at 120 °C, and the desolvation temperature was set at 450 °C.
Validation of the absence of aroma recombination
-
The aroma recombination and absence test is a method by which the extent to which a combination of specific ingredients and their concentrations can reproduce or influence the overall or partial flavour of a sample may be determined. In summary, the flavour compounds are added individually to a non-flavoured matrix at their concentrations in the sample, in order to create an aroma recombination and absence model of the sample. By comparing the aroma profile and sensory intensity of the model with that of the sample, it is possible to ascertain how and to what extent the model recaptures or alters the aroma profile of the sample[33,34].
Prior to conducting recombination and omission experiments for the purpose of validation, it was necessary to undertake absolute quantification of the key differential volatiles. This was accomplished by employing the external standard method of external calibration curves and quantitative results, as illustrated in Supplementary Table S8.
Contribution of volatiles to the overall flavour of tea infusions
Detection of volatile substances in tea infusions
-
The headspace solid-phase microextraction (HS-SPME) technique was utilised for the detection of volatiles in tea infusions. Oolong tea (also referred to as beauty tea) was selected for the determination of volatiles. Two groups of tea samples of the same variety (DM) were selected for the determination of volatiles, with one group being the weak group of leafhopper-pierced honey aroma (DM-1) and the other being the obvious group of leafhopper-pierced honey aroma (DM-2). The specific method was the same as 'Analysis of volatile substances' for the determination of volatiles in tea infusions.
Aroma substances added to tea soup for sensory testing
-
Based on the following table (Supplementary Table S9), the screened volatile compounds with significant effects were individually added to beauty tea infusions prepared from non-leafhopper-pierced leaves to evaluate the effects of specific volatiles on the honey-like aroma of the tea infusion. The supplemented infusions were then compared with beauty tea exhibiting a pronounced honey aroma to examine the differences between the supplemented samples and the original tea infusion. The specific contents were referred to the GC-MS results (Supplementary Table S10). These results were subjected to an organoleptic review and QDA, respectively. The key volatile compounds were dissolved in the tea infusions at quantitative concentrations. Specifically, 100 μL or 0.1 g of the aroma substance standard was first aspirated and added to 1 mL of 1,2-propanediol, respectively, and subsequently, it was concentrated to 100 mL using ultrapure water to obtain 100 mL of master batch. Subsequently, the mother liquor was added to the oolong tea infusions (100 mL) that had not been pierced by leafhoppers, as outlined in Supplementary Table S9, in accordance with the GC-MS quantification results. All experiments were conducted at ambient temperature, and a total of 13 evaluators (seven males and six females, aged between 22 and 45 years old).
Molecular docking analysis of key aroma actives
-
A total of six olfactory and taste receptors were obtained from the UniProt database (
www.uniprot.org ), including OR1A1, OR1G1, OR2W1, OR5M3, OR7D4, and OR8D1, in conjunction with PKD2L1, T1R1-T1R3, T1R2-T1R3, and T2R14. The following compounds were identified: linalool, phenethyl alcohol, damascenone, geraniol, and gallic acid. 8-cascorbylepigallocatechin, 3-gallate cyanidin 5-o-β-D-glucoside; 5-p-coumaroylquinic acid; epiafzelechin 3-o-gallate-(4β→6)-epigallocatechin 3-o-gallate. The three-dimensional structural model was obtained from PubChem (https://pubchem.ncbi.nlm.nih.gov ). Molecular docking was performed utilising AutoDock4 1.5.7 (Scripps Research, USA), while the visualisation and analysis were carried out by Pymol 1.0.0 (DeLano Scientific LLC, USA).Statistical analysis
-
The collation of the data was conducted using Excel 2019 (Microsoft, USA), with subsequent statistical analysis undertaken using IBM SPSS 26.0 (IBM, New York, USA). The analysis of the electronic tongue data was performed using TSS TasteAnalysis v1.0 (Insent, Fukuoka, Japan). MassLynx (Waters, Massachusetts, USA) was used for UPLC-QToF-MS data acquisition; Progenesis QI (Waters, Massachusetts, USA) was used for raw data analysis using the Maiwei Cloud Platform (
https://cloud.metware.cn ) for multivariate statistical analysis. The plotting was facilitated by Hiplot Pro (https://hiplot.com.cn ), TBtools, and PowerPoint 2019 (Microsoft, USA). For more detailed method parameters, please refer to the supplementary materials. -
The taste profile of the LD group manifests as a more mellow tea infusion taste across all tea types. This profile is characterised by reduced freshness and astringency, with heightened astringency observed in green and yellow teas, in comparison to the CK group. Among the samples, LD-G exhibited superior sweetness and mellowness, LD-Y demonstrated a sweeter and mellower profile with a honey-like taste, LD-W displayed sweetness, mellowness, and refreshment, and LD-B exhibited sweetness, refreshment, mellowness, and smoothness. In contrast, the tea infusions of the CK group are characterised by a slight astringency and refreshing sensation. CK-W is notable for its raw soya bean paste taste, while CK-B exhibits a slightly green taste. In terms of soup colour, the tea infusions of the LD group are generally darker and brighter than those of the CK group, as evidenced by the fuller greenish-yellow colour of LD-G compared to CK-G, the brighter orange-yellow colour of LD-W, and the clear and bright orange-yellow colour of LD-B. With regard to aroma, the study screened seven odour attributes: floral, fresh, sweet, fruity, woody, honey, and duration. QDA analysis revealed that LD significantly enhances sweet, honey, and floral aromas and improves persistence, in comparison with CK. Conversely, the CK group exhibited a more pronounced freshness attribute, particularly CK-G and CK-B, which were significantly fresher than the LD group. The results obtained demonstrate that the leafhopper piercing treatment has the capacity to enhance the sweet, honey, and floral aromas of tea samples. (Supplementary Table S11, Fig. 2a−d).
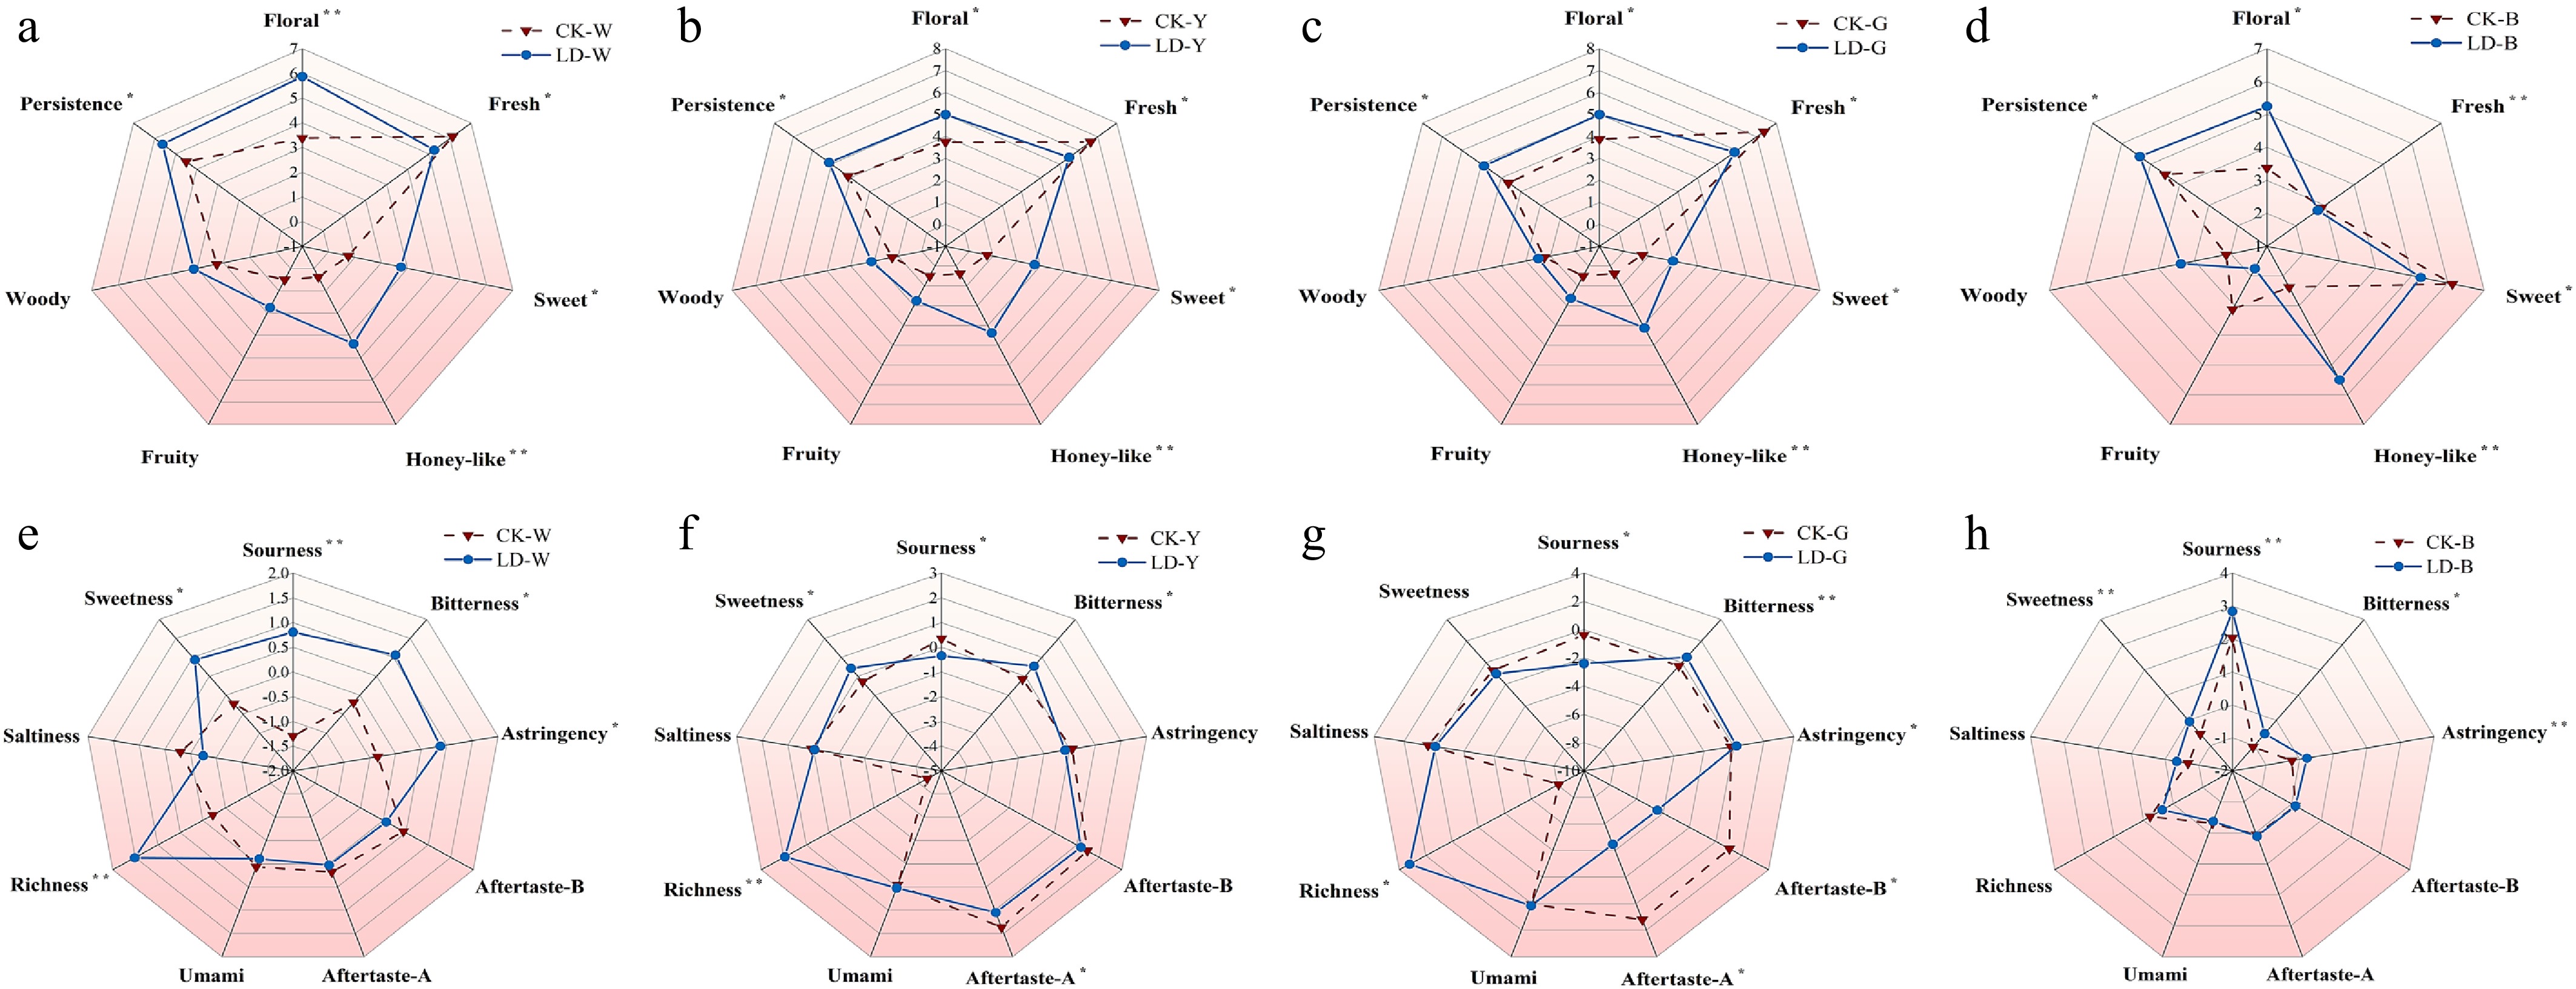
Figure 2.
Radar map of sensory properties of four types of tea. (a)−(d) Is the radar map of aroma property difference of white tea, yellow tea, green tea, and oolong tea, respectively. (e)−(h) Is the radar map of taste property difference of white tea, yellow tea, green tea, and oolong tea, respectively. * Indicates p < 0.05, ** indicates p < 0.01.
Analysis of objective quantification indicators for four types of tea
Quantification of tea infusion color by colourimeter
-
The effects of the leafhopper piercing on the colour of the four types of tea infusions show a significant difference (Supplementary Table S12). The analysis of colour difference reveals that: ΔL, Δa, Δb, and ΔE of the green tea group increase positively, indicating that the brightness, redness, yellowness, and overall colour saturation of the tea infusions increase simultaneously; the yellow tea group exhibits an increase in redness and yellowness (Δa, Δb) but a decrease in brightness (ΔL). The white tea group exhibits an increase in brightness (ΔL) accompanied by a decrease in redness and yellowness (Δa, Δb), and the beauty tea group exhibits an increase in brightness, redness, and total colour difference (ΔL, Δa, ΔE) with a decrease in yellowness (Δb). It is worth noting that, with the exception of yellow tea, the piercing generally increases the brightness of the tea infusions and the overall colour difference, which is consistent with the results of the sensory evaluation. Among them, the brightness index (ΔL) of the LD-Y sample seems to contradict the sensory evaluation of brighter broth, and it is suggested that the effect of colour contrast generated by the synergistic enhancement of redness and yellowness may be the key causal factor.
The disparities among tea types may be closely related to the processing techniques employed, with the most substantial colour change observed in beauty tea, which undergoes the most extensive fermentation. Alternatively, these variations may be attributable to its persistent enzymatic oxidation reaction. The changes in colour parameters have been shown to have a significant correlation with the transformation of flavanols, theaflavins, and other colour-presenting substances. This indicates that the piercing effect not only alters the sensory characteristics but also affects the composition of the bioactive constituents of tea through the regulation of secondary metabolites.
Quantification of tea flavour by electronic tongue
-
Relative to non-leafhopper-pierced tea, significant differences in sourness, sweetness, bitterness, and astringency were observed in leafhopper-pierced tea infusions. Among them, the leafhopper piercing significantly influenced the sourness, sweetness, bitterness, and astringency of the tea infusions. Specifically, sourness and astringency were significantly reduced, while sweetness was significantly increased by leafhopper piercing. The changes in sourness and astringency in the tea infusions of the LDs were different for different tea species, which may be related to the conversion of catechin compounds, which in turn affects the perception of bitterness (Fig. 2e-h).
Effect of leafhopper piercing on the volatiles of the four types of tea
-
In order to investigate the mechanism of the effect of the leafhopper piercing on the aroma of tea leaves, the present study was conducted to analyse the volatile components of the samples by the HS-SPME-GC-MS technique. Overall, 622 volatile compounds were identified, including 602 shared aroma components among all tea samples. with a total of 402 components. The volatile components could be classified into 15 categories (Fig. 3b), of which terpenes accounted for more than 20% in all cases, and heterocycles, esters, alcohols, and aldehydes accounted for more than 6%, reflecting the characteristics of 'Jinxuan' varieties[35]. The PCA analysis showed that the LD group and the CK group were significantly separated on the PC2 axis, and this was particularly evident for the white tea and the beauty tea (Fig. 3a). Comparison of the fractions showed that the proportion of terpenes decreased and esters and alcohols increased in the LD group; heterocycles increased and aldehydes decreased in white and oolong teas, whereas the opposite trend was observed in green and yellow teas. The results indicated that leafhopper piercing significantly altered the aroma composition of white and oolong teas, while the changes of green and yellow teas were more moderate, which might be related to the volatile reconstruction mechanism triggered by the insect pests[6,36].
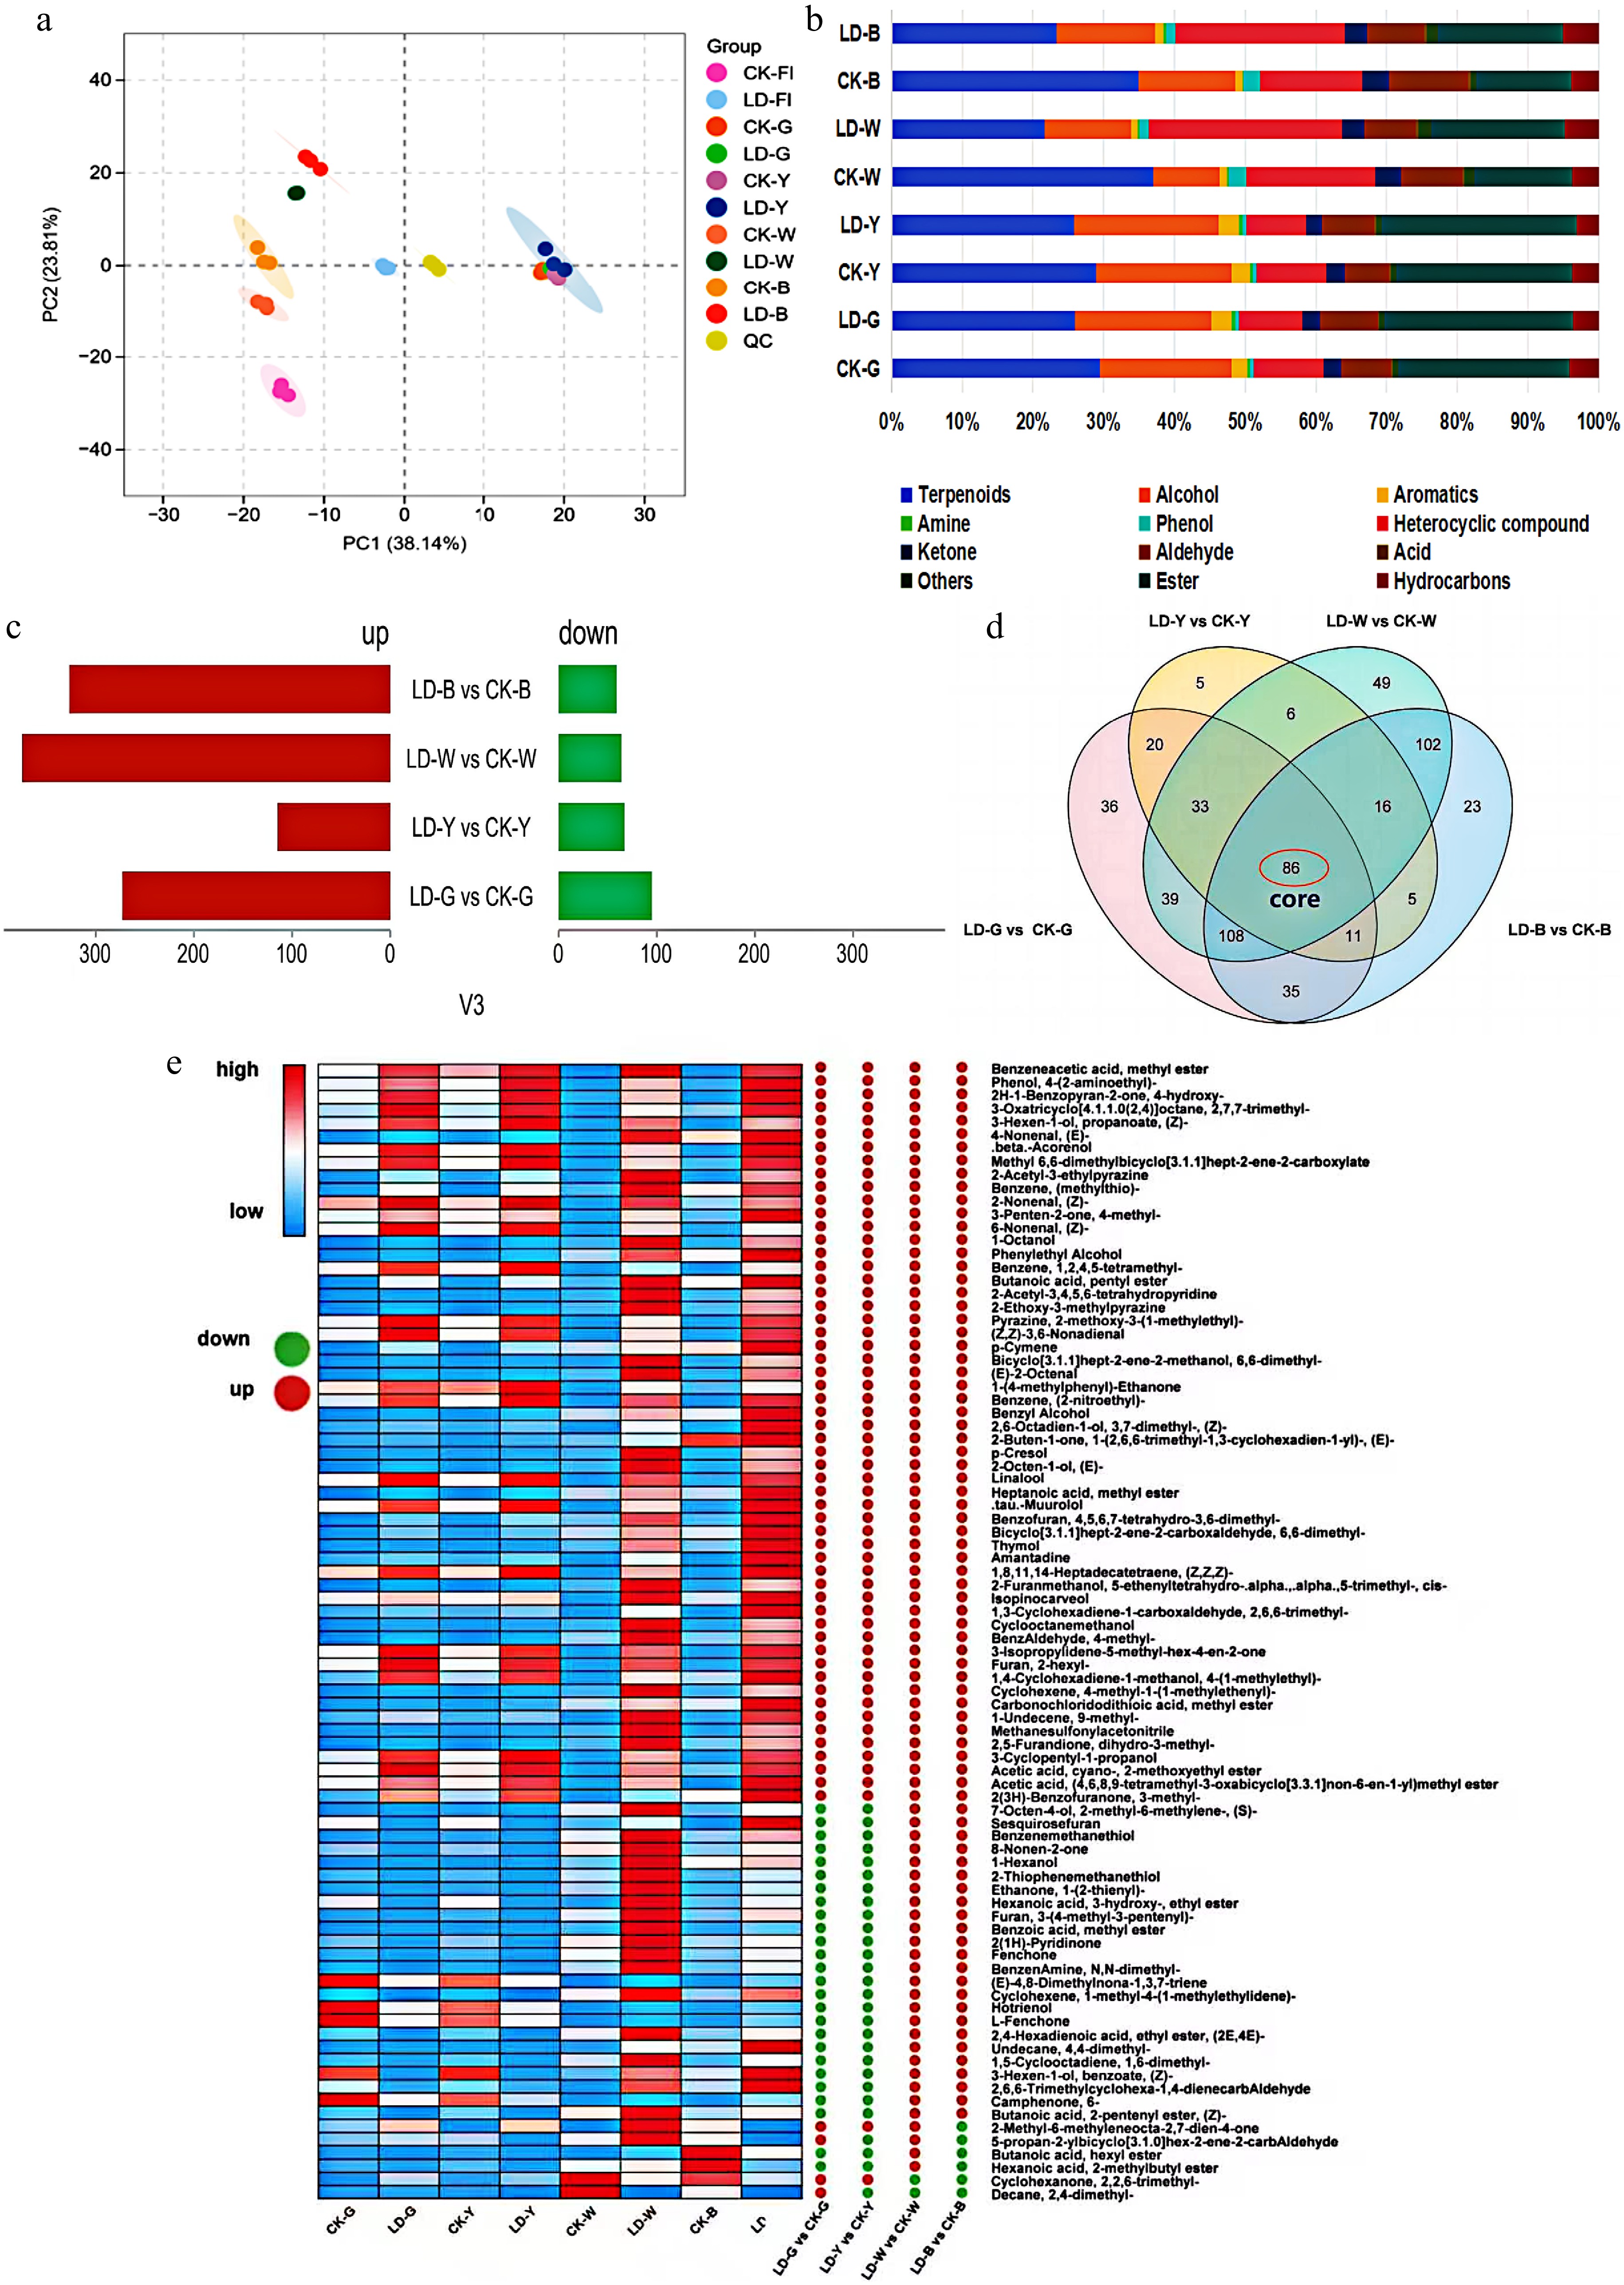
Figure 3.
Overall analysis of volatile metabolites. (a) PCA score plots of different samples. (b) Classification composition of sample volatile metabolites. (c) Differential metabolite profiles of different tea types. (d) Venn diagram of the differential metabolites across the four comparison groups. (e) Heat map of relative content of different volatile compounds in five groups of samples. The heat map shows the differences between the comparison groups, with green dots indicating a significant decrease, and red dots indicating a significant increase; the values in the heat map on the right indicate the average relative content of the volatiles in the samples (μg/g).
The observed metabolic divergence was a direct result of how different processing methods interact with the plant defense response. Leafhopper piercing triggers a targeted upregulation of the jasmonic acid (JA) and salicylic acid (SA) signaling pathways[3]. This, in turn, activates the phenylpropanoid pathway to synthesize aromatic compounds like phenethyl alcohol and upregulates glycoside hydrolase activity to release monoterpene alcohols, which are crucial for the sweet and honey-like character of LT. The significant changes in oolong tea, for example, can be attributed to its unique processing, where mechanical shaking and prolonged enzymatic oxidation act upon this rich pool of leafhopper-induced precursors. Specifically, the oxidative conditions promote the degradation of carotenoids, leading to the formation of key honey-aroma compounds like damascenone. White tea processing also involves a relatively long enzymatic oxidation process. In contrast, the high-heat fixation step in green tea and yellow tea production rapidly deactivates these enzymes, preserving a metabolic pool of the plant's initial defense response with less subsequen transformation.
Differential metabolite screening
-
To investigate the effect of leafhopper piercing on the volatile constituents of four teas, the study used OPLS-DA to analyse the volatile compounds identified in each tea. Model evaluation (Supplementary Table S13) demonstrated that the Q2 of each comparison group exceeded 0.9 and was less than 0.005 for the replacement test, thereby indicating a reliable model. The results (Fig. 3c) showed that the number of up-regulated substances was more than that of down-regulated, suggesting that leafhopper piercing significantly increased the abundance of volatiles in tea, with the highest number of differential metabolites in white tea and the lowest in yellow tea (Fig. 3d). Further analysis revealed that 86 metabolites were common differential metabolites in all comparison groups. Heat map analysis (Fig. 3e) showed that 30 volatiles (dehydrolinalool, terpene oleoresin, perillylene, etc.) displayed divergent trends among the various types of tea, with a downward modulation primarily evident in green and yellow teas and an upward modulation observed in white and beauty teas. Furthermore, a significant up-regulation of 56 volatiles (α-pinene oxide, methyl phenylacetate, phenethyl alcohol, nerolidol, linalool, etc.) was observed in the samples infested by leafhoppers, suggesting that these compounds were affected by leafhopper piercing and were more conserved during processing. Sensory analysis indicated that the leafhopper piercing treatment significantly enhanced the tea leaves' honey-sweet and floral aroma, which may be attributable to the 56 volatiles previously referenced. In conjunction with OAV calculations, 29 compounds with reference thresholds were screened from the 56 differentials, and 21 were ultimately identified as having an OAV ≥ 1 in at least one set of samples, of which 13 exceeded the threshold in all LD. The existing literature indicates that the contribution of specific volatiles to the overall aroma is not only dependent on the concentration, but is also closely related to the odour threshold, and that volatiles with OAV > 1 typically contribute significantly[37]. Furthermore, linalool, phenethyl alcohol, and damascenone have been identified as key aroma components in tea in numerous studies[27,30,38,39]. In the present study, the levels of these substances were found to be significantly elevated in samples from leafhopper piercing, suggesting that they may be pivotal in determining the characteristic honey aroma of LD. The volatiles with OAV > 1 in this study are shown in (Supplementary Table S14).
GC-O analysis of key differential volatiles
-
It has been demonstrated that the results of the multivariate statistical analyses require further validation, on account of the possibility of interference from the presence of covariates with the process of determining correlation. GC-O is a frequently applied technique in the field of food flavour analysis. It facilitates the separation of aroma components within intricate systems and enables direct evaluation of the odour type and intensity of volatiles in samples. This approach serves to substantiate the findings derived from statistical analyses, thereby ensuring the validity of the results obtained[40]. In this study, a comprehensive analysis of the volatile compounds present in various LD was conducted. Utilizing the GC-O technique, a total of 26 human-perceivable aroma compounds were identified in all the samples. Among these, linalool, phenylacetaldehyde, phenethyl alcohol, (Z)-2-decen-1-ol, methyl salicylate, geraniol, damascenone, and α-phycocyanone were found to be clearly perceptible in all the LDs examined (Supplementary Table S15). The olfactory results showed that (Z)-2-decen-1-ol and methyl salicylate had a pungent odour, which is usually negative for aroma quality. Damascenone was the closest to honey in terms of aroma; phenethyl alcohol had a pleasantly ripe and sweet scent, linalool and geraniol had a rose-like sweet floral scent, α-phyllophenone had a sweet and cloying fruity aroma, and jasmolactone had a peachy fruity aroma similar to the smell of honey. Although some studies have suggested that phenylacetaldehyde has a honey aroma[41], in the present study, it had a pollen aroma. This may be due to the difference in concentration. In addition, compared with the control group, α-phyllanthone and phenylacetaldehyde were perceived to be weaker in LD-W, and jasmonolactone was also perceived to be weaker in LD-Y, whereas geraniol was not significantly different between the two groups, suggesting that α-phyllanthone, phenylacetaldehyde, and jasmonolactone or non-critical factors influence the special honey aroma of LD. Geraniol and linalool in tea are mainly produced via the MVA and MEP pathways, and several studies have reported that piercing induces the up-regulation of linalool synthase expression, which promotes the release of linalool from fresh tea leaves[9]. Meanwhile, linalool has also been shown to be closely related to leafhopper piercing[42,43] and has the function of repelling the leafhopper[44]. In addition, phenethyl alcohol, an aromatic compound produced from L-phenylalanine, has a production pathway that may be activated by leafhopper piercing[45]. Damascenone is chiefly synthesised through non-enzymatic cleavage of carotenoids in the processing of the subject, and its presence is undetectable in freshly harvested leaves. Its formation is impacted by both acid-catalysed hydrolysis and oxidative degradation[46]. This finding suggests that leafhopper piercing may exert a secondary influence over damascenone production by modulating carotenoid metabolism[47].
In summary, linalool, phenethyl alcohol, geraniol, and damascenone were identified as the key components affecting the quality of the special honey flavour of LD.
Effects of leafhopper piercing on four types of tea non-volatiles
Effect of leafhopper piercing on the non-volatile metabolites of the four types of tea
-
This study set out to investigate the effect of leafhopper piercing on non-volatile metabolites of multiple teas. To this end, tea samples were examined by UPLC-QTOF-MS. After removing low-abundance (< 500) and non-significantly differing signals, a total of 87 known and three unknown metabolites were identified by standard comparison and MS-FINDER database comparison (Supplementary Table S16).
PCA analysis of the data demonstrated that PC1 and PC2 contributed 50.66% and 26.81%, respectively, for a cumulative total of 77.47%, which effectively represented the overall variability. The samples were well clustered within groups, and the groups were clearly separated except that CK-G and CK-Y were clustered together, and LD-G, LD-Y, and LD-Fl were closer (Fig. 4a). Cluster analysis, based on the Bray-Curtis distance metric (Fig. 4b), indicated eight distinct cluster solutions when a distance of 5 was set. These results were found to align with those of PCA, thus suggesting that leafhopper piercing exerted a notable influence on the non-volatile metabolic profiles of fresh leaves and various types of tea. The OPLS-DA model was subsequently utilised to conduct pair-wise comparisons between leafhopper-pierced samples and control samples under each processing condition. The model evaluation parameters (Supplementary Table S17) demonstrated that the Q2 value exceeded 0.9 for all groups, with a p-value less than 0.005 for the permutation test. This indicated that the model exhibited robust predictive capability and had been well-calibrated. Using VIP ˃ 1 and p < 0.05 as screening conditions, 67 (40 up-regulated, 27 down-regulated), 52 (36 up-regulated, 16 down-regulated), 54 (35 up-regulated, 19 down-regulated), 68 (55 up-regulated, 13 down-regulated), and 67 (59 up-regulated, eight down-regulated) differential metabolites were identified in fresh leaf, green, yellow, white, and oolong teas, respectively (Fig. 4c−g). All groups had more up-regulated than down-regulated substances, indicating that leafhopper piercing significantly increased tea metabolite abundance. Construction of a Venn diagram (Fig. 4h) showed that 31 differential metabolites were present in all comparison groups, with flavanols dominating. Nineteen of the 31 common differentials (including 12 proanthocyanidins, three catechins and their derivatives, two hydrolysable tannins, one flavanol, and one triterpene saponin) were significantly upregulated in all groups, whereas theanine and its isomers, the phenolic acids, and taxifolin were all significantly down-regulated. In addition, TF-3 and theasinensin A isomer 2 were down-regulated in fresh leaves but up-regulated in finished teas, and myricetin 3-galactoside and 3′-glucoside were down-regulated in green and yellow teas and up-regulated in the other groups.
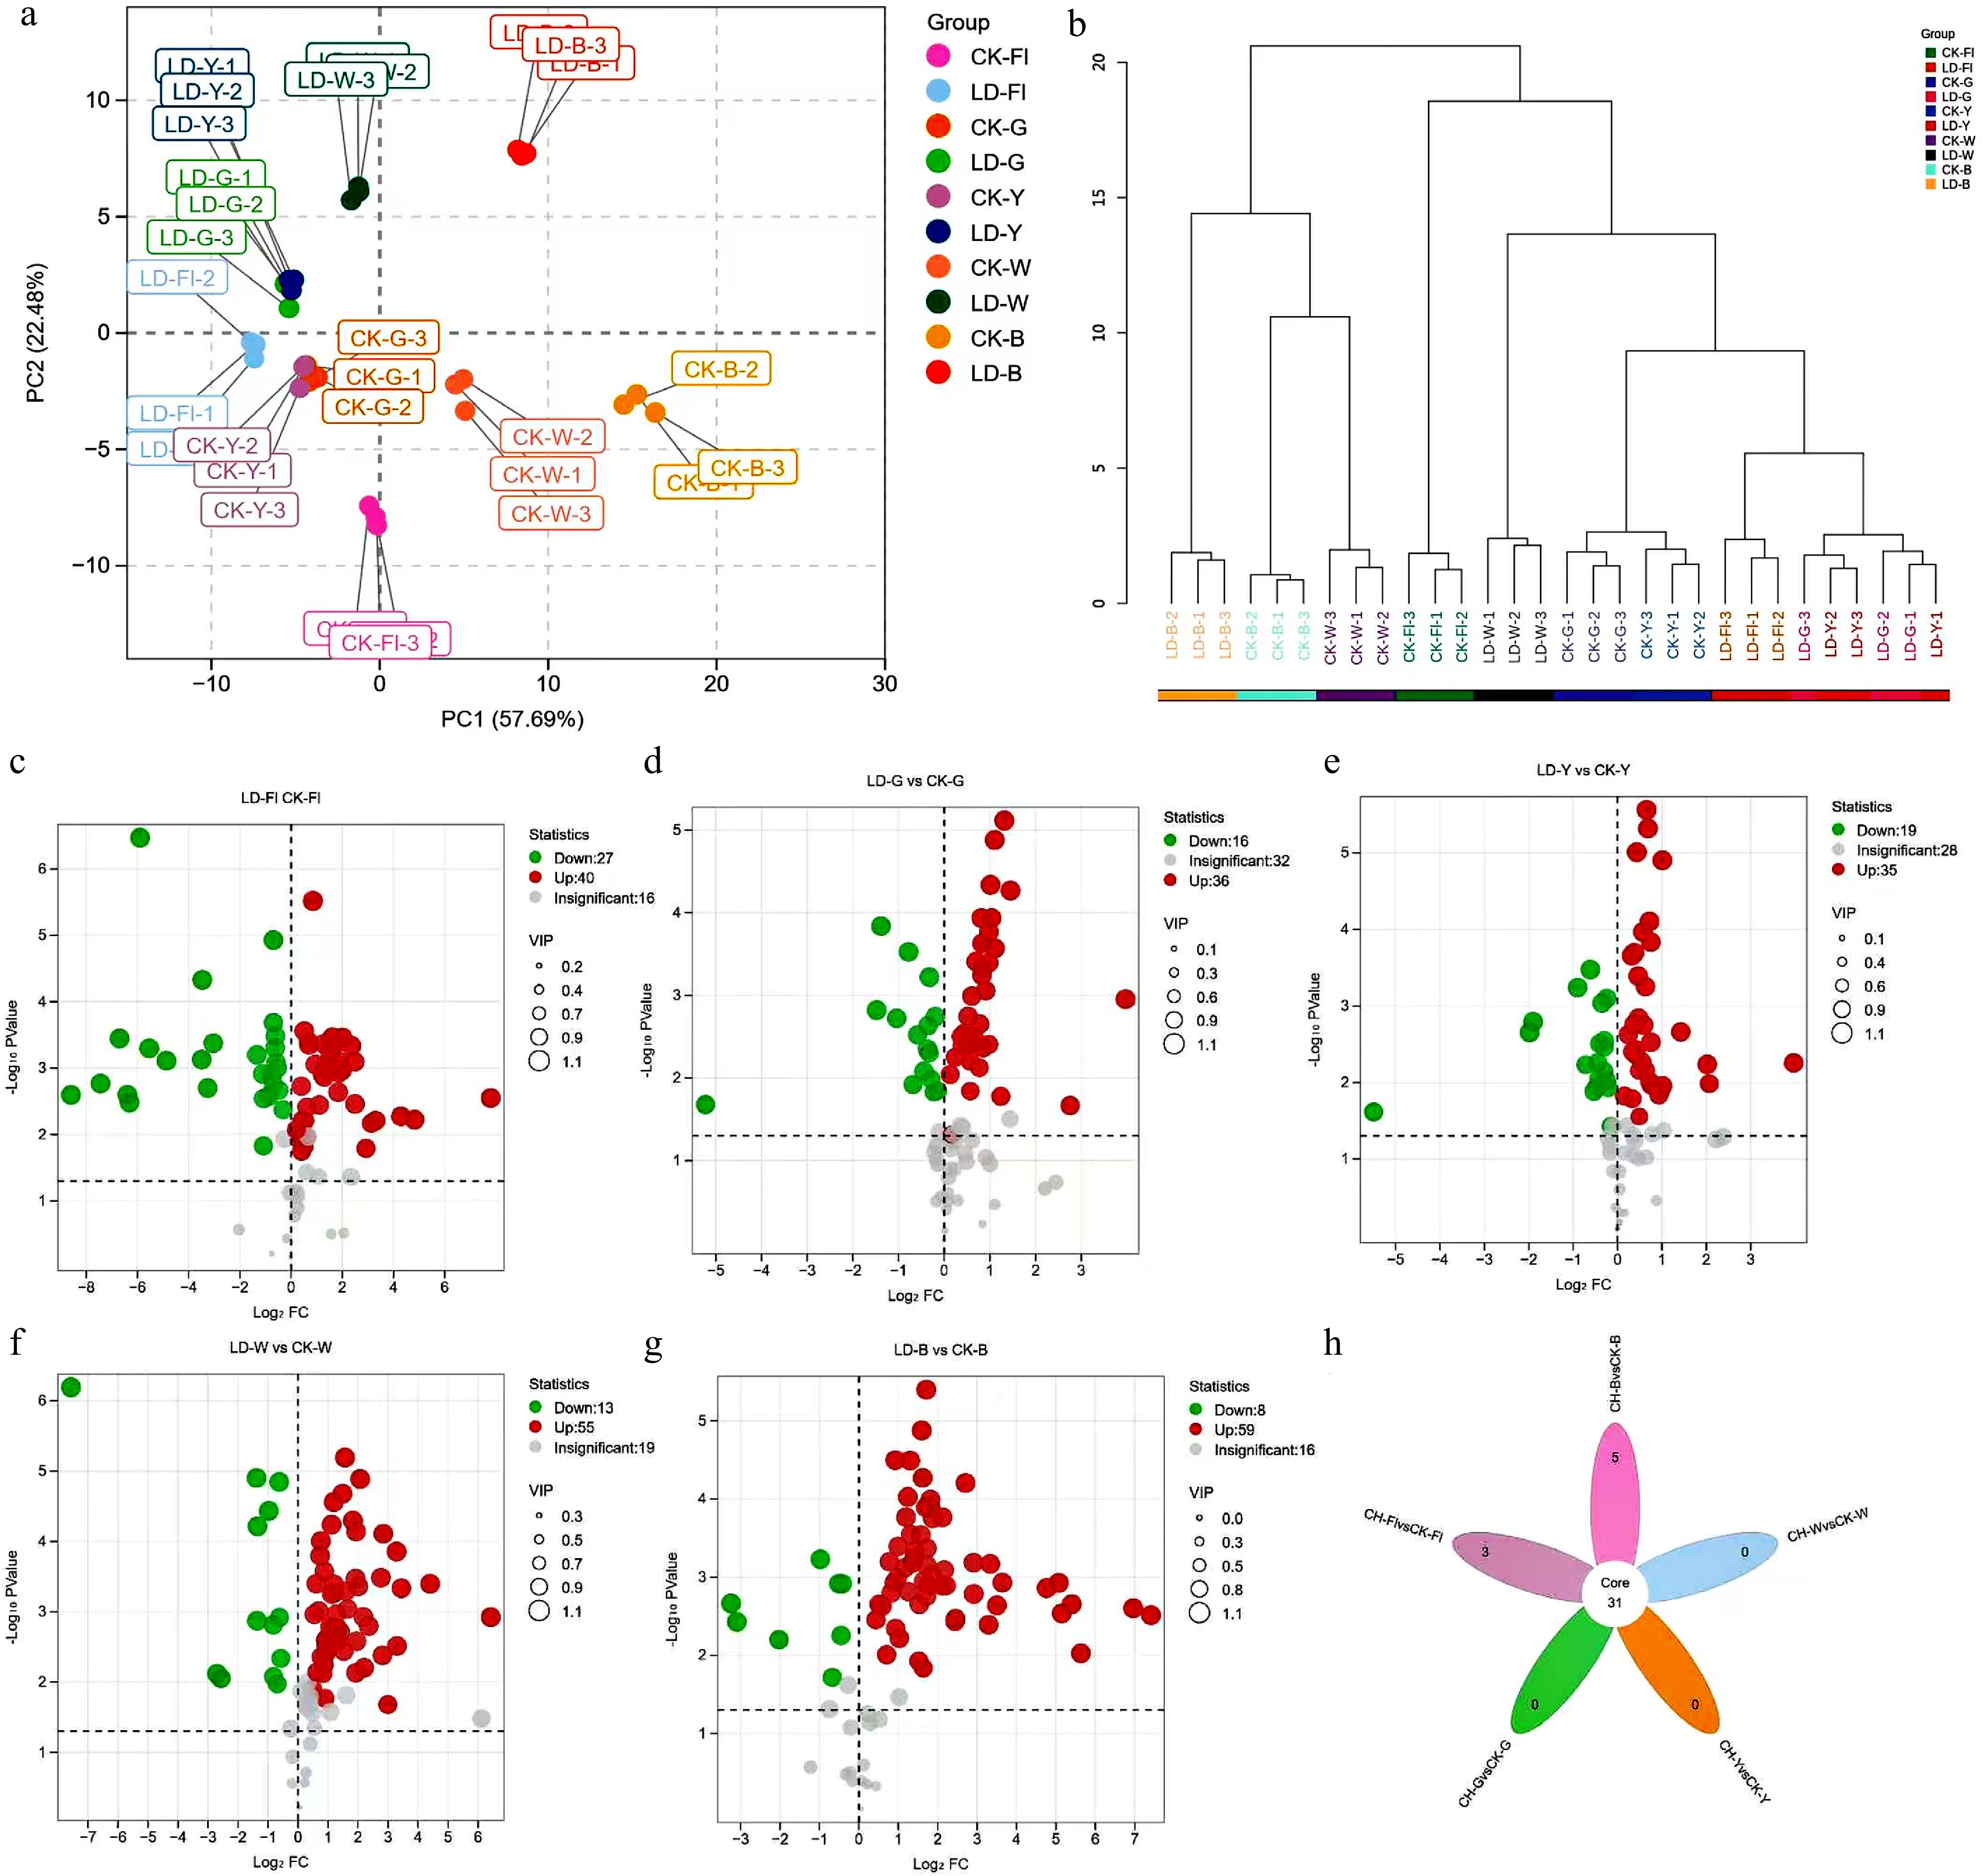
Figure 4.
Analysis of the metabolic profile of non-volatile substances between samples under different treatment. (a) PCA score plots of different samples. (b) Cluster analysis dendrogram for different treatment. (c)−(g) Cano plots for differential metabolites represent LD-Fl vs CK-Fl, LD-G vs CK-G, LD-Y vs CK-Y, LD-W vs CK-W, and LD-B vs CK-B, respectively. (h) Venn diagram of the differential metabolites across the five comparison groups.
In summary, the findings of this study demonstrated that the piercing of leafhoppers resulted in substantial alterations to the non-volatile metabolite profiles of tea leaves, thereby impacting the taste quality of teas.
Correlation analysis between the main taste-contributing compounds and the objective quantification indicators
-
To further investigate the effects of differential metabolites on tea quality, the soup colour and taste indexes measured by the colourimeter and electronic tongue were subjected to Pearson correlation analysis with differential metabolite abundance data. The screening conditions employed were |r| ≥ 0.6 and p ≤ 0.05. The results are illustrated in the correlation heatmaps (Fig. 5). The results demonstrated that a total of 78 metabolites exhibited a significant correlation with the sourness, astringency, sweetness, bitterness, and freshness of the tea infusions, as well as with one or more of the L*, a*, and b* values.
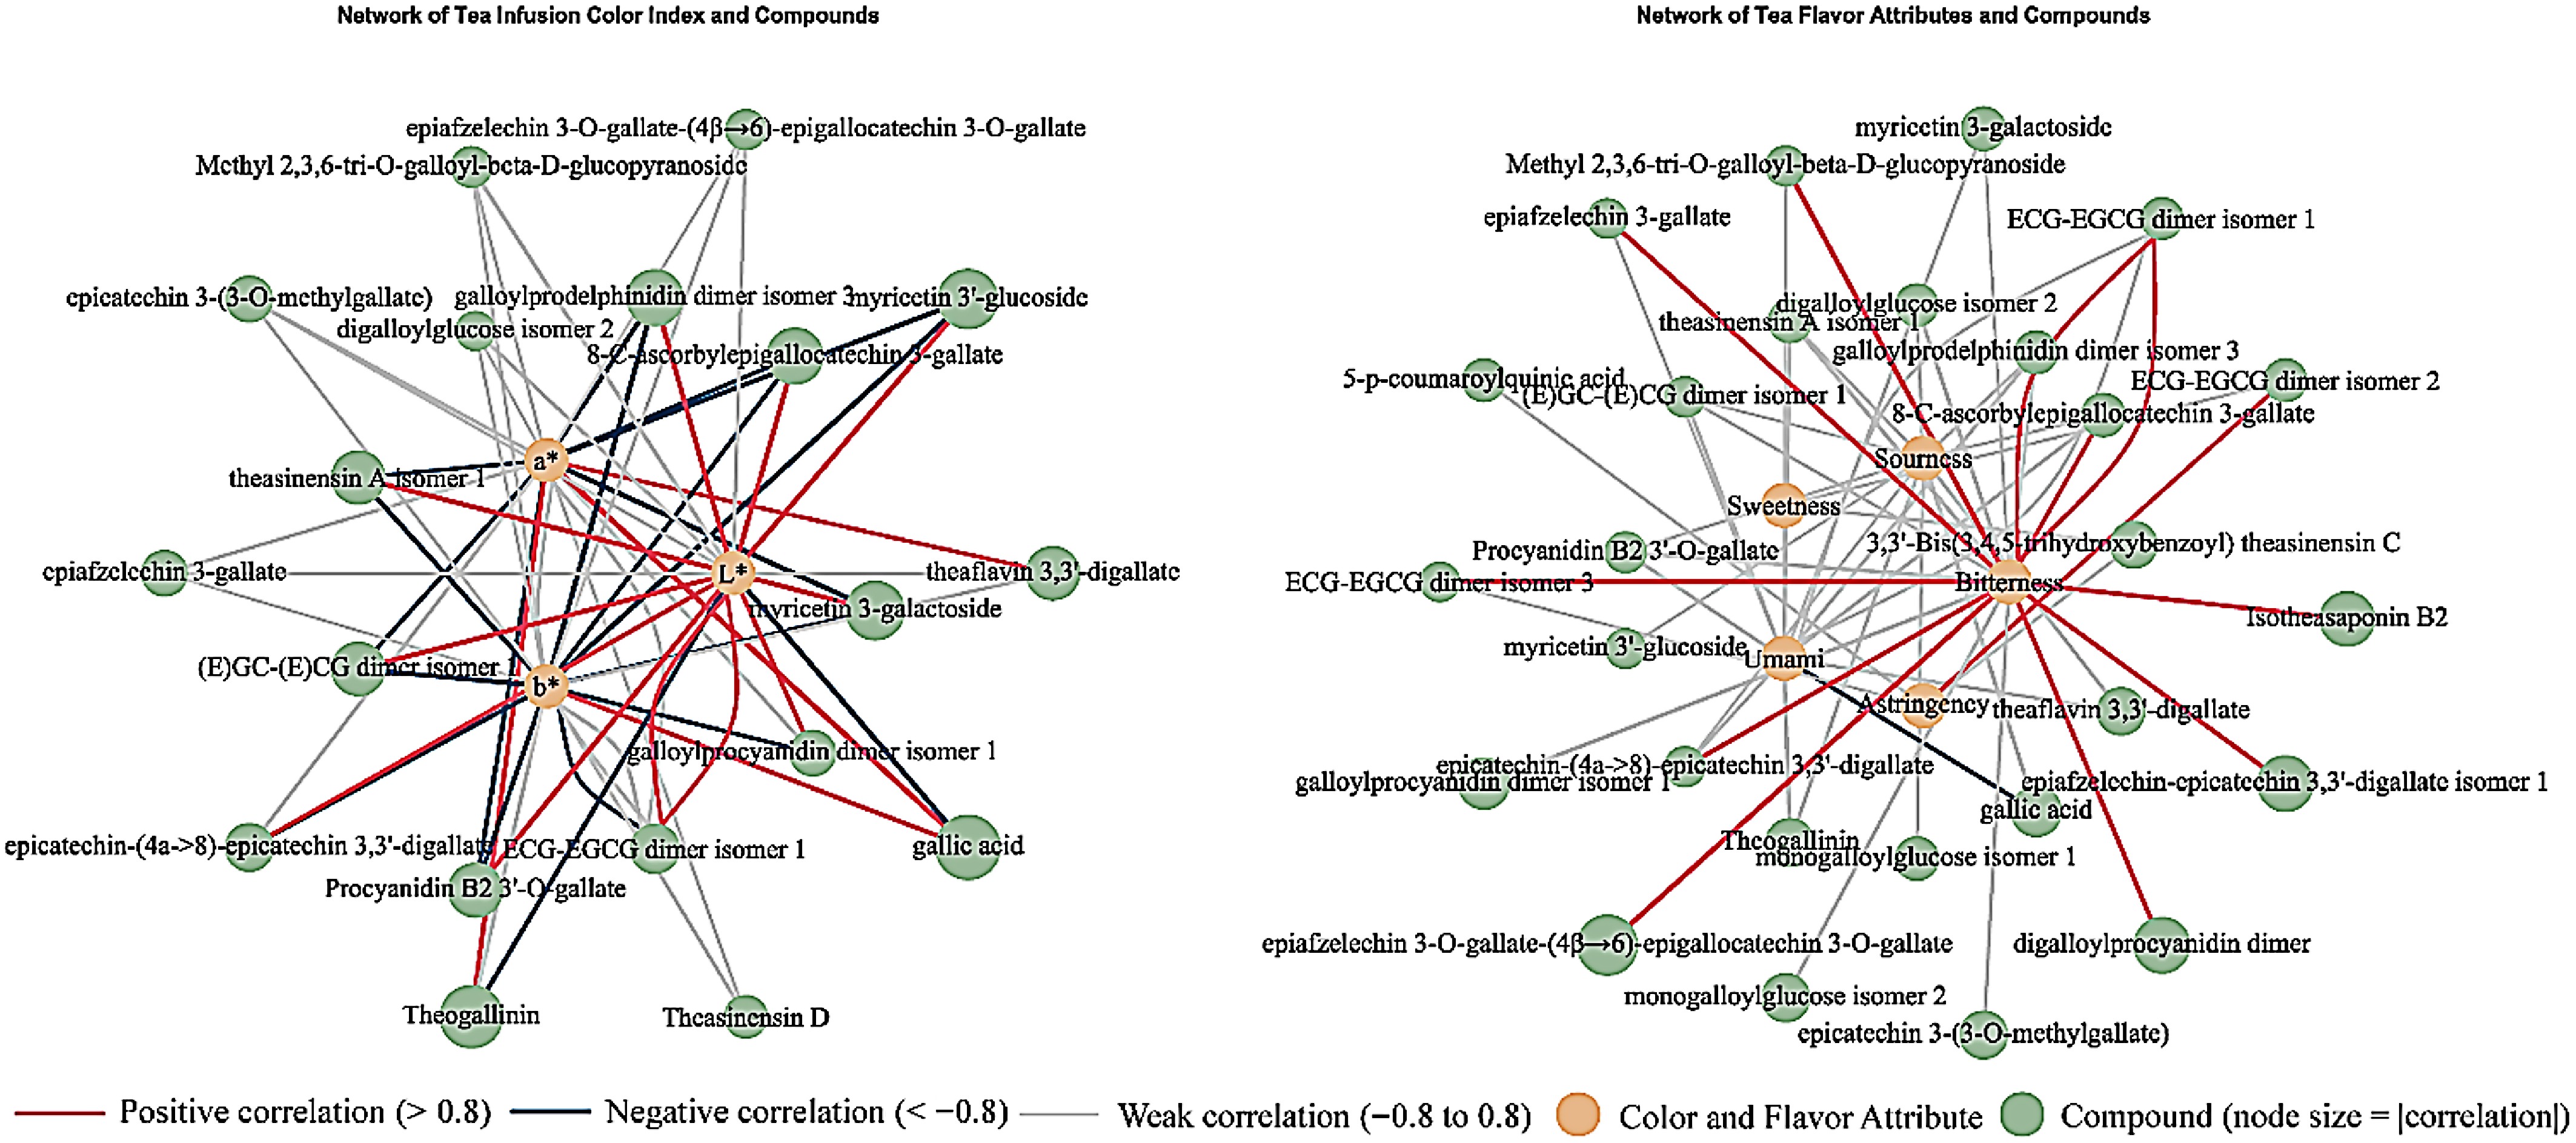
Figure 5.
Different metabolites and quality attributes of the four types of tea. (a) Color index and key metabolites. (b) Correlation network diagram between taste properties and key metabolites.
In terms of taste, 15 polyphenolic metabolites (gallic acid, ellagic acid, etc.) were found to be significantly positively correlated with sourness (highest: theaflavin, r = 0.79), while conversely, 24 mainly catechins and their derivatives were found to be significantly negatively correlated with sourness (highest: 8-c-gallocatechin 3-gallate, r = 0.66). A total of three metabolites were found to be positively correlated with sweetness, while 5-p-coumaroylquinic acid exhibited a significant negative correlation with sweetness. According to the study[48], quinic acid esters are major contributors to astringency and bitterness in tea and coffee. Therefore, the lower content of 5-p-coumaroylquinic acid in the LD group likely reduced the interference of bitterness/astringency, thereby enhancing the overall perception of sweetness derived from sugars and amino acids. Furthermore, 38 metabolites demonstrated a positive correlation with bitterness, with epiafzeleldin 3-o-gallate-(4β→6)-epigallocateldin 3-o-gallate and ECG-EGCG dimer isomer 3 exhibiting correlations exceeding 0.9. Conversely, only ellagic acid exhibited a negative correlation with bitterness. 12 metabolites were found to be significantly positively correlated with astringency (highest: theacitrin A isomer 1, r = 0.81), and approximately half of them were also positively correlated with bitterness. In addition, 35 metabolites demonstrated a positive correlation with freshness, predominantly comprising 13 proanthocyanidins and ten catechins. Conversely, 11 metabolites (theasinensin A, theasinensin F, ellagic acid, etc.) exhibited a negative correlation with freshness (highest: theaflagallin, r = −0.817).
In relation to the colour of the soup, 48 metabolites demonstrated a positive correlation with L* (primarily 17 proanthocyanidins and 12 catechins), while nine metabolites (including two theaflavins) exhibited a negative correlation with L*. Furthermore, 13 metabolites demonstrated a positive correlation with a*, with the highest correlation observed for gallic acid. In contrast, 39 metabolites exhibited a negative correlation with a*, while 16 metabolites displayed a positive correlation with b*, predominantly bisflavanols and theaflavins. Finally, 45 metabolites demonstrated a negative correlation with b*.
Further construction of the correlation network of shared differential metabolites with sensory attributes demonstrated that, with the exception of taxifolin, theanine isomer, theanine, and 3-/4-p-coumaroylquinic acid, which were not significantly correlated, the remaining 26 shared differential metabolites were significantly correlated with one to six sensory attributes. For instance, 5-p-coumaroylquinic acid demonstrated a significant negative correlation with astringency (r = –0.65), while ECG-EGCG dimer isomer 3/4 exhibited a predominantly positive correlation with astringency. Theaflavin 3,3′-digallate, monogalloylglucose isomer 1 and gallic acid exhibited a positive association with sourness, a* and b*, and a negative association with L* and freshness. The majority of proanthocyanidins and catechins exhibited a positive correlation with the bitterness, freshness, and brightness (L*) of the tea infusions, while demonstrating a negative correlation with the sourness and colour parameters a* and b*. Conversely, biflavanols and theaflavins exhibited the opposite trend. These results suggest that there may be a mutual inhibition or balance between bitterness, freshness, and sourness taste and colour indicators of the tea infusions. Further research is required in this area to determine whether the levels of key metabolites can be regulated to meet the different consumer demands.
Molecular docking test
Molecular docking analysis of the key aroma actives
-
Damascenone, linalool, and phenethyl alcohol were identified as the common key differential honey aroma components associated with leafhopper piercing, white, and yellow teas. Geraniol, conversely, was found to be non-significantly different but higher in beauty teas and showed a sweet floral aroma. As demonstrated in Fig. 6, the four aroma components and the six different receptors exhibited low binding energies, with energy values ranging from −6.96 to −4.26 kcal/mol.
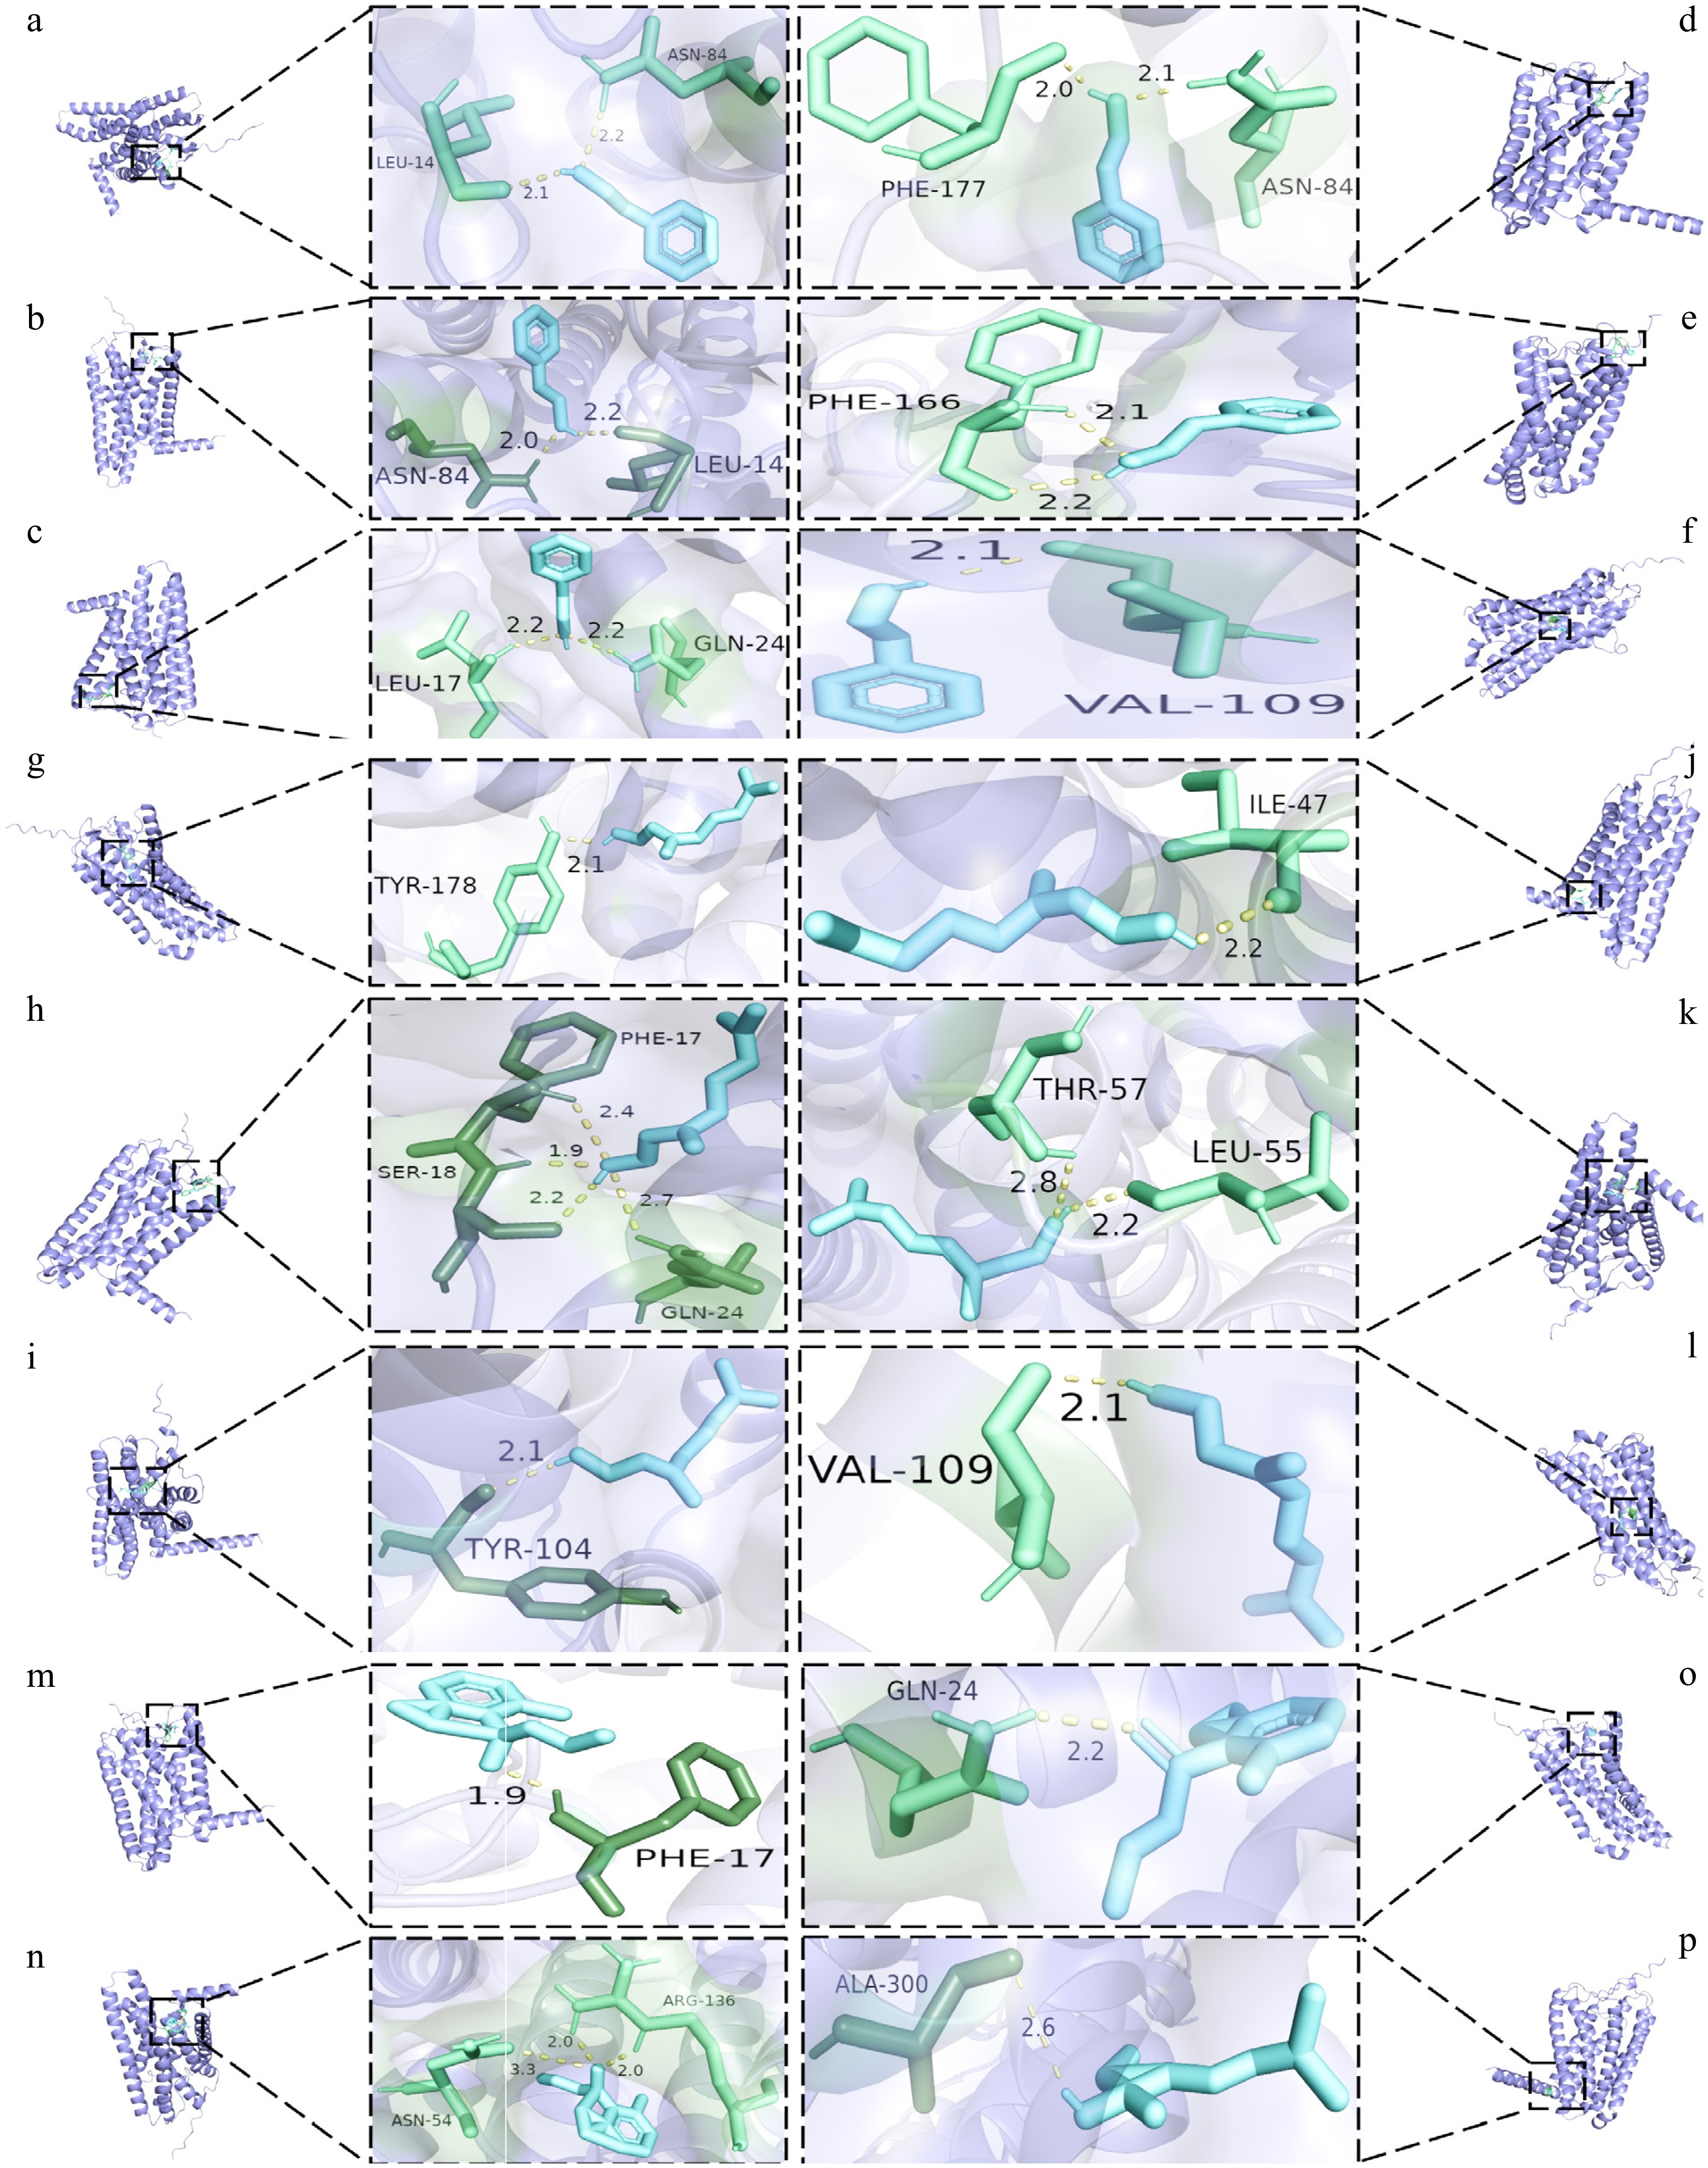
Figure 6.
Docking diagram of key aroma substances with olfactory receptor molecules. (a)−(f) The resultant maps of phenethyl alcohol docking with OR1A1, OR1G1, OR2W1, OR5M3, OR7D4, and OR8D1 olfactory receptors in order. (g)−(l) The resultant maps of geraniol docking with OR1A1, OR1G1, OR2W1, OR5M3, OR7D4, and OR8D1 olfactory receptors in order. (m)−(o) The resultant maps of damascenone docking with OR1G1, OR5M3, OR7D4 olfactory receptor in order. (p) The resultant maps of linalool docking with OR2W1 olfactory receptor in order.
The OAV of damascenone is as high as 1,200 (Supplementary Table S14), and the binding energy is as low as −6.185 kcal/mol (Fig. 6). These values are consistent with recent reports on Keemun black tea[38] and Duyun Maojian[27]. This indicates that damascenone triggers the honey-ripe fruit aroma through OR8D1. Meanwhile, the π-π stacking interaction between phenethyl alcohol and OR1G1/2W1 (Table 1) produces a rose-honey composite aroma. This is consistent with the reported threshold reduction effect of phenethyl alcohol[41]. In the post-nasal pathway, these volatiles bind to the T1R2/T1R3 sweet taste receptors with energies of less than −8 kcal/mol (Supplementary Fig. S1a), which enhances cross-modal perception of sweetness. This finding supports the recently proposed volatile ligand-taste receptor hypothesis[49]. Notably, linalool and geraniol antagonize T2R14 at high doses. This explains the sensory phenomenon in which honey aroma enhancement is accompanied by bitter taste suppression. This phenomenon aligns with the terpenoid-bitter taste receptor competition model reported[10]. The activation of receptors by aromatic compounds is a sequential process, determined by the degree of receptor affinity. This sequential activation results in the production of characteristic aromas[50].
Table 1. Molecular docking energy of main differential compounds with taste receptors.
Taste attribute Ligand proteins Compoundsa Docking score (kcal/mol) Hydrogen bond numberb Ionic interactionc Pi-Pi stackingd Sourness PKD2L1 Gallic acid −5.7 6 2 0 8-c ascorbylepigallocatechin 3-gallate −9.2 13 0 0 Umami T1R1 8-c ascorbylepigallocatechin 3-gallate −8.3 10 2 0 T1R3 −10.2 15 1 0 T1R1 Gallic acid −6.5 8 0 0 T1R3 −6.3 7 0 0 Sweetness T1R2 Cyanidin 5-o-β-D-glucoside −9.3 5 0 0 T1R3 −10.6 10 1 1 T1R2 5-p-coumaroylquinic acid −9.5 5 2 1 T1R3 −8.1 13 2 1 Bitterness T2R14 Epiafzelechin 3-o-gallate-(4β→6)-epigallocatechin 3-o-gallate −8.2 7 1 2 Gallic acid −5.8 6 0 1 a Substances in the tea infusions that have the highest correlation between their content and the response value of the electronic tongue for a particular flavour attribute. b Hydrogen-bond between strong donor and acceptor atoms. c Interactions between pairs of oppositely charged groups. d Interactions between delocalized Pi systems. Molecular docking analysis of the key taste actives
-
In order to ascertain the accuracy of the manual and electronic sensory review of taste, the substances with the highest absolute values of correlation with the four categories of taste perception (sourness, sweetness, bitterness, and freshness) were selected for molecular docking experiments with their corresponding receptors, with a view to predicting the binding affinities. The docking results demonstrated that the majority of the complexes exhibited binding energies below –6.0 kcal/mol (Supplementary Table S18), indicating strong ligand–receptor interactions that underlie the taste alterations observed in leafhopper-pierced tea. For instance, the proanthocyanidin trimer ECG-EGCG dimer 3/4, which exhibited the highest positive correlation with astringency (r = 0.83), adopts a C4→C8 interflavan linkage that strengthens hydrophobic and hydrogen-bond networks with salivary proteins, consistent with the recent molecular-dynamics simulation[6]. Gallic acid, a type of organic acid present in tea infusions in high concentrations, is considered the signature flavour metabolite of tea infusions[51]. 8-c-ascorbylepigallocatechin 3-gallate bound PKD2L1 with –9.2 kcal/mol, suggesting competitive blockage of H+ influx and subsequent sourness reduction[52]. Cyanidin 5-o-β-D-glucoside displayed –9.3 kcal/mol affinity for T1R2/T1R3, providing a molecular basis for its direct sweetness enhancement, as corroborated by the crystal-structure study[53]. Conversely, 5-p-coumaroylquinic acid bound T1R2/T1R3 with –9.5 kcal/mol yet reduced perceived sweetness, implying allosteric inhibition—an observation paralleling the negative cooperative effect reported for chlorogenic[17]. Furthermore, the study demonstrated that this substance can also enhance the astringency and bitterness of the tea infusions of oolong tea, which is in agreement with the findings of a previous study[54].
Aroma recombination test
Results of aroma deficiency and recombination experiments
-
The results of the trials, which were not included in the study, are presented in Fig. 7. In the missing review experiment, QDA was performed, and the control was a sample of beauty tea with a honey aroma that was apparent, which was selected to form a specific missing substance by removing specific compounds. Of the four missing samples from the study, the samples of missing phenethyl alcohol and damascenone exhibited the lowest scores for the honey aroma attribute. This finding suggests that these two aroma compounds significantly influence the perception of honey aroma, thereby underscoring the substantial impact of phenethyl alcohol and damascenone on the sensory profile of beauty tea and emphasising their pivotal role in its unique honey aroma.
Further analysis of the information regarding the aroma substance revealed that, in terms of the nature of the odour, phenethyl alcohol and damascenone are responsible for the characteristic honey and sweet aroma. This finding is in close alignment with the definition of honey fragrance as outlined in the organoleptic review[55]. In relation to the contribution of flavour, the fruit honey aroma of this substance in beauty tea is predominantly attributable to the fact that upon the piercing of the leafhopper, the tea tree instigates a defensive reaction, consequently releasing a substantial quantity of volatiles to yield a distinctive and unique aroma[43]. The production of damascenone is catalysed by the subsequent processing steps, resulting in a distinctive aroma quality profile.
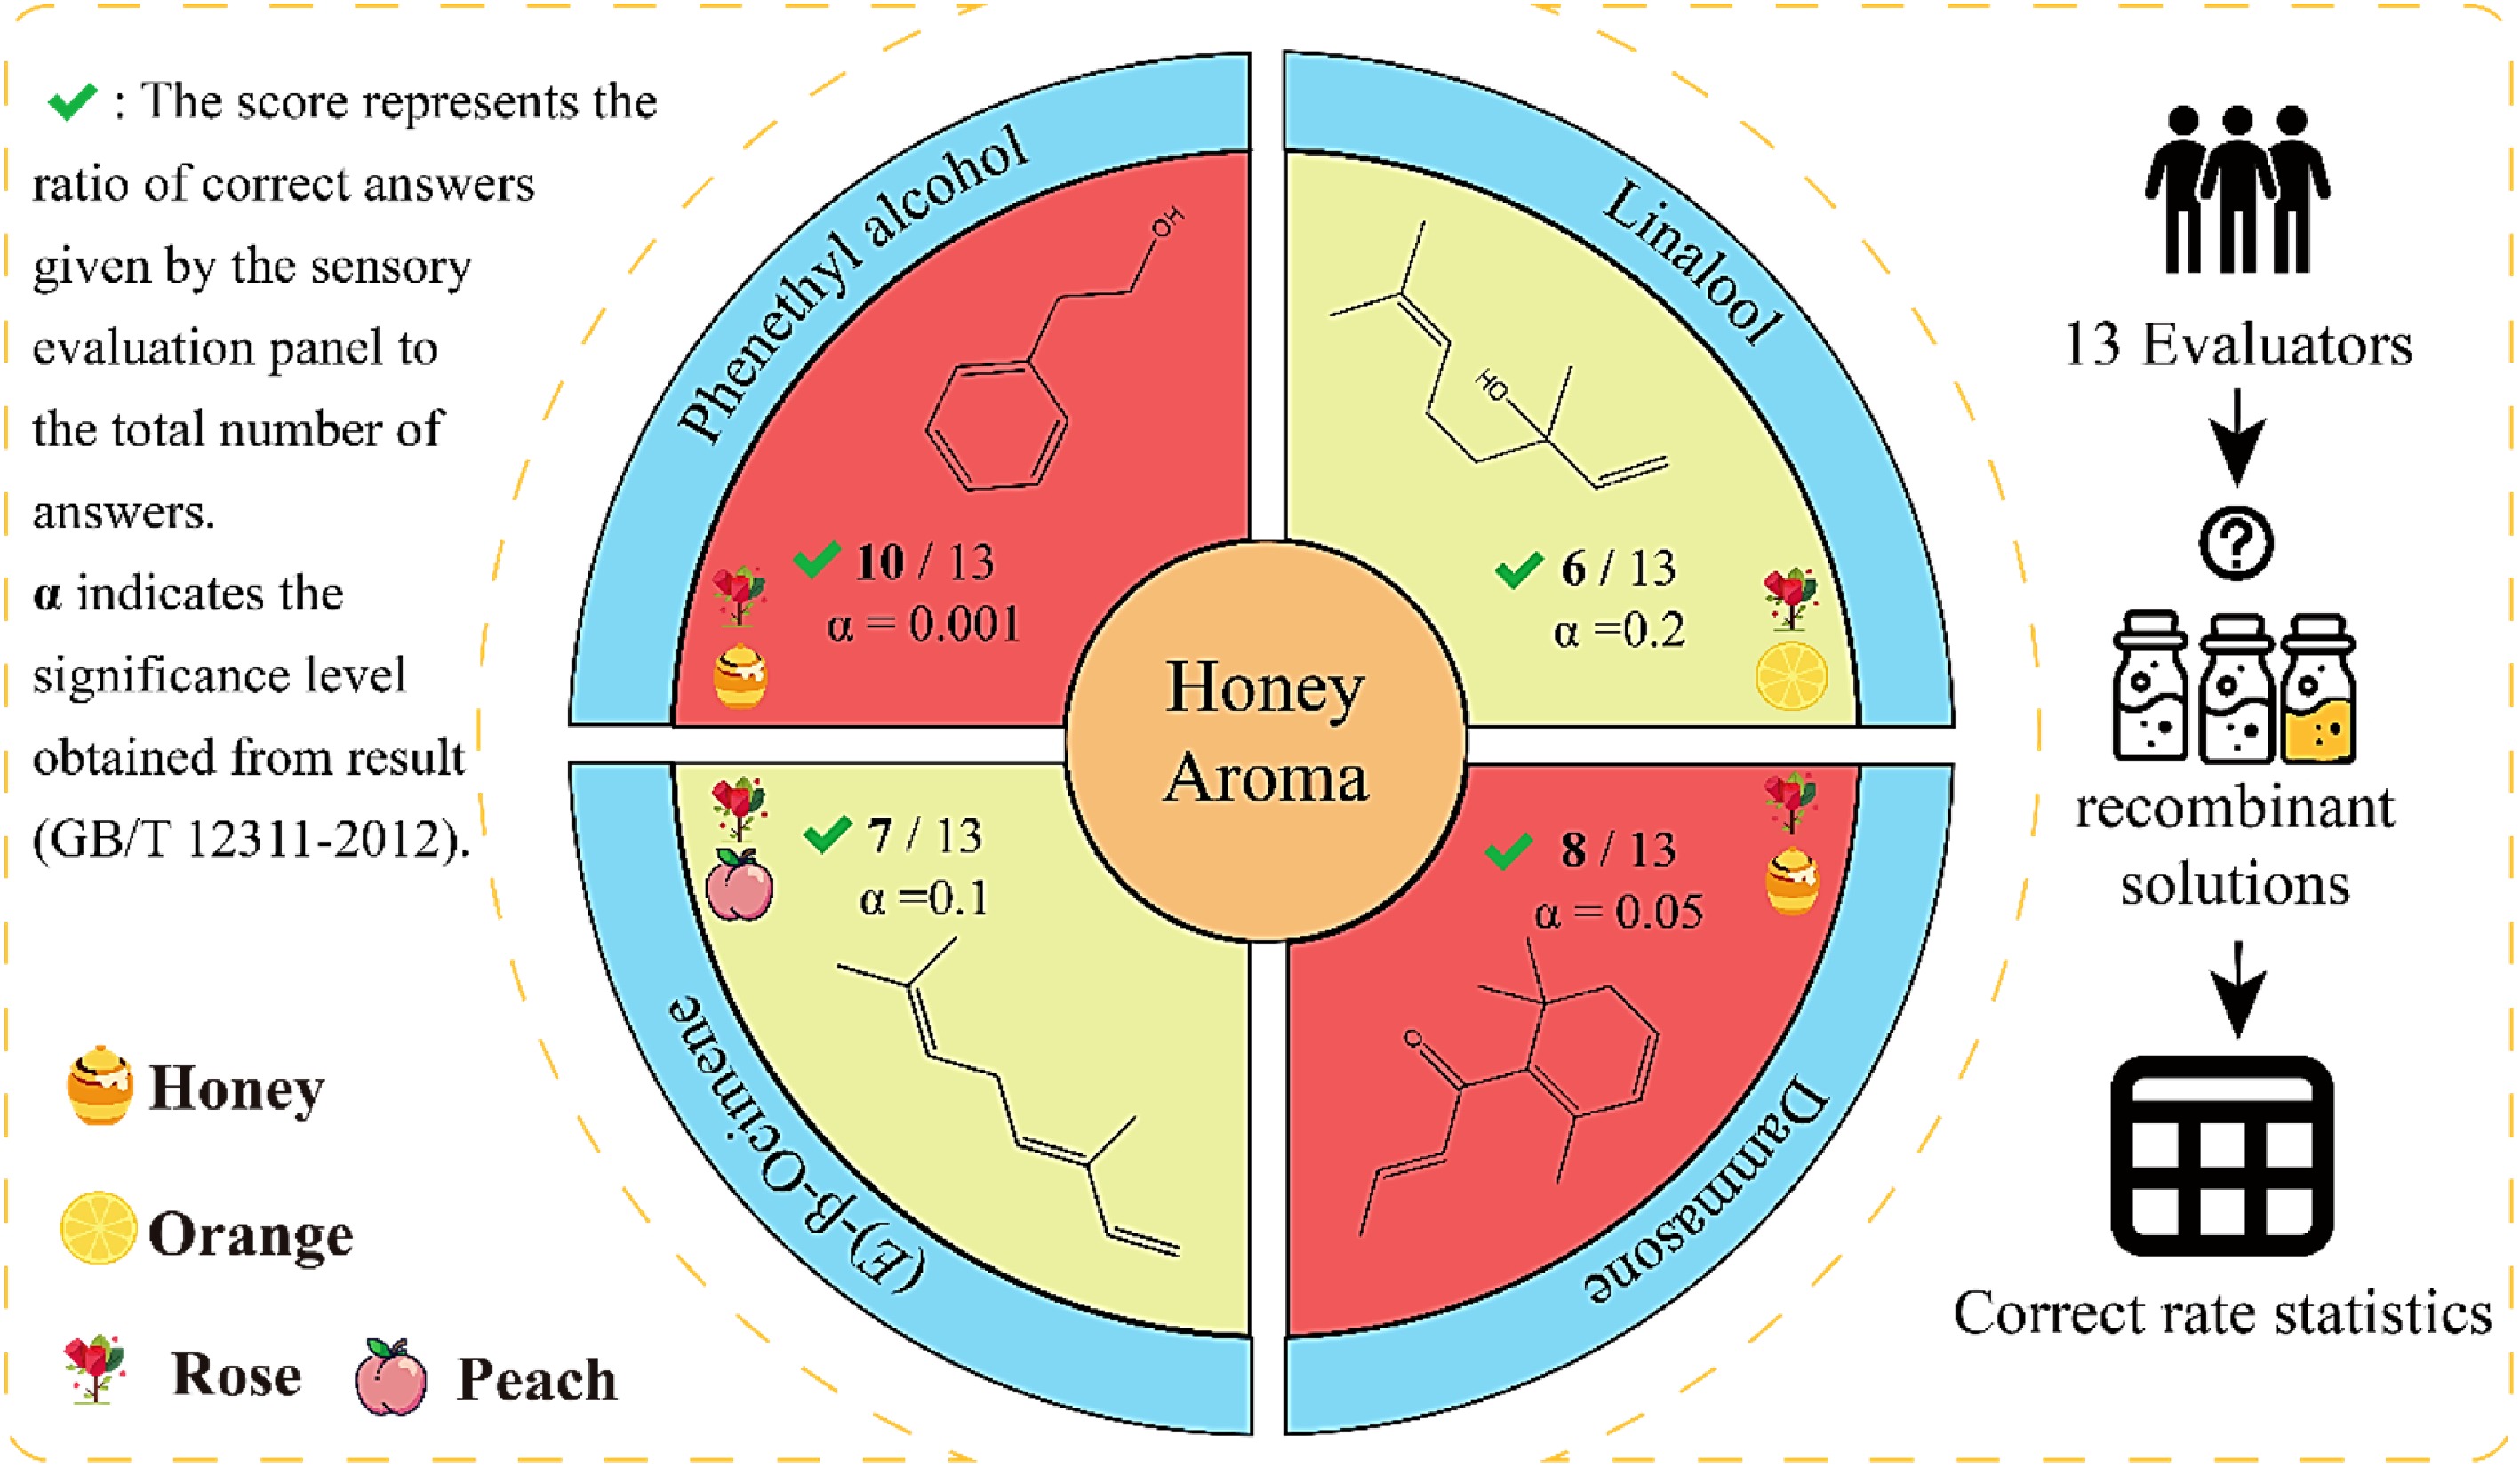
Figure 7.
Plot of the results of the experiments on the absence of key aroma components. 0.001 < α < 0.01 indicates a significant difference and 0.01 < α < 0.05 indicates a moderately significant difference[56].
The absence experiments confirmed that phenethyl alcohol is the material basis for the production of honey aroma in beauty tea. The present findings underscore the pivotal function of phenethyl alcohol in the genesis of the aroma of beauty tea, thereby suggesting its plausible capacity to serve as an indicator of alterations in flavour quality at the raw material stage of beauty tea production.
Additive–omission validation of key volatiles in LT flavor
-
Four volatiles were selected and added to water and unpierced tea infusions for sensory review of aroma and flavour. The results are documented in Supplementary Table S19.
The results of the sensory evaluation of aroma demonstrated that, in comparison with DM-2, DM-1 exhibited diminished levels of pivotal aroma constituents, culminating in a diminished intensity of floral, honey, and fresh aromas. In the additive and omission test, exogenous supplementation (linalool, phenethyl alcohol, geraniol, or damascenone) can be targeted to regulate the floral, sweet, and honey aroma of the tea infusions, and improve the concentration and crispness at the same time, resulting in a more harmonised tea infusion flavour. The results showed that the addition of phenethyl alcohol and damascenone enhanced the honey aroma of the tea infusions, while linalool enhanced the floral aroma, and geraniol enhanced the freshness of the tea infusions' aroma. The results of the sensory evaluation of the taste showed that compared with DM-2, DM-1 had lower sourness, sweetness, and freshness, which also indicated that the leafhopper piercing enhanced the richness of the tea infusions[6]. In the additive and omission test, the flavour profile of the mixture was found to approach, and in some cases even exceed, that of the piercing treatment in terms of sweetness, floral and fruity aromas, and freshness. This was achieved through the incorporation of linalool, phenethyl alcohol, and damascenone. However, sourness and astringency could not be restored, and the direction of change in freshness was different from that of the pricking treatment, which indicates that the flavour changes produced during piercing do not depend only on volatiles, but involve changes in non-volatile metabolites such as organic acids, catechins, and theanine.
Verification test of honey aroma in infusion of leafhopper-pierced tea
-
The molecular docking results (Supplementary Fig. S1a) demonstrated that the aroma substances exhibited high binding energies to the four types of taste receptors, namely, sourness, sweetness, bitterness, and freshness, thereby suggesting the existence of some binding phenomena. Phenethyl alcohol exhibited a stronger binding affinity for sweet taste receptors, while damascenone demonstrated a higher binding capacity to fresh, sweet, and bitter taste receptors. Geraniol, conversely, was predominantly bound to sweet and bitter taste receptors. However, research has indicated that the binding energy of specific sweet substances may be inversely proportional to their intensity of sweetness[52]. The e-tongue results (Supplementary Fig. S1b) demonstrated that the addition of phenethyl alcohol, damascenone, and geraniol increased the sweetness of the tea infusion to varying degrees, which was consistent with the results of the sensory evaluation. Meanwhile, the study found that (E)-citral, β-myrcene, tall-ocimene, 1-nonaldehyde, citronellyl formate, citronellyl acetate, and (E)-β-farnesene enhanced citrus sweetness through molecular docking and sensory evaluation. This suggests that some of the volatiles may enhance the overall flavour of food by binding to taste receptors[48].
These findings strongly supported a unified flavor perception model where the final honey flavor was a synergistic effect of taste, orthonasal, and retronasal olfaction. Additional supporting data are also provided in Supplementary Figs S2 and S3. While non-volatiles like Cyanidin 5-o-β-D-glucoside established the basic sweetness by binding to gustatory receptors, the role of volatiles was twofold. Through retronasal olfaction, they provided the characteristic honey scent that defined the flavor profile. Crucially, our molecular docking results showed that volatiles like phenethyl alcohol and geraniol bind strongly to sweet (T1R2/T1R3) and bitter (T2R14) taste receptors, providing a direct molecular basis for cross-modal enhancement. This aligned perfectly with the emerging volatile ligand-taste receptor hypothesis. In this model, key aroma compounds did not just provide scent but also directly modulated taste perception at the receptor level, actively enhancing sweetness and suppressing bitterness to create the holistically mellow and rich flavor unique to leafhopper-pierced tea.
-
This study systematically demonstrated for the first time that leafhopper piercing significantly enhances the overall quality of four types of tea (green, yellow, white, and oolong), characterized by a pronounced honey aroma and a sweet, mellow aftertaste. Thirteen key volatile compounds, including damascenone and phenethyl alcohol, were found to interact with OR8D1 and T1R2/T1R3 receptors via dual olfactory pathways (orthonasal and retronasal perception). Additionally, 31 non-volatile differential metabolites, such as 8-C-ascorbic acid-3-gallate and chrysanthemum-5-O-β-D-glucoside, directly contribute to sour, sweet, bitter, and astringent taste perceptions, enabling synergistic enhancement of sweetness and aroma through coordination between volatile and non-volatile components. As a result, the tea infusion becomes brighter and more concentrated, with significantly reduced bitterness and astringency. This mechanism provides a chemical basis for the targeted processing of leafhopper-pierced tea. However, since the study focused exclusively on the 'Jinxuan' variety under mild leafhopper piercing conditions, further research is needed to investigate varietal, regional, and receptor-specific effects. Building on these metabolomic results, we plan to further explore the underlying formation mechanisms, including the biosynthetic pathways of key metabolites and the associated enzymatic processes. Nevertheless, these findings have potential applications in industrial tea processing.
-
Ethical approval for sensory evaluation was not required by our institution. All tea samples and reference standards were food-grade and presented at negligible concentrations to ensure safety. Before the sessions, each panelist provided written informed consent by signing the Sensory Evaluation Consent Form (Supplementary Material) after being informed of the aims and potential risks. Individual sensory scores remain confidential to protect panelist privacy, and participants retained the right to withdraw at any time without consequence.
-
The authors confirm their contributions to the paper as follows: study conception and design: Jin S, Lin J; data collection: Ma J, Xu H, Yan J, Liu Z, Yuan Y, Kong W, Ma S, Hao Z, Jia X; analysis and interpretation of results: Wen R; draft manuscript preparation: Lin J, Ma J, Wen R; resources and manuscript revision: Jin S. All authors reviewed the results and approved the final version of the manuscript.
-
The datasets generated during and/or analyzed in the current study are available from the corresponding author upon reasonable request.
-
This work was supported by the Agricultural Guiding (Key) Project of Fujian Provincial Department of Science and Technology (Grant No. 2025N0051), the Fujian Province University-Industry-Research Collaborative Innovation Project (Grant No. 2023N5013), the Open Research Fund of China Oolong Tea Industry Collaborative Innovation Center (Grant No. 2024W02), China Agriculture Research System of MOF and MARA (CARS-19), and the Science and Technology Innovation Fund of Fujian Zhang Tianfu Tea Development Foundation (Grant No. FJZTF01).
-
The authors declare that they have no conflict of interest.
-
accompanies this paper online at: https://doi.org/10.48130/bpr-0026-0007.
-
# Authors contributed equally: Jinlong Lin, Jianping Ma, Ronghui Wen
- Supplementary Table S1 References for quantitative description of air sensory properties.
- Supplementary Table S2 Information about the SA402B electronic tongue sensor.
- Supplementary Table S3 Reagents used in electronic tongue measurement.
- Supplementary Table S4 Standards Used in GC-O-MS analysis.
- Supplementary Table S5 Main instruments and equipment.
- Supplementary Table S6 Main reagents.
- Supplementary Table S7 Mobile phase conditions for UPLC.
- Supplementary Table S8 External standard curve and quantitative results.
- Supplementary Table S9 Aroma substance addition test of key differential metabolites.
- Supplementary Table S10 Volatile compounds of oolong tea with and without leafhopper infused.
- Supplementary Table S11 The sensory evaluation results of tea with different treatment.
- Supplementary Table S12 Effect of small green leafhopper sucking on the color difference of four types of tea.
- Supplementary Table S13 Overview of the OPLS-DA model for volatile compounds.
- Supplementary Table S14 The differential metabolites with OAV>1 among four types of tea.
- Supplementary Table S15 Results of GC-O analysis.
- Supplementary Table S16 Non-volatile metabolites of four types of tea.
- Supplementary Table S17 Overview of OPLS-DA models for non-volatile compounds.
- Supplementary Table S18 Molecular docking energy of main differential compounds with olfactory receptors.
- Supplementary Table S19 Sensory evaluation results (QDA) of volatile compounds addition-omission experiments.
- Supplementary Figs S1 (a) Histogram of binding force between volatiles and taste receptors contributing to honey aroma. (b) Electronic tongue validation chart with missing experimental review results.
- Supplementary Fig. S2 Hierarchical clustering dendrogram of non-volatile metabolite modules in samples.
- Supplementary Fig. S3 Heat map of differential metabolites in each comparison group.
- Copyright: © 2026 by the author(s). Published by Maximum Academic Press, Fayetteville, GA. This article is an open access article distributed under Creative Commons Attribution License (CC BY 4.0), visit https://creativecommons.org/licenses/by/4.0/.
-
About this article
Cite this article
Lin J, Ma J, Wen R, Xu H, Yan J, et al. 2026. Metabolomic and flavour analysis reveals the chemical basis of honey aroma and taste in leafhopper-pierced tea. Beverage Plant Research 6: e022 doi: 10.48130/bpr-0026-0007 

Metabolomic and flavour analysis reveals the chemical basis of honey aroma and taste in leafhopper-pierced tea
- Received: 28 November 2025
- Revised: 09 February 2026
- Accepted: 13 February 2026
- Published online: 18 June 2026
Abstract: Leafhopper-pierced tea (LT), including green, yellow, white, and oolong, was compared with non-LT. Sensory evaluation showed LT had stronger floral and honey-like aromas, smoother texture, higher sweetness, and deeper infusion color. GC-MS identified 402 volatiles, 56 significantly upregulated. Linalool, geraniol, phenethyl alcohol, and damascenone all contributed to the honey aroma, with recombination-deficiency tests specifically confirming the key roles of phenethyl alcohol and damascenone. Non-targeted metabolomics found 31 upregulated non-volatiles. Correlation analysis indicated that 8-c-Ascorbylepigallocatechin 3-gallate, epiafzelechin 3-o-gallate-(4β→6)-epigallocatechin 3-o-gallate, and gallic acid moderated sourness and bitterness, while cyanidin 5-o-β-D-glucoside enhanced sweetness, establishing the infusion's basic honey-like taste. Flavour assays, molecular docking, and E-tongue analysis demonstrated that phenethyl alcohol, damascenone, and geraniol enhanced aroma and taste through receptor interactions. These results underscore the dominant role of non-volatiles in honey flavour perception, with volatiles enhancing retronasal olfaction to define the unique honey flavour of LT.
-
Key words:
- Leafhopper-pierced tea /
- Honey flavour /
- Multiple tea types /
- Aroma-taste interaction