-
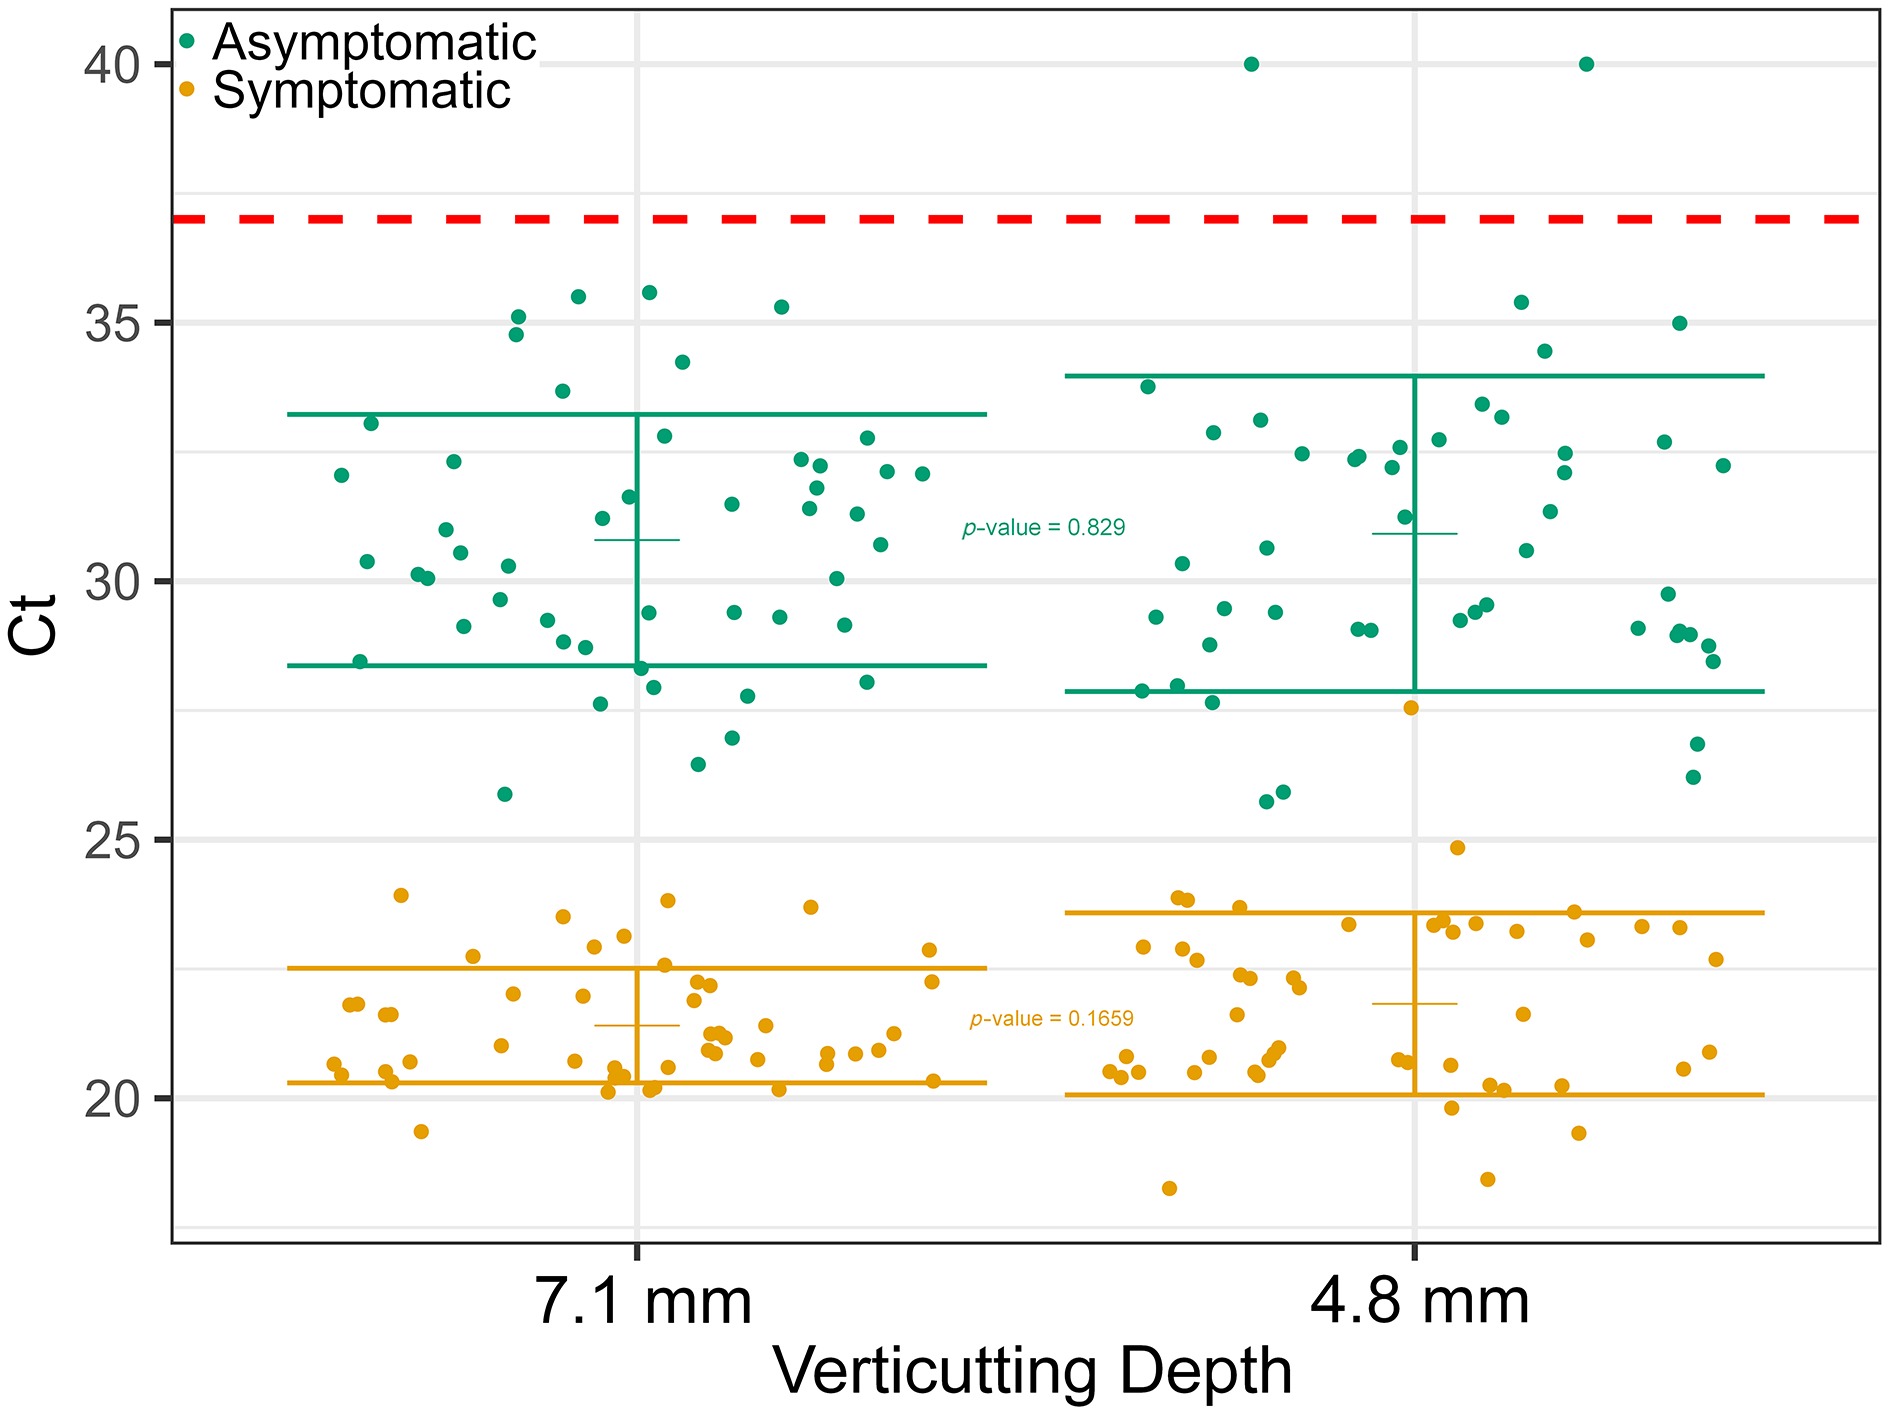
Figure 1.
Average cycle threshold values for asymptomatic (green dots) and symptomatic (orange triangles) replicated 'Crenshaw' creeping bentgrass plots vertically mown at 4.8 or 7.1 mm and sampled on 17 November 2020 in North Brunswick, NJ. In total, 48 plots were sampled: 24 plots with no dollar spot symptoms (asymptomatic) and 24 plots with visual symptoms (symptomatic) at the 4.8 and 7.1 mm vertical mowing heights. Four subsamples of ground, homogenized clippings per plot were analyzed for DNA using qPCR for a total of 192 assays. The colored cross-bars represent the standard deviation and mean. Student's t-test was used to generate p-values to compare Ct values between vertical mowing within symptomatic or asymptomatic tissues. The red dotted line is the Ct value of 37 representing the positive detection cutoff for Clarireedia spp. Ct values below 37 were considered positive detections of Clarireedia, whereas Ct values equal to and above 37 were considered negative for Clarireedia. The lower the Ct value, the higher the Clarireedia concentration.
-
Replication Vertical mowinga Coresa Compositea Lesion centers 2020 asymptomatic 'Crenshaw' creeping bentgrass 1 28.8 (0.68) 33.9 (1.14) 35.3 0 2 31.1 (0.69) 33.9 (1.27) 33.5 0 3 35.0 (0.55) 36.9 (1.21) 36.5 0 4 28.8 (1.69) 37.2 (1.64) 32.0 0 5 30.3 (0.90) 34.1 (0.44) 35.1 0 6 29.8 (1.10) 33.6 (0.65) 32.6 0 7 28.2 (2.46) 34.1 (0.29) 33.9 0 8 29.6 (0.44) 33.8 (0.54) 33.5 0 9 29.1 (1.30) 34.6 (2.39) 31.2 0 10 32.8 (0.62) 32.2 (1.04) 36.3 0 11 32.7 (1.62) 34.6 (2.44) 32.2 0 12 33.1 (1.21) 34.9 (2.60) 33.5 0 Average 30.8 (1.11) 34.5 (1.40) 33.8 (1.63) 0 2021 asymptomatic 'Independence' creeping bentgrass 1 30.77 (3.15) 34.36 (2.18) 30.59 0 2 34.21 (2.88) 34.87 (0.98) 31.94 0 3 31.57 (1.78) 36.30 (2.10) 32.28 0 4 35.54 (0.88) 35.43 (2.79) 37.43 0 5 31.71 (1.79) 34.16 (3.45) 31.96 0 6 30.76 (1.48) 38.02 (3.02) 31.18 0 7 30.00 (1.31) 32.33 (1.56) 30.04 0 8 32.21 (1.25) 33.17 (1.49) 32.93 0 9 30.01 (1.86) 34.25 (2.15) 35.56 0 10 32.49 (1.11) 33.44 (1.38) 33.73 0 11 31.47 (1.12) 33.50 (1.11) 39.38 0 12 33.15 (0.76) 33.52 (2.93) 31.93 0 Average 32.0 (1.61) 34.4 (2.10) 33.2 (2.71) 0 a Ten cores 1 cm in diameter by 2.5 cm in depth were collected randomly from within each 0.91 m × 1.52 m plot, and then clippings were collected using a Toro Greensmaster Flex 21 (The Toro Company, MN) equipped with a 12-blade verticut reel (The Toro Company, MN) set at 1.5 cm spacing and a height of 7.1 mm above the roller. Cores were cut 5 mm into the thatch layer, and the lower thatch was discarded. For the 10 cores, half of the ground and homogenized tissue was used for individual core DNA isolation (0.1 g = 1.0 g total) and the other half was pooled with half of the other cores from the same plot to make a composite sample (0.25 g). Four 0.25-g (1.0 g total) subsamples were analyzed for clippings collected by vertical mowing per plot. Values in parentheses represent the standard deviations of the subsamples. Table 1.
Average cycle threshold values and number of lesion centers per plot for asymptomatic creeping bentgrass plots sampled by three different sampling methods on 17 November 2020 (cv 'Crenshaw') and 6 May 2021 (cv 'Independence').
-
Replication Vertical mowinga Coresa Compositea Lesion centers 2020 Symptomatic 'Crenshaw' creeping bentgrass 1 22.9 (0.63) 27.3 (3.68) 20.2 204 2 21.4 (0.15) 24.5 (2.53) 20.5 200 3 20.6 (0.07) 26.7 (4.14) 22.1 184 4 20.5 (0.28) 23.1 (1.91) 19.0 164 5 20.3 (0.60) 24.3 (3.64) 20.0 148 6 20.6 (0.31) 22.6 (1.60) 18.4 140 7 20.7 (0.65) 24.1 (2.23) 20.1 96 8 20.8 (0.22) 26.7 (5.09) 20.1 88 9 21.2 (0.14) 22.5 (1.56) 19.8 79 10 22.1 (0.14) 21.9 (1.98) 18.9 75 11 22.4 (0.55) 24.1 (3.72) 20.9 67 12 23.5 (0.34) 27.0 (1.95) 23.8 57 Average 21.4 (0.34) 24.6 (2.84) 20.3 (1.40) 125 2021 Symptomatic 'Independence' creeping bentgrass 1 22.71 (0.67) 27.80 (3.03) 24.56 57 2 23.92 (0.69) 28.54 (4.15) 25.46 44 3 25.58 (0.98) 30.31 (4.56) 26.89 25 4 26.46 (0.85) 31.92 (6.17) 24.85 17 5 22.35 (0.82) 25.47 (2.84) 25.26 76 6 22.76 (0.54) 28.47 (3.99) 24.05 63 7 23.31 (2.14) 29.65 (4.06) 24.35 67 8 22.10 (0.81) 26.90 (4.61) 28.65 47 9 20.50 (0.69) 25.90 (3.19) 31.34 83 10 22.46 (0.30) 27.53 (3.89) 22.67 65 11 21.79 (0.45) 28.07 (3.70) 22.23 86 12 22.25 (0.36) 26.95 (2.43) 22.05 37 Average 23.02 (0.78) 28.13 (3.89) 25.2 (2.59) 56 a Ten cores 1 cm in diameter by 2.5 cm in depth were collected randomly from within each 0.91 m × 1.52 m plot, and then clippings were collected using a Toro Greensmaster Flex 21 (The Toro Company, MN) equipped with a 12-blade verticut reel (The Toro Company, MN) set at 1.5 cm spacing and a height of 7.1 mm above the roller. Cores were cut 5 mm into the thatch layer, and the lower thatch was discarded. For the 10 cores, half of the ground and homogenized tissue was used for individual core DNA isolation (0.1 g = 1.0 g total) and the other half was pooled with half of the other cores from the same plot to make a composite sample (0.25 g). Four 0.25-g (1.0 g total) subsamples were analyzed for clipping collected by vertical mowing per plot. Values in parentheses represent standard deviations of the subsamples. As expected, the symptomatic plots had higher pathogen concentrations (lower average Ct values) than the asymptomatic plots within each sampling method. Table 2.
Average cycle threshold values and number of lesion centers per plot for symptomatic creeping bentgrass plots sampled by three different sampling methods on 17 November 2020 (cv 'Crenshaw) and on 12 August 2021 (cv 'Independence').
-
ANOVA Degrees of freedom Sum of squares Mean square F-value Pr (> F) Asymptomatic 17 November 2020a Method 2 470.9 235.46 96.971 0* Replication 11 226.8 20.62 8.491 1.99E−11* Interaction 22 219.7 9.99 4.113 1.12E−07* Residuals 144 349.7 2.43 Symptomatic 17 November 2020a Method 2 467 233.52 29.961 1.32E−11* Replication 11 361.5 32.86 4.216 2.04E−05* Interaction 22 118.8 5.4 0.693 0.841 Residuals 144 1,122.3 7.79 Asymptomatic 6 May 2021b Method 2 209.6 104.8 20.14 1.94E−08* Replication 11 232.1 21.1 4.055 3.53E−05* Interaction 22 242.1 11 2.114 0.0047* Residuals 144 749.5 5.2 Symptomatic 12 August 2021b Method 2 920 460 33.83 9.04E−13* Replication 11 421.3 38.3 2.817 2.34E−03* Interaction 22 148.6 6.8 0.497 0.9710 Residuals 144 * Adjusted p-values were < 0.05. a Asymptomatic and symptomatic samples were collected from different but adjacent regions of the same stand of 'Crenshaw' creeping bentgrass. b Asymptomatic and symptomatic samples were collected from the same plots of 'Independence' creeping bentgrass. Table 3.
Analysis of variance (ANOVA) of the average cycle threshold values for sampling methods (vertical mowing, individual cores, and composites), replication, and interactions conducted on creeping bentgrass (Agrostis stolonifera L.) cultivars in North Brunswick, NJ, during 2020 and 2021.
-
Sampling method comparisona Asymptomaticb Symptomaticb 2020 2021 2020 2021 Cores to composite 0.2931 0.1942 4.4E−06* 0.0258* Vertical mowing to composite 1.0E−07* 0.2071 0.4508 0.1628 Vertical mowing to cores 0* 0* 0* 0* a Ten cores 1 cm in diameter by 2.5 cm depth were randomly collected from each 0.91 m × 1.52 m plot, after which clippings were collected using a Toro Greensmaster Flex 21 mower equipped with a 12-blade verticut reel (The Toro Company, MN) set 7.1 mm above the roller with blades spaced 1.5 cm apart. DNA was isolated and analyzed using qPCR from half of the ground and homogenized tissue of each individual core, a composite of the remaining tissue from the 10 cores of each plot, and the ground homogenized vertical mowing clippings from each plot. b In 2020, asymptomatic and symptomatic samples were collected from different but adjacent regions of the same stand on 17 November, whereas in 2021, asymptomatic samples were collected on 6 May and symptomatic samples on 12 August from the same plots. * Tukey's honest significant difference test, where * indicates adjusted p-values were < 0.05. Table 4.
Comparisons of average cycle threshold values for vertical mowing, individual cores, and composite sampling methods conducted on asymptomatic and symptomatic 'Crenshaw' and 'Independence' creeping bentgrass (Agrostis stolonifera L.) plots sampled during 2020 and 2021, respectively, in North Brunswick, NJ.
Figures
(1)
Tables
(4)