












-
Dollar spot, caused by six species of the Clarireedia genus, is one of the most common diseases of both cool- and warm-season turfgrasses[1−3]. Symptoms appear as a foliar blight causing small, circular, sunken spots that rarely exceed 5 cm in diameter[4]. Dollar spot epidemics typically form small clusters of infection loci that are stable through the growing season and develop in different locations from year to year[5]. The pathogen has been shown to be distributed randomly in both asymptomatic and symptomatic turfgrass swards[6].
A quantitative polymerase chain reaction (qPCR) assay developed by the authors of this paper was able to quantify Clarireedia spp. from environmental turf field core samples 7.6 cm in diameter with and without visual symptoms present[7]. The fact that this assay can quantify Clarireedia before the symptoms develop makes it a potentially useful tool to monitor the pathogen population in the field. Fairways represent the largest land area on golf courses where intensive fungicide applications are used to control diseases[8]. Developing a sampling method to accurately ascertain the concentration of Clarireedia spp. on golf course fairways before symptoms develop would aid in better timing of fungicide applications and potentially help reduce inputs.
As a sampling method for nonturf crops, the utilization of qPCR for monitoring pathogen populations in the field has been limited by the ability to collect an accurate and representative sample[9,10]. Several sampling methods were evaluated separately prior to the current study to quantify the abundance of Clarireedia spp. in creeping bentgrass (Agrostis stolonifera) maintained as fairway turf (9.5 mm) in the field[11]. The first method was a composite of cores measuring 1 cm × 2.5 cm deep. However, unexpectedly, the composite samples were often found to be biased to the core with the highest pathogen concentration; a composite sample with only one infected core and many noninfected cores had a similar pathogen concentration to the composite samples from only infected cores. A second method of quantifying the individual cores and treating them as subsamples was found to minimize the bias effect but increased labor and cost through the number of subsamples. The third method assayed clippings obtained by mowing plots that were severely infected with Clarireedia. However, at a typical fairway mowing height, the tissue collected was predominantly healthy because of the sunken nature of the infection centers, which resulted in noticeably lower pathogen concentrations. Lowering the mowing height was attempted to obtain a high percentage of infected tissue but caused visual injury (scalping) which would be unacceptable on a commercial golf course and thus considered an impractical method. One method considered but not yet evaluated was vertical mowing or verticutting, which uses several small-width blades to cut into the canopy. This method can collect clippings from the sunken lesions, samples a large area, and causes less injury than lowering the mowing height.
It was therefore apparent that evaluating the different sampling methods together was necessary. The main objective of this study was to determine a sampling method for qPCR analysis that most accurately detects and quantifies the dollar spot pathogens in asymptomatic and symptomatic plots of two susceptible creeping bentgrass cultivars maintained at 9.5 mm. The three sampling methods evaluated in this study were (1) turf cores assayed as individual subsamples, (2) composites of turf cores, and (3) tissue obtained by vertical mowing of the plots at two heights. A secondary objective was to determine if using different vertical mowing heights (4.8 and 7.1 mm bench set) would affect the Clarireedia concentrations in the foliage.
-
The study was initiated in 2020 on a 9-year-old stand of 'Crenshaw' creeping bentgrass maintained at 9.5 mm on a Nixon sandy loam (fine-loamy, mixed, semiactive, mesic Typic Hapludults) in North Brunswick, NJ (40°28' N, 74°25' W). The area was divided into two sections: An "asymptomatic" (north) and a "symptomatic" (south) section. The asymptomatic study was established as a randomized complete block design with 12 replications and blocked by two vertical mowing heights (4.8 and 7.1 mm) for a total of 24 plots. Plots were 0.91 m × 1.52 m and treated to prevent the expression of dollar spot symptoms with the following fungicides prior to the initiation of the study: chlorothalonil (Pegasus 6F) at 8.24 kg active ingredient (a.i.) per ha on 2 September 2020, fluazinam (Secure 4.17SC) at 0.80 kg a.i. per ha on 16 September 2020, and a formulated product containing mefentrifluconazole and pyraclostrobin (Navicon Intrinsic 3.34SC) at 0.541 kg a.i. per ha on 6 October 2020. The symptomatic study was established as a randomized complete block design with 12 replications and was also blocked by vertical mowing height (4.8 or 7.1 mm). Disease severity (lesion counts per plot) was measured prior to the initiation of the study and to ensure that each vertical mowing height had statistically similar levels of dollar spot within each block. Plots were 0.91 m × 1.52 m. The turf received no fungicides to suppress dollar spot disease during September, October, and November 2020.
Samples were obtained from all the plots on 17 November 2020. Ten individual cores measuring 1 cm × 2.5 cm deep were collected randomly from inside the plot area. After core collection, vertical mowing clippings were collected using a Toro Greensmaster Flex 21 (The Toro Company, MN) equipped with a 12-blade verticut reel (The Toro Company, MN) with a 1.5-cm spacing between blades and the bench setting height of the blades tips at either 4.8 or 7.1 mm (equivalent to 50% and 75%, respectively, of the 9.5-mm mowing height); thus, the 7.1 mm height resulted in the shallowest cut into the verdure. Vertical mowing clippings were collected and bagged for each plot, and the collection bucket was cleaned with an air compressor between plots.
The study was repeated in 2021 on an 8-year-old stand of 'Independence' creeping bentgrass adjacent to the 2020 study location, which was not available in 2021, and was maintained at 9.5 mm. However, Independence and Crenshaw have a similar level of dollar spot susceptibility[12]. The plots were 0.91 m × 1.52 m and established as a randomized complete block design with 12 replications on the same soil type as the earlier study. No fungicides were applied to the study area during the spring prior to the study or during the study period in 2021. The three sampling methods were the same as described for the 2020 study, except that only a vertical mowing height of 7.1 mm (75% of mowing height) was used in 2021 because this depth was less injurious to the turf and yielded similar cycle threshold (Ct) results in the 2020 study compared with the 4.8-mm height. Samples were obtained on 6 May 2021 (asymptomatic turf) and again from the same plots on 12 August 2021 (symptomatic turf). Counts of dollar spot lesion centers were recorded for each plot before each sample collection.
DNA isolation
-
Cores were cut 5 mm into the thatch layer, and the lower thatch was discarded because it has been shown to contain very low concentrations of Clarireedia compared with foliar tissue[6]. The remaining tissue of each core primarily containing foliage and stems with small amounts of crowns, senescing leaf blades, roots, and dead organic matter was then ground in liquid nitrogen with a mortar and pestle. Half of the ground and homogenized tissue was used for DNA isolation of individual cores and the other half was pooled with half of the other cores from the same plot to make a composite sample. All of the vertical mowing clippings collected from each plot, containing primarily foliage and stem tissue with small amounts of crown and root tissue, were ground with liquid nitrogen in a mortar and pestle. DNA was isolated from 0.1 g of ground tissue from each individual core, 0.25 g from the ground composite tissue, and 0.25 g of ground clippings using the DNeasy PowerSoil kit (QIAGEN, Hilden, Germany) following the manufacturer's protocol. In total, 10 individual cores weighing 0.1 g with a combined weight of 1.0 g and four 0.25-g aliquots of vertical mowing clippings were used to isolate DNA for each plot. All DNA samples were analyzed in triplicate following the qPCR protocol described in Groben et al. (2020), with a denaturing time of 5 s and an annealing time of 10 s. The qPCR assay is genus-specific to Clarireedia[7]. It has been used to identify and quantify the pathogen in several field studies[6,7] and was found to routinely amplify Clarireedia from environmental samples, with Ct values ranging between 17 (high pathogen concentration) to 40 (undetectable amounts of pathogen), and a positive detection cutoff of 37 (Ct < 37 is considered positive).
Statistical analysis
-
All statistical analyses were performed in RStudio v 2021.09.1.372 and all figures were generated using ggplot2[13−15]. The analyses used the complete block design error structure. Student's t-test was used to determine the statistical differences in the average Ct values between the two different vertical mowing heights. This model was run separately for both the asymptomatic and the symptomatic samples.
Average Ct values for the different collection methods were analyzed by analysis of variance (ANOVA) using collection method, replication, and their interaction as the factors to be modeled, with a complete block design error structure. This model was run on both the asymptomatic and symptomatic samples separately for both years, since the experimental design was not intended to compare the asymptomatic and symptomatic samples with one another. Another ANOVA model was run using only the collection method and analyzed with the post hoc honest significant difference test to determine which sampling method means were statistically different from one another for each set of samples. Only data from the 7.1-mm vertical mowing height were used in the statistical analysis of the different sampling methods, since the Ct values were similar to those from the 4.8 mm depth but the method is less injurious to the turf.
-
The average Ct values for the asymptomatic plots were 30.8 and 30.9 for plots vertically mown at 4.8 and 7.1 mm, respectively. As expected, the symptomatic plots had lower Ct values (a higher pathogen concentration), with an average of 21.4 and 21.8 for plots vertically mown at 4.8 and 7.1 mm, respectively. Vertical mowing height did not have a significant effect on the Ct values for either the asymptomatic or symptomatic plots (Fig. 1).
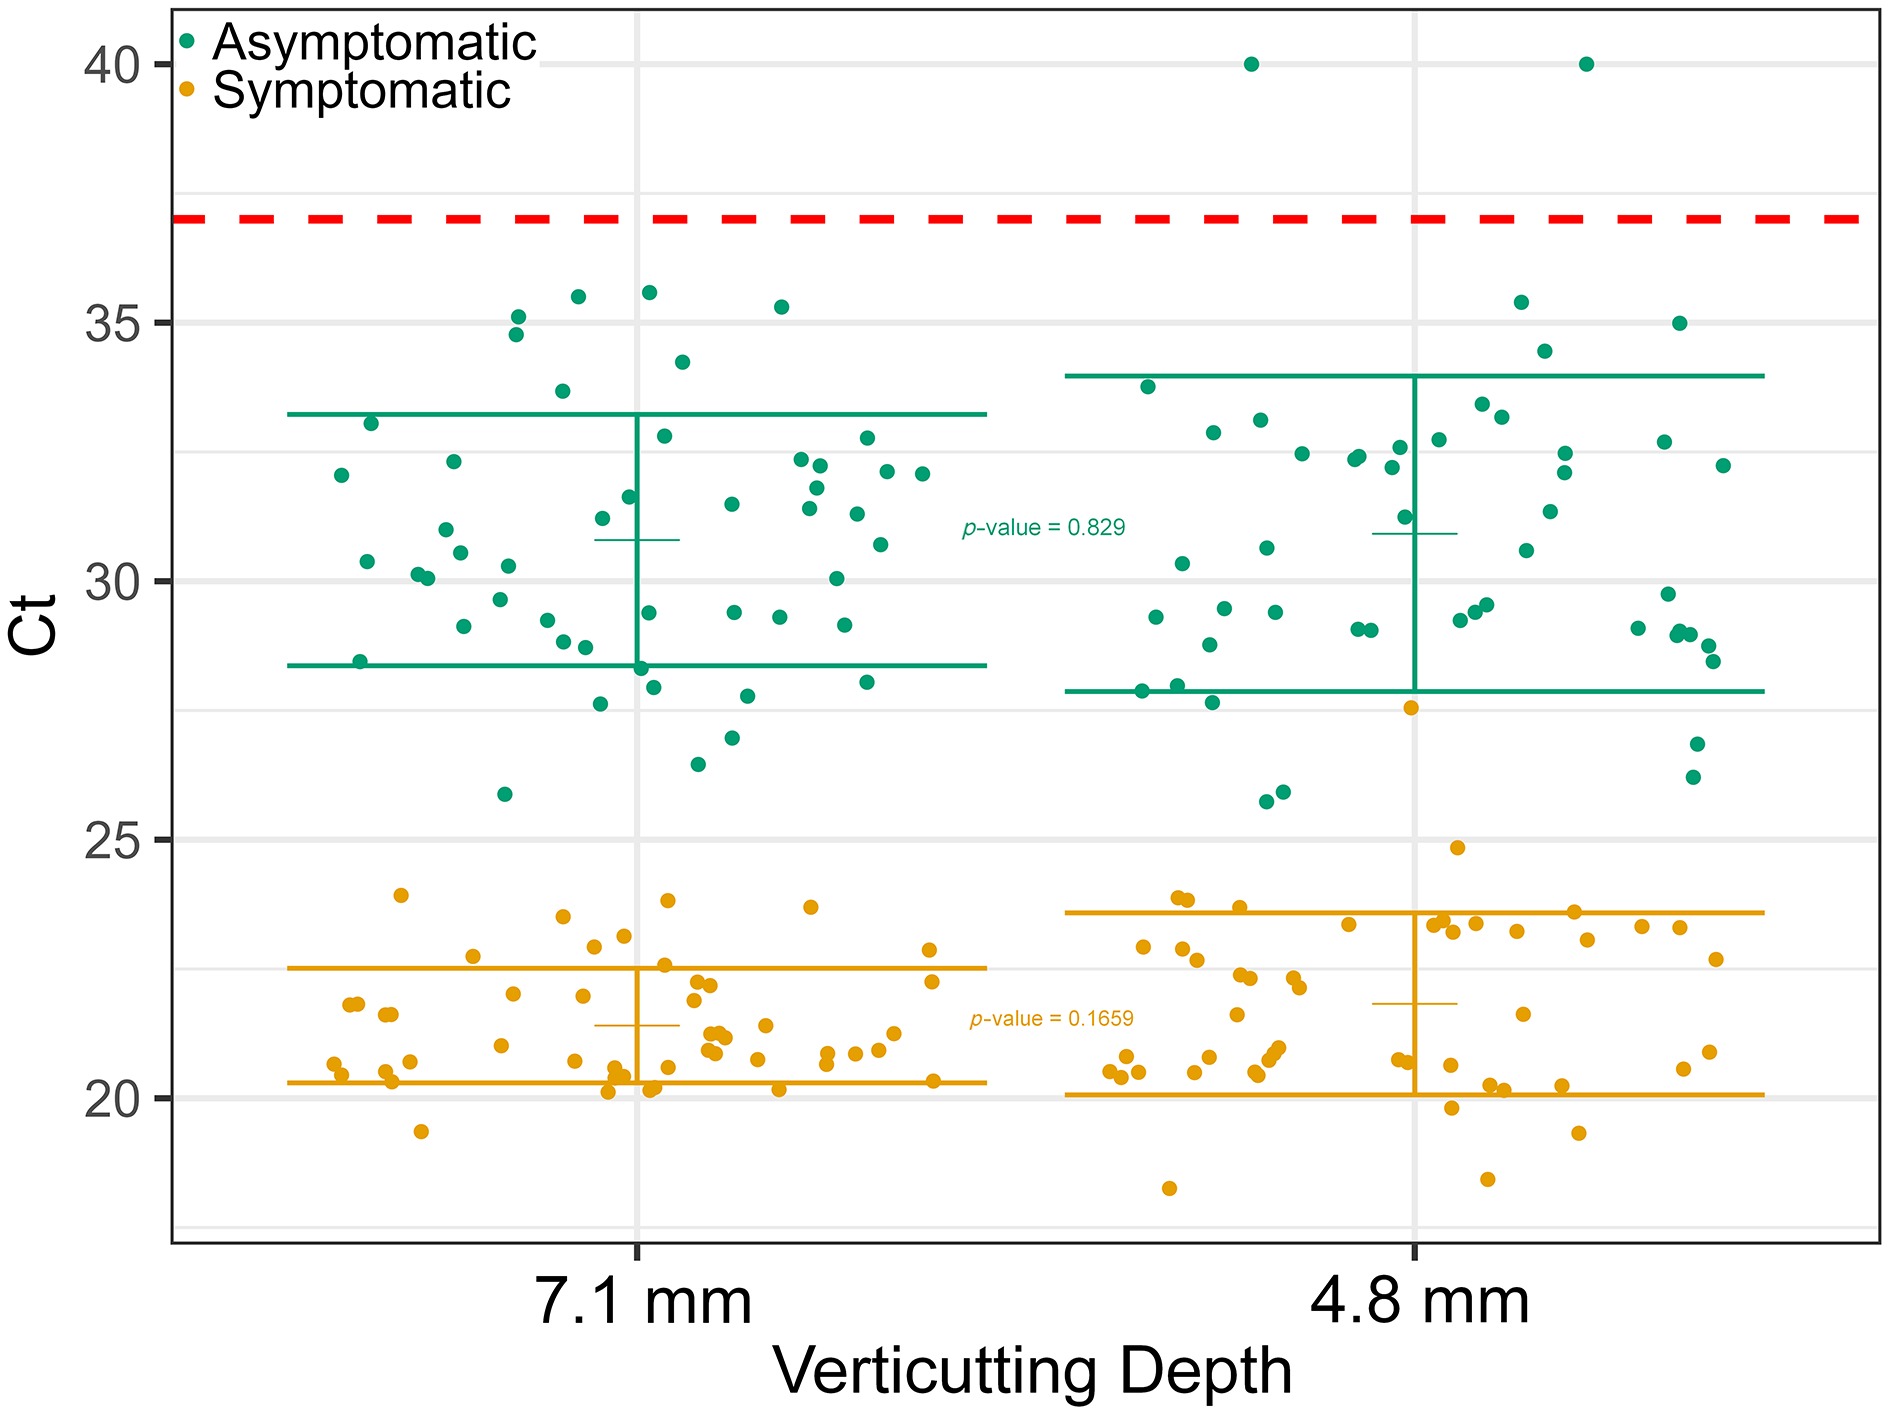
Figure 1.
Average cycle threshold values for asymptomatic (green dots) and symptomatic (orange triangles) replicated 'Crenshaw' creeping bentgrass plots vertically mown at 4.8 or 7.1 mm and sampled on 17 November 2020 in North Brunswick, NJ. In total, 48 plots were sampled: 24 plots with no dollar spot symptoms (asymptomatic) and 24 plots with visual symptoms (symptomatic) at the 4.8 and 7.1 mm vertical mowing heights. Four subsamples of ground, homogenized clippings per plot were analyzed for DNA using qPCR for a total of 192 assays. The colored cross-bars represent the standard deviation and mean. Student's t-test was used to generate p-values to compare Ct values between vertical mowing within symptomatic or asymptomatic tissues. The red dotted line is the Ct value of 37 representing the positive detection cutoff for Clarireedia spp. Ct values below 37 were considered positive detections of Clarireedia, whereas Ct values equal to and above 37 were considered negative for Clarireedia. The lower the Ct value, the higher the Clarireedia concentration.
Sampling method comparison
-
Average Ct values for asymptomatic creeping bentgrass plots sampled by the three different methods on 17 November 2020 (cv 'Crenshaw') and 6 May 2021 (cv 'Independence') are reported in Table 1.
Table 1. Average cycle threshold values and number of lesion centers per plot for asymptomatic creeping bentgrass plots sampled by three different sampling methods on 17 November 2020 (cv 'Crenshaw') and 6 May 2021 (cv 'Independence').
Replication Vertical mowinga Coresa Compositea Lesion centers 2020 asymptomatic 'Crenshaw' creeping bentgrass 1 28.8 (0.68) 33.9 (1.14) 35.3 0 2 31.1 (0.69) 33.9 (1.27) 33.5 0 3 35.0 (0.55) 36.9 (1.21) 36.5 0 4 28.8 (1.69) 37.2 (1.64) 32.0 0 5 30.3 (0.90) 34.1 (0.44) 35.1 0 6 29.8 (1.10) 33.6 (0.65) 32.6 0 7 28.2 (2.46) 34.1 (0.29) 33.9 0 8 29.6 (0.44) 33.8 (0.54) 33.5 0 9 29.1 (1.30) 34.6 (2.39) 31.2 0 10 32.8 (0.62) 32.2 (1.04) 36.3 0 11 32.7 (1.62) 34.6 (2.44) 32.2 0 12 33.1 (1.21) 34.9 (2.60) 33.5 0 Average 30.8 (1.11) 34.5 (1.40) 33.8 (1.63) 0 2021 asymptomatic 'Independence' creeping bentgrass 1 30.77 (3.15) 34.36 (2.18) 30.59 0 2 34.21 (2.88) 34.87 (0.98) 31.94 0 3 31.57 (1.78) 36.30 (2.10) 32.28 0 4 35.54 (0.88) 35.43 (2.79) 37.43 0 5 31.71 (1.79) 34.16 (3.45) 31.96 0 6 30.76 (1.48) 38.02 (3.02) 31.18 0 7 30.00 (1.31) 32.33 (1.56) 30.04 0 8 32.21 (1.25) 33.17 (1.49) 32.93 0 9 30.01 (1.86) 34.25 (2.15) 35.56 0 10 32.49 (1.11) 33.44 (1.38) 33.73 0 11 31.47 (1.12) 33.50 (1.11) 39.38 0 12 33.15 (0.76) 33.52 (2.93) 31.93 0 Average 32.0 (1.61) 34.4 (2.10) 33.2 (2.71) 0 a Ten cores 1 cm in diameter by 2.5 cm in depth were collected randomly from within each 0.91 m × 1.52 m plot, and then clippings were collected using a Toro Greensmaster Flex 21 (The Toro Company, MN) equipped with a 12-blade verticut reel (The Toro Company, MN) set at 1.5 cm spacing and a height of 7.1 mm above the roller. Cores were cut 5 mm into the thatch layer, and the lower thatch was discarded. For the 10 cores, half of the ground and homogenized tissue was used for individual core DNA isolation (0.1 g = 1.0 g total) and the other half was pooled with half of the other cores from the same plot to make a composite sample (0.25 g). Four 0.25-g (1.0 g total) subsamples were analyzed for clippings collected by vertical mowing per plot. Values in parentheses represent the standard deviations of the subsamples. Average Ct values for asymptomatic creeping bentgrass plots sampled by the three different methods on 17 November 2020 (cv 'Crenshaw') and 12 August 2021 (cv 'Independence' are reported in Table 2.
Table 2. Average cycle threshold values and number of lesion centers per plot for symptomatic creeping bentgrass plots sampled by three different sampling methods on 17 November 2020 (cv 'Crenshaw) and on 12 August 2021 (cv 'Independence').
Replication Vertical mowinga Coresa Compositea Lesion centers 2020 Symptomatic 'Crenshaw' creeping bentgrass 1 22.9 (0.63) 27.3 (3.68) 20.2 204 2 21.4 (0.15) 24.5 (2.53) 20.5 200 3 20.6 (0.07) 26.7 (4.14) 22.1 184 4 20.5 (0.28) 23.1 (1.91) 19.0 164 5 20.3 (0.60) 24.3 (3.64) 20.0 148 6 20.6 (0.31) 22.6 (1.60) 18.4 140 7 20.7 (0.65) 24.1 (2.23) 20.1 96 8 20.8 (0.22) 26.7 (5.09) 20.1 88 9 21.2 (0.14) 22.5 (1.56) 19.8 79 10 22.1 (0.14) 21.9 (1.98) 18.9 75 11 22.4 (0.55) 24.1 (3.72) 20.9 67 12 23.5 (0.34) 27.0 (1.95) 23.8 57 Average 21.4 (0.34) 24.6 (2.84) 20.3 (1.40) 125 2021 Symptomatic 'Independence' creeping bentgrass 1 22.71 (0.67) 27.80 (3.03) 24.56 57 2 23.92 (0.69) 28.54 (4.15) 25.46 44 3 25.58 (0.98) 30.31 (4.56) 26.89 25 4 26.46 (0.85) 31.92 (6.17) 24.85 17 5 22.35 (0.82) 25.47 (2.84) 25.26 76 6 22.76 (0.54) 28.47 (3.99) 24.05 63 7 23.31 (2.14) 29.65 (4.06) 24.35 67 8 22.10 (0.81) 26.90 (4.61) 28.65 47 9 20.50 (0.69) 25.90 (3.19) 31.34 83 10 22.46 (0.30) 27.53 (3.89) 22.67 65 11 21.79 (0.45) 28.07 (3.70) 22.23 86 12 22.25 (0.36) 26.95 (2.43) 22.05 37 Average 23.02 (0.78) 28.13 (3.89) 25.2 (2.59) 56 a Ten cores 1 cm in diameter by 2.5 cm in depth were collected randomly from within each 0.91 m × 1.52 m plot, and then clippings were collected using a Toro Greensmaster Flex 21 (The Toro Company, MN) equipped with a 12-blade verticut reel (The Toro Company, MN) set at 1.5 cm spacing and a height of 7.1 mm above the roller. Cores were cut 5 mm into the thatch layer, and the lower thatch was discarded. For the 10 cores, half of the ground and homogenized tissue was used for individual core DNA isolation (0.1 g = 1.0 g total) and the other half was pooled with half of the other cores from the same plot to make a composite sample (0.25 g). Four 0.25-g (1.0 g total) subsamples were analyzed for clipping collected by vertical mowing per plot. Values in parentheses represent standard deviations of the subsamples. As expected, the symptomatic plots had higher pathogen concentrations (lower average Ct values) than the asymptomatic plots within each sampling method. An ANOVA of the average Ct values for sampling method, replication, and the interaction between sampling method and replication is presented for all datasets in Table 3.
Table 3. Analysis of variance (ANOVA) of the average cycle threshold values for sampling methods (vertical mowing, individual cores, and composites), replication, and interactions conducted on creeping bentgrass (Agrostis stolonifera L.) cultivars in North Brunswick, NJ, during 2020 and 2021.
ANOVA Degrees of freedom Sum of squares Mean square F-value Pr (> F) Asymptomatic 17 November 2020a Method 2 470.9 235.46 96.971 0* Replication 11 226.8 20.62 8.491 1.99E−11* Interaction 22 219.7 9.99 4.113 1.12E−07* Residuals 144 349.7 2.43 Symptomatic 17 November 2020a Method 2 467 233.52 29.961 1.32E−11* Replication 11 361.5 32.86 4.216 2.04E−05* Interaction 22 118.8 5.4 0.693 0.841 Residuals 144 1,122.3 7.79 Asymptomatic 6 May 2021b Method 2 209.6 104.8 20.14 1.94E−08* Replication 11 232.1 21.1 4.055 3.53E−05* Interaction 22 242.1 11 2.114 0.0047* Residuals 144 749.5 5.2 Symptomatic 12 August 2021b Method 2 920 460 33.83 9.04E−13* Replication 11 421.3 38.3 2.817 2.34E−03* Interaction 22 148.6 6.8 0.497 0.9710 Residuals 144 * Adjusted p-values were < 0.05. a Asymptomatic and symptomatic samples were collected from different but adjacent regions of the same stand of 'Crenshaw' creeping bentgrass. b Asymptomatic and symptomatic samples were collected from the same plots of 'Independence' creeping bentgrass. The ANOVA showed that every factor was significant except for the interaction factor in both symptomatic datasets. This indicates that there was more variation between the different sampling methods in asymptomatic plots than in symptomatic plots. A post hoc honest significant difference test was performed on all the ANOVA models, and the adjusted p-value for each comparison is summarized in Table 4.
Table 4. Comparisons of average cycle threshold values for vertical mowing, individual cores, and composite sampling methods conducted on asymptomatic and symptomatic 'Crenshaw' and 'Independence' creeping bentgrass (Agrostis stolonifera L.) plots sampled during 2020 and 2021, respectively, in North Brunswick, NJ.
Sampling method comparisona Asymptomaticb Symptomaticb 2020 2021 2020 2021 Cores to composite 0.2931 0.1942 4.4E−06* 0.0258* Vertical mowing to composite 1.0E−07* 0.2071 0.4508 0.1628 Vertical mowing to cores 0* 0* 0* 0* a Ten cores 1 cm in diameter by 2.5 cm depth were randomly collected from each 0.91 m × 1.52 m plot, after which clippings were collected using a Toro Greensmaster Flex 21 mower equipped with a 12-blade verticut reel (The Toro Company, MN) set 7.1 mm above the roller with blades spaced 1.5 cm apart. DNA was isolated and analyzed using qPCR from half of the ground and homogenized tissue of each individual core, a composite of the remaining tissue from the 10 cores of each plot, and the ground homogenized vertical mowing clippings from each plot. b In 2020, asymptomatic and symptomatic samples were collected from different but adjacent regions of the same stand on 17 November, whereas in 2021, asymptomatic samples were collected on 6 May and symptomatic samples on 12 August from the same plots. * Tukey's honest significant difference test, where * indicates adjusted p-values were < 0.05. Vertical mowing clippings had higher pathogen concentrations (lower average Ct values) compared with individual cores in both the asymptomatic and symptomatic plots in both years of the study (Tables 1 and 2). Vertical mowing clippings had similar average Ct values to the composite sampling method each year, except in the asymptomatic plots in 2020, where vertical mowing had lower average Ct values. Composite samples had lower average Ct values than individual core samples in symptomatic plots, but similar Ct values as cores in asymptomatic plots in both years of the study. Vertical mowing had the smallest standard deviation for both the asymptomatic and symptomatic plots throughout the study. Composite samples had the highest variation within asymptomatic plots, and individual cores had the highest standard deviation in symptomatic plots in both years of the study.
-
The ideal sampling method should collect a representative sample from the turfgrass sward without causing excessive damage. Vertical mowing at the 7.1-mm height resulted in minimal turf injury and was considered to be the best sampling method to generate a representative sample of Clarireedia-infested tissue for qPCR analysis. This method is quick, cost-effective (only one sample is needed per plot), and collects tissue from a large portion (2.62%) of the total plot area compared with individual cores (0.23%) and composite samples (0.23%), thus increasing the likelihood of Clarireedia being detected.
Although individual cores and composite samples were able to consistently detect Clarireedia in the field in both asymptomatic and symptomatic plots, they had higher variation in their average Ct values (pathogen concentration) compared with vertical mowing. In particular, the individual core and composite methods had higher plot-to-plot variation than vertical mowing in asymptomatic plots because of how the disease develops randomly in the field[6] and the limited area sampled by these methods. In symptomatic turf, the composite method was biased towards the core with the highest pathogen concentration (a lower Ct value) in both years of this study. Moreover, the individual core method had the highest variation among subsamples, with standard deviations averaging 3.65, which represents approximately a 1,000-fold difference in pathogen concentration. Therefore, neither method was considered acceptable for accurately detecting Clarireedia in creeping bentgrass turf in the field.
The two vertical mowing heights (4.8 and 7.1 mm; 50% and 75% of the mowing height, respectively) resulted in near identical Ct values in both asymptomatic and symptomatic turf. Even though turf injury associated with the 7.1-mm height was minimal, both depths might be too destructive for routine monitoring of Clarireedia populations on a frequent basis (every 1−2 weeks) across the growing season. In addition, although we did not evaluate mowing as a sampling method in this study because it does not collect disease lesions in the lower canopy in symptomatic plots, it has been found to consistently detect Clarireedia in asymptomatic plots[11]. Since there was a clear difference in average Ct values between asymptomatic and symptomatic plots in the current study, mowing could potentially represent an additional sampling method for monitoring Clarireedia in asymptomatic plots to reduce turf injury. However, additional research is needed to determine if alternating vertical mowing with normal mowing could be used to effectively monitor the Clarireedia population in the field prior to the symptoms' development.
This study was financially supported by the Rutgers Center for Turfgrass Science.
-
The authors confirm their contributions to the paper as follows: designed the original experiment: Groben G, Clarke BB, Murphy J, Zhang N; conducted the experiment and wrote the original manuscript: Groben G; edited the original manuscript: Clarke BB, Murphy J, Zhang N. All authors reviewed the results and approved the final version of the manuscript.
-
All data generated or analyzed during this study are included in this published article.
-
The authors declare that they have no conflict of interest.
- Copyright: © 2026 by the author(s). Published by Maximum Academic Press, Fayetteville, GA. This article is an open access article distributed under Creative Commons Attribution License (CC BY 4.0), visit https://creativecommons.org/licenses/by/4.0/.
-
About this article
Cite this article
Groben G, Clarke BB, Murphy J, Zhang N. 2026. Optimizing a sampling method for quantitative polymerase chain reaction detection of dollar spot pathogens from creeping bentgrass. Grass Research 6: e019 doi: 10.48130/grares-0026-0008 

Optimizing a sampling method for quantitative polymerase chain reaction detection of dollar spot pathogens from creeping bentgrass
- Received: 04 October 2025
- Revised: 23 January 2026
- Accepted: 27 January 2026
- Published online: 22 June 2026
Abstract: Dollar spot is a foliar blight of turfgrasses caused by Clarireedia species. An existing quantitative polymerase chain reaction (qPCR) protocol was shown to quantify the abundance of Clarireedia from both asymptomatic and symptomatic tissues, which makes it a useful tool for monitoring the pathogen in the field. The qPCR assay uses a tiny amount of tissue, so generating an accurate representative sample from a large turfgrass sward is necessary. The main objective of this study was to determine the best sampling method for qPCR analysis for accurate detection and quantification of Clarireedia in creeping bentgrass (Agrostis stolonifera) fields. Two dollar spot-susceptible cultivars of creeping bentgrass, 'Crenshaw' (2020) and 'Independence' (2021), were used in the study. Symptomatic and asymptomatic samples were collected each year from 12 replicated 0.91 m × 1.52 m plots maintained at a 9.5 mm (bench set) cutting height. Average cycle threshold (Ct) values were determined using the qPCR assay from: (1) 10 individual cores measuring 1 cm × 2.5 cm deep, evaluated as subsamples; (2) composites of 10 cores of 1 cm × 2.5 cm deep; and (3) tissue obtained by vertical mowing at two heights (4.8 or 7.1 mm bench set). Overall, vertical mowing was found to be the best sampling method for quantifying Clarireedia in foliage. Vertical mowing sampled 2.62% of each plot compared with only 0.23% for cores and composites, had the lowest variability in Ct values, consistently identified plots containing asymptomatic and symptomatic tissue, and represents a sampling method that could be easily adopted by golf course superintendents to monitor the population of Clarireedia to schedule fungicide applications and potentially reduce fungicide inputs.
-
Key words:
- Clarireedia /
- Dollar spot /
- qPCR /
- Sampling method /
- Vertical mowing /
- Verticutting