-
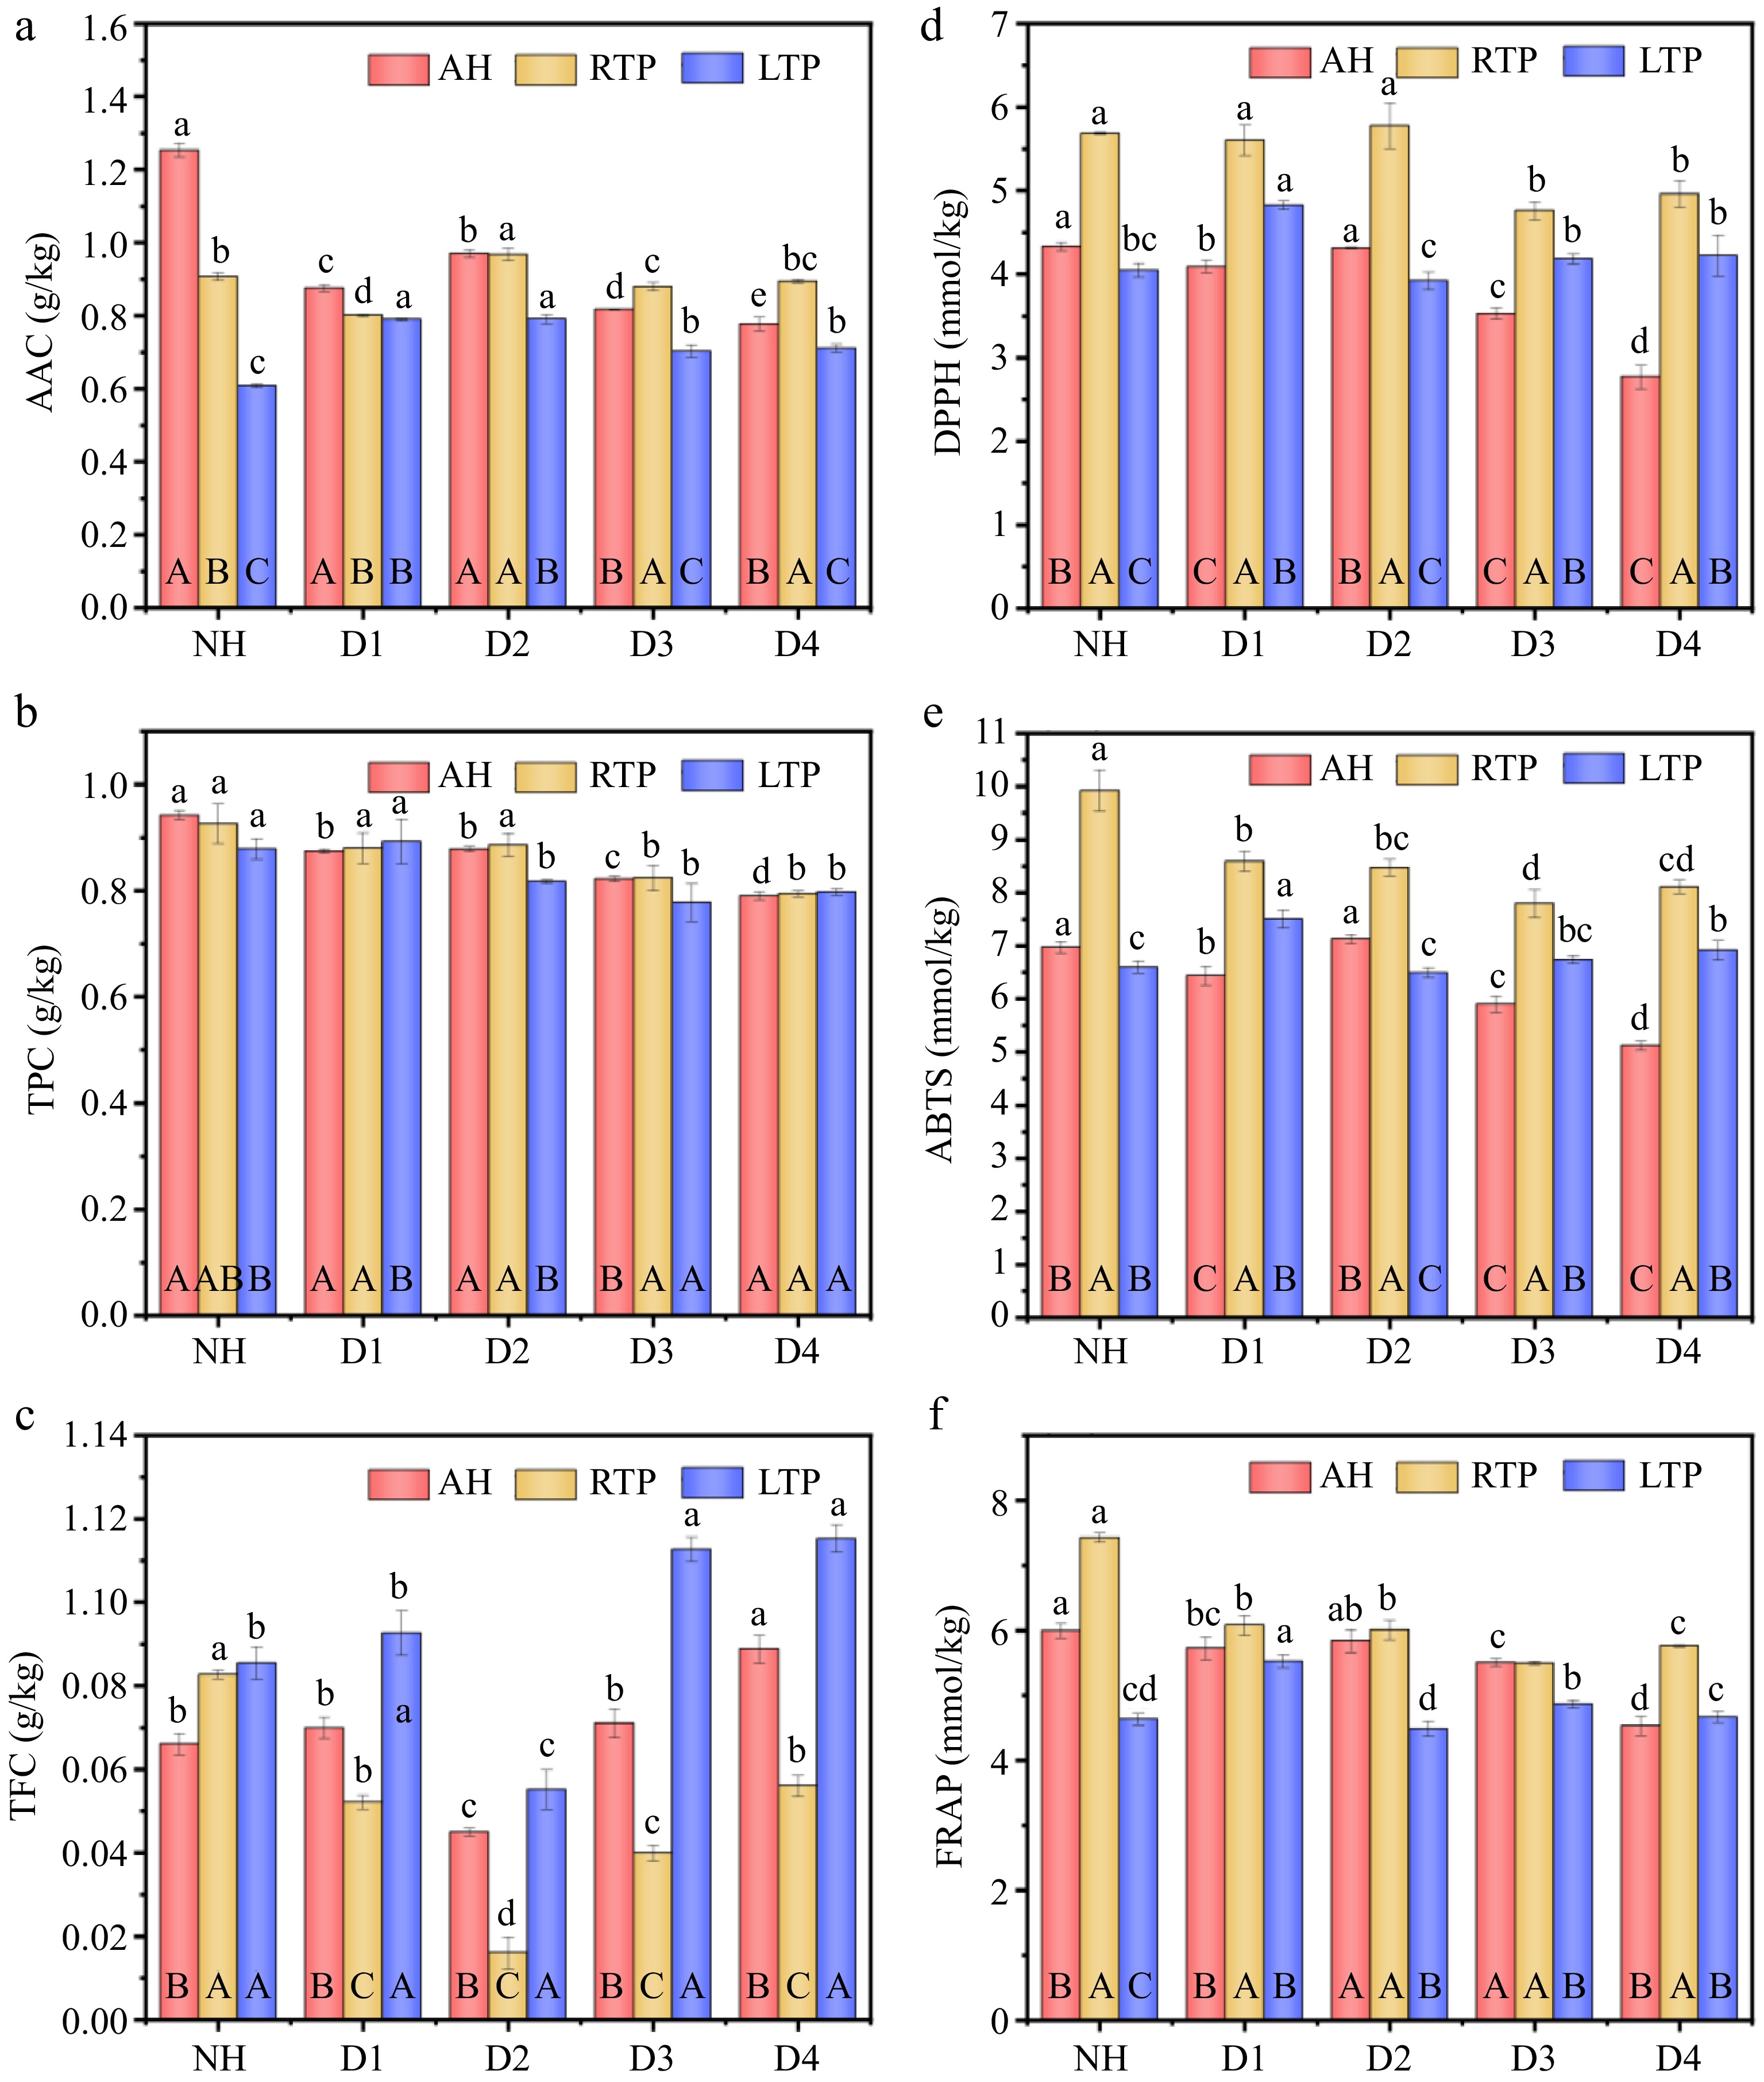
Figure 1.
(a) AAC, (b) TPC, (c) TFC, (d) DPPH, (e) ABTS, and (f) FRAP of AH, RTP, and LTP kiwifruit samples with different delayed harvesting times. AH: at harvest; RTP: room temperature post-ripening; LTP: low temperature post-ripening; NH: normal harvest. D1, D2, D3, and D4 were delayed harvests for one, two, three, and four weeks, respectively. AAC: ascorbic acid content; TPC: total polyphenol content; TFC: total flavonoid content; FRAP: ferric reducing antioxidant power. The error is the standard deviation of the mean; different lowercase letters represent significant differences (p < 0.05) among samples with different DH times in the same treatment group; different uppercase letters represent significant differences (p < 0.05) between samples from different treatment groups at the same DH time.
-
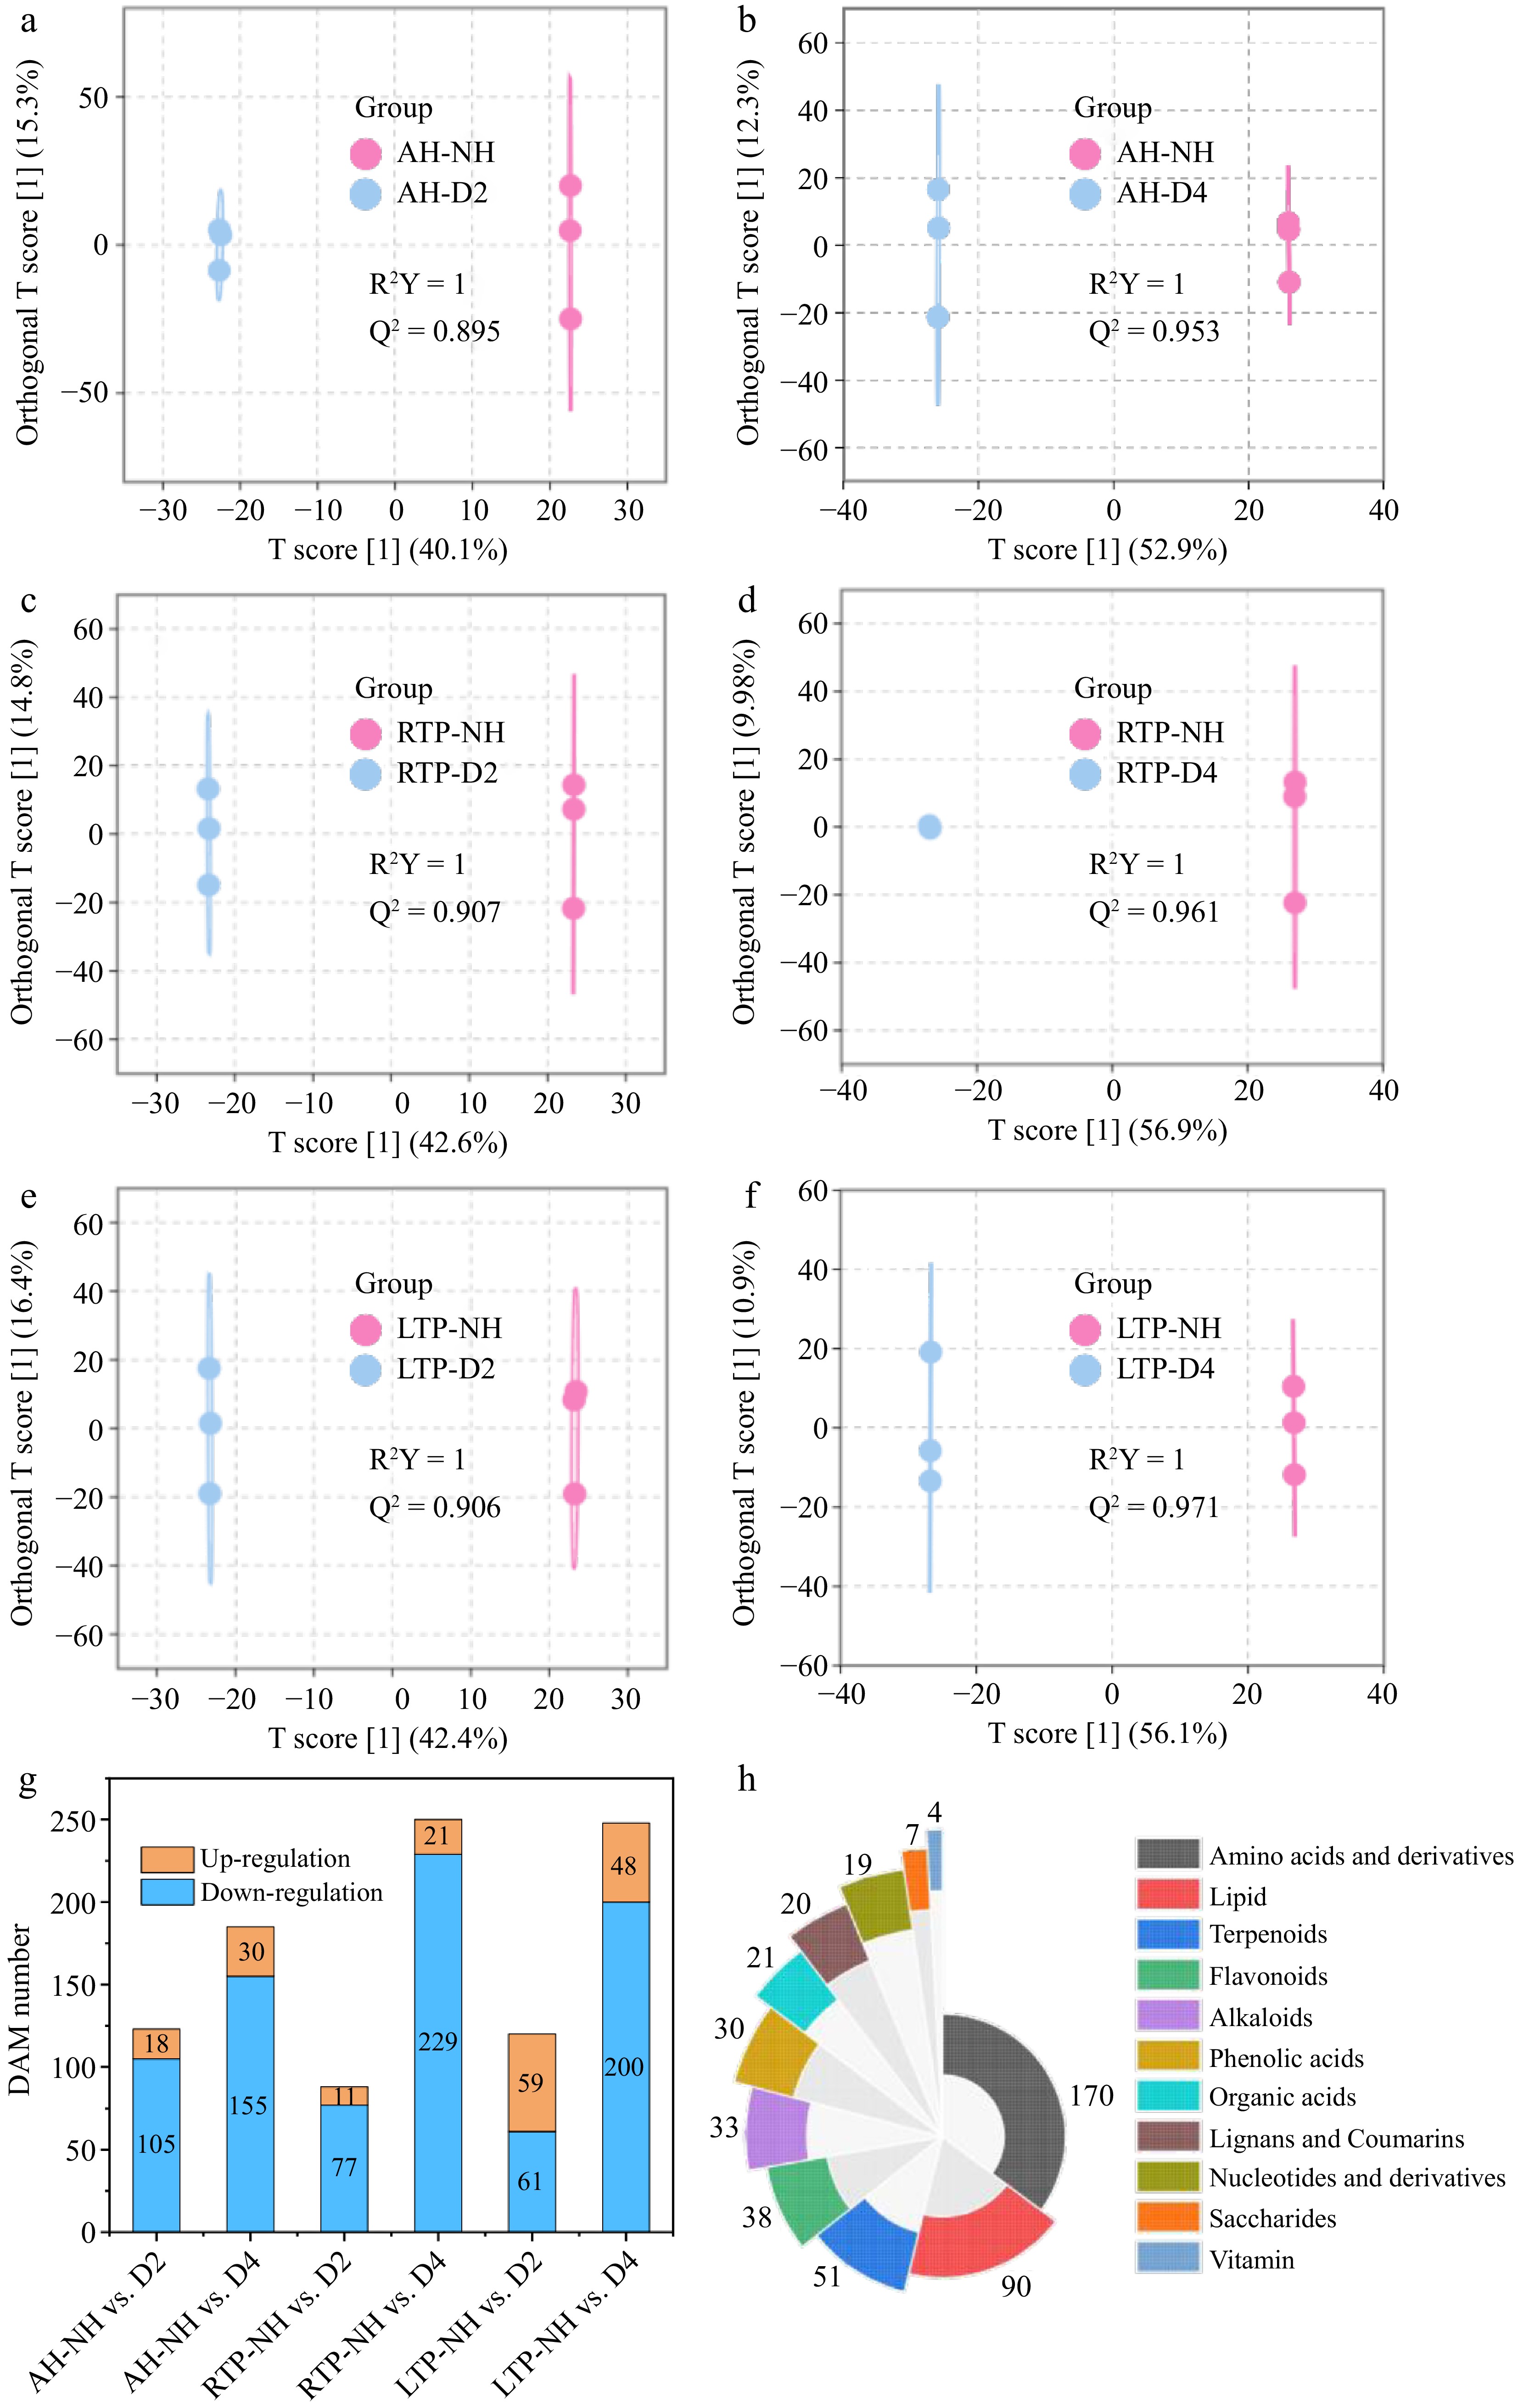
Figure 2.
(a)–(f) The score plots of OPLS-DA, (g) distribution of up-regulation and down-regulation, and (h) substance species of DAM of kiwifruit samples with different harvest times in all comparison groups. AH-NH vs. D2 and AH-NH vs. D4 represent normal harvest vs. two-week and four-week delayed harvest at harvest, respectively. RTP-NH vs. D2 and RTP-NH vs. D4 represent the comparisons between normal harvest and a two- or four-week delayed harvest following post-ripening at room temperature, respectively. LTP-NH vs. D2 and LTP-NH vs. D4 represent the comparisons between normal harvest and a two- or four-week delayed harvest following post-ripening at low temperature, respectively. AH: at harvest; RTP: room temperature post-ripening; LTP: low temperature post-ripening; NH: normal harvest. D2 and D4 were delayed harvests for two and four weeks, respectively. DAM: differential accumulation metabolites.
-
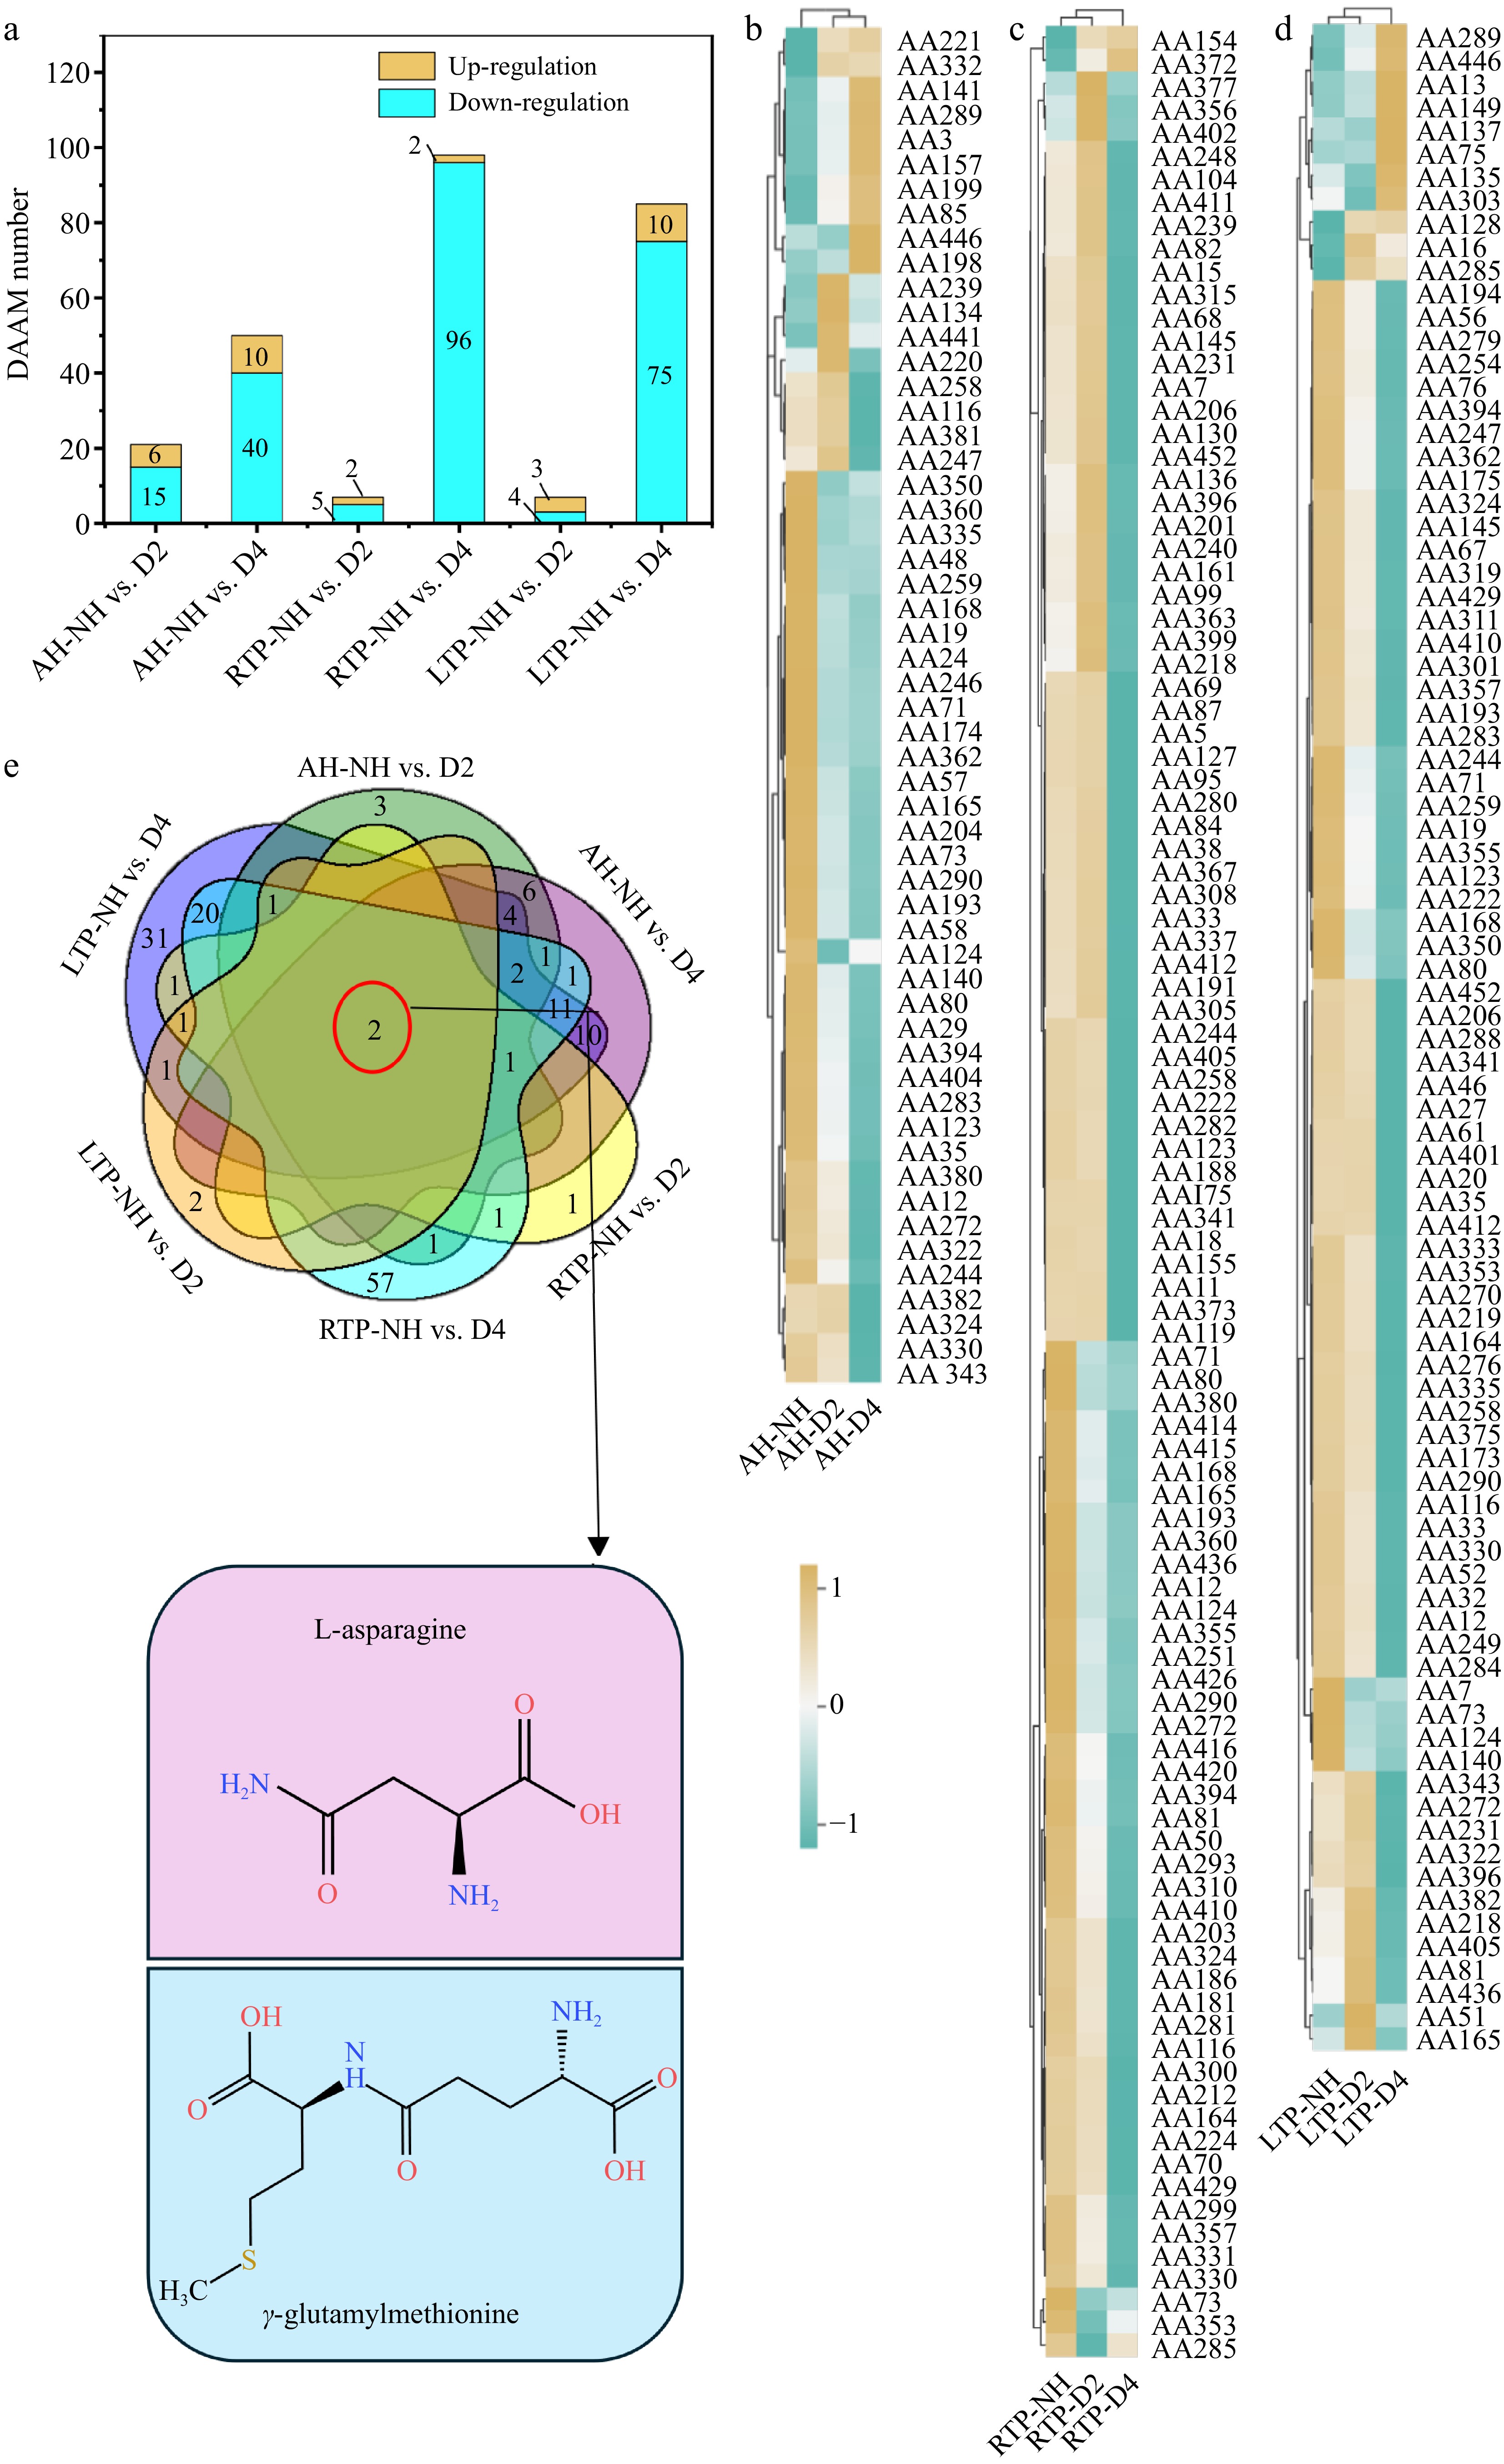
Figure 3.
(a) Distribution of up-regulation and down-regulation, (b)–(d) heatmaps, and (e) Venn plots of DAAM in different comparison groups. AH-NH vs. D2 and AH-NH vs. D4 represent normal harvest vs. two- and four-week delayed harvest at harvest, respectively. RTP-NH vs. D2 and RTP-NH vs. D4 represent the comparisons between normal harvest and a two-or four-week delayed harvest following post-ripening at room temperature, respectively. LTP-NH vs. D2 and LTP-NH vs. D4 represent the comparisons between normal harvest and a two-or four-week delayed harvest following post-ripening at low temperature, respectively. AH: at harvest; RTP: room temperature post-ripening; LTP: low temperature post-ripening; NH: normal harvest. D2 and D4 were delayed harvests for two and four weeks, respectively. DAAM: differential amino acid accumulating metabolites.
-
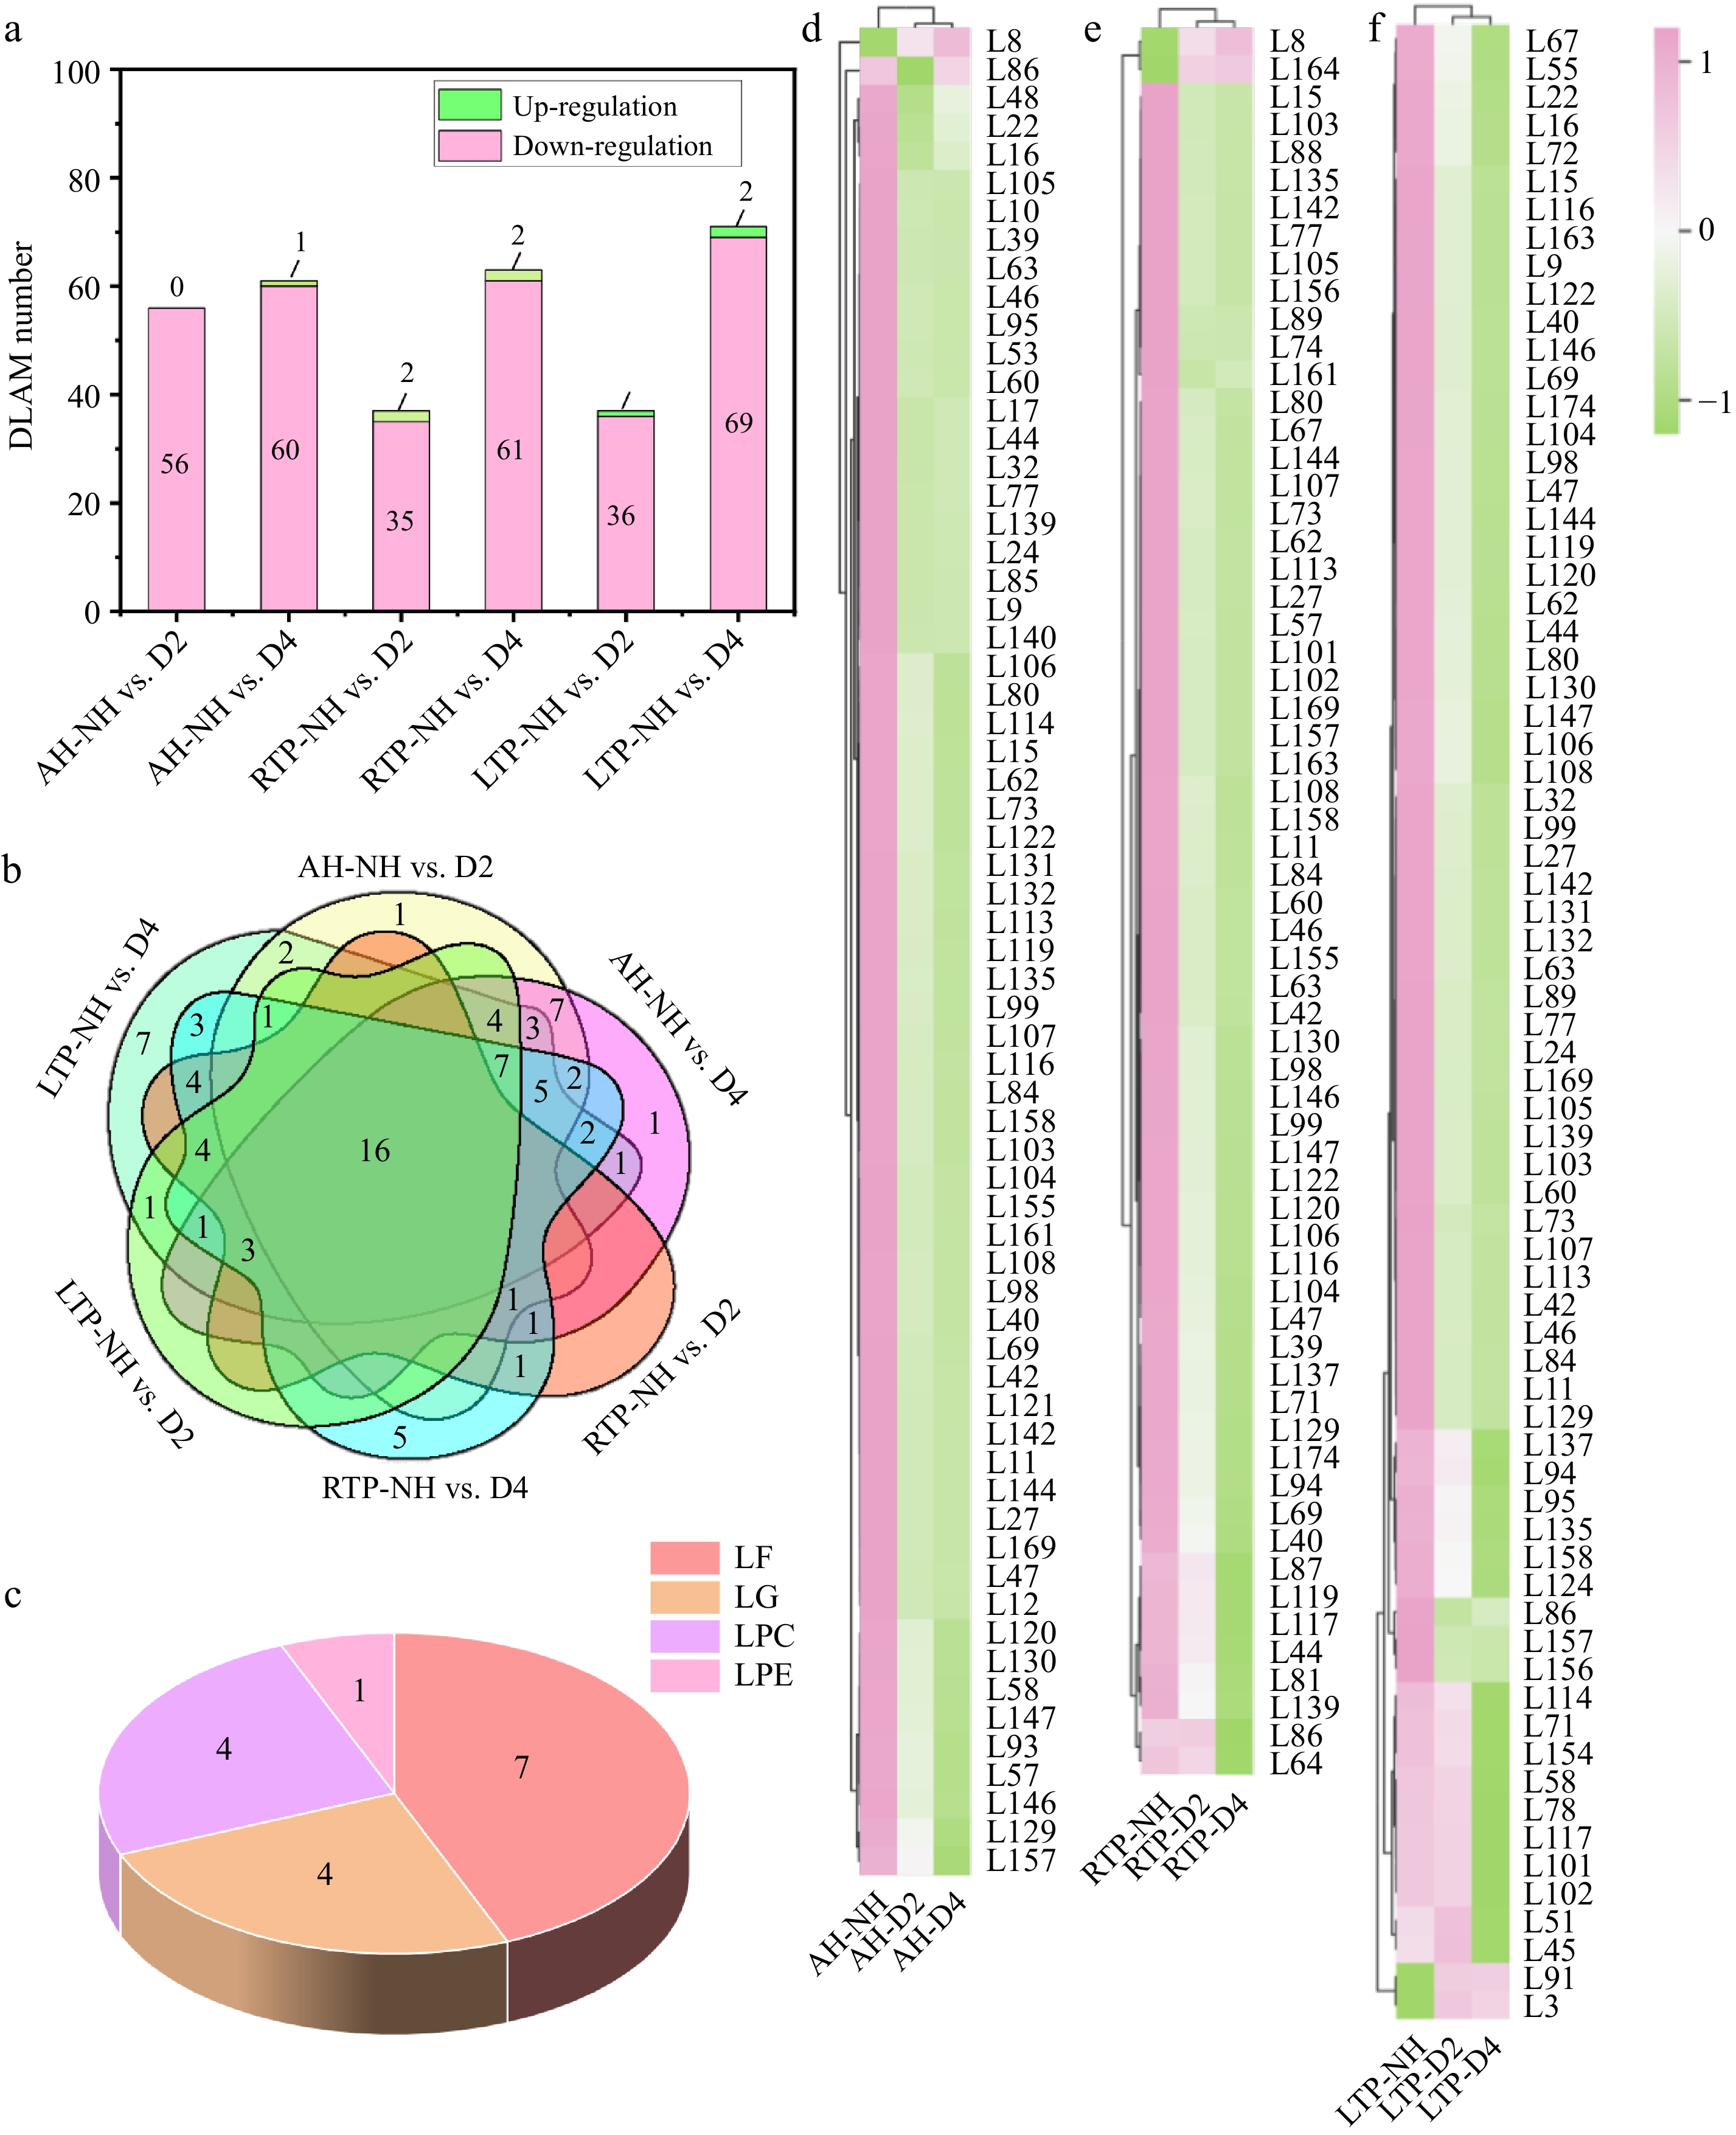
Figure 4.
(a) Distribution of up-regulation and down-regulation, (b) Venn plots, (c) common species, and (d), (e) heatmaps of DLAM in different comparison groups. AH-NH vs. D2 and AH-NH vs. D4 represent normal harvest vs. two- and four-week delayed harvest at harvest, respectively. RTP-NH vs. D2 and RTP-NH vs. D4 represent the comparisons between normal harvest and a two- or four-week delayed harvest following post-ripening at room temperature, respectively. LTP-NH vs. D2 and LTP-NH vs. D4 represent the comparisons between normal harvest and a two- or four-week delayed harvest following post-ripening at low temperature, respectively. AH: at harvest; RTP: room temperature post-ripening; LTP: low temperature post-ripening; NH: normal harvest. D2 and D4 were delayed harvests for two and four weeks, respectively. DLAM: differential lipid accumulating metabolites; LF: free fatty acids; LG: glycerol ester; LPC: lysophosphatidylcholine; LPE: lysophosphatidylethanolamine.
-
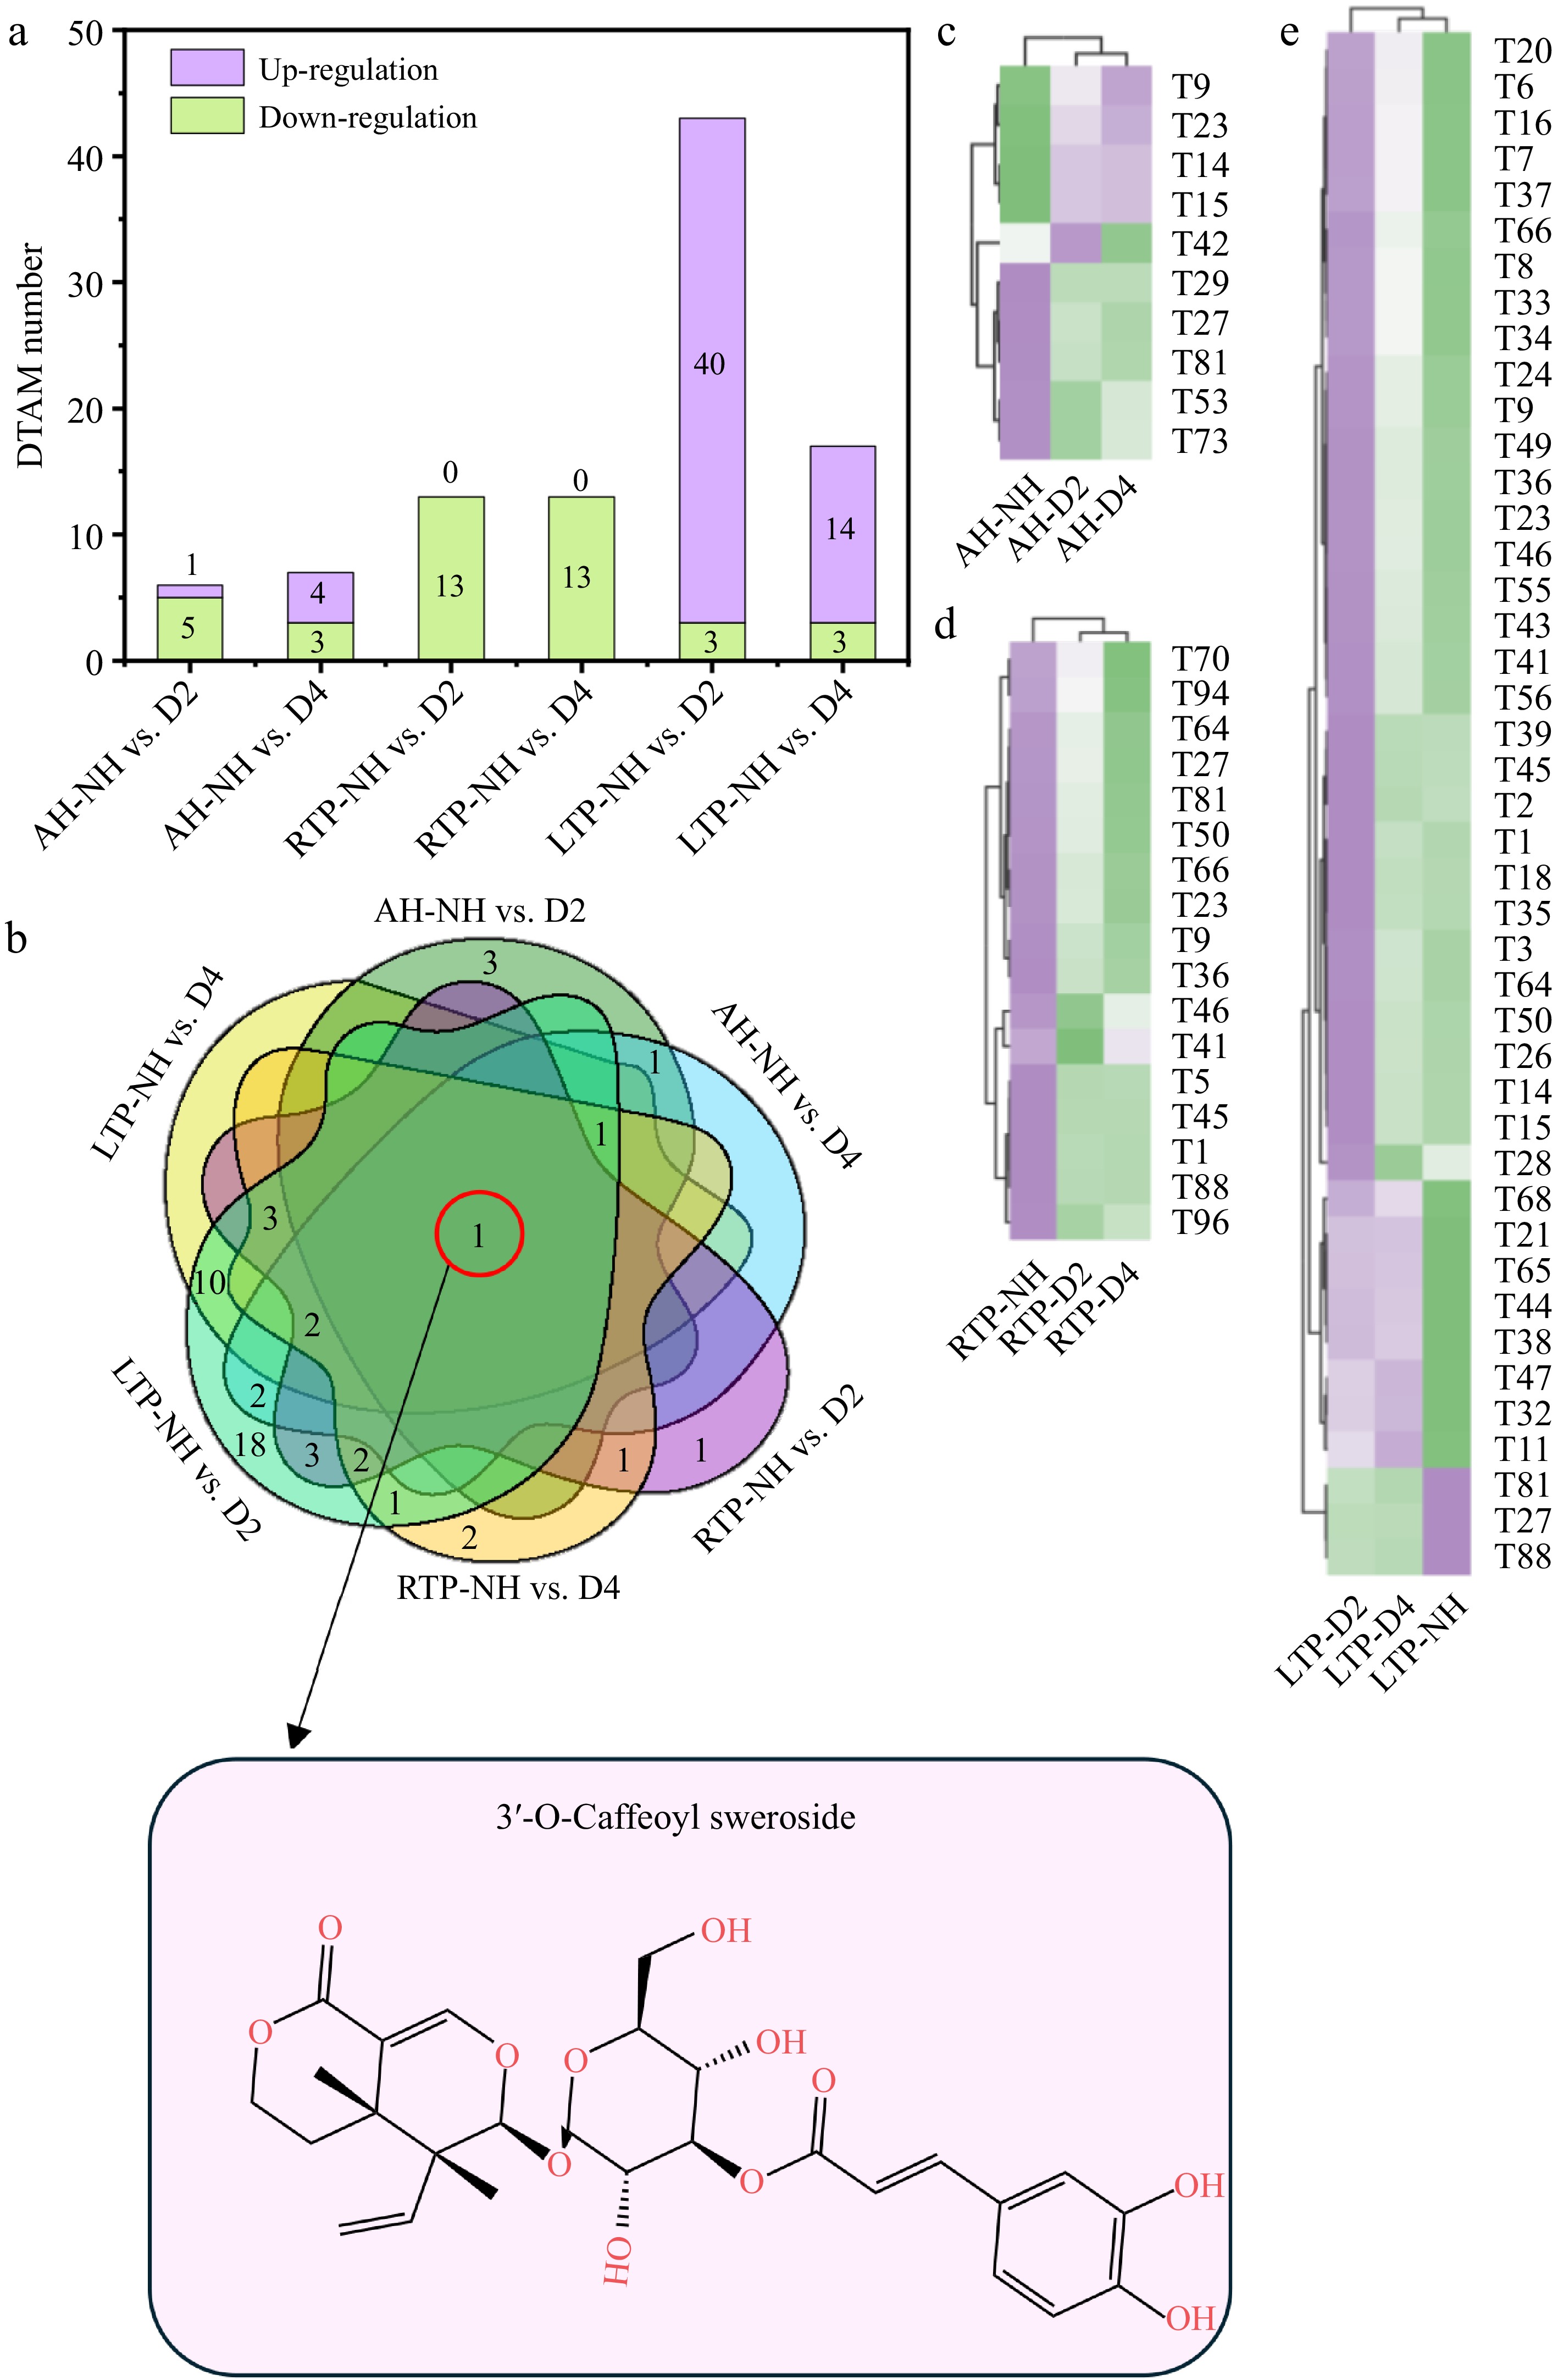
Figure 5.
(a) Distribution of up-regulation and down-regulation, (b) Venn plots, and (c)–(e) heatmaps of DTAM in different comparison groups. AH-NH vs. D2 and AH-NH vs. D4 represent normal harvest vs. two- and four-week delayed harvest at harvest, respectively. RTP-NH vs. D2 and RTP-NH vs. D4 represent the comparisons between normal harvest and a two- or four-week delayed harvest following post-ripening at room temperature, respectively. LTP-NH vs. D2 and LTP-NH vs. D4 represent the comparisons between normal harvest and a two- or four-week delayed harvest following post-ripening at low temperature, respectively. AH: at harvest; RTP: room temperature post-ripening; LTP: low temperature post-ripening; NH: normal harvest. D2 and D4 were delayed harvests for two and four weeks, respectively. DTAM: differential terpenoids accumulating metabolites.
-
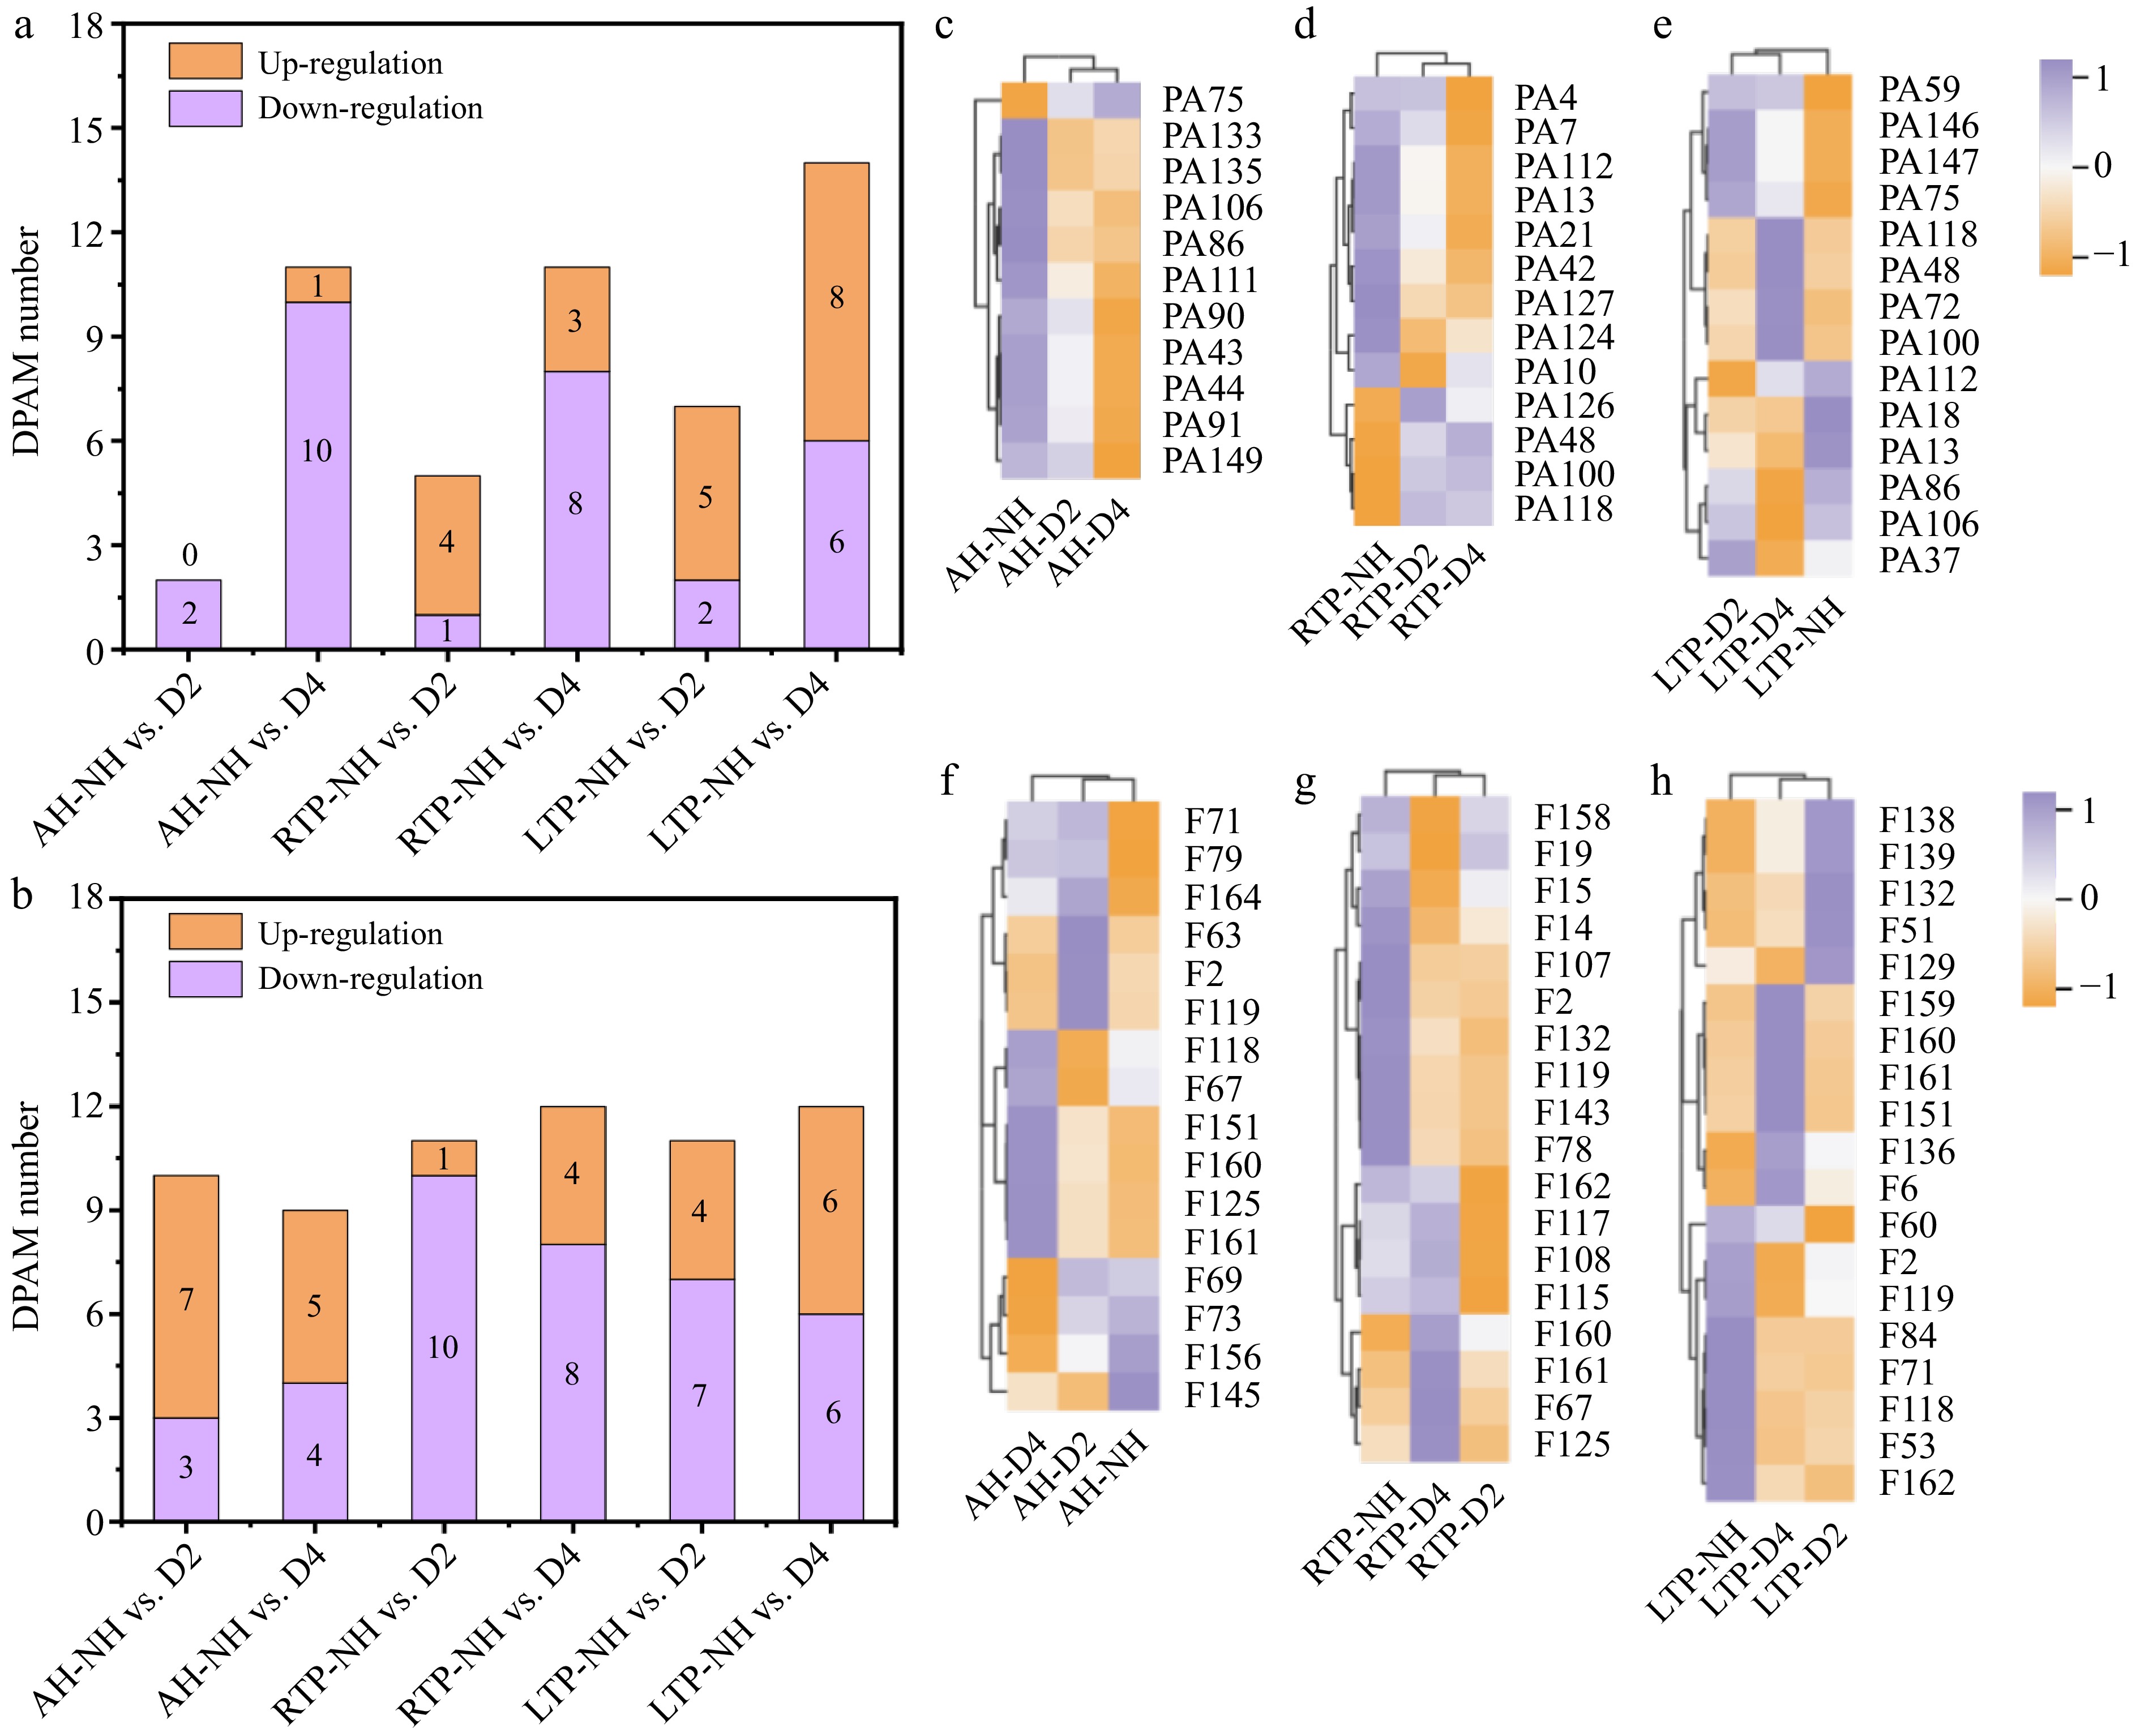
Figure 6.
(a), (b) Distribution of up-regulation and down-regulation, and (c)–(h) heatmaps of DPAM and DFAM in different comparison groups. AH-NH vs. D2 and AH-NH vs. D4 represent normal harvest vs. two- and four-week delayed harvest at harvest, respectively. RTP-NH vs. D2 and RTP-NH vs. D4 represent the comparisons between normal harvest and a two- or four-week delayed harvest following post-ripening at room temperature, respectively. LTP-NH vs. D2 and LTP-NH vs. D4 represent the comparisons between normal harvest and a two- or four-week delayed harvest following post-ripening at low temperature, respectively. AH: at harvest; RTP: room temperature post-ripening; LTP: low temperature post-ripening; NH: normal harvest. D2 and D4 were delayed harvests for two and four weeks, respectively. DPAM: differential phenolic acid accumulating metabolites; DFAM: differential flavonoid accumulating metabolites.
-
Indicator Treatment NH D1 D2 D3 D4 Total soluble solids content (%) AH 8.04 ± 0.05Bbc 7.91 ± 0.07Cc 7.95 ± 0.07Cc 8.16 ± 0.05Bb 8.76 ± 0.10Ca RTP 18.10 ± 0.09Aa 17.07 ± 0.12Ac 17.60 ± 0.10Ab 16.66 ± 0.08Ad 16.93 ± 0.06Ac LTP 18.00 ± 0.01Aa 16.46 ± 0.05Bb 16.00 ± 0.10Bd 16.15 ± 0.07Ac 15.74 ± 0.05Be Total sugar content (%) AH 3.11 ± 0.28Bc 4.30 ± 0.12Cb 4.40 ± 0.49Bb 4.41 ± 0.35Cb 5.49 ± 0.25Ca RTP 12.38 ± 0.31Aa 11.03 ± 0.32Ab 11.35 ± 0.26Ab 11.25 ± 0.24Ab 12.26 ± 0.28Aa LTP 12.40 ± 0.29Aa 9.81 ± 0.53Bc 11.34 ± 0.50Ab 10.09 ± 0.25Bc 11.10 ± 0.51Bb Titratable acid content (g/kg) AH 10.86 ± 0.10Ad 10.85 ± 0.10Ad 11.43 ± 0.11Ac 12.16 ± 0.06Ab 12.56 ± 0.04Aa RTP 10.52 ± 0.04Ac 10.42 ± 0.02Ad 11.00 ± 0.08Ab 11.32 ± 0.04Ba 11.38 ± 0.02Ba LTP 9.36 ± 0.12Bb 9.36 ± 0.08Bb 9.40 ± 0.03Bb 9.46 ± 0.06Cb 9.96 ± 0.04Ca Dry matter content (%) AH 20.77 ± 0.18Aa 18.60 ± 0.75ABb 18.54 ± 1.04Ab 17.84 ± 0.40Ab 17.67 ± 0.66Ab RTP 21.01 ± 1.06Aa 19.40 ± 0.79Aab 19.23 ± 0.19Aab 18.25 ± 0.49Ab 18.37 ± 1.75Ab LTP 19.22 ± 0.45Ba 18.04 ± 0.31Bb 18.03 ± 0.99Ab 18.06 ± 0.10Ab 17.39 ± 0.15Ab AH: at harvest; RTP: room temperature post-ripening; LTP: low temperature post-ripening; NH: normal harvest. D1, D2, D3, and D4 were delayed harvests for one, two, three, and four weeks, respectively. Results are presented as mean ± standard deviation. Different superscript capital letters indicate statistically significant differences between treatment groups, while different superscript lowercase letters denote significant differences among samples with varying delayed harvest times within the same treatment group (p < 0.05). Table 1.
Effect of delayed harvesting on physicochemical properties of kiwifruit with different treatments.
-
Compounds AH RTP LTP NH vs. D2 NH vs. D4 NH vs. D2 NH vs. D4 NH vs. D2 NH vs. D4 DAKAMs 1↑, 8↓ 1↑, 14↓ 1↑, 2↓ 2↑, 5↓ 4↑, 2↓ 5↑, 6↓ Tri-p-coumaroyl Spermidine − − − − ↑ ↑ 4-Hydroxymandelonitrile − ↓ − − − − Candicine − − − − − ↑ N',N''-Diferuloylspermidine ↑ ↑ − − − − N1,N8-Bis(sinapoyl)spermidine − − − − − ↑ p-Coumaroylagmatine − − − ↓ − − 1-O-p-Coumaroyllysine − − − ↓ − ↓ 3,5-Dihydro-2H-Furo(3,2-C)Quinolin-4-One ↓ ↓ − − − − 8-hydroxyquinoline − ↓ − − − − N-Oleoylethanolamine − − ↑ ↑ − − Stearamide ↓ ↓ − − − − 3-amino-2-naphthoic acid ↓ ↓ − − − − Zarzissine − − − ↓ − ↓ alanine betaine ↓ ↓ − − − ↓ O-Phosphocholine − ↓ − − − − Putrescine − − − − − ↑ Triacanthinapioside − − − − ↓ ↓ 2-Amino-4-dihydroxy octadecyl galactoside − − − − − ↑ O-Phosphorylethanolamine − − − ↑ − − Agmatine − − − − ↑ − Nicotianamine − − − − ↓ − N-Acetylputrescine − − − − ↑ − Α-hydroxyquinoline − ↓ − − − − Pyran(3,4-b)indole-2-ketone ↓ ↓ − − − − 3-Indoleacrylic acid ↓ ↓ − − − − 1-Methoxy-indole-3-acetamide ↓ ↓ − − − − Indole-3-carboxaldehyde − ↓ − − − − Methoxyindoleacetic acid ↓ ↓ − − − − Pterolactam − − − − − ↓ Indole-3-carboxylic acid − − ↓ ↓ − − Indole-5-carboxylic acid − − ↓ ↓ − − N-Acetyl-5-hydroxytryptamine − − − − − ↓ Indole − ↓ − − ↑ − DLCAMs 2↑, 0↓ 3↑, 3↓ 0↑, 2↓ 0↑, 8↓ 0↑, 0↓ 2↑, 4↓ Esculetin (6,7-Dihydroxycoumarin) − − − ↓ − ↓ Esculetin-6-O-quinic acid − − − ↓ − ↓ Fraxidin (8-Hydroxy-6,7-dimethoxycoumarin) − − − ↓ − − Isofraxidin − − − ↓ − − 7-Hydroxycoumarin;Umbelliferone − ↓ − − − − 6,7-Dihydroxy-4-methylcoumarin − − − ↓ − − Chestnutlignansoide − − ↓ − − − Erythro-Guaiacylglycerol-β−O-4'-dehydrodisinapyl Ether − − ↓ ↓ − − Secoisolariciresinol-9'-O-glucoside − ↑ − − − ↑ Divanillyltetrahydrofuran − − − ↓ − − Syringaresinol-4'-O-(6''-acetyl)glucoside − − − ↓ − − Epipinoresinol ↑ − − − − − Pinoresinol ↑ − − − − − Syringaresinol − ↑ − − − − Medioresinol-4'-O-(6'''-acetyl)glucoside − ↓ − − − − Syringic acid 4-O-rhamnoside − − − − − ↑ Secoisolariciresinol-9'-O-xyloside − ↑ − − − − Pinoresinol-4,4'-O-di-O-glucoside − ↓ − − − − Medioresinol − − − − − ↓ Medioresinol-4,4'-di-O-glucoside − − − − − ↓ DSAMs 0↑, 1↓ 1↑, 3↓ 0↑, 0↓ 0↑, 3↓ 0↑, 1↓ 0↑, 5↓ D-Threonic acid − ↓ − ↓ − ↓ 3-(2-MethylButyryl)Sucrose-2-O-Acetate − ↓ − ↓ − ↓ D-Glucose 1,6-bisphosphate − − − − − ↓ D-Fructose-1,6-biphosphate − − − − − ↓ DMelezitose O-rhamnoside − ↓ − ↓ ↓ ↓ Laminaran − ↑ − − − − 3'-Fucosyllactose ↓ − − − − − DOAMs 0↑, 7↓ 0↑, 10↓ 0↑, 5↓ 5↑, 13↓ 0↑, 3↓ 1↑, 11↓ α−Ketoglutaric acid − − − ↓ − − Jasmonic acid ↓ ↓ ↓ ↓ ↓ ↓ Methylmalonic acid − − − ↓ − − Succinic acid − − − ↓ − − 2-Methylsuccinic acid − ↓ − ↑ − ↓ 2-Isopropylmalic acid ↓ − − ↓ − − Ethylmalonic acid − ↓ − ↑ − ↓ 2-Propylmalic acid ↓ − − ↓ − − 3-Isopropylmalic acid ↓ − − ↓ − − γ−Aminobutyric acid − − − − − ↓ 2-Aminoheptanedioic acid − − − ↓ − ↓ Monomethyl succinate − ↓ − ↑ − ↓ 4-Oxoisotretinoin ↓ ↓ ↓ ↓ ↓ ↓ Dimethylmalonic acid − ↓ − ↑ − ↓ 6-Aminocaproic acid − ↓ − − − − 2,2-Dimethylsuccinic acid ↓ ↓ ↓ ↓ − ↓ Phosphoenolpyruvate − − − ↑ − ↑ Psoromic acid − − ↓ ↓ − − Creatine − − − − − ↓ 1-Aminocyclopropane-1-carboxylic acid − − − ↓ − − 3-Hydroxy-3-Methyl-2-Oxopentanoic acid − ↓ − − − − 3-Ureidopropionic acid ↓ ↓ − − ↓ ↓ Aminomalonic acid − − − ↓ − − DAKAMs: differential alkaloid accumulating metabolites; DLCAMs: differential lignans and coumarins accumulation metabolites; DSAMs: differential saccharide accumulation metabolites; DOAMs: differential organic acid accumulating metabolites. AH: at harvest; RTP: room temperature post-ripening; LTP: low temperature post-ripening; NH: normal harvest. D2 and D4 were delayed harvests for two and four weeks, respectively. Table 2.
Distribution of up-regulation and down-regulation of DAKAMs, DLCAMs, DSAMs, and DOAMs in different comparison groups.
Figures
(6)
Tables
(2)