


-
The kiwifruit (Actinidia spp.), belonging to the Actinidiaceae family within the genus Actinidia Lindl., originates from China. Since the 20th century, the global kiwifruit industry has expanded rapidly. China is now the world's largest kiwifruit grower and producer[1]. Kiwifruit is rich in nutrients, including vitamins, amino acids, and dietary fiber, and its sweet taste and rich flavor contribute to its high consumer appeal[2,3]. However, compared with countries that have achieved a high international market share, such as New Zealand and Italy, the Chinese kiwifruit industry struggles with disorganized harvesting, uneven fruit quality, improper storage, and poor post-ripening control. In particular, the absence of scientific harvesting standards leads to uneven fruit quality, undermining market competitiveness and the reputation of Chinese kiwifruit, and limiting export volumes and industry development[4].
As a climacteric fruit, kiwifruit is firm at harvest and requires post-harvest ripening to become edible. Previous studies have shown that harvest time is closely related to the nutritional quality of fruit, as sufficient on-tree maturation is required to accumulate abundant nutrients and bioactive compounds[2,5]. Meanwhile, it also has an effect on fruit quality in terms of storage properties, color, and flavor, as well as on various metabolites[6]. Currently, the industry commonly determines kiwifruit harvest time based on total soluble solids (TSS), dry matter content (DMC), and firmness[7]. For instance, New Zealand's minimum standard is 6.2% TSS, whereas Italy, Japan, and the United States require > 6.5% TSS[8]. Burdon et al.[9] recommended harvesting fruit with good storage potential at 7%–9% TSS. However, these indicators are limited and insufficient to reflect the optimal accumulation stage of key nutrients and secondary metabolites in kiwifruit. Therefore, more scientific judgment methods and harvesting techniques are essential to realize optimal harvesting time and stage harvest to obtain high-quality kiwifruit and enhance market competitiveness.
As an emerging storage and harvesting method, delayed harvesting (DH) aims to achieve live storage on the tree by intentionally postponing the harvest. Compared with normal harvesting (NH), DH does not occupy storage space, enables batch harvesting to reduce the storage cost, and can effectively extend the fresh fruit market time, which can alleviate storage and transportation pressures from centralized marketing[2]. Meanwhile, proper DH can facilitate the late development of fruit, improve its sensory and nutritional qualities, and avoid the emergence of physiological diseases. Currently, DH has been applied and studied in many fruits, including grapes[10], oranges[11], and grapefruit[12]. However, its specific effects on kiwifruit metabolite dynamics remain largely unknown, particularly for major Chinese cultivars like 'Cuixiang'. DH for two to six weeks facilitated the accumulation of beneficial compounds, including anthocyanins, anthocyanin 3-galactosides, and chlorogenic acid in apple skin[13]. Bai et al.[14] found that DH for one to three months resulted in higher levels of aromatic compounds and lower levels of bitter substances in 'Valencia' oranges. In conclusion, DH can assist in enhancing fruit market competitiveness, which is of great significance in boosting the industry's economic value. But significant inter-cultivar variations in metabolic enzyme synthesis and the expression of associated regulatory genes during fruit growth and development result in differential responses to DH across distinct varieties. Therefore, the application of DH to different fruits requires thorough investigation.
'Cuixiang', a predominant early-to-mid maturing green-fleshed kiwifruit cultivar in China, is noted for its sweet-tart aroma and delicate texture. Therefore, we hypothesized that an optimal DH would maintain or even enhance the postharvest quality of 'Cuixiang' kiwifruit. To test this hypothesis, the present study systematically investigated the impact of DH on the fruit's physicochemical properties, bioactive compounds, and secondary metabolites at harvest (AH), room-temperature post-ripening (RTP), and low-temperature post-ripening (LTP). The results will assist in providing a theoretical basis and scientific support for rationally extending the harvest time of kiwifruit while ensuring fruit quality.
-
Five groups of 'Cuixiang' kiwifruit (270 fruit in each group) were obtained from Zhouzhi County, Shaanxi Province, China, for NH (116 d after flowering; August 27, 2022) and DH for one to four weeks (D1, D2, D3, and D4). NH samples were used as a control. To ensure biological replicates, 30 healthy plants were selected from the orchard, with every ten plants constituting one biological replicate. Nine fruits of uniform size, proper shape, similar color, free of pests and mechanical damage, and with the same maturity level were randomly picked from each plant during the specified harvesting time. The detailed sampling procedure is shown in Supplementary Fig. S1. 2,6-Dichloroindophenol, ascorbic acid, Folin-phenol, and other reagents are analytical grade, if not otherwise stated.
Post-ripening treatment of samples
-
The kiwifruits from each harvest time were divided into three groups; the first group of samples was retained after harvest. These AH samples were named AH-NH, AH-D1, AH-D2, AH-D3, and AH-D4, with corresponding firmness values of 113.73, 108.93, 107.27, 106.29, and 94.93 N, respectively (Supplementary Fig. S2a). The second group of samples was allowed to post-ripen at 22 °C and 90% relative humidity until edible, reaching a firmness of 5 ± 1 N. These RTP samples were named RTP-NH, RTP-D1, RTP-D2, RTP-D3, and RTP-D4. The third group of samples was stored at 0–2 °C and 95% relative humidity. When the firmness decreased to 15 ± 3 N, they were transferred to an incubator at 22 °C and 90% relative humidity to post-ripen until edible, reaching a firmness of 5 ± 1 N. This group of LTP samples was named LTP-NH, LTP-D1, LTP-D2, LTP-D3, and LTP-D4. All samples were peeled, pulped, homogenized, and then stored at −40 °C before the analysis of functional properties and −80 °C before metabolomics analysis.
Determination of physicochemical properties
-
TSS was determined based on the method of Li et al.[15], and the results were expressed in %. Total sugar content (TSC) was determined by direct titration based on the method of Zhang et al.[16], and the results were expressed in %. Titratable acid content (TAC) was determined by acid-base titration[17], and the results were expressed in g/kg. DMC was determined based on the method of Favre et al.[18]. Detailed assay procedures for TSS, TAC, and DMC are provided in the Supplementary Material.
Determination of bioactive compounds
-
Ascorbic acid content (AAC) was measured by using 2,6-dichlorophenolindophenol titration based on a procedure documented by Xu et al.[19]. The results were expressed on a fresh weight basis and expressed as g/kg. Total polyphenol content (TPC) and total flavonoid content (TFC) were measured via Folin-Ciocalteu colorimetry and aluminum chloride colorimetry, respectively[20,21], and the results were expressed on a fresh weight basis and expressed as g gallic acid equivalents/kg (g/kg) and g catechin equivalents/kg (g/kg), respectively. Detailed assay procedures for AAC, TPC, and TFC are provided in the Supplementary Material.
Determination of antioxidant activity
-
1,1-diphenyl-2-picryl-hydrazyl (DPPH) radical scavenging activity, 2,2′-azino-bis(3-ethylbenzothiazoline-6-sulfonic acid) (ABTS) free radical scavenging activity, and ferric reducing antioxidant power (FRAP) were measured based on the method of Lin et al.[22]. The results were expressed on a fresh weight basis and expressed as mmol Trolox equivalent/kg (mmol/kg). Detailed assay procedures are provided in the Supplementary Material.
Widely targeted metabolomics analysis
-
The widely targeted metabolomics analysis was performed using ultra-high performance liquid chromatography (Waters, Milford, USA) coupled to a Q-Exactive HF mass spectrometer equipped with a heated electrospray ionization (ESI) source (Thermo Fisher Scientific, Waltham, MA, USA) (UPLC-ESI-MS/MS) by reference to the sample extraction, liquid chromatography and mass spectrometry conditions described by Wei et al.[23]. The homogenized kiwifruit samples stored at −80 °C were vacuum freeze-dried (−50 °C, 48 h). 0.1 g freeze-dried sample was dissolved in 2.4 mL aqueous methanol (70%, −20 °C) and vortexed for 30 s every 30 min for a total of six cycles. The resulting solution was centrifuged (13,400 g, 3 min) to obtain the supernatant, which was filtered using a 0.22 μm microporous filter membrane (SCAA-104, Shanghai ANPEL, China) and subsequently subjected to metabolite analysis. We employed an ExionLC AD ultra-high-performance liquid chromatography (UPLC) system (Sciex, USA) equipped with an SB-C18 column (1.8 μm, 2.1 mm × 100 mm, Agilent, USA) for analysis. The injection volume was 4 μL, the column temperature was maintained at 40 °C, and the flow rate was set at 0.35 mL/min. The mobile phase consisted of phase A (ultrapure water with 0.1% formic acid) and phase B (acetonitrile with 0.1% formic acid). The gradient elution program was as follows: the proportion of mobile phase B increased linearly from 5% to 95% from 0 to 9 min, was maintained isocratically at 95% for 1 min, then decreased back to 5% from 10 to 11.1 min, and was finally held at 5% for equilibration until 14 min. The analysis was carried out using a 4500 QTRAP triple quadrupole linear ion trap mass spectrometer (Applied Biosystems, USA). The electrospray ionization (ESI) source temperature was set at 550 °C. The ion spray voltage was set at 5,500 V (positive ion mode) and –4,500 V (negative ion mode). The source gas I, gas II, and curtain gas were set to 50, 60, and 25 psi, respectively. Triple quadrupole (QQQ) scans were acquired in multiple reaction monitoring (MRM) mode with the collision gas (nitrogen) set to medium. Declustering potential (DP) and collision energy (CE) were optimized for each MRM transition. Specific MRM transitions were monitored for each period according to the metabolites eluted. Metabolite identification was performed via the MetWare MWDB in-house database, with confirmation based on secondary spectra, retention time, and fragmentation patterns after interference removal. Specific MRM transitions were used to exclude non-target ions. Quantification was achieved through the integration and correction of all chromatographic peak areas.
Statistical analysis
-
All physicochemical analyses were performed at least three times in parallel. The data obtained were subjected to one-way ANOVA followed by Duncan's multiple comparisons (p < 0.05) using SPSS 20 (IBM, Armonk, New York, USA). Metabolomics data were analyzed and plotted using the Metware Cloud Platform. The validity of the OPLS-DA models was checked by permutation tests (n = 200).
-
The physicochemical indexes of kiwifruit samples are shown in Table 1. TSS and total sugar content of AH gradually increased with extended DH time, reaching a maximum value (8.76% and 5.49%) at D4, which was consistent with 'autumn sense' hardy kiwifruit with 4–11 d of DH[6]. Seventy-six sugar metabolites were identified (Supplementary Table S1). Compared with AH-NH, only four sugar metabolites exhibited significant differences in DH samples, with most showing a down-regulated trend. However, the majority of other sugar metabolites demonstrated a trend of slight increase. Their combined effect may be the primary reason for the overall increased trend in TSC observed in the DH samples. Moreover, it showed a gradual decrease in RTP and LTP with the DH time. This is consistent with the observation that most differential saccharide accumulation metabolites showed down-regulation in DH samples of the RTP and LTP groups, and most other sugar metabolites exhibited a trend of slight reduction (Supplementary Table S1 and Table 2).
Table 1. Effect of delayed harvesting on physicochemical properties of kiwifruit with different treatments.
Indicator Treatment NH D1 D2 D3 D4 Total soluble solids content (%) AH 8.04 ± 0.05Bbc 7.91 ± 0.07Cc 7.95 ± 0.07Cc 8.16 ± 0.05Bb 8.76 ± 0.10Ca RTP 18.10 ± 0.09Aa 17.07 ± 0.12Ac 17.60 ± 0.10Ab 16.66 ± 0.08Ad 16.93 ± 0.06Ac LTP 18.00 ± 0.01Aa 16.46 ± 0.05Bb 16.00 ± 0.10Bd 16.15 ± 0.07Ac 15.74 ± 0.05Be Total sugar content (%) AH 3.11 ± 0.28Bc 4.30 ± 0.12Cb 4.40 ± 0.49Bb 4.41 ± 0.35Cb 5.49 ± 0.25Ca RTP 12.38 ± 0.31Aa 11.03 ± 0.32Ab 11.35 ± 0.26Ab 11.25 ± 0.24Ab 12.26 ± 0.28Aa LTP 12.40 ± 0.29Aa 9.81 ± 0.53Bc 11.34 ± 0.50Ab 10.09 ± 0.25Bc 11.10 ± 0.51Bb Titratable acid content (g/kg) AH 10.86 ± 0.10Ad 10.85 ± 0.10Ad 11.43 ± 0.11Ac 12.16 ± 0.06Ab 12.56 ± 0.04Aa RTP 10.52 ± 0.04Ac 10.42 ± 0.02Ad 11.00 ± 0.08Ab 11.32 ± 0.04Ba 11.38 ± 0.02Ba LTP 9.36 ± 0.12Bb 9.36 ± 0.08Bb 9.40 ± 0.03Bb 9.46 ± 0.06Cb 9.96 ± 0.04Ca Dry matter content (%) AH 20.77 ± 0.18Aa 18.60 ± 0.75ABb 18.54 ± 1.04Ab 17.84 ± 0.40Ab 17.67 ± 0.66Ab RTP 21.01 ± 1.06Aa 19.40 ± 0.79Aab 19.23 ± 0.19Aab 18.25 ± 0.49Ab 18.37 ± 1.75Ab LTP 19.22 ± 0.45Ba 18.04 ± 0.31Bb 18.03 ± 0.99Ab 18.06 ± 0.10Ab 17.39 ± 0.15Ab AH: at harvest; RTP: room temperature post-ripening; LTP: low temperature post-ripening; NH: normal harvest. D1, D2, D3, and D4 were delayed harvests for one, two, three, and four weeks, respectively. Results are presented as mean ± standard deviation. Different superscript capital letters indicate statistically significant differences between treatment groups, while different superscript lowercase letters denote significant differences among samples with varying delayed harvest times within the same treatment group (p < 0.05). Table 2. Distribution of up-regulation and down-regulation of DAKAMs, DLCAMs, DSAMs, and DOAMs in different comparison groups.
Compounds AH RTP LTP NH vs. D2 NH vs. D4 NH vs. D2 NH vs. D4 NH vs. D2 NH vs. D4 DAKAMs 1↑, 8↓ 1↑, 14↓ 1↑, 2↓ 2↑, 5↓ 4↑, 2↓ 5↑, 6↓ Tri-p-coumaroyl Spermidine − − − − ↑ ↑ 4-Hydroxymandelonitrile − ↓ − − − − Candicine − − − − − ↑ N',N''-Diferuloylspermidine ↑ ↑ − − − − N1,N8-Bis(sinapoyl)spermidine − − − − − ↑ p-Coumaroylagmatine − − − ↓ − − 1-O-p-Coumaroyllysine − − − ↓ − ↓ 3,5-Dihydro-2H-Furo(3,2-C)Quinolin-4-One ↓ ↓ − − − − 8-hydroxyquinoline − ↓ − − − − N-Oleoylethanolamine − − ↑ ↑ − − Stearamide ↓ ↓ − − − − 3-amino-2-naphthoic acid ↓ ↓ − − − − Zarzissine − − − ↓ − ↓ alanine betaine ↓ ↓ − − − ↓ O-Phosphocholine − ↓ − − − − Putrescine − − − − − ↑ Triacanthinapioside − − − − ↓ ↓ 2-Amino-4-dihydroxy octadecyl galactoside − − − − − ↑ O-Phosphorylethanolamine − − − ↑ − − Agmatine − − − − ↑ − Nicotianamine − − − − ↓ − N-Acetylputrescine − − − − ↑ − Α-hydroxyquinoline − ↓ − − − − Pyran(3,4-b)indole-2-ketone ↓ ↓ − − − − 3-Indoleacrylic acid ↓ ↓ − − − − 1-Methoxy-indole-3-acetamide ↓ ↓ − − − − Indole-3-carboxaldehyde − ↓ − − − − Methoxyindoleacetic acid ↓ ↓ − − − − Pterolactam − − − − − ↓ Indole-3-carboxylic acid − − ↓ ↓ − − Indole-5-carboxylic acid − − ↓ ↓ − − N-Acetyl-5-hydroxytryptamine − − − − − ↓ Indole − ↓ − − ↑ − DLCAMs 2↑, 0↓ 3↑, 3↓ 0↑, 2↓ 0↑, 8↓ 0↑, 0↓ 2↑, 4↓ Esculetin (6,7-Dihydroxycoumarin) − − − ↓ − ↓ Esculetin-6-O-quinic acid − − − ↓ − ↓ Fraxidin (8-Hydroxy-6,7-dimethoxycoumarin) − − − ↓ − − Isofraxidin − − − ↓ − − 7-Hydroxycoumarin;Umbelliferone − ↓ − − − − 6,7-Dihydroxy-4-methylcoumarin − − − ↓ − − Chestnutlignansoide − − ↓ − − − Erythro-Guaiacylglycerol-β−O-4'-dehydrodisinapyl Ether − − ↓ ↓ − − Secoisolariciresinol-9'-O-glucoside − ↑ − − − ↑ Divanillyltetrahydrofuran − − − ↓ − − Syringaresinol-4'-O-(6''-acetyl)glucoside − − − ↓ − − Epipinoresinol ↑ − − − − − Pinoresinol ↑ − − − − − Syringaresinol − ↑ − − − − Medioresinol-4'-O-(6'''-acetyl)glucoside − ↓ − − − − Syringic acid 4-O-rhamnoside − − − − − ↑ Secoisolariciresinol-9'-O-xyloside − ↑ − − − − Pinoresinol-4,4'-O-di-O-glucoside − ↓ − − − − Medioresinol − − − − − ↓ Medioresinol-4,4'-di-O-glucoside − − − − − ↓ DSAMs 0↑, 1↓ 1↑, 3↓ 0↑, 0↓ 0↑, 3↓ 0↑, 1↓ 0↑, 5↓ D-Threonic acid − ↓ − ↓ − ↓ 3-(2-MethylButyryl)Sucrose-2-O-Acetate − ↓ − ↓ − ↓ D-Glucose 1,6-bisphosphate − − − − − ↓ D-Fructose-1,6-biphosphate − − − − − ↓ DMelezitose O-rhamnoside − ↓ − ↓ ↓ ↓ Laminaran − ↑ − − − − 3'-Fucosyllactose ↓ − − − − − DOAMs 0↑, 7↓ 0↑, 10↓ 0↑, 5↓ 5↑, 13↓ 0↑, 3↓ 1↑, 11↓ α−Ketoglutaric acid − − − ↓ − − Jasmonic acid ↓ ↓ ↓ ↓ ↓ ↓ Methylmalonic acid − − − ↓ − − Succinic acid − − − ↓ − − 2-Methylsuccinic acid − ↓ − ↑ − ↓ 2-Isopropylmalic acid ↓ − − ↓ − − Ethylmalonic acid − ↓ − ↑ − ↓ 2-Propylmalic acid ↓ − − ↓ − − 3-Isopropylmalic acid ↓ − − ↓ − − γ−Aminobutyric acid − − − − − ↓ 2-Aminoheptanedioic acid − − − ↓ − ↓ Monomethyl succinate − ↓ − ↑ − ↓ 4-Oxoisotretinoin ↓ ↓ ↓ ↓ ↓ ↓ Dimethylmalonic acid − ↓ − ↑ − ↓ 6-Aminocaproic acid − ↓ − − − − 2,2-Dimethylsuccinic acid ↓ ↓ ↓ ↓ − ↓ Phosphoenolpyruvate − − − ↑ − ↑ Psoromic acid − − ↓ ↓ − − Creatine − − − − − ↓ 1-Aminocyclopropane-1-carboxylic acid − − − ↓ − − 3-Hydroxy-3-Methyl-2-Oxopentanoic acid − ↓ − − − − 3-Ureidopropionic acid ↓ ↓ − − ↓ ↓ Aminomalonic acid − − − ↓ − − DAKAMs: differential alkaloid accumulating metabolites; DLCAMs: differential lignans and coumarins accumulation metabolites; DSAMs: differential saccharide accumulation metabolites; DOAMs: differential organic acid accumulating metabolites. AH: at harvest; RTP: room temperature post-ripening; LTP: low temperature post-ripening; NH: normal harvest. D2 and D4 were delayed harvests for two and four weeks, respectively. Acidity and dry matter
-
As shown in Table 1, the TAC of all samples increased with increasing DH time, which was consistent with an increase in TAC of pomelo fruit with increasing harvest time[24]. Eighty-five organic acid metabolites were identified (Supplementary Table S1). Compared with the NH sample, only 23 organic acid metabolites exhibited significant differences in DH samples, with most showing a down-regulated trend. However, other organic acid metabolites exhibited slight variations, and their combined effects may be the primary reason for the overall declining trend in TAC observed in the DH samples. The specific underlying mechanisms require systematic investigation in future studies. DMC of all groups reached its highest values (AH: 20.77%, RTP: 21.01%, LTP: 19.22%) at NH, which may be because of the increase in water content of delayed-harvest fruit[25]. There was no difference in DMC among delayed-harvest kiwifruit for each group, which suggested that DMC did not change significantly with DH time. In addition, TSS, TAC, and DMC of LTP were comparatively lower than those of RTP, which can be attributed to the fact that fruit requires more energy to cope with cold stress, necessitating enhanced sugar and amino acid metabolism[25].
In summary, TAC increased in both RTP and LTP fruit with prolonged DH time, while TSS decreased. This consistent shift toward higher acidity and lower sweetness reduced the sugar-acid ratio, which likely contributed to the fruit's prominent sour taste. The results differed from previous studies in which DH caused a different degree of increase and decrease in total sugar content and TAC, respectively[2,10]. It is proposed that these discrepancies may be primarily attributed to the genotypic variations in maturity physiology among kiwifruit cultivars. The metabolic pathways that govern the balance between TSS accumulation and TAC degradation are highly gene expression-specific. The 'Cuixiang' kiwifruit may exhibit unique metabolic expression under DH, leading to this phenomenon which is distinct from previous studies. Secondary to this intrinsic factor, local pre-harvest conditions (e.g., temperature and light) and orchard practices likely acted as modifiers, influencing the extent of these cultivar-specific expressions[26]. Therefore, further studies on the interaction between genotype and environment are still required to develop precise DH strategies.
Effect of DH on bioactive compounds
AAC
-
Kiwifruit is known as the 'King of Vitamin C', and therefore AAC is an important parameter for evaluating fruit quality. In both AH and RTP, DH led to a decrease in AAC in most kiwifruit samples compared with NH (Fig. 1a). This pattern resembles the AAC changes in pomelo fruit after one to two months of DH[24], which might be related to enzymatic degradation, physical solubilization, and oxidative decomposition of ascorbic acid of fruit after DH[5]. For LTP, its level increased by 15.66% to 30.01% following DH, and the highest value was reached at D2 with 0.79 g/kg. This may be because DH fruit has lower initial oxidative stress or enhanced recycling capacity (via the glutathione-ascorbate cycle) upon cold exposure[27]. In addition, AAC of LTP was reduced by 33%, 1%, 18%, 20%, and 21%, respectively, compared to RTP at the same harvesting time, which was similar to the decline of AAC in 'Xuxiang' kiwifruit after storage at 1 °C for 90 d[25]. This may be because ascorbic acid can act as an electron donor to mitigate cold-induced hydrogen peroxide damage, which in turn leads to its severe loss[26]. The above results suggest that D2 can improve AAC of both RTP and LTP, which may provide theoretical guidelines for obtaining kiwifruit with high AAC.
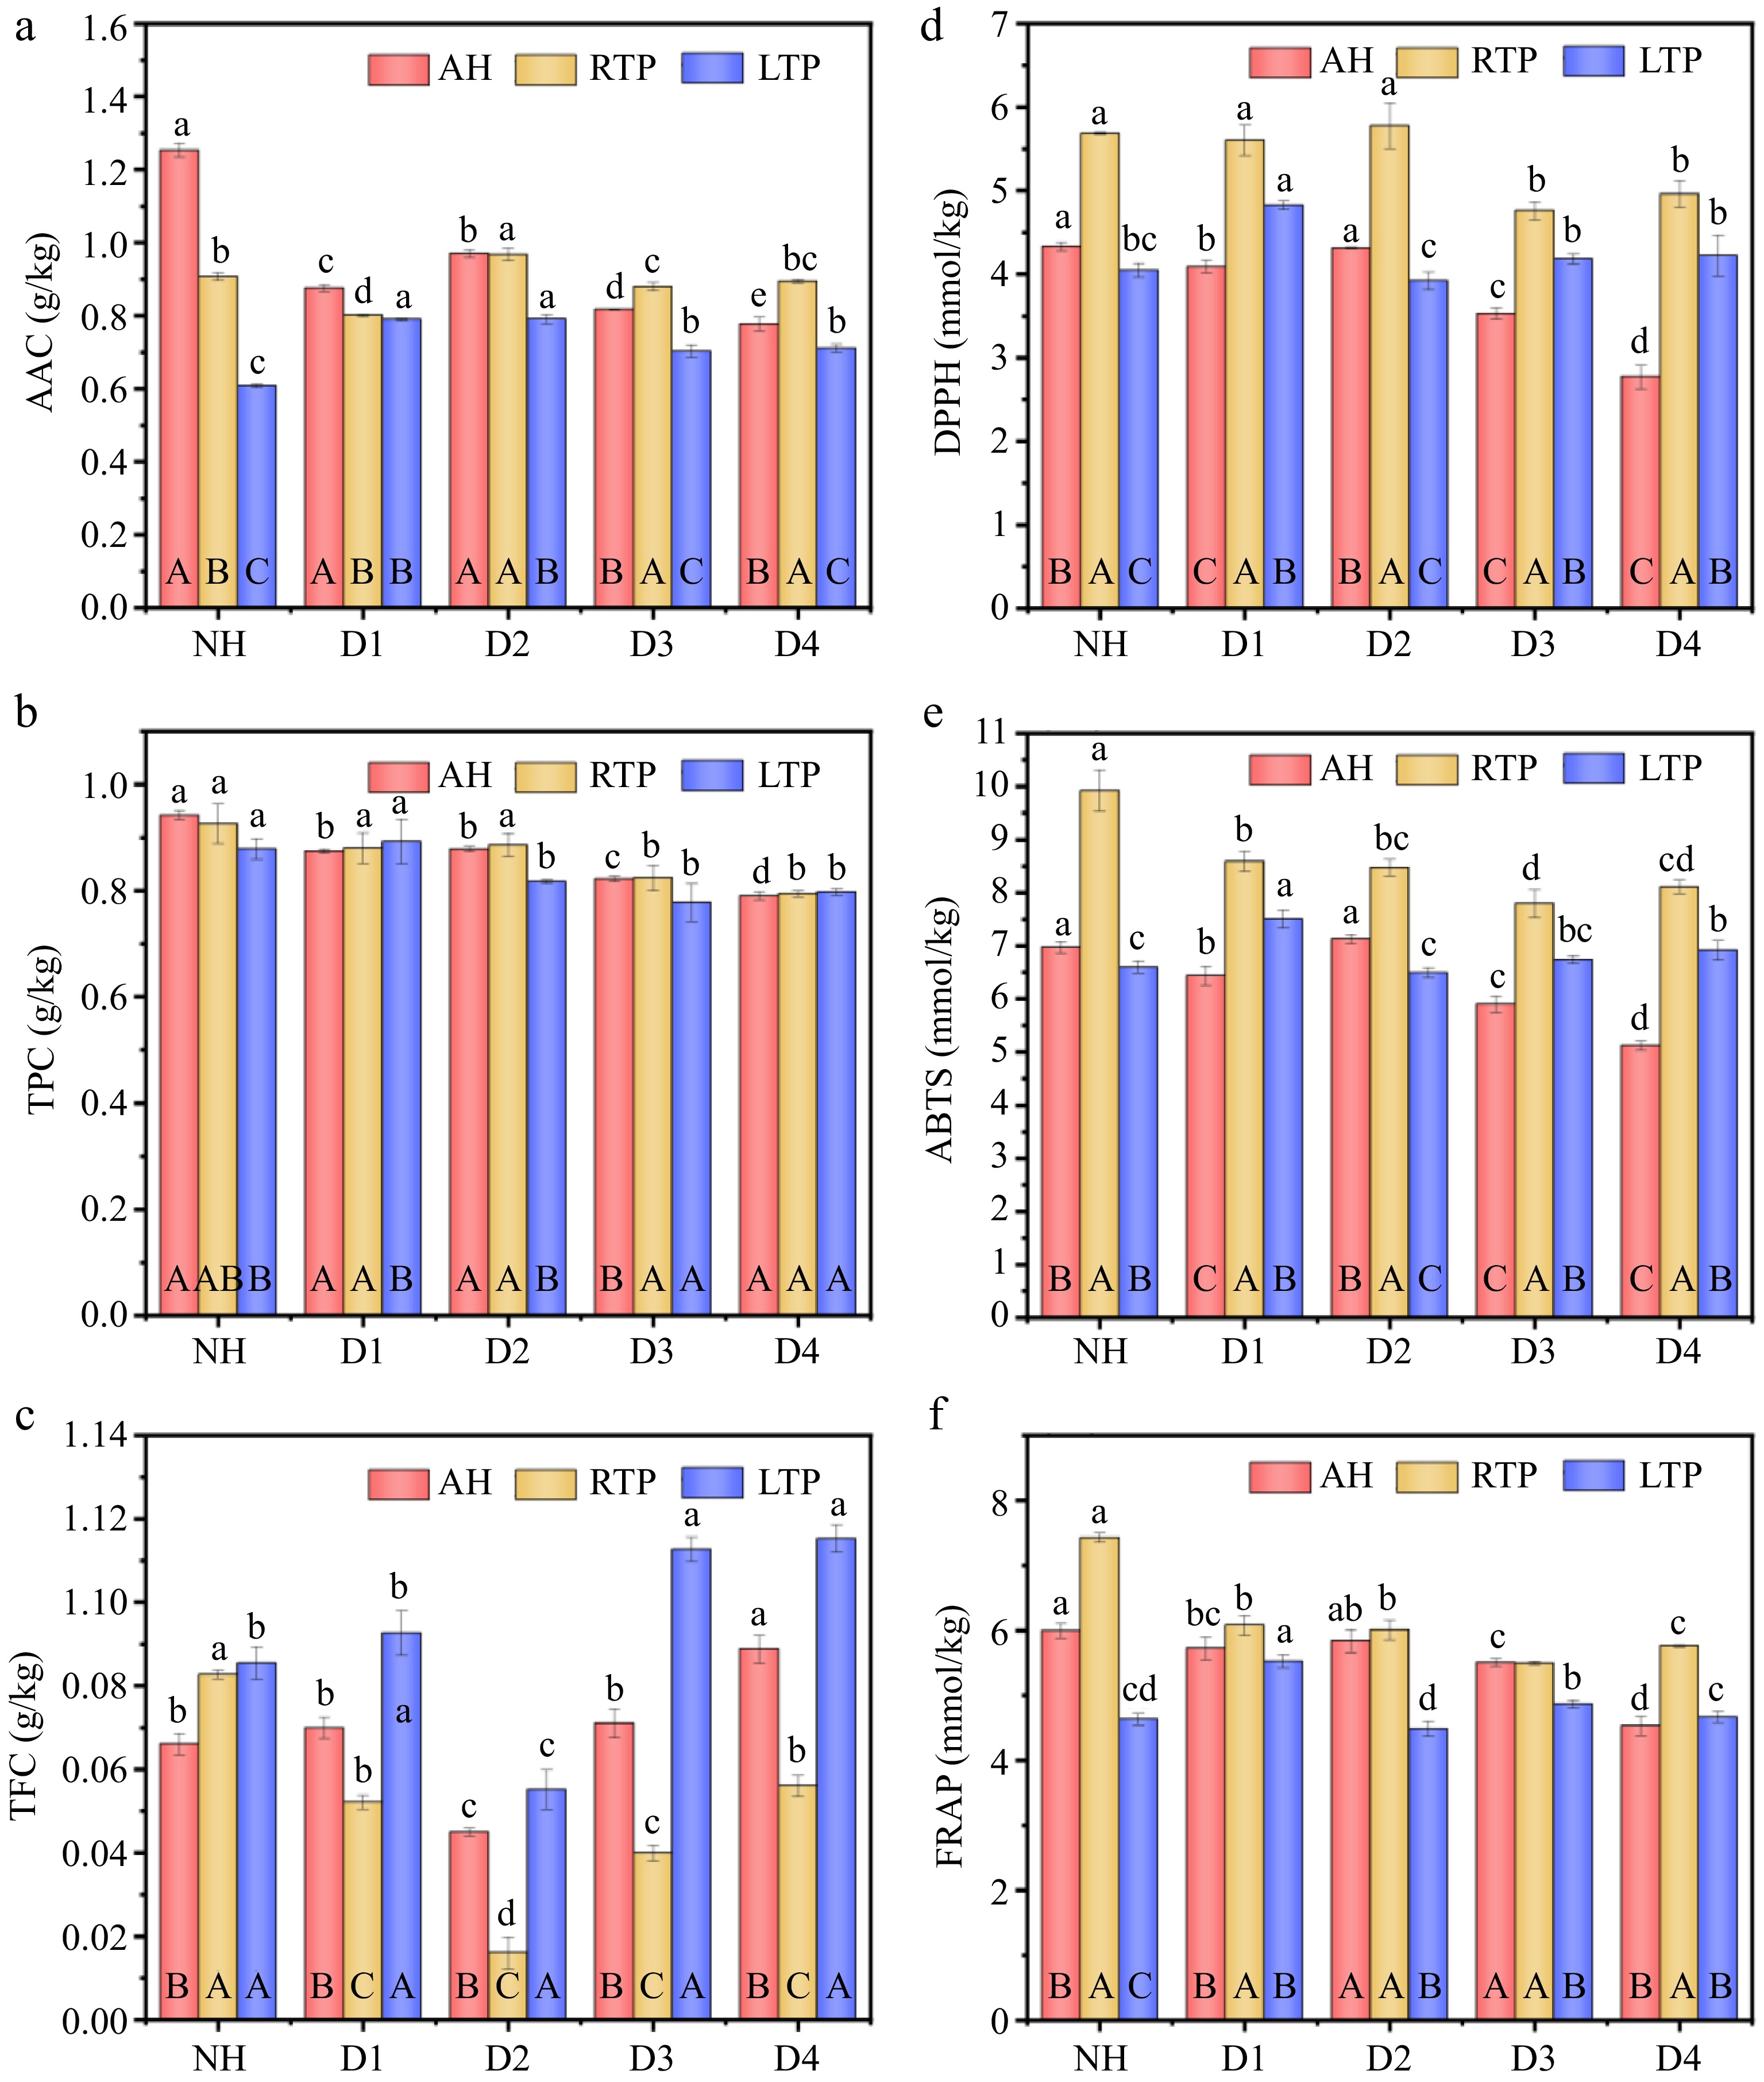
Figure 1.
(a) AAC, (b) TPC, (c) TFC, (d) DPPH, (e) ABTS, and (f) FRAP of AH, RTP, and LTP kiwifruit samples with different delayed harvesting times. AH: at harvest; RTP: room temperature post-ripening; LTP: low temperature post-ripening; NH: normal harvest. D1, D2, D3, and D4 were delayed harvests for one, two, three, and four weeks, respectively. AAC: ascorbic acid content; TPC: total polyphenol content; TFC: total flavonoid content; FRAP: ferric reducing antioxidant power. The error is the standard deviation of the mean; different lowercase letters represent significant differences (p < 0.05) among samples with different DH times in the same treatment group; different uppercase letters represent significant differences (p < 0.05) between samples from different treatment groups at the same DH time.
TPC and TFC
-
Phenolics, a key class of secondary metabolites abundant in kiwifruit, play crucial roles in fruit development and disease resistance, and also serve as established indicators of nutritional quality[22]. TPC decreased by 4%–7%, 11%–13%, and 9%–16% from D2 to D4 compared to NH in AH, RTP, and LTP, respectively (Fig. 1b, c). This trend is similar to that observed in section Phenolics, in which the number of down-regulated phenolic acid metabolites increased with prolonged DH time. This may be because the degradation of phenolics is used to alleviate oxidative stress during DH of fruit and to maintain intracellular homeostasis after exposure to senescence stress[1]. In addition, there was no significant difference in TPC between D1 and NH in the RTP and LTP. This indicates that D1 does not affect the TPC of kiwifruit after post-ripening. Notably, there was no significant difference in TPC between RTP and LTP groups for most DH times, indicating that LTP may not lead to a significant loss of TPC.
TFC of all groups showed an overall trend of decreasing in NH–D2 and then increasing in D2–D4, which was similar to the TFC change of 'Nero' chokeberry during DH for three weeks[26]. The lowest TFC in RTP fruit at D1–D4 was due to rapid ripening-induced ethylene synthesis, which redirected resources toward cell wall hydrolysis and glycolysis—promoting softening and sugar accumulation but competitively inhibiting phenylpropanoid flux; while RTP accelerated polyphenol oxidase degradation of existing flavonoids[5]. Moreover, the highest TFC was found in LTP at each harvest stage, which might be due to up-regulation of gene expression for enzymes encoding flavonoid synthesis under low-temperature stress, leading to accumulation of more flavonoids to help kiwifruit resist stress such as bacteria and low-temperature[28]. The observation that the number of up-regulated flavonoid metabolites in LTP is greater than that in RTP in section Phenolics provides further support for this conclusion.
Effect of DH on antioxidant activity
-
As shown in Fig. 1d–f, in both AH and RTP, NH had the greatest antioxidant activity, and antioxidant activity generally weakened gradually with DH time. The highest decreases in DPPH, ABTS, and FRAP were observed in D4 (36%, 27%, 24%) and D3 (16%, 21%, 26%) of AH and RTP, respectively. This may result from DH-induced respiratory increase, causing electron leakage in the mitochondrial electron transport chain[29], and the resulting reactive oxygen species (e.g., superoxide and hydrogen peroxide) deplete antioxidants during scavenging. This explanation is supported by the observation that the number of phenolic acid metabolites and terpenoid metabolites with significant down-regulation in RTP and LTP increases with DH duration (see section Terpenoid and Phenolics). Compared to the NH group, DH treatments in the LTP group generally maintained or enhanced antioxidant capacity, with the peak values for all three assays (DPPH: 0.70 mmol/kg; ABTS: 7.51 mmol/kg; FRAP: 5.53 mmol/kg) recorded in the D1. This might be related to an increase in AAC and TFC under low-temperature stress (Fig. 1a, c). Therefore, DH may not be conducive to the maintenance of antioxidant activity of AH and RTP, but had a positive effect on the maintenance or improvement of LTP.
Full mass spectrometric analysis of metabolites
-
By integrating all the data presented above, significant stage-specific differences in physicochemical properties, bioactive compounds, and antioxidant activity were identified in NH, D2, and D4. Hence, kiwifruit samples from these three periods under different treatments were selected for widely targeted metabolomics analysis via UPLC-ESI-MS/MS to explore the impacts of DH on fruit metabolites. About 1,534 metabolites were identified in all samples (Supplementary Table S1) and categorized into 12 classes (Supplementary Fig. S3a), including 457 amino acids and derivatives, 177 lipids, 167 flavonoids, 154 phenolic acids, 149 others (76 saccharides, 19 vitamins, 31 others, nine ketone compounds, four chromone, four lactones, four alcohol compounds, two aldehyde compounds), 99 alkaloids, 97 terpenoids, 86 organic acids, 73 lignans and coumarins, 60 nucleotides and derivatives, ten tannins and five quinones. Total ion flow plots were highly overlapping (Supplementary Fig. S4), and all Pearson's correlation coefficients were ≥ 0.77 (Supplementary Fig. S3b), which showed excellent data repeatability and reliability. The principal component analysis (PCA) results showed that three biological replicates of each sample were tightly clustered (Supplementary Fig. S3c), indicating good experimental repeatability. PC1 and PC2 explained 21.44% and 19.72% of the total variance, respectively (cumulative 41.16%). A clear separation along PC2 was observed in the score plot, corresponding to DH time, suggesting that PC2 may represent the impact of DH time on their metabolites.
Orthogonal partial least squares-discriminant analysis (OPLS-DA) of metabolites
-
In order to gain insight into metabolic differences among samples with different harvest times and identify differential accumulation metabolites (DAMs), OPLS-DA was used for pairwise comparisons of different DH samples in all groups, using the NH sample as a control. The prediction parameters R2Y and Q2 were > 0.89 for all comparison groups (Fig. 2a–f), indicating that it was stable and valid. After 200 substitution tests, the intersection points between the regression line of Q2 and the vertical axis were less than 0, indicating that there was no overfitting in the model and the model verification was effective (Supplementary Fig. S5). To analyze how DH influences metabolite evolution, DAMs among all comparison groups were further screened based on screening conditions (fold change (FC) ≥ 2 or FC ≤ 0.5, variable importance in projection (VIP) ≥ 1, and p < 0.05). As shown in Fig. 2g, the number of down-regulated metabolites in all comparison groups was higher than that of up-regulated. In addition, the greatest number of DAMs among different treatment groups were identified in the AH-NH vs. D4, RTP-NH vs. D4, and LTP-NH vs. D4, indicating that the most significant metabolite changes occurred in D4.
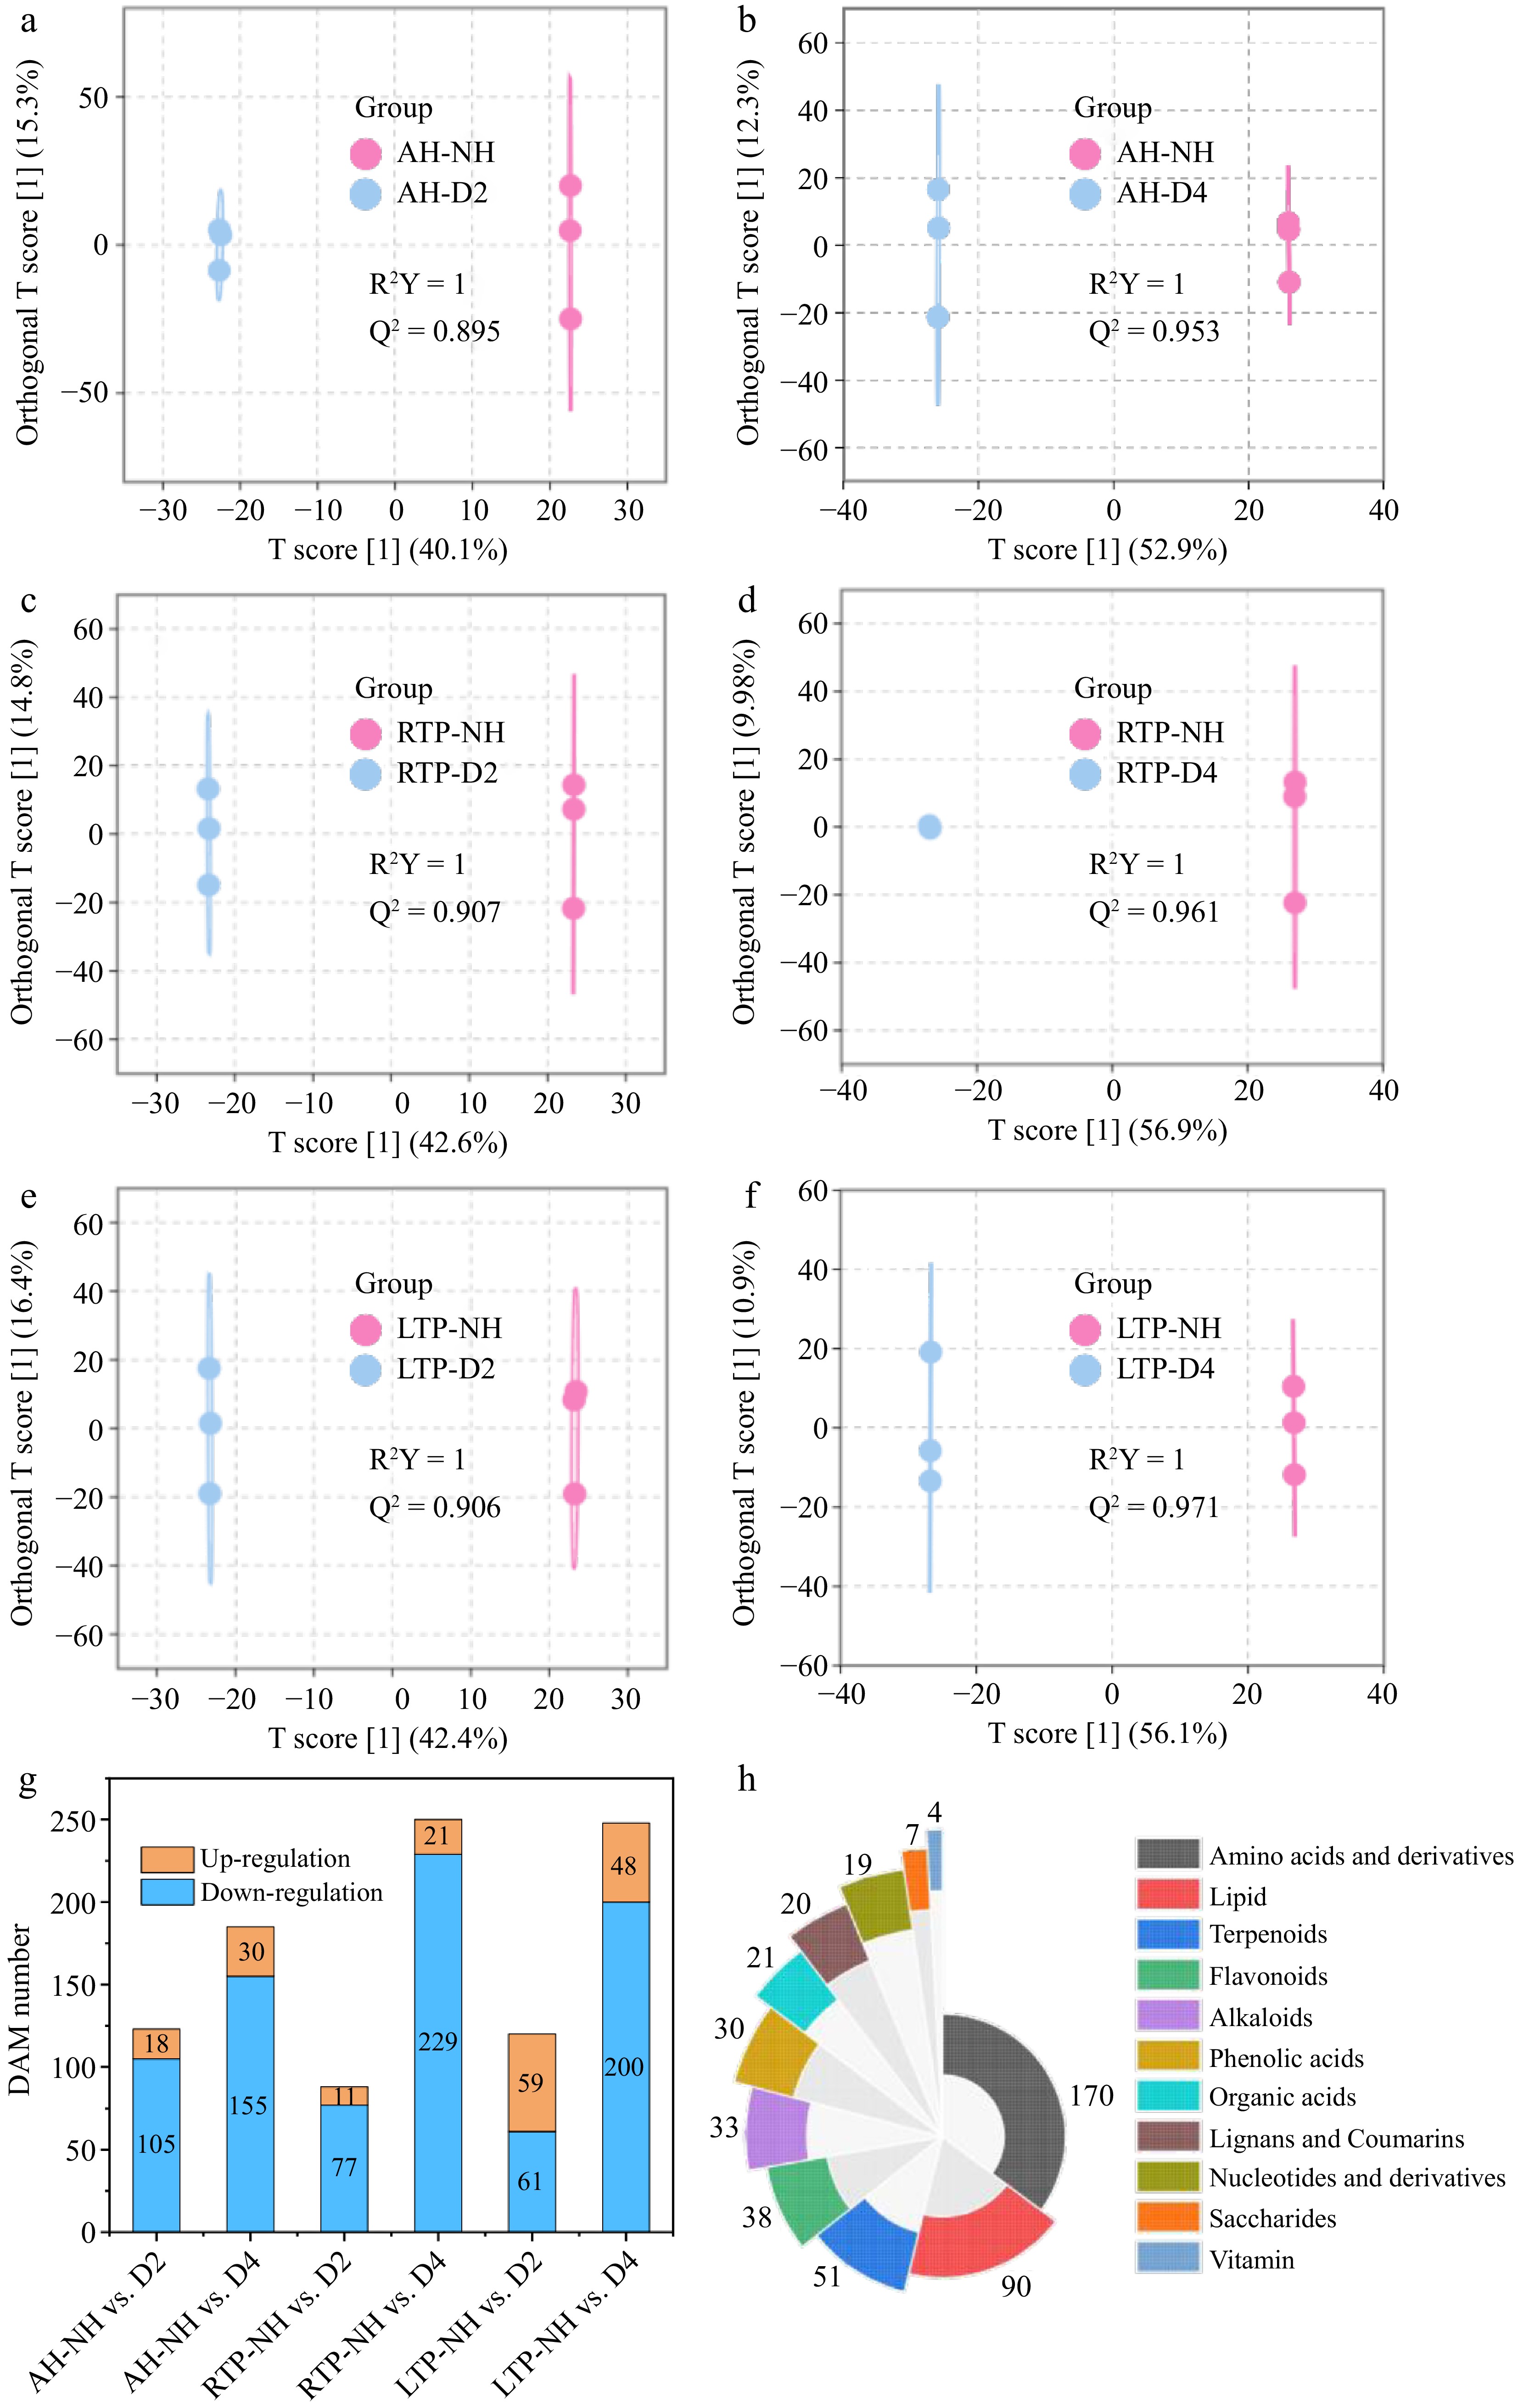
Figure 2.
(a)–(f) The score plots of OPLS-DA, (g) distribution of up-regulation and down-regulation, and (h) substance species of DAM of kiwifruit samples with different harvest times in all comparison groups. AH-NH vs. D2 and AH-NH vs. D4 represent normal harvest vs. two-week and four-week delayed harvest at harvest, respectively. RTP-NH vs. D2 and RTP-NH vs. D4 represent the comparisons between normal harvest and a two- or four-week delayed harvest following post-ripening at room temperature, respectively. LTP-NH vs. D2 and LTP-NH vs. D4 represent the comparisons between normal harvest and a two- or four-week delayed harvest following post-ripening at low temperature, respectively. AH: at harvest; RTP: room temperature post-ripening; LTP: low temperature post-ripening; NH: normal harvest. D2 and D4 were delayed harvests for two and four weeks, respectively. DAM: differential accumulation metabolites.
Analysis of DAMs
-
As shown in Fig. 2h, there were 485 major DAMs in all comparison groups, including 170 amino acids and derivatives, 90 lipids, 51 terpenoids, 38 flavonoids, 33 alkaloids, 30 phenolic acids, 23 organic acids, 20 lignans and coumarins, 19 nucleotides and derivatives, seven saccharides, and four vitamins. To better understand the effect of DH on metabolite changes in all groups, the main DAMs were visualized and analyzed in detail.
Amino acids and derivatives, and alkaloids
-
Amino acids and derivatives, as one of the main metabolites of fruit, affect their nutritional value; meanwhile, as precursors of flavor substances, they also affect the sensory properties of fruit[30]. As shown in Fig. 3a, a total of 170 differential amino acid accumulating metabolites (DAAMs) were identified in all comparison groups, of which 145 DAAMs were down-regulated. The down-regulated DAAMs number increased with the DH time, which may be attributed to two reasons: (1) some amino acids (e.g. L-threonine, AA140; L-lysine, AA71; L-asparagine, AA80) are involved in storage protein synthesis or provide energy for maintaining metabolic activities[30]; (2) some amino acids (e.g., L-phenylalanine, AA29; homoproline, AA290; L-ornithine, AA360) are consumed as a precursor of phenolic, alkaloid, and aroma compounds (Fig. 3b–d and Supplementary Table S2)[31]. In addition, only two DAAMs, γ-glutamylmethionine (AA73) and L-asparagine (AA80), existed in all comparison groups, and both showed a down-regulated trend (Fig. 3b–e). AA73 is an intermediate product of the γ-glutamyl cycle, which is closely related to the synthesis and regeneration of the antioxidant glutathione[32]. Its down-regulation may be associated with the activation of glutathione metabolic pathways, aiming to maintain the redox balance in cells after DH. AA80, serving as the most important nitrogen transport and storage form in higher plants, accumulates substantially in sink tissues (e.g., fruits) to provide a nitrogen source for the synthesis of proteins and other nitrogenous substances[33]. Its down-regulation after DH could be attributed to its degradation, whereby the released nitrogen and carbon skeletons were utilized to maintain fundamental cellular metabolism. Thus, they may be marker DAAMs of delayed-harvest kiwifruit (Supplementary Table S3). Compared to RTP, a greater number (12/87) of DAAMs were up-regulated in LTP, which may be initiated by cold perception via plasma membrane calcium receptors. This cascade orchestrates amino acid accumulation through integrated transcriptional, translational, epigenetic, and metabolic reprogramming, contributing to cold protection[34]. 3-Hydroxy-3-methylpentane-1,5-dioic acid, a known cold-responsive metabolite[35], was only up-regulated in LTP (Fig. 3d), supporting its potential as a marker DAAM for delayed-harvest kiwifruit under low-temperature (Supplementary Table S3).
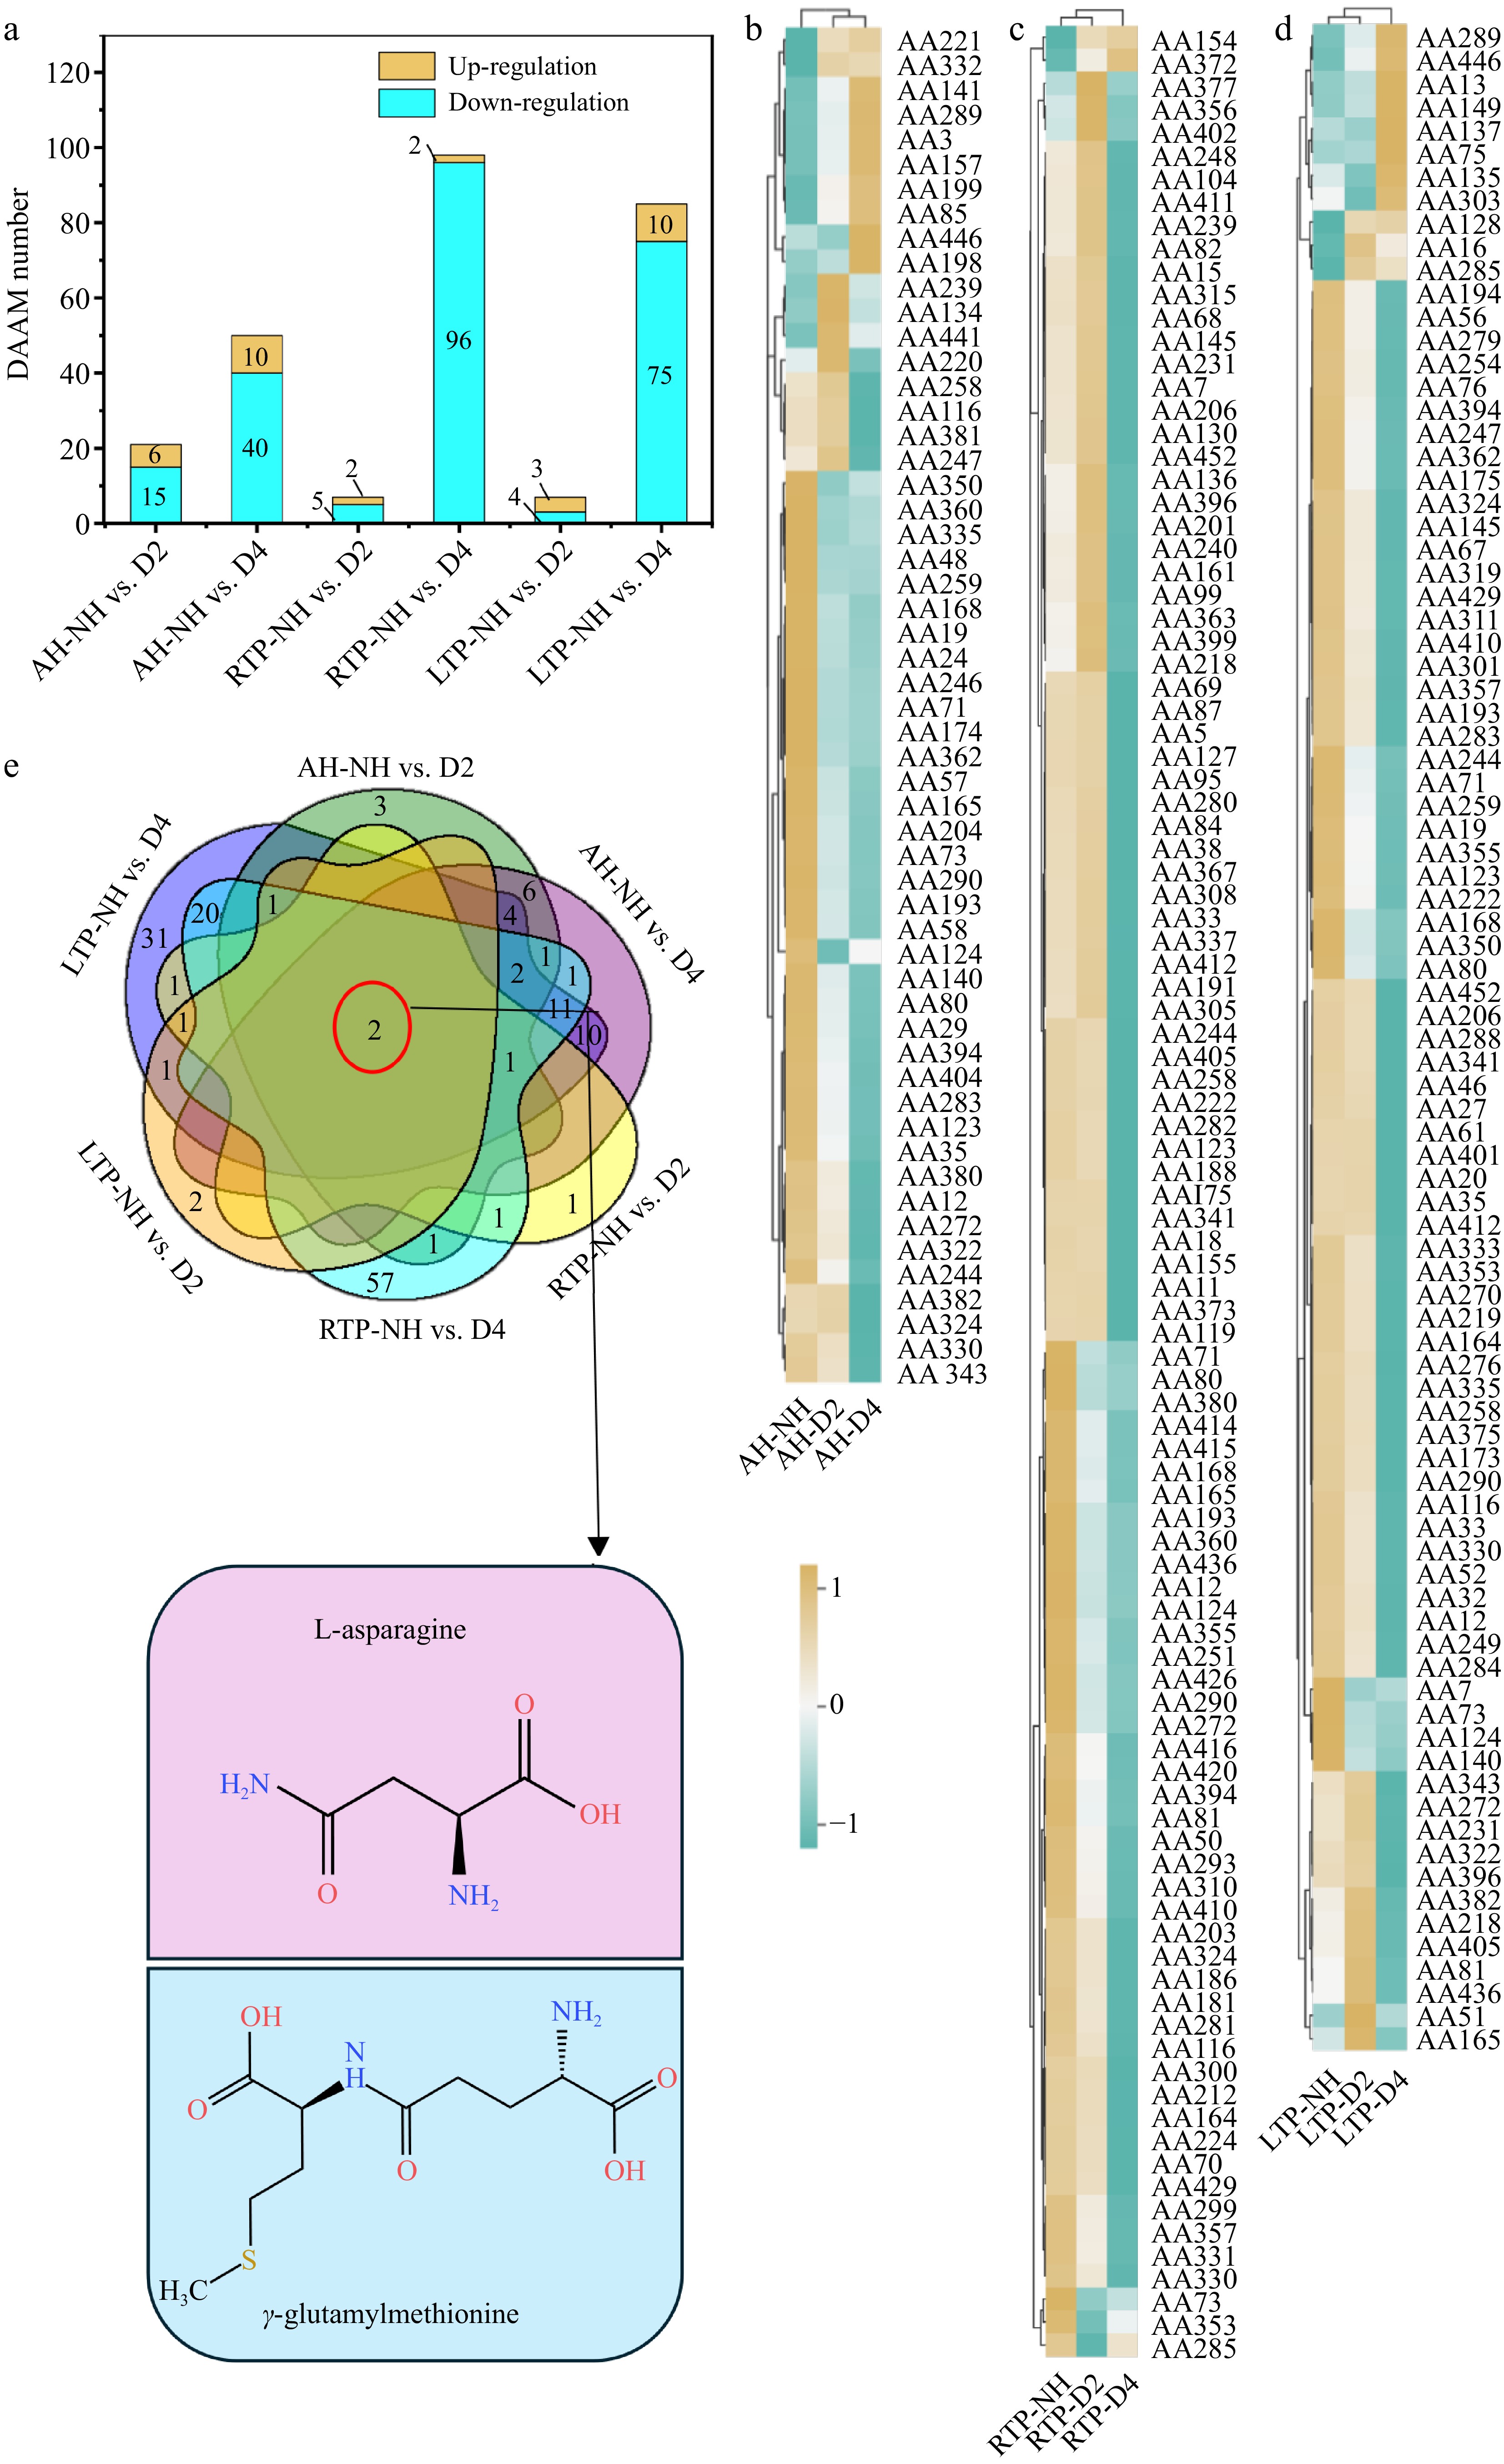
Figure 3.
(a) Distribution of up-regulation and down-regulation, (b)–(d) heatmaps, and (e) Venn plots of DAAM in different comparison groups. AH-NH vs. D2 and AH-NH vs. D4 represent normal harvest vs. two- and four-week delayed harvest at harvest, respectively. RTP-NH vs. D2 and RTP-NH vs. D4 represent the comparisons between normal harvest and a two-or four-week delayed harvest following post-ripening at room temperature, respectively. LTP-NH vs. D2 and LTP-NH vs. D4 represent the comparisons between normal harvest and a two-or four-week delayed harvest following post-ripening at low temperature, respectively. AH: at harvest; RTP: room temperature post-ripening; LTP: low temperature post-ripening; NH: normal harvest. D2 and D4 were delayed harvests for two and four weeks, respectively. DAAM: differential amino acid accumulating metabolites.
Alkaloids are particular secondary metabolites that are beneficial in plants for defense against aggression[36]. As shown in Table 2, 33 differential alkaloid accumulating metabolites (DAKAMs) were found in all comparison groups, and the number of down-regulated DAKAMs increased with the DH time. Alkaloids and their salts are almost always bitter, and their down-regulation can improve the sensory quality of fruit[37]. A higher number (5/11) of up-regulated DAKAMs (e.g., tri-p-coumaroyl spermidine, A12; and N1,N8-bis(sinapoyl)spermidine, A19) was observed in LTP, which might be because of enhanced activity of relevant alkaloid synthases to defend against cold damage during cold storage[38]. Phenolamides (e.g., A12, candicine, A19) were reported to exhibit superior antioxidant capacity compared to flavonoids and function as key regulators in plant development and abiotic stress response, such as cold and drought[36]. The up-regulation of A12 was only found in LTP, which may be one of the main reasons for improving or maintaining their antioxidant activity (Fig. 1d–f). Thus, A12 may be a marker of delayed-harvest kiwifruit in LTP (Supplementary Table S3).
Overall, the higher number of down-regulated DAAMs during DH may produce more flavor compounds, phenolic, and other functional substances, improving kiwifruit quality. Meanwhile, most alkaloidal substances showed down-regulation, which could reduce the bitter material basis of kiwifruit. In addition, during LTP, cold perception by plasma membrane calcium receptors activated sensors and downstream signaling, promoting amino acid accumulation and subsequent alkaloid synthesis.
Lipids
-
Lipids are a key class of biological components in fruit, closely related to their cell membrane composition, photosynthesis, cell signaling, and stress response[39]. They also serve as a carrier for fat-soluble vitamins and essential fatty acids, and act as precursor substances for aroma volatiles. Therefore, understanding the mechanisms of lipid metabolism is essential for enhancing both the health value and consumer appeal of fruit. As shown in Fig. 4a, 90 differential lipid accumulating metabolites (DLAMs) were identified in all comparison groups, and the number of down-regulated DLAMs (D2: 69/71, D4: 85/89) increased with the DH time. This may result from DH-induced membrane disruption and maturity, promoting lipid degradation via β-oxidation, lysophospholipases, and lipoxygenases to generate aromatic compounds and metabolic energy[40]. As shown in Fig. 4b, c, all comparison groups had 16 of the same DLAMs, including seven free fatty acids (LF), four glycerol esters (LG), four lysophosphatidylcholine (LPC), and one lysophosphatidylethanolamine (LPE), which all showed down-regulation. Thus, they may serve as marker DLAMs of delayed-harvest kiwifruit. More DLAMs (69/71) were down-regulated in LTP, which was consistent with lipid changes in bananas during low-temperature storage[41]. This likely results from the conversion of diglycerides and free fatty acids into triglycerides, mitigating oxidative damage from fruit development and chilling[39]. In addition, 1-α-linolenoyl-glycerol-3-O-glucoside (L91) was up-regulated only in LTP (Fig. 4d–f, and Supplementary Table S2), which suggested that it may be marker DLAM of delayed-harvest kiwifruit in LTP (Supplementary Table S3). However, DH's regulatory mechanisms on it during the low-temperature post-ripening stage, including key enzymatic activities in its biosynthesis and its relationship to fruit quality, require further analysis. Extended DH duration upregulated the sphingolipid 4-hydroxysphinganine (L3) in LTP-NH vs. D4, which is likely due to its dual function in membrane structure and programmed cell death regulation, and the low-temperature environment of plants facilitates its accumulation[28].
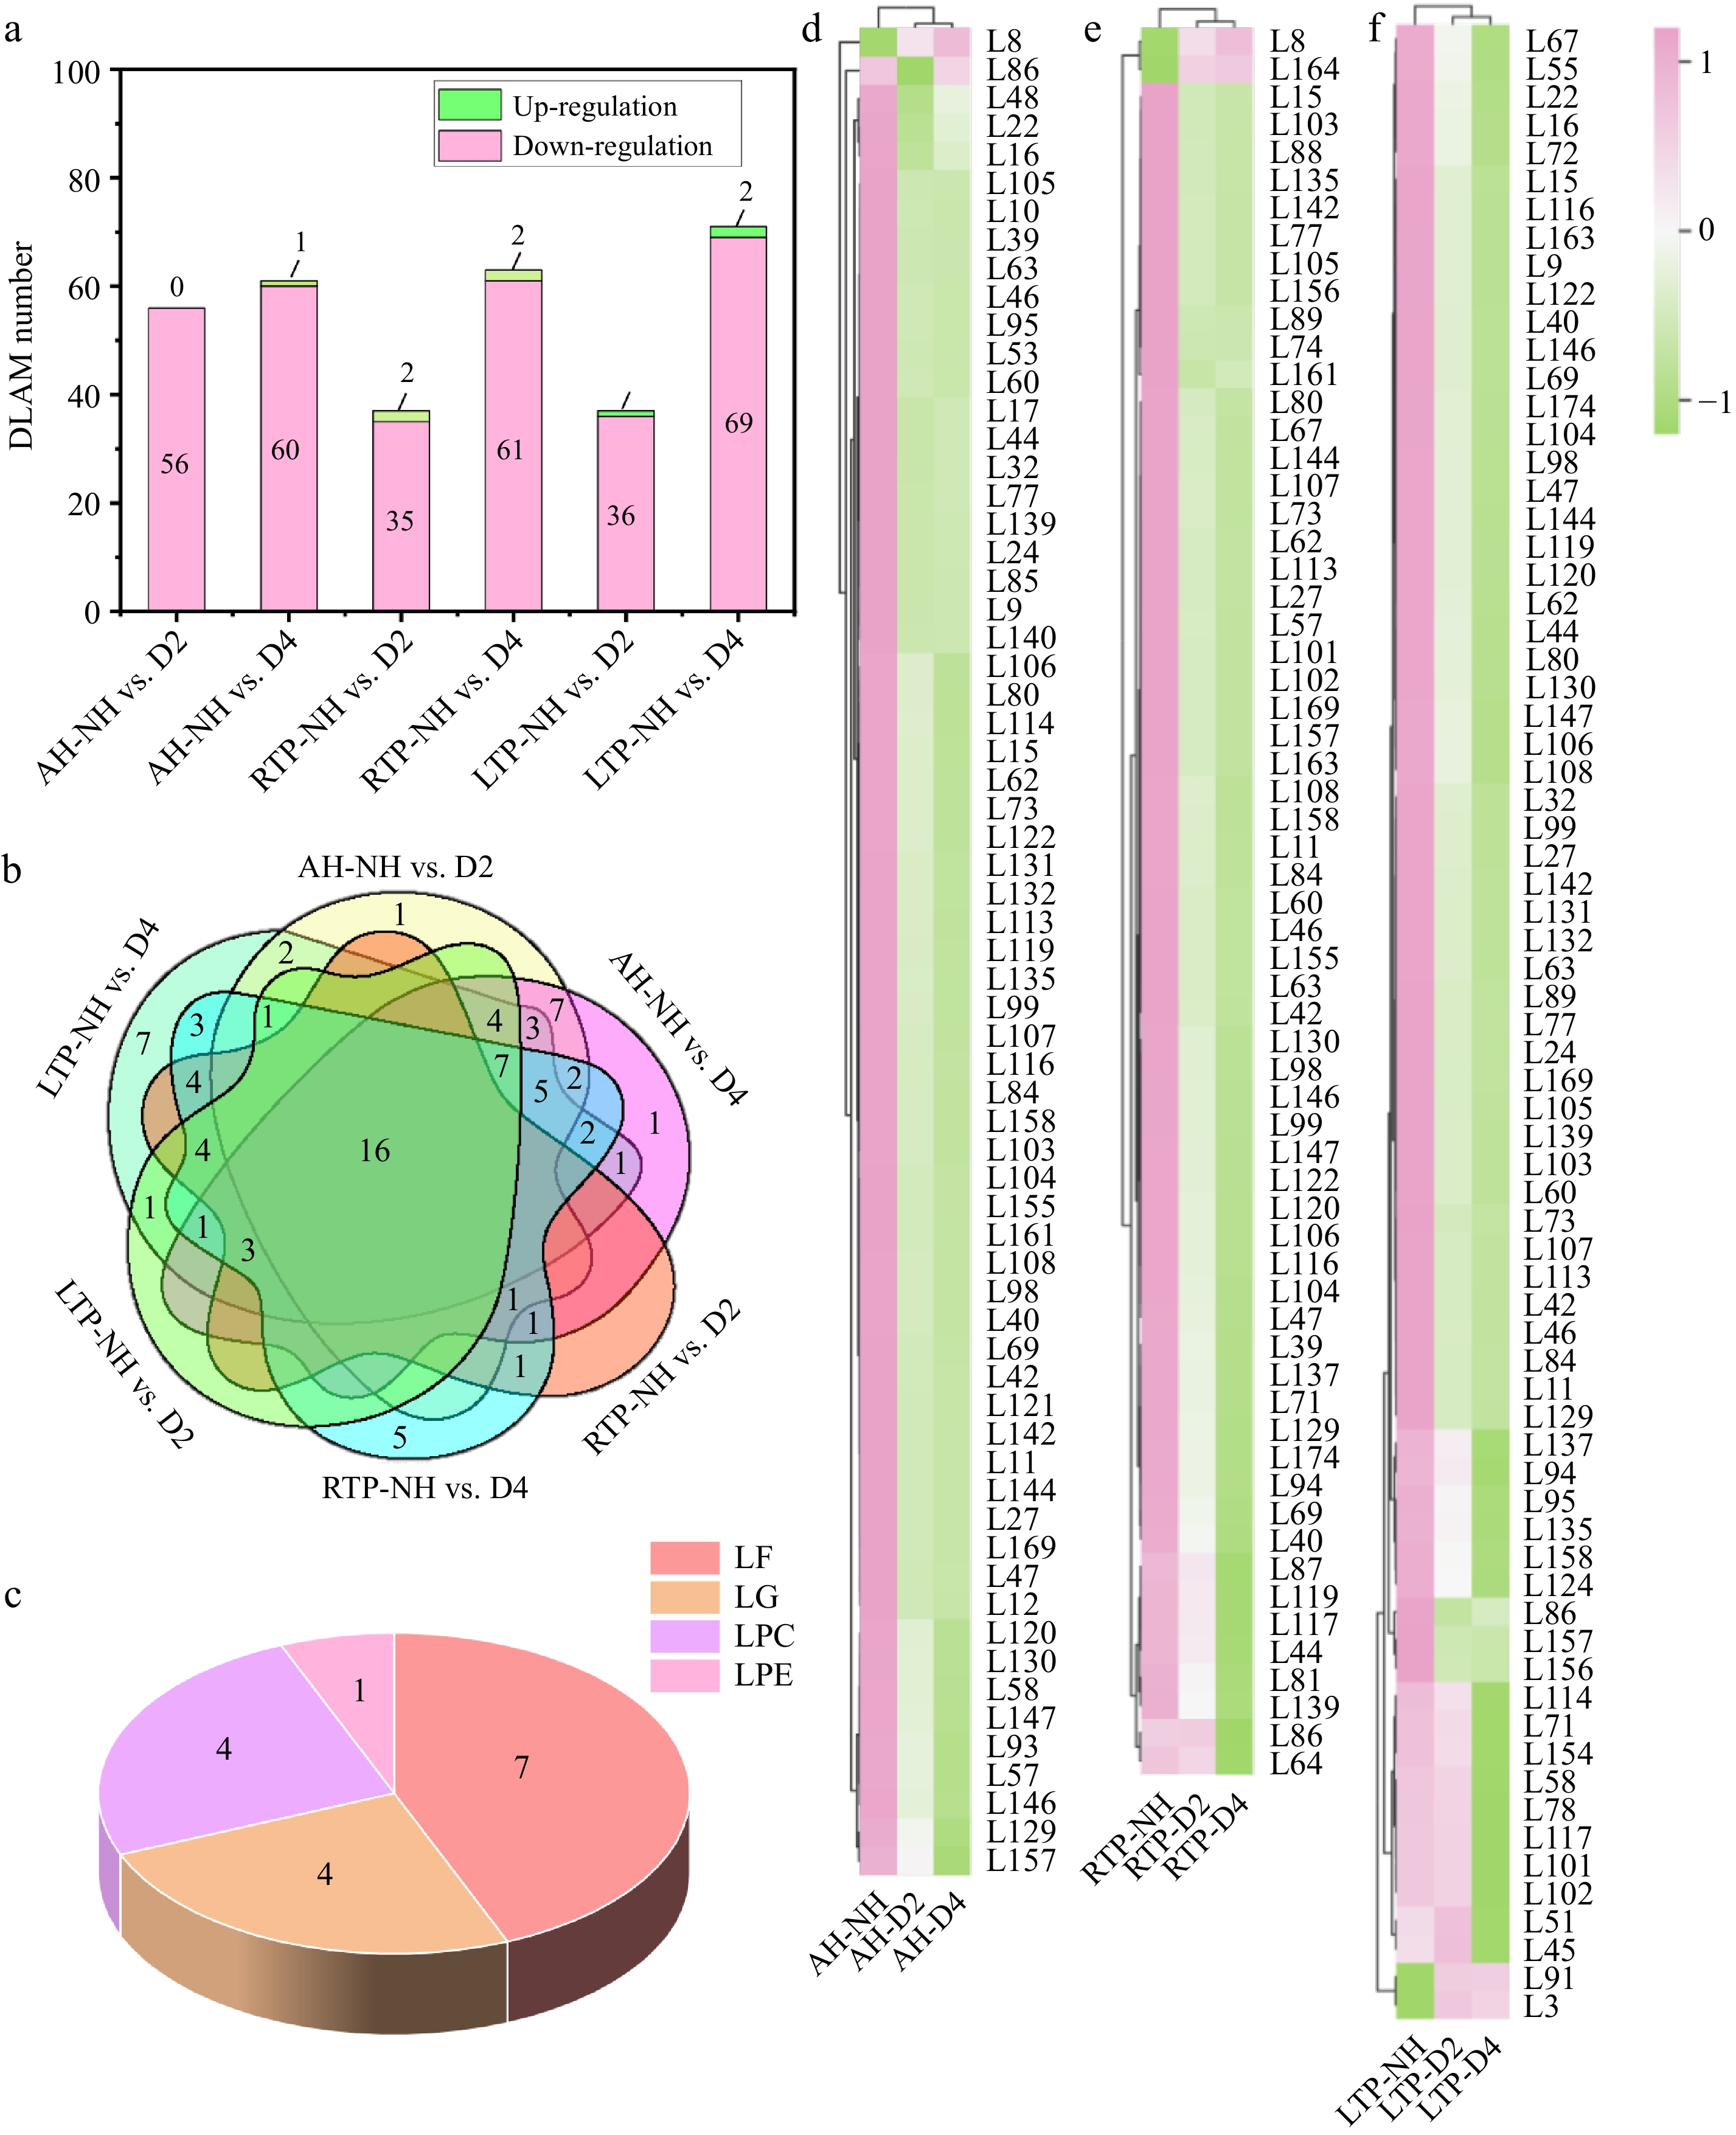
Figure 4.
(a) Distribution of up-regulation and down-regulation, (b) Venn plots, (c) common species, and (d), (e) heatmaps of DLAM in different comparison groups. AH-NH vs. D2 and AH-NH vs. D4 represent normal harvest vs. two- and four-week delayed harvest at harvest, respectively. RTP-NH vs. D2 and RTP-NH vs. D4 represent the comparisons between normal harvest and a two- or four-week delayed harvest following post-ripening at room temperature, respectively. LTP-NH vs. D2 and LTP-NH vs. D4 represent the comparisons between normal harvest and a two- or four-week delayed harvest following post-ripening at low temperature, respectively. AH: at harvest; RTP: room temperature post-ripening; LTP: low temperature post-ripening; NH: normal harvest. D2 and D4 were delayed harvests for two and four weeks, respectively. DLAM: differential lipid accumulating metabolites; LF: free fatty acids; LG: glycerol ester; LPC: lysophosphatidylcholine; LPE: lysophosphatidylethanolamine.
Terpenoid
-
Terpenoids, a major class of plant secondary metabolites, exhibit antioxidant, immune-enhancing, and cholesterol-lowering properties, and confer protection against abiotic stresses[28]. Fifty-one differential terpenoids accumulating metabolites (DTAMs) were found in all comparison groups (Fig. 5a). 3'-O-caffeoyl sweroside (T81) showed down-regulation in all comparison groups (Fig. 5b–e). Thus, T81 may serve as a marker DTAM of delayed-harvest kiwifruit (Supplementary Table S3). Nevertheless, its regulatory mechanisms during post-ripening—including key enzymatic activities in its biosynthesis and its relationship to fruit quality—require further analysis. Notably, most DTAMs (40/43) showed up-regulation in LTP, which was similar to the accumulation of terpenoids in Helictotrichon virescens during low-temperature[42]. This may be due to up-regulation of terpene synthesis genes caused by low temperature[43]. In addition, ten DTAMs with a trend of up-regulation were observed only in LTP after DH and were all triterpenoids (Fig. 5b, e, and Supplementary Table S2). Triterpenoids not only have pharmacological activities such as antimicrobial, anticancer, and anti-inflammatory properties, but also protect the plant from abiotic stresses[28]. Thus, they may be marker DTAMs of delayed-harvest kiwifruit in LTP (Supplementary Table S3).
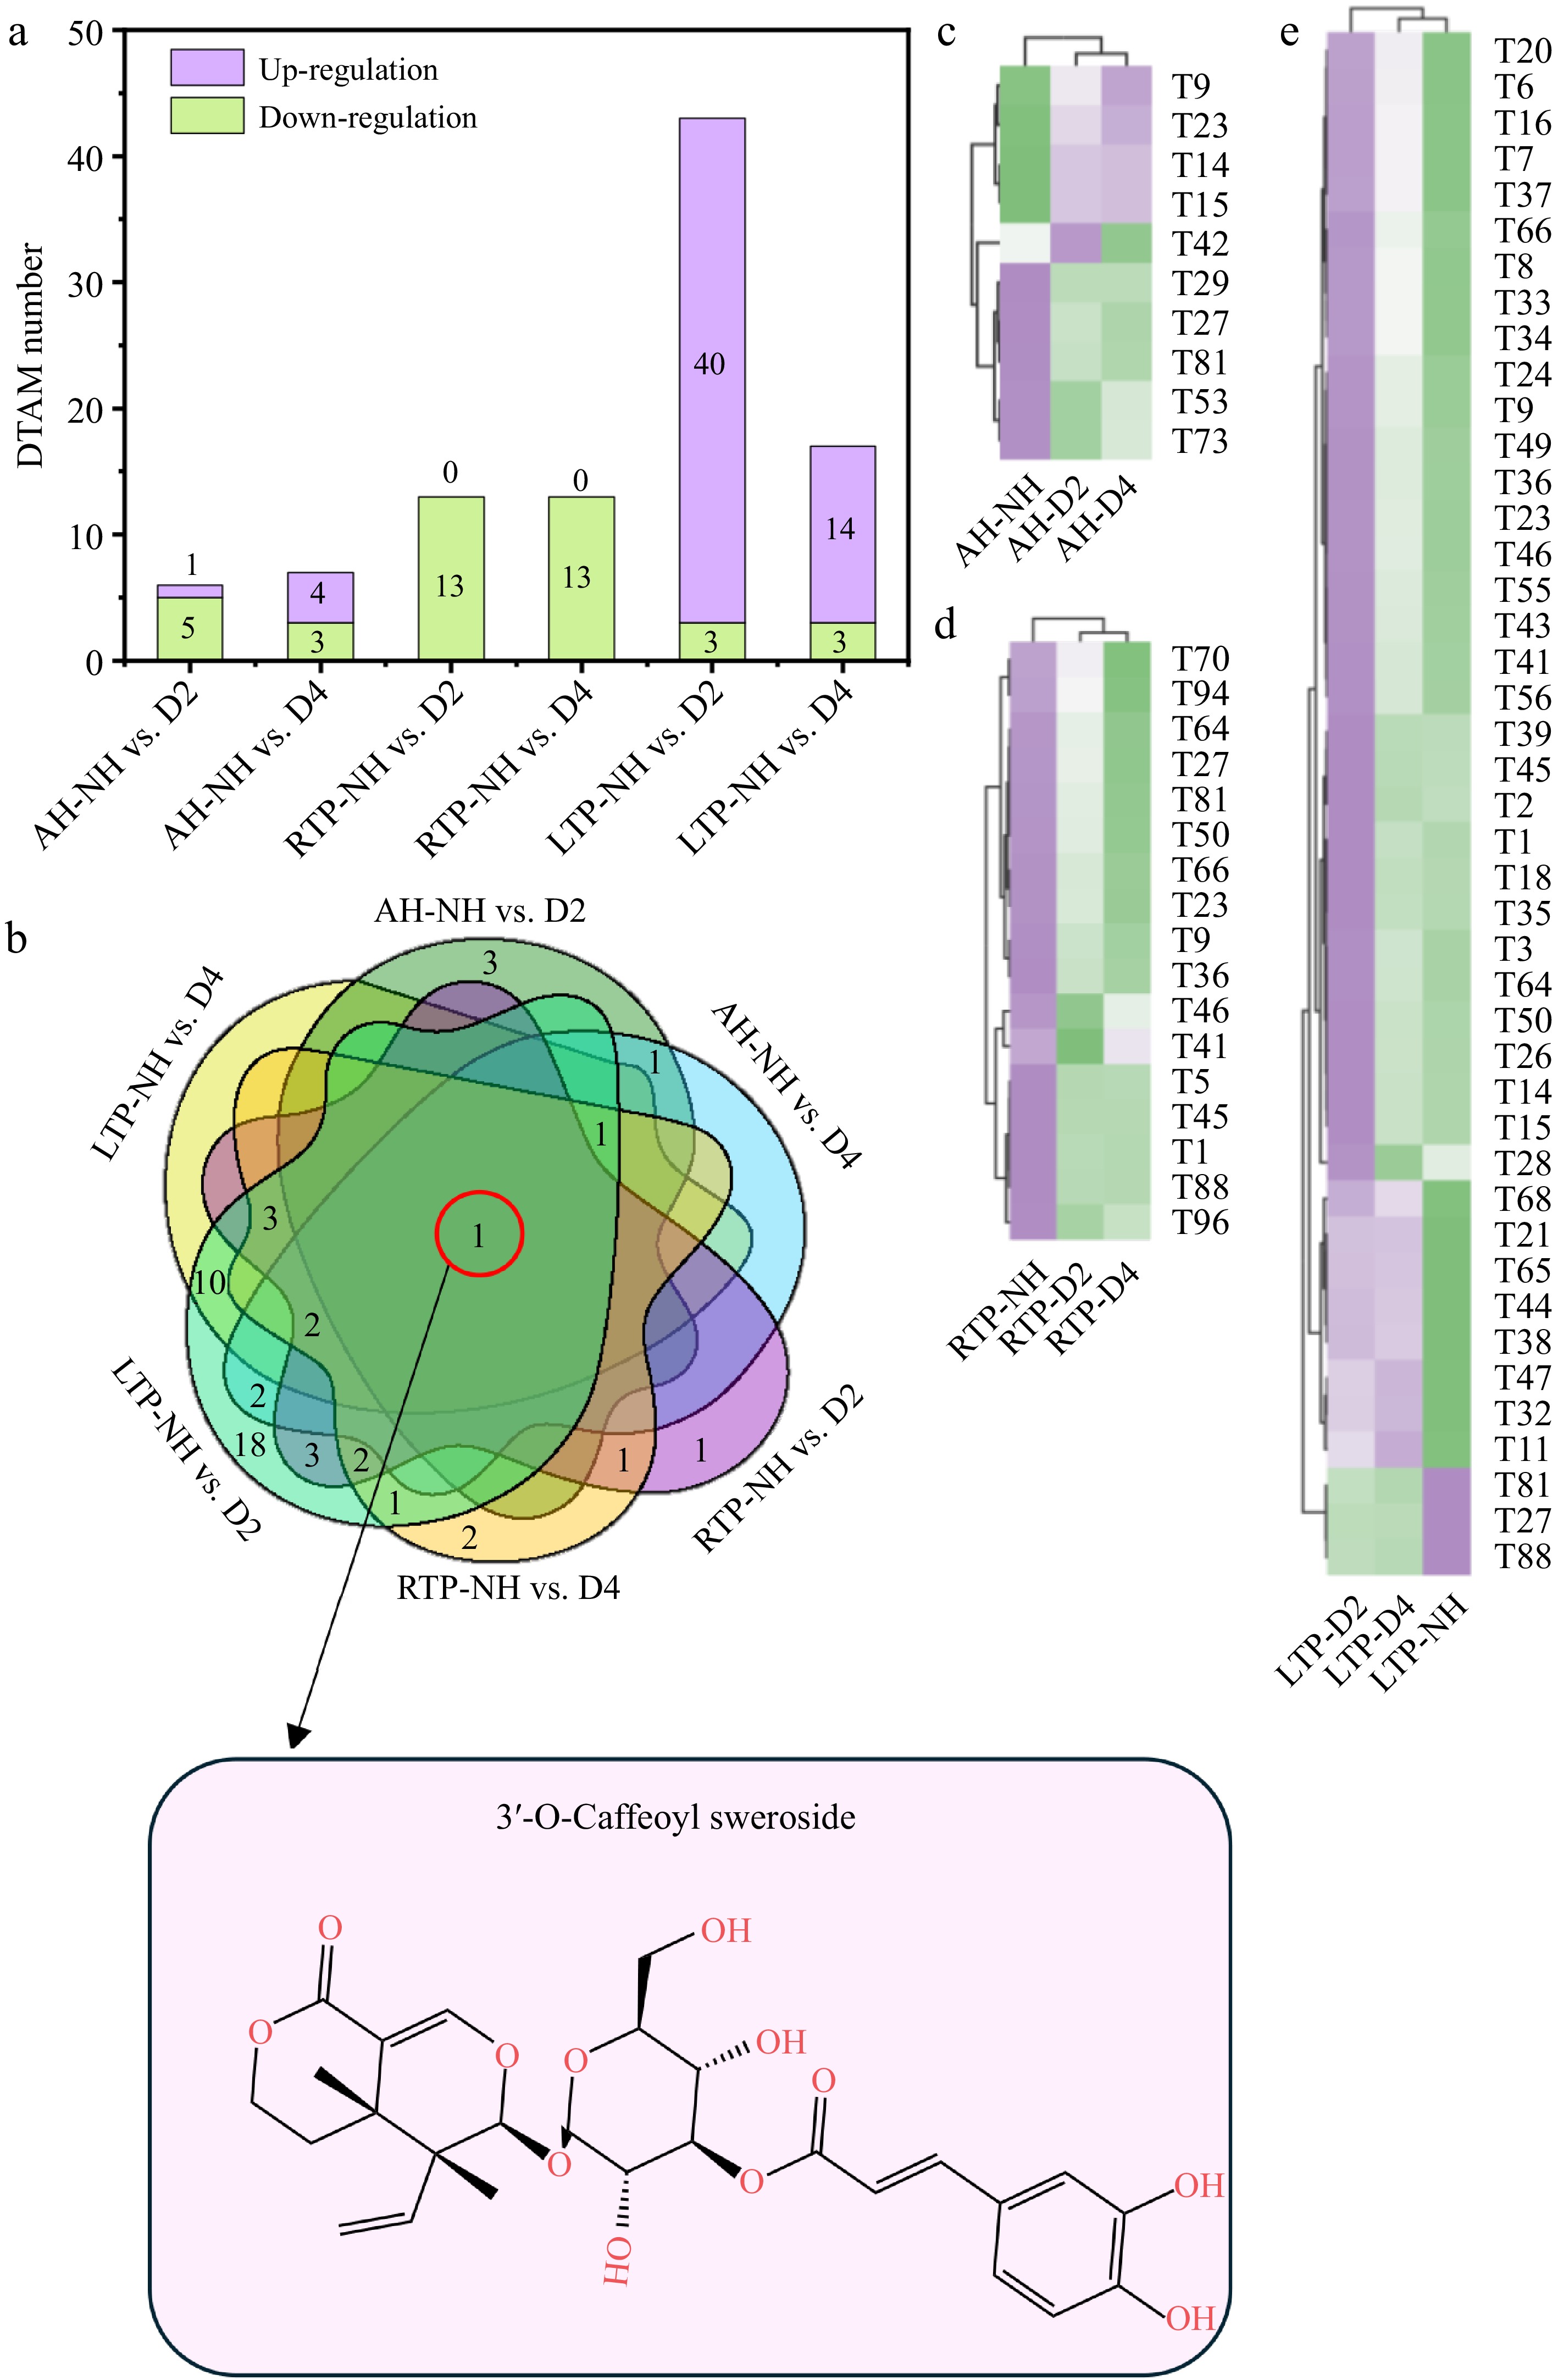
Figure 5.
(a) Distribution of up-regulation and down-regulation, (b) Venn plots, and (c)–(e) heatmaps of DTAM in different comparison groups. AH-NH vs. D2 and AH-NH vs. D4 represent normal harvest vs. two- and four-week delayed harvest at harvest, respectively. RTP-NH vs. D2 and RTP-NH vs. D4 represent the comparisons between normal harvest and a two- or four-week delayed harvest following post-ripening at room temperature, respectively. LTP-NH vs. D2 and LTP-NH vs. D4 represent the comparisons between normal harvest and a two- or four-week delayed harvest following post-ripening at low temperature, respectively. AH: at harvest; RTP: room temperature post-ripening; LTP: low temperature post-ripening; NH: normal harvest. D2 and D4 were delayed harvests for two and four weeks, respectively. DTAM: differential terpenoids accumulating metabolites.
Phenolics
-
Phenolic compounds are secondary metabolites involved in the metabolism of phenylpropane/phenylalanine in plants, which not only have certain effects on the color and flavor of plants, but also have anti-oxidation, anti-cancer, and anti-stress functions[22]. Thirty phenolic acids were identified as differential phenolic acid accumulating metabolites (DPAMs) in all comparison groups, and most DPAMs (9/12) showed up-regulation in RTP-NH vs. D2 and LTP-NH vs. D2 (Fig. 6a), suggesting that D2 could improve phenolic acid accumulation in RTP and LTP. Compared to AH, the up-regulated DPAMs number (4/13) was increased in RTP (Fig. 6a–d), which might result from ethylene and reactive oxygen species stimulating the phenylpropanoid pathway during post-ripening, enhancing key enzyme activity and promoting phenolic acid synthesis[44]. Notably, the majority of DPAMs (8/14) exhibited an up-regulation in LTP, which was similar to the up-regulation trend observed in phenolic acids in the 'Haegeum' cultivar during the fourth month of cold storage[45]. This may result from up-regulated phenylpropanoid metabolism under cold stress, promoting phenolic acid accumulation and subsequent cellular protection against oxidative damage[28]. Four up-regulated (1-O-p-coumaroyl-β-D-glucose, PA146; 4-O-Galactoyl p-Coumaric acid, PA59; p-coumaric acid-4-O-glucoside, PA147; and 1-O-p-Coumaroylquinic acid, PA72) and one down-regulated (cinnamic acid, PA18) DPAMs were observed only in LTP (Fig. 6c–e, and Supplementary Table S2). Notably, the four up-regulated DPAMs are p-coumaric acid and derivatives with anti-tumor, anti-bacterial, and anti-aging[46]. In addition, p-coumaric acid is synthesized from cinnamic acid via cinnamate-4-hydroxylase in the phenylalanine pathway[47], consistent with the down-regulation of PA18. Therefore, the five DPAMs may be marker DPAMs of delayed-harvest kiwifruit in LTP (Supplementary Table S3).
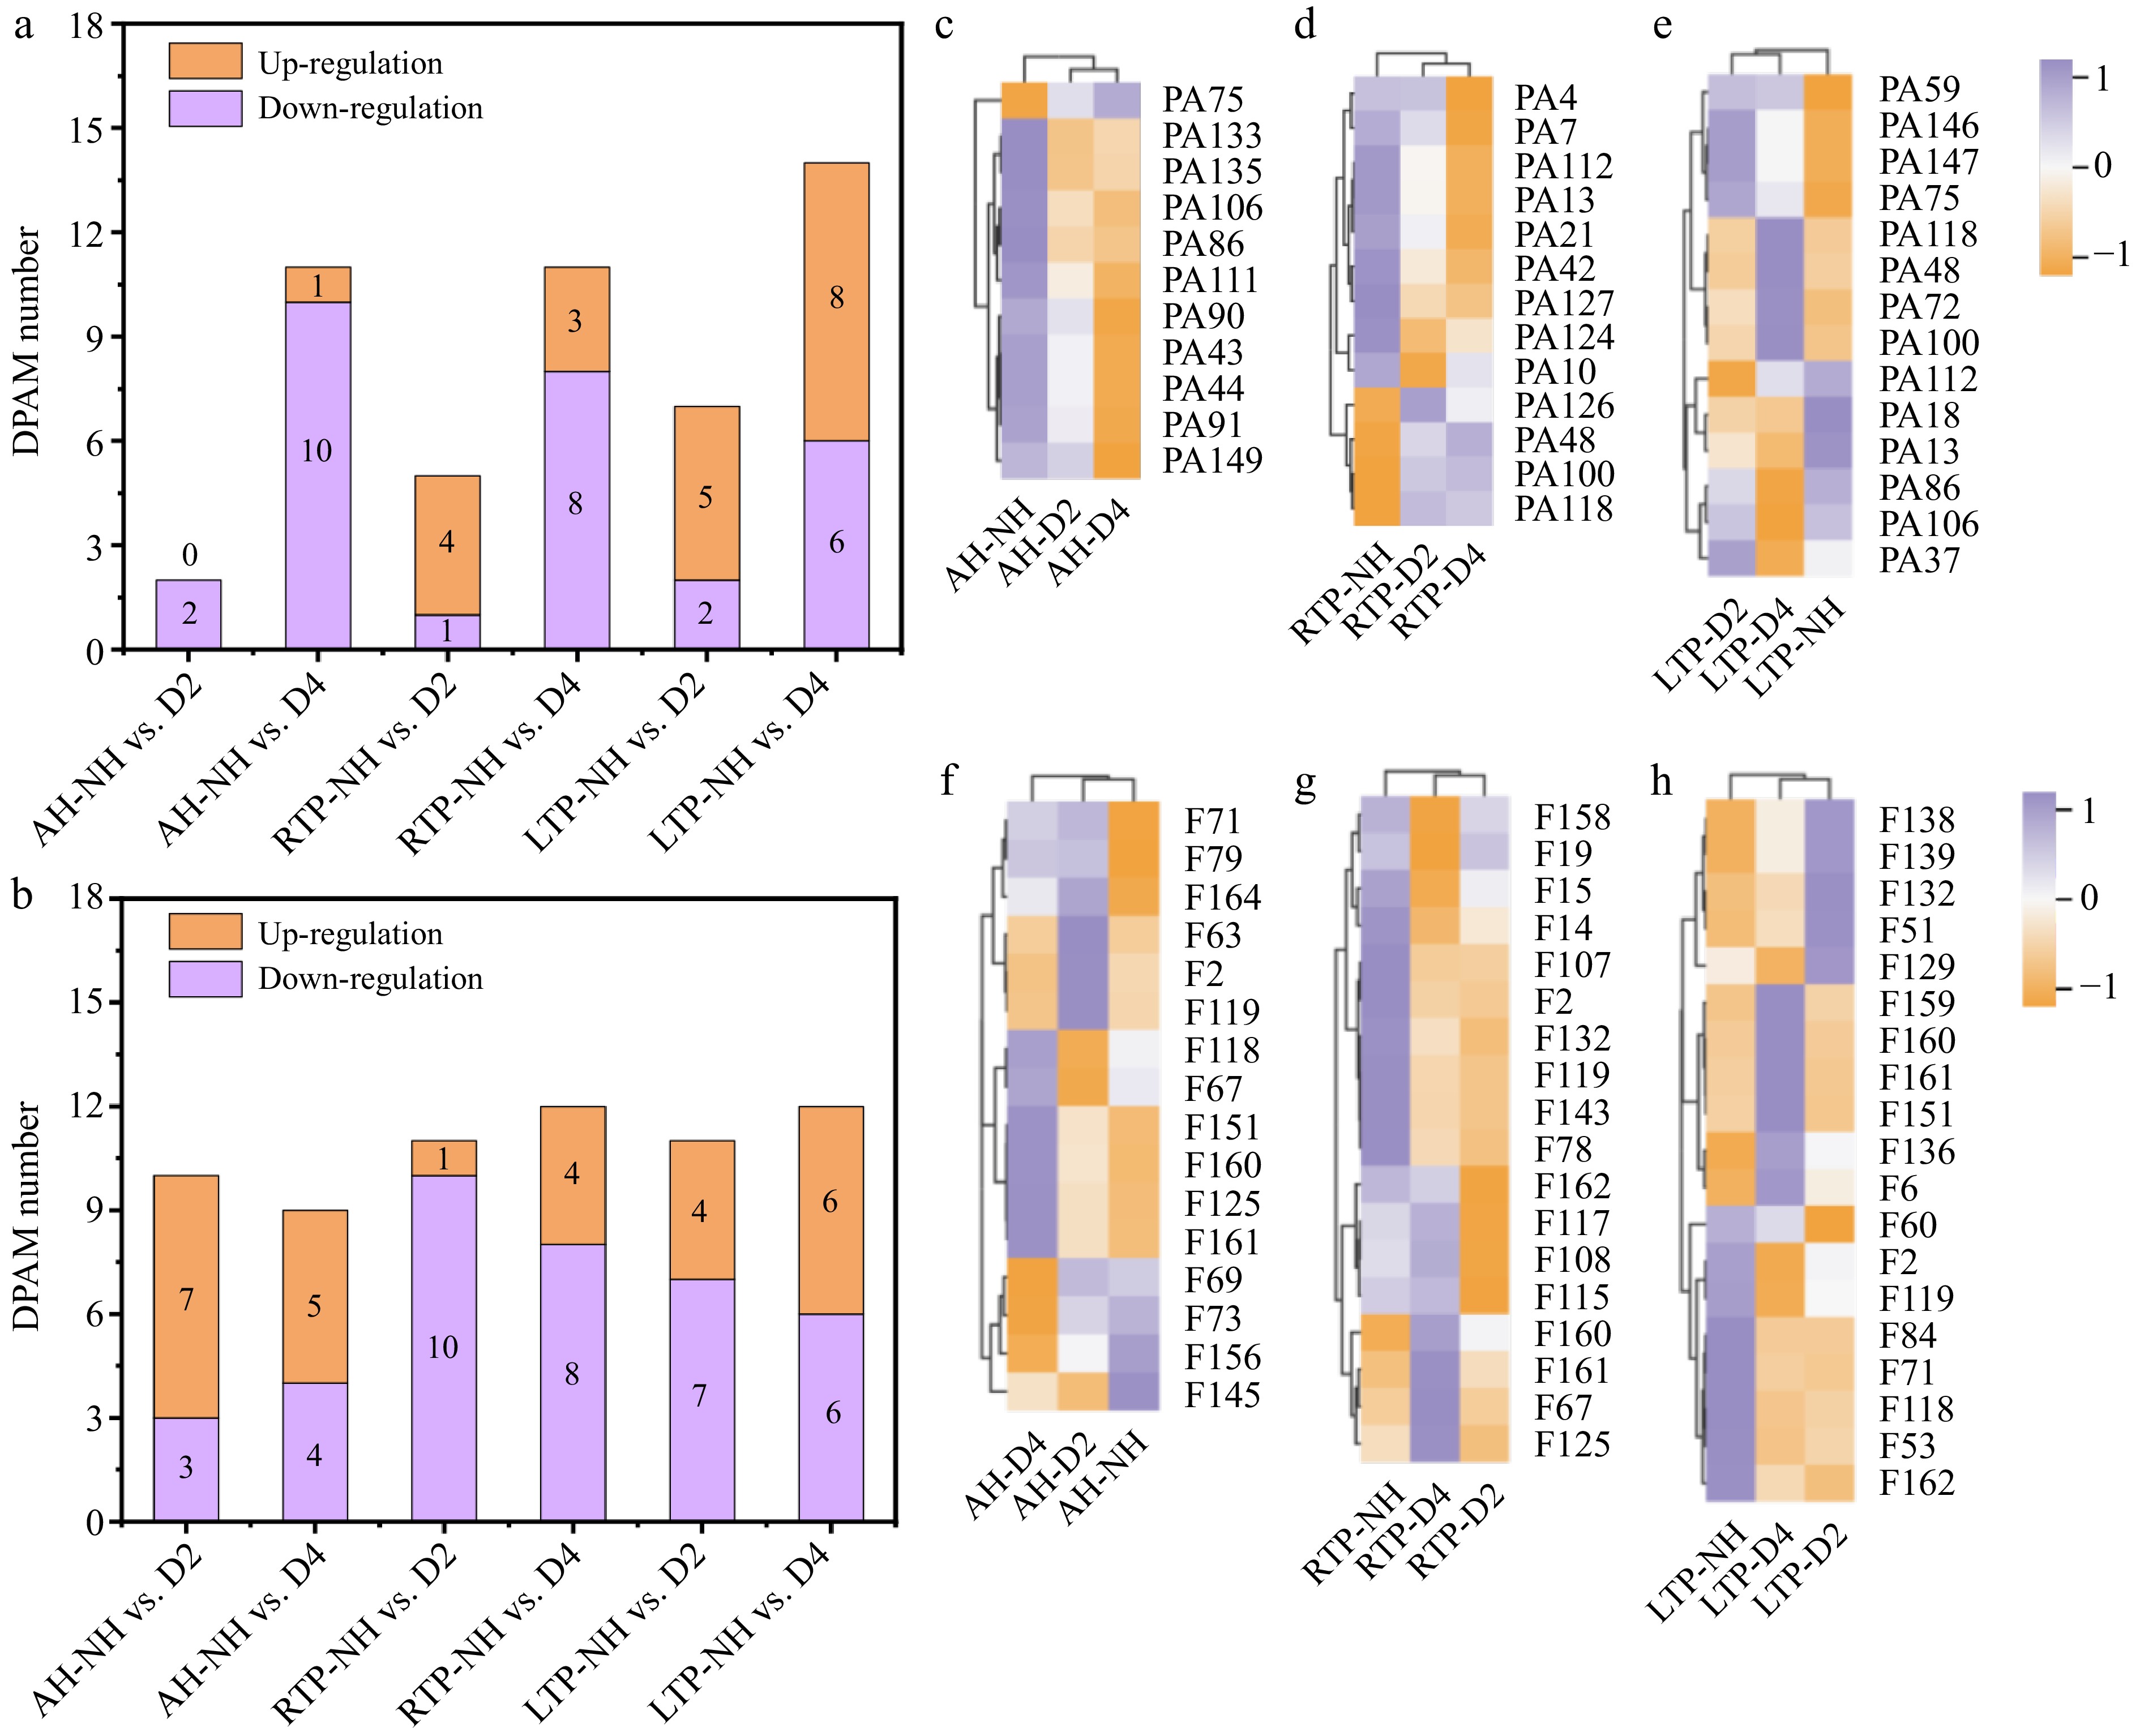
Figure 6.
(a), (b) Distribution of up-regulation and down-regulation, and (c)–(h) heatmaps of DPAM and DFAM in different comparison groups. AH-NH vs. D2 and AH-NH vs. D4 represent normal harvest vs. two- and four-week delayed harvest at harvest, respectively. RTP-NH vs. D2 and RTP-NH vs. D4 represent the comparisons between normal harvest and a two- or four-week delayed harvest following post-ripening at room temperature, respectively. LTP-NH vs. D2 and LTP-NH vs. D4 represent the comparisons between normal harvest and a two- or four-week delayed harvest following post-ripening at low temperature, respectively. AH: at harvest; RTP: room temperature post-ripening; LTP: low temperature post-ripening; NH: normal harvest. D2 and D4 were delayed harvests for two and four weeks, respectively. DPAM: differential phenolic acid accumulating metabolites; DFAM: differential flavonoid accumulating metabolites.
Thirty-eight differential flavonoid accumulating metabolites (DFAMs) were identified in all comparison groups (Fig. 6b and Supplementary Table S2). Compared to AH-NH vs. D2, most DFAMs (16/20) showed down-regulation in RTP-NH vs. D2 and LTP-NH vs. D2, which might be because the degradation of flavonoids served to alleviate oxidative stress during DH while also maintaining intracellular homeostasis under senescence stress[1]. The down-regulated DFAMs number (12/20) decreased with the further increase of DH time, which was consistent with TFC results (Fig. 1c), suggesting that D4 could delay flavonoid degradation in post-ripened kiwifruit. This might be due to up-regulation of gene expression for enzymes encoding flavonoid synthesis under long-term low-temperature stress, leading to accumulation of more flavonoids to help kiwifruit resist stress such as bacteria and low temperature[27]. In addition, compared to RTP, the down-regulated DFAMs number (10/19) was reduced in LTP, which was consistent with the flavonoid change of blond orange during low-temperature storage[48]. This may result from upregulated flavonoid synthesis genes under low-temperature stress, promoting flavonoid accumulation to resist stress such as bacteria and low temperature[28]. 3,5,6,7,8,3',4'-heptamethoxyflavone (F53), a flavonoid component, possesses antioxidant, anti-aging, and cold resistance properties[49]. F53 with a down-regulation trend was found only in LTP (Fig. 6f–h), which can be attributed to its consumption to alleviate chilling injury. Based on this, it may be the marker DFAM of delayed-harvest kiwifruit in LTP (Supplementary Table S3). Twenty differential lignans and coumarins accumulation metabolites (DLCAMs) were identified in all comparison groups (Table 2). Compared to AH, most DLCAMs (16/20) showed down-regulation in RTP and LTP, and the level of down-regulation increased with the DH time. This may be because degradation of lignans and coumarins is used to alleviate oxidative stress during DH while also maintaining intracellular homeostasis under senescence stress[1]. In addition, the down-regulated DLCAMs number (4/6) was lower in LTP than in RTP, suggesting that low temperature could delay degradation of lignans and coumarins. This may result from upregulated genes encoding 4-coumaric acid coenzyme A ligase under low-temperature stress, promoting lignan and coumarin accumulation to enhance resistance to bacterial and low-temperature stress[50].
In conclusion, D2 can improve the accumulation or delay the degradation of phenolic acids, while for flavonoids, it is D4. LTP can delay degradation and promote the accumulation of phenolic compounds to a certain extent. Further investigation is needed to optimize DH time for the simultaneous enhancement of both phenolic acids and flavonoids.
Saccharides and organic acids
-
Saccharides, as important carbon source compounds in fruit, not only provide energy during growth and development, but also impart an essential sweet flavor[30]. 7 differential saccharide accumulation metabolites (DSAMs) were found in all comparison groups (Table 2). Only one DSAM was observed in AH-D2 and LTP-D2, respectively, but none in RTP-D2, suggesting that D2 did not affect the saccharide composition of AH, RTP, and LTP. However, the down-regulated DSAMs number (AH: 3/4, RTP: 3/3, LTP: 5/5) increased with increasing DH time from D2 to D4 in all groups, which was different from previous studies that DH can result in the degradation of pectin and starch to facilitate soluble sugar accumulation[2]. This may be because of varietal differences, the weather of the year (rainfall, light), and orchard cultivation[51]. Notably, DH did not cause significant changes in major saccharides (e.g., sucrose, fructose, and glucose) that contribute to the sweetness of kiwifruit. In addition, the down-regulated DSAMs number (5/5) was higher in LTP than in RTP, which may be due to consumption of soluble sugars as a substrate for respiration at low-temperature storage[52].
Organic acids are one of the most important contributors to fruit flavor, providing acidity and fruitiness while weakening bitterness[53]. Twenty-three differential organic acid-accumulating metabolites (DOAMs) were identified in all comparison groups (Table 2). Compared to AH, D2 delayed down-regulation of DOAMs in LTP and RTP, differing from previous studies in which organic acid content in fruit decreased, which was attributed to the consumption of certain organic acids by the tricarboxylic acid cycle during DH[2,9]. We propose that these discrepancies may be primarily attributed to the genotypic variations in maturity physiology among kiwifruit cultivars. The metabolic pathways that govern the balance between TSS accumulation and TAC degradation are highly gene expression-specific. The 'Cuixiang' kiwifruit may exhibit unique metabolic expression under DH, leading to this phenomenon, which is distinct from previous studies. Secondary to this intrinsic factor, local pre-harvest conditions (e.g., temperature and light) and orchard practices likely acted as modifiers, influencing the extent of these cultivar-specific expressions[26]. Therefore, further studies on the interaction between genotype and environment are still required to develop precise DH strategies. Yang et al.[54] showed in tomato ripening studies that the decline in Jasmonic acid (O40) levels was an intrinsic manifestation of fruit ripening. O40 showed down-regulation in all groups, and thus it may be a marker DOAM of delayed-harvest kiwifruit (Supplementary Table S3).
Metabolic pathway
-
To investigate the impact of DH on the metabolic pathways of 'Cuixiang' kiwifruit, Kyoto Encyclopedia of Genes and Genomes (KEGG) enrichment analysis was employed to screen for differential metabolites. Based on pairwise comparisons, the top 20 metabolic pathways were identified, and the results are presented in Supplementary Fig. S6a–S6f. Comparison of the co-enrichment results between AH-NH vs. D2 and AH-NH vs. D4 revealed that pathways including aminoacyl-tRNA biosynthesis, alpha-linolenic acid metabolism, biosynthesis of amino acids, 2-oxocarboxylic acid metabolism, linoleic acid metabolism, D-amino acid metabolism, and glucosinolate biosynthesis consistently showed significant enrichment trends in both comparisons. The comparative analysis of co-enrichment results between the RTP-NH vs. D2 and the RTP-NH vs. D4 revealed that the following pathways were significantly enriched in both comparisons: alpha-Linolenic acid metabolism and linoleic acid metabolism. Comparative analysis of co-enrichment results between the LTP-NH vs. D2 and the LTP-NH vs. D4 revealed that alpha-linolenic acid metabolism was significantly enriched in both comparisons. It is noteworthy that the alpha-linolenic acid metabolism exhibited significant enrichment across all comparative groups, suggesting that this pathway serves as a key metabolic pathway that regulates the ripening and senescence processes in 'Cuixiang' kiwifruit during DH. This pathway is the primary source for the biosynthesis of jasmonates—jasmonic acid is not only a stress signaling molecule but also a key endogenous hormone involved in regulating plant senescence, chlorophyll degradation, and fruit maturity[55]. However, our measurement data revealed an overall down-regulation in jasmonic acid of fruit following DH. This phenomenon may be related to the fact that during the DH, jasmonic acid signaling has already fulfilled its triggering function. Its down-regulation may indicate effective signal transmission and the comprehensive activation of downstream responses. Meanwhile, other lipid-derived signaling molecules or precursors generated via the alpha-linolenic acid metabolic pathway may still directly or indirectly regulate other co-enriched pathways, including amino acid biosynthesis and phenylpropanoid metabolism, thereby orchestrating the reprogramming of internal nutrient metabolism and the accumulation of flavor compounds in the fruit. Furthermore, a specific metabolic pathway, the biosynthesis of various plant secondary metabolites, was identified in the comparison between LTP-NH and D2. Metabolites linked to this pathway include crocin, ginsenoside, saponin adjuvant, cannabinoid, mugineic acid, pentagalloylglucose, benzoxazinoid, gramine, coumarin, furanocoumarin, hordatine, and podophyllotoxin. These compounds are involved in antioxidant activity, coloration, flavor, and nutritional value of the fruit, which may contribute to better quality characteristics observed in the LTP-D2 kiwifruit.
-
This study systematically analyzed the impact of DH on physicochemical properties, nutritional quality, and metabolites of 'Cuixiang' kiwifruit. The results showed that DH was beneficial in alleviating the degradation of ascorbic acid and phenolic compounds during post-ripening, especially at D1 and D2. Under low-temperature and senescence stress, DH improved the accumulation of flavonoids. The widely targeted metabolomics results showed that the down-regulation of most amino acids may produce a large number of flavor compounds, phenolic compounds, and other functional compounds. Most alkaloids showed down-regulation, thus reducing the bitter material basis of kiwifruit. Most phenolic acids, flavonoids, and other phenolics showed down-regulation after DH, which was helpful to eliminate free radicals from senescent fruit and to alleviate cellular oxidative damage. Overall, proper DH can maintain or improve kiwifruit quality, particularly in LTP. Therefore, a DH period of approximately two weeks can help mitigate quality loss in 'Cuixiang' kiwifruit intended for long-term cold storage. This provides an important recommendation for its postharvest storage. This improvement is primarily attributed to the synergistic up-regulation of specific phenylpropanoid and flavonoid pathways by DH and subsequent LTP treatment, which enhances antioxidant potential and contributes to quality maintenance. These findings provide data support and a theoretical basis for determining optimal harvest timing based on market demand, alleviating the pressure from concentrated harvesting, and extending the market supply period of the kiwifruit in production practices. Further investigations should address remaining gaps, such as the feasibility of applying DH to other kiwifruit varieties and cultivation regions.
-
The authors confirm their contributions to the paper as follows: study conception and design: Wu ZW; methodology: Wu ZW, Peng W, Ma TT; investigation: Wu ZW, Peng W, Zhang WH, Han RT, Ge Q, Sun XY, Ma TT, Zhang QW; formal analysis: Wu ZW, Peng W, Zhang WH, Han RT, Ge Q, Ma TT, Zhang QW; data curation, draft manuscript preparation: Wu ZW, Peng W; visualization: Wu ZW, Ma TT; writing – review & editing: Wu ZW, Sun XY, Ma TT; supervision: Ma TT; funding acquisition: Sun XY, Ma TT. All authors reviewed the results and approved the final version of the manuscript.
-
The datasets generated during and/or analyzed in the currentstudy are available from the corresponding author on reasonable request.
-
This work was funded by the National Nature Science Foundation Project (Grant No. 32372261), the Xi'an Key Agricultural Industrial Chain Technology Research Project (Grant No. 2023NYGG0018), the Innovation Capacity Support Plan of Shaanxi Province (Grant Nos 2025CY-JJQ-84, 2025JC-JCQN-059, 2024ZY-JCYJ-02-09, 2024QCY-KXJ-087, 2023-JC-QN-0225), and the Corps Science and Technology Programme Projects (Grant Nos 2025AB013, 2024AB042).
-
The authors declare that they have no conflict of interest.
-
accompanies this paper online at: https://doi.org/10.48130/fia-0026-0021.
- Supplementary Table S1 Detailed data for all metabolites in 'Cuixiang' kiwifruit at different delayed harvest times.
- Supplementary Table S2 Specific types and changes of differential accumulating metabolites among comparison groups with different delayed harvest times.
- Supplementary Table S3 The trends and utility of marker metabolites.
- Supplementary Fig. S1 Sampling flowchart for the experiment.
- Supplementary Fig. S2 Effect of delayed harvesting on physiological properties of kiwifruit with different treatments.
- Supplementary Fig. S3 Category and proportion (a), intra-group correlation analysis (b), PCA (c), and the heatmap (d) of all detected metabolites of different kiwifruit samples based on widely targeted metabolomics results.
- Supplementary Fig. S4 Total ion flow map of mixed samples.
- Supplementary Fig. S5 200 permutations test for the OPLS-DA model.
- Supplementary Fig. S6 Kyoto Encyclopedia of Genes and Genomes (KEGG) pathway enrichment analysis (a–f) of differential metabolites in six comparison groups.
- Supplementary Material Can delayed harvesting improve kiwifruit quality: insights from nutritional and metabolite dynamic changes.
- Copyright: © 2026 by the author(s). Published by Maximum Academic Press on behalf of China Agricultural University, Zhejiang University and Shenyang Agricultural University. This article is an open access article distributed under Creative Commons Attribution License (CC BY 4.0), visit https://creativecommons.org/licenses/by/4.0/.
-
About this article
Cite this article
Wu ZW, Peng W, Zhang WH, Han RT, Ge Q, et al. 2026. Effects of delayed harvesting on quality and metabolite profiles of 'Cuixiang' kiwifruit (Actinidia spp.): insights from post-ripening at room and low temperatures. Food Innovation and Advances 5(2): 271−286 doi: 10.48130/fia-0026-0021 

Effects of delayed harvesting on quality and metabolite profiles of 'Cuixiang' kiwifruit (Actinidia spp.): insights from post-ripening at room and low temperatures
- Received: 10 November 2025
- Revised: 23 March 2026
- Accepted: 23 March 2026
- Published online: 25 June 2026
Abstract: Current practices for determining fruit harvest maturity lack robust scientific standards, leading to variable postharvest quality. To address this gap, this article explores a new storage method, delayed harvesting (DH), to investigate the evolution of quality attributes and metabolites of 'Cuixiang' kiwifruit at harvest (AH), room temperature post-ripening (RTP), and low temperature post-ripening (LTP). The results indicated that titratable acid content (9.36–12.56 g/kg) increased with DH time, whereas dry matter content (21.01%–17.39%) decreased. Although DH caused a decrease in total phenols (0.94–0.79 g/kg) and ascorbic acid (1.25–0.78 g/kg) at harvest, it was beneficial in alleviating the degradation of ascorbic acid during post-ripening, and improving the antioxidant activity of LTP kiwifruit. Specifically, compared to normally harvested samples, ascorbic acid content of the samples delayed for two weeks in LTP increased by 30.01%, whilst antioxidant activity, (1,1-diphenyl-2-picryl-hydrazyl radical scavenging activity: 3.92 mmol/kg; 2,2′-azino-bis[3-ethylbenzothiazoline-6-sulfonic acid] free radical scavenging activity: 6.49 mmol/kg; and ferric reducing antioxidant power: 4.49mmol/kg) showed no significant difference. The senescence, oxidative stress, and respiratory consumption of cells during DH lead to down-regulation of amino acids, alkaloids, and lipids. The up-regulation of phenylpropanoid metabolism and the expression of genes encoding flavonoid synthesis under low temperature facilitated the accumulation of phenolic acids and flavonoids during LTP. Overall, DH has greater application advantages for maintaining the quality attributes of LTP kiwifruit. The results can provide scientific data to clarify the effects of DH on the nutritional quality of 'Cuixiang' kiwifruit, and also help to understand the metabolic pattern of important metabolites during DH.
-
Key words:
- Delayed harvesting /
- Quality attributes /
- Antioxidant activity /
- Metabolite analysis