-
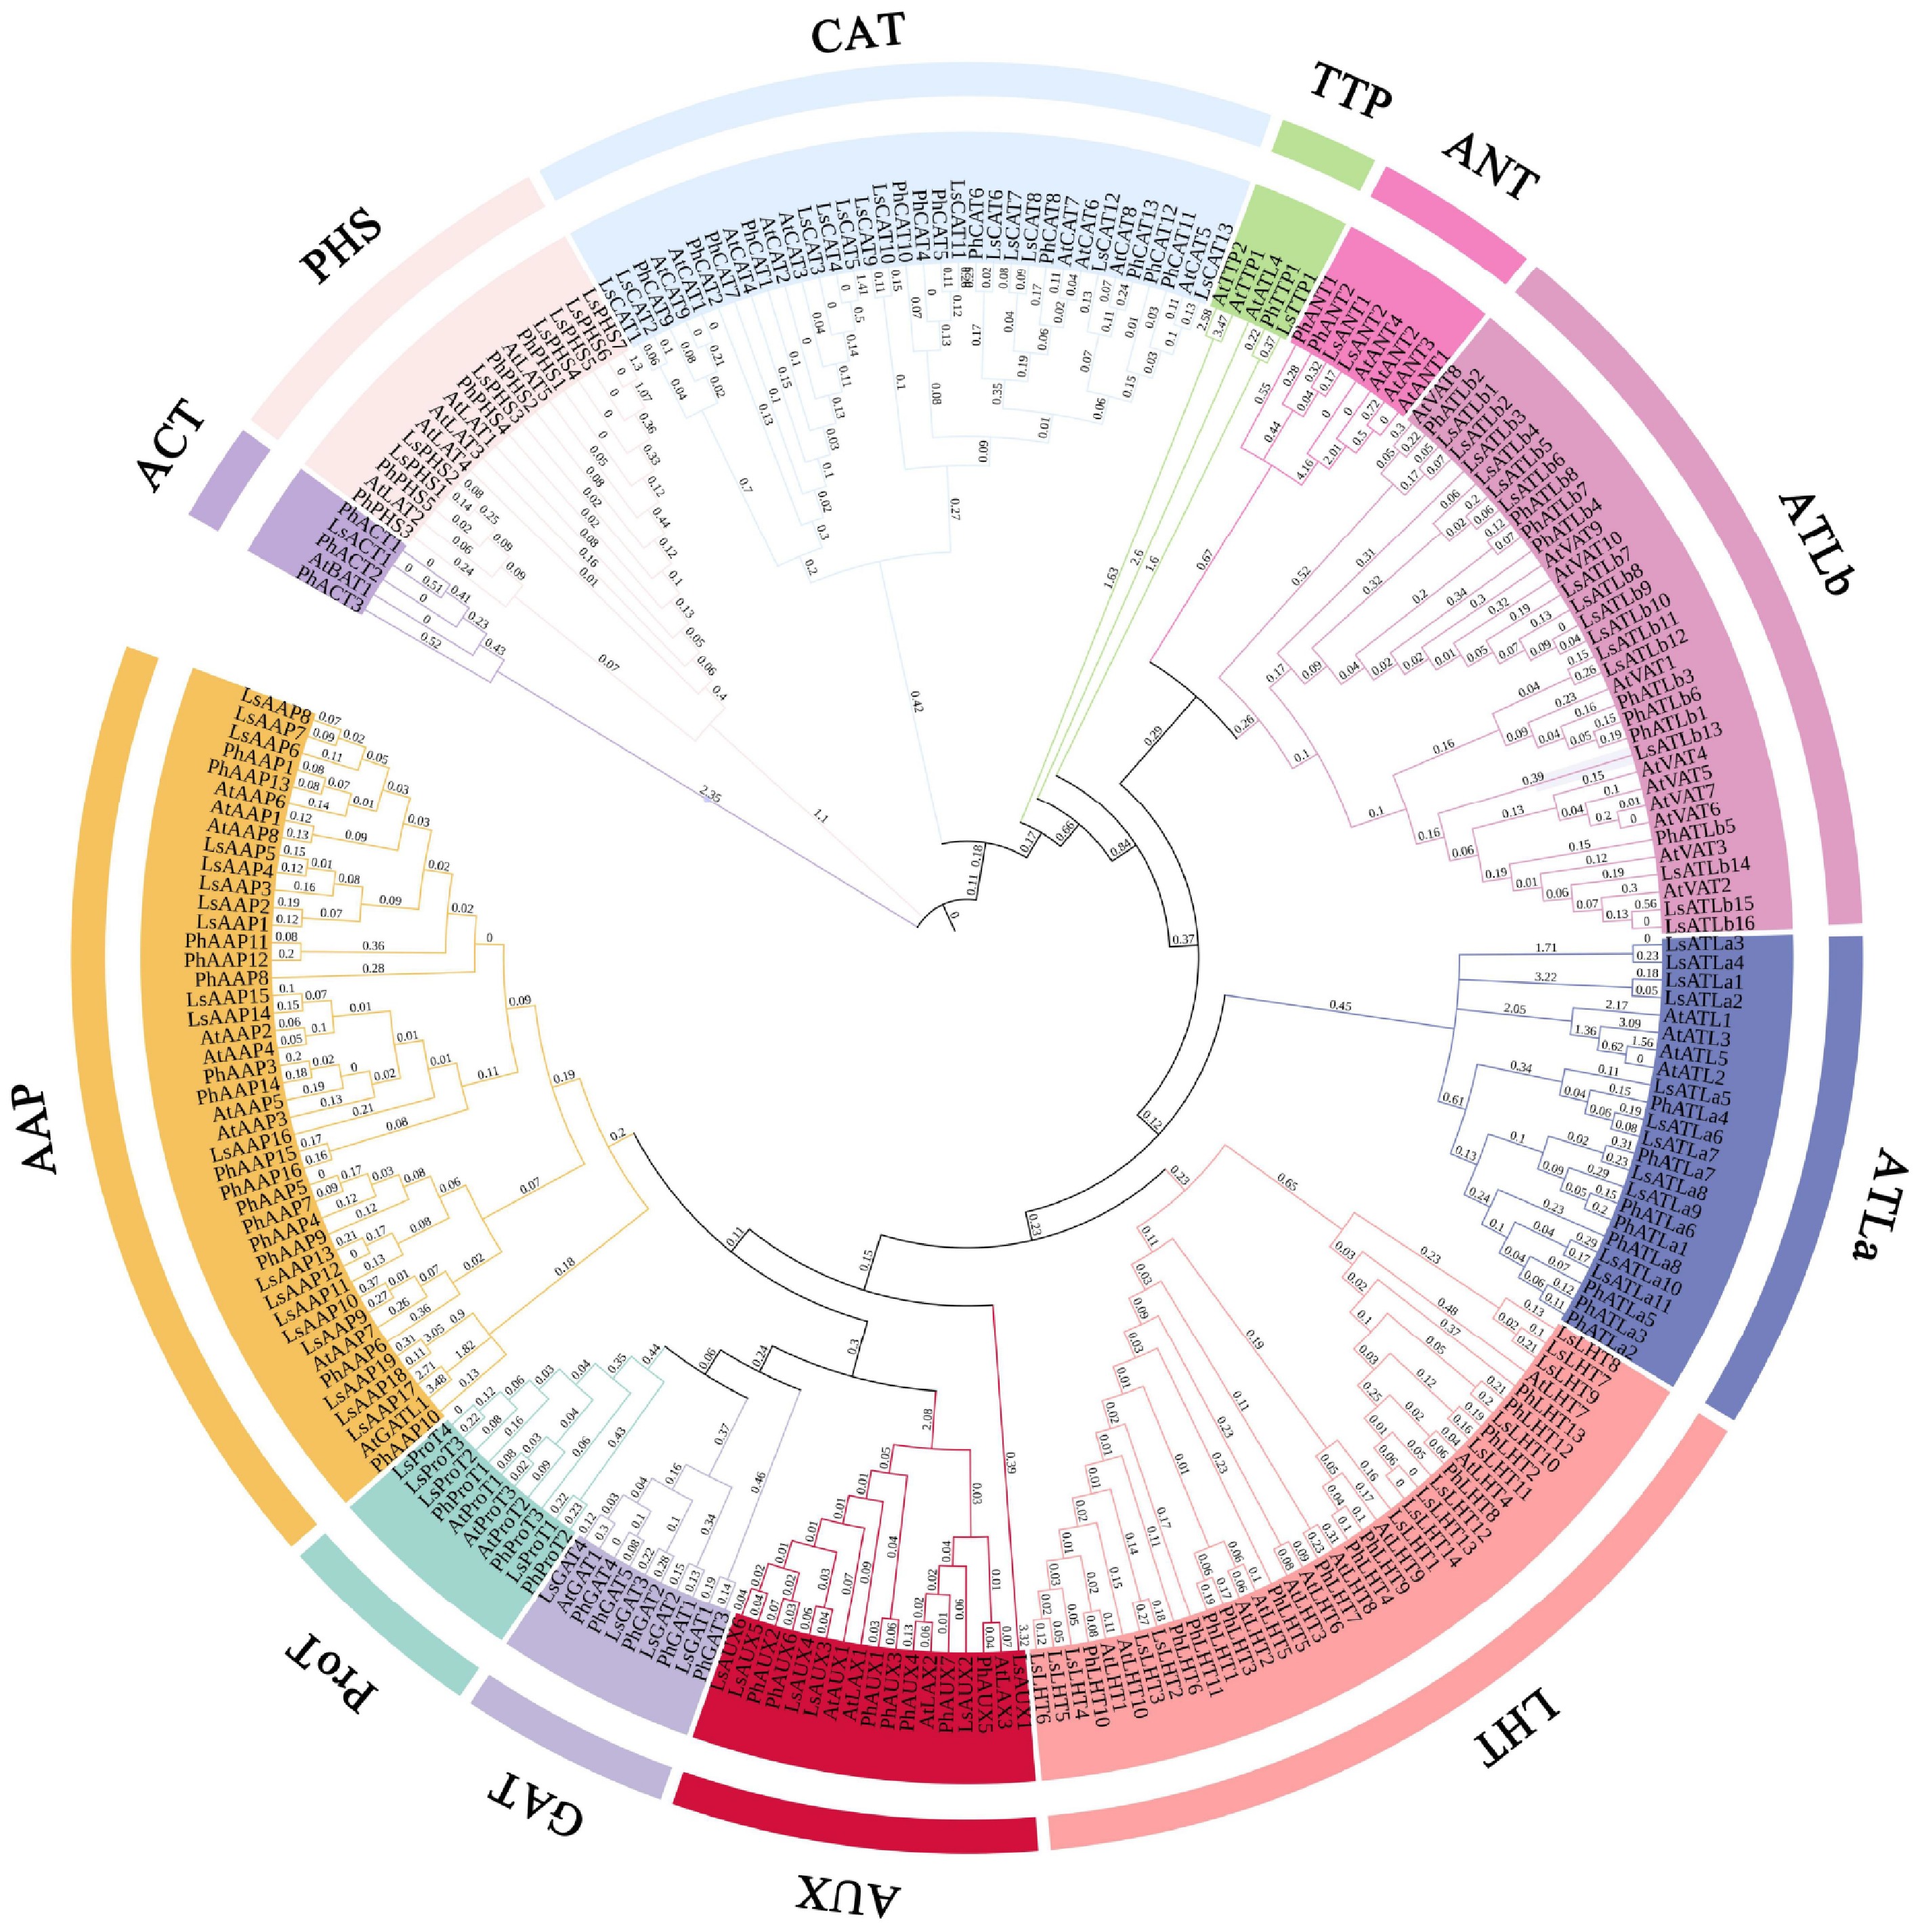
Figure 1.
Phylogenetic relationships among lettuce, Arabidopsis, and kidney bean. The tree is divided into 12 subgroups. Different groups are shown in different colors. Numbers near the nodes represent bootstrap support (1,000 iterations).
-
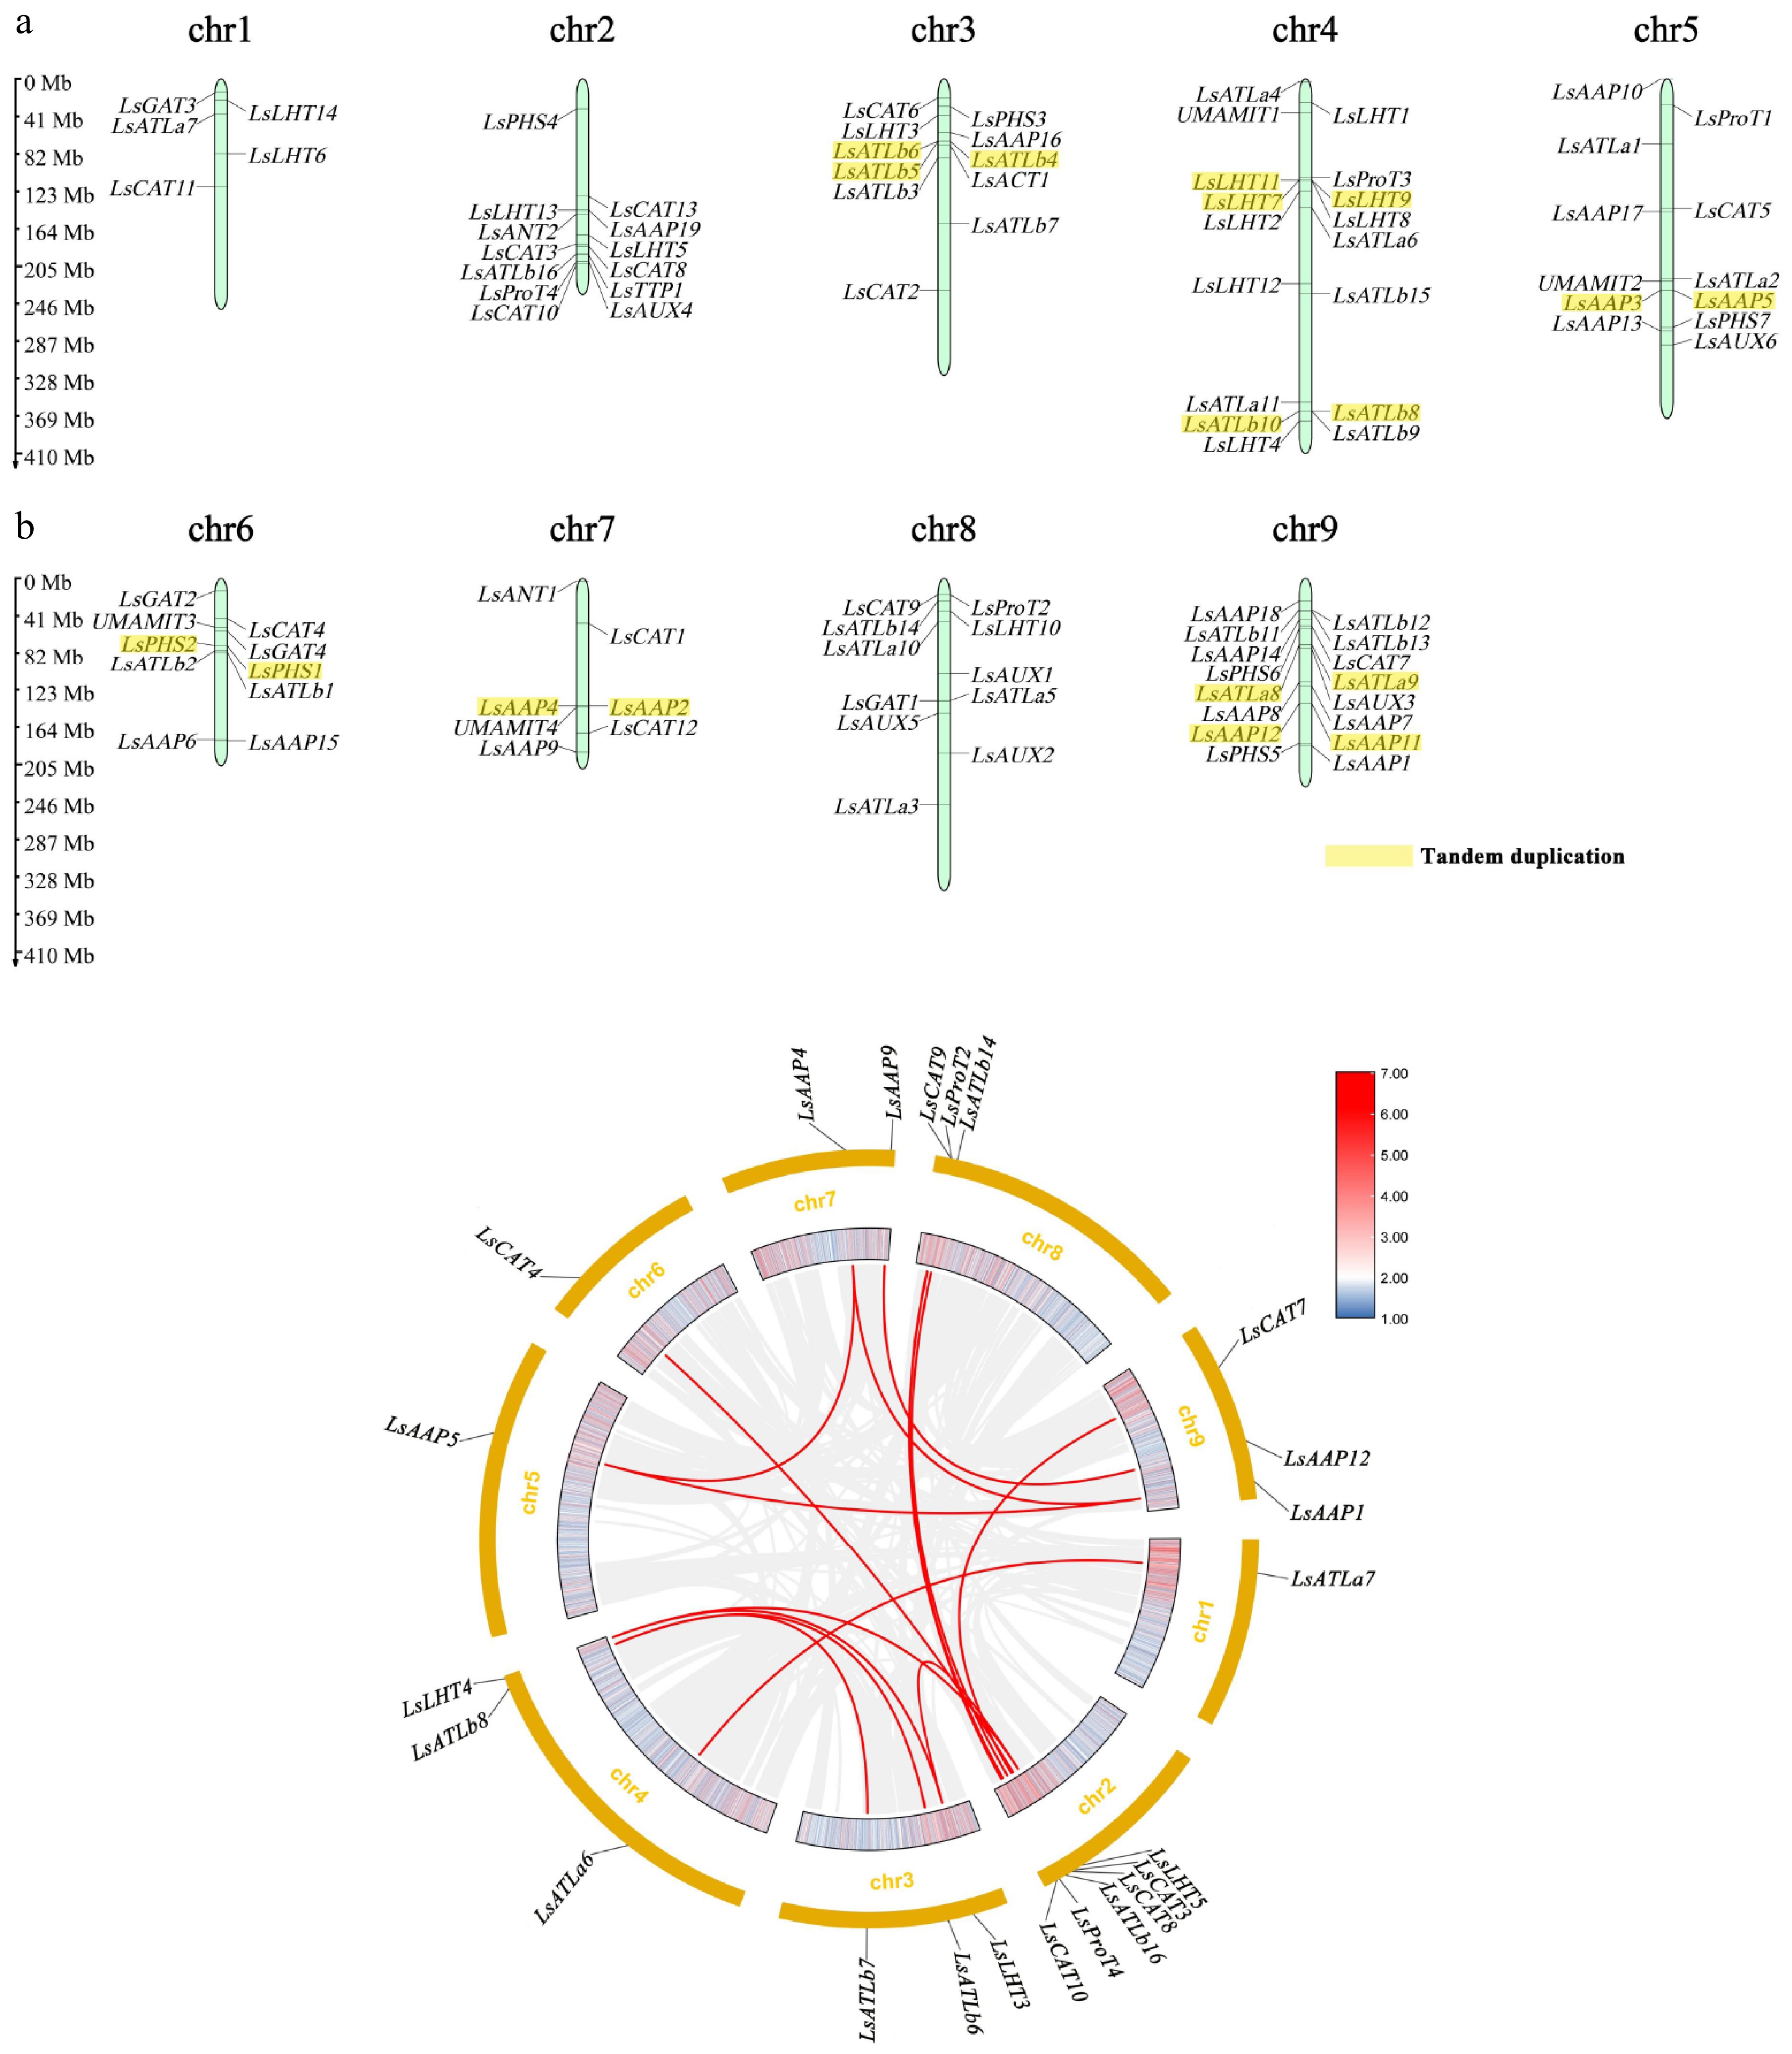
Figure 2.
Chromosomal localization and collinearity analysis of LsAATs. (a) Distribution of LsAATs on chromosomes. Tandem duplicated genes are marked in a yellow background. (b) Collinearity analysis of LsAATs. The outer ring depicts the nine lettuce chromosomes. Heatmap bars within the circle represented gene density in each chromosome, using a colour gradient from blue (low density) to red (high density). Red curved lines highlight the segmental duplicated genes.
-
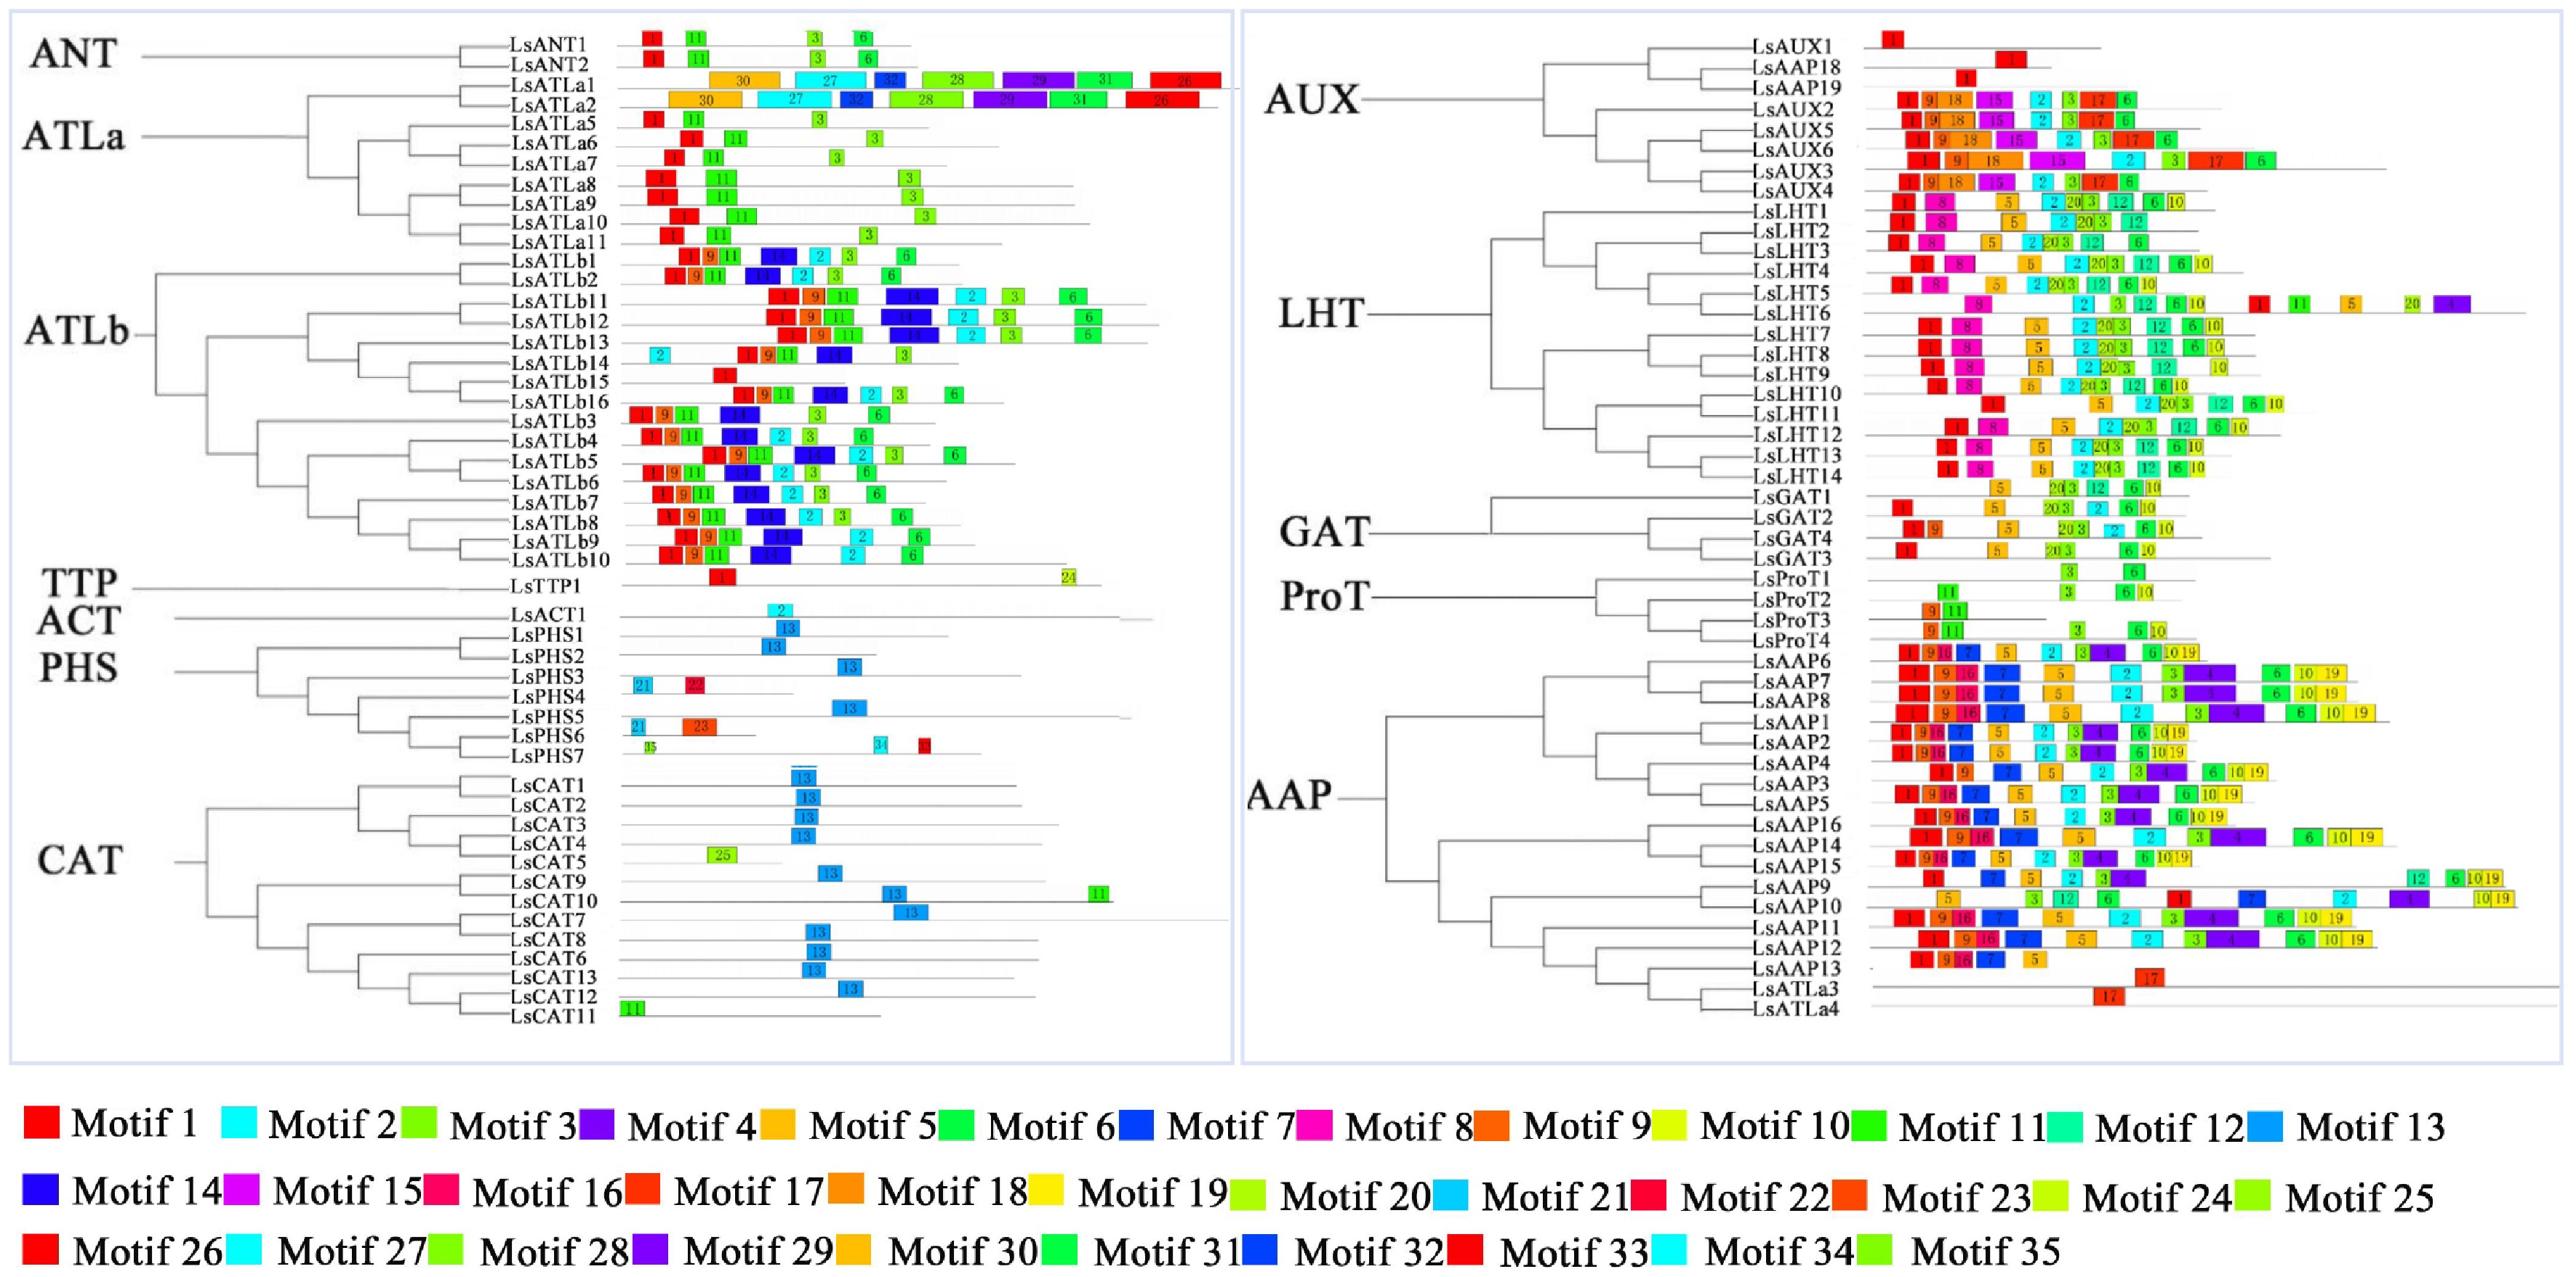
Figure 3.
Phylogenetic relationships and conserved motif architecture of LsAAT proteins across subfamilies. Different colored boxes represent specific motifs. The distribution of the motifs correspond to their position.
-
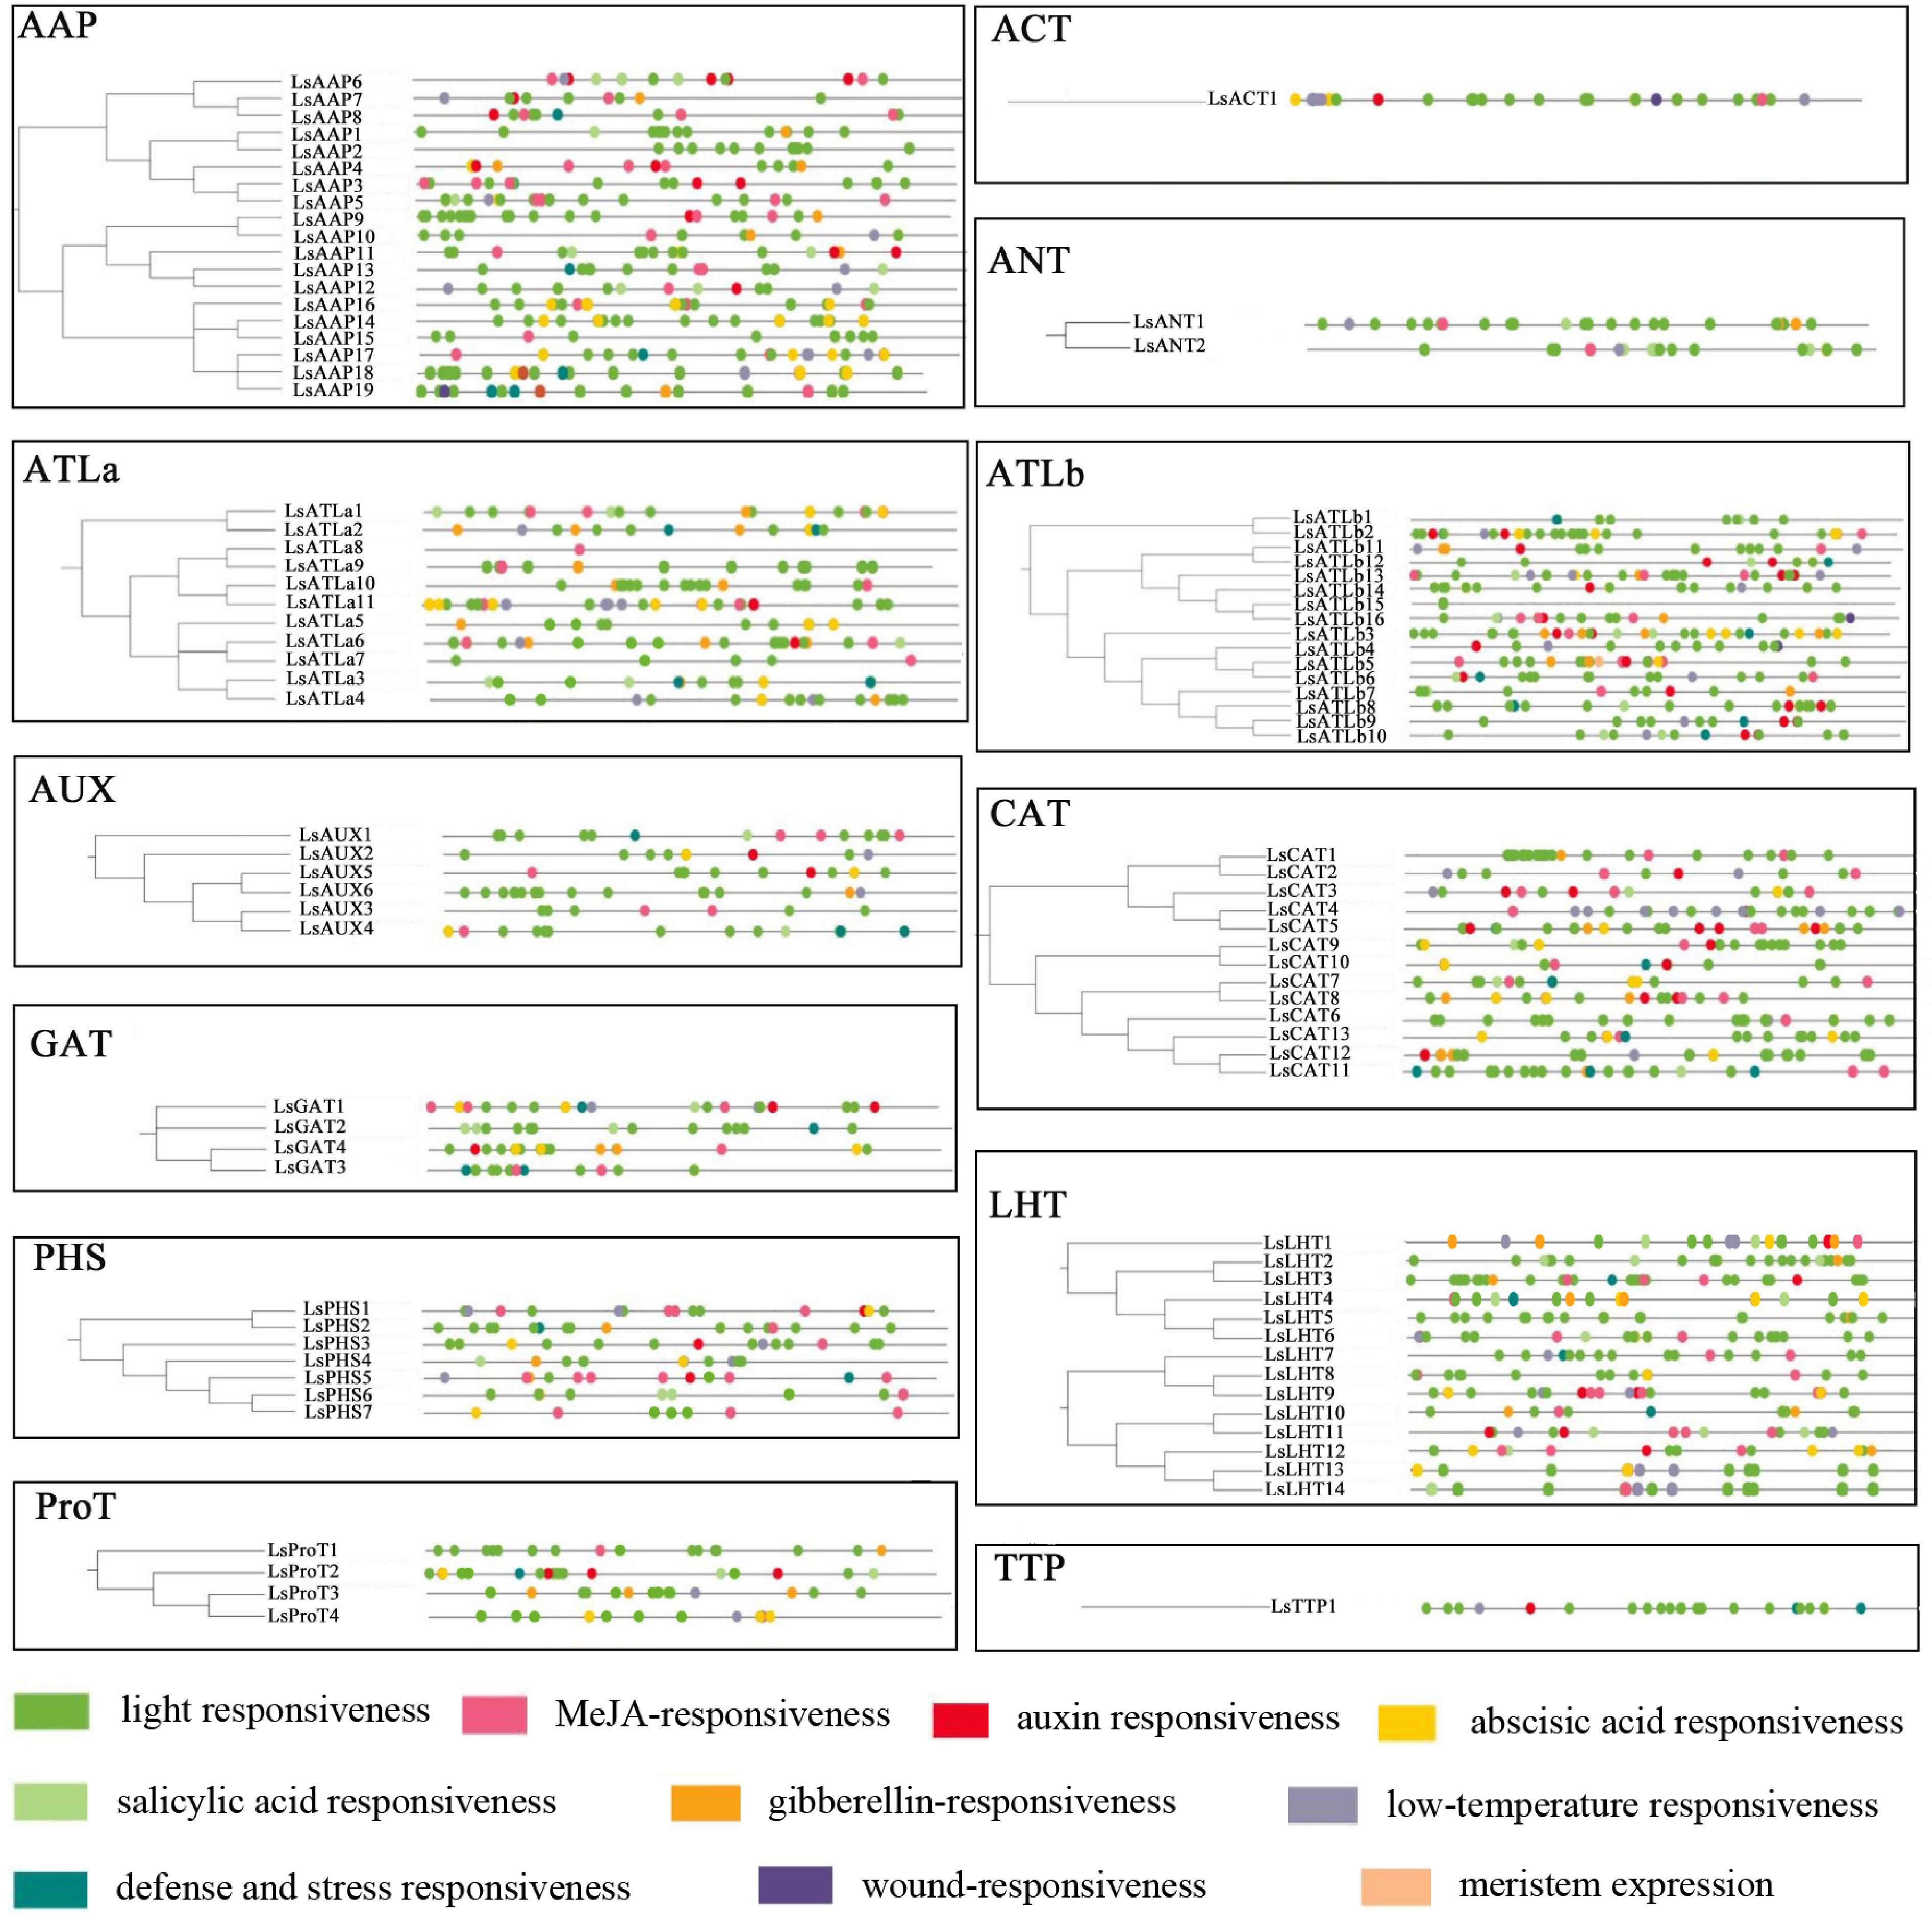
Figure 4.
Analysis of cis-acting elements in the promoters of LsAATs. The cis-regulatory elements were classified into light responsiveness, MeJA-responsiveness, auxin responsiveness, abscisic acid responsiveness, salicylic acid responsiveness, gibberellin-responsiveness, low-temperature responsiveness, defense and stress responsiveness, wound-responsiveness, and meristem expression.
-
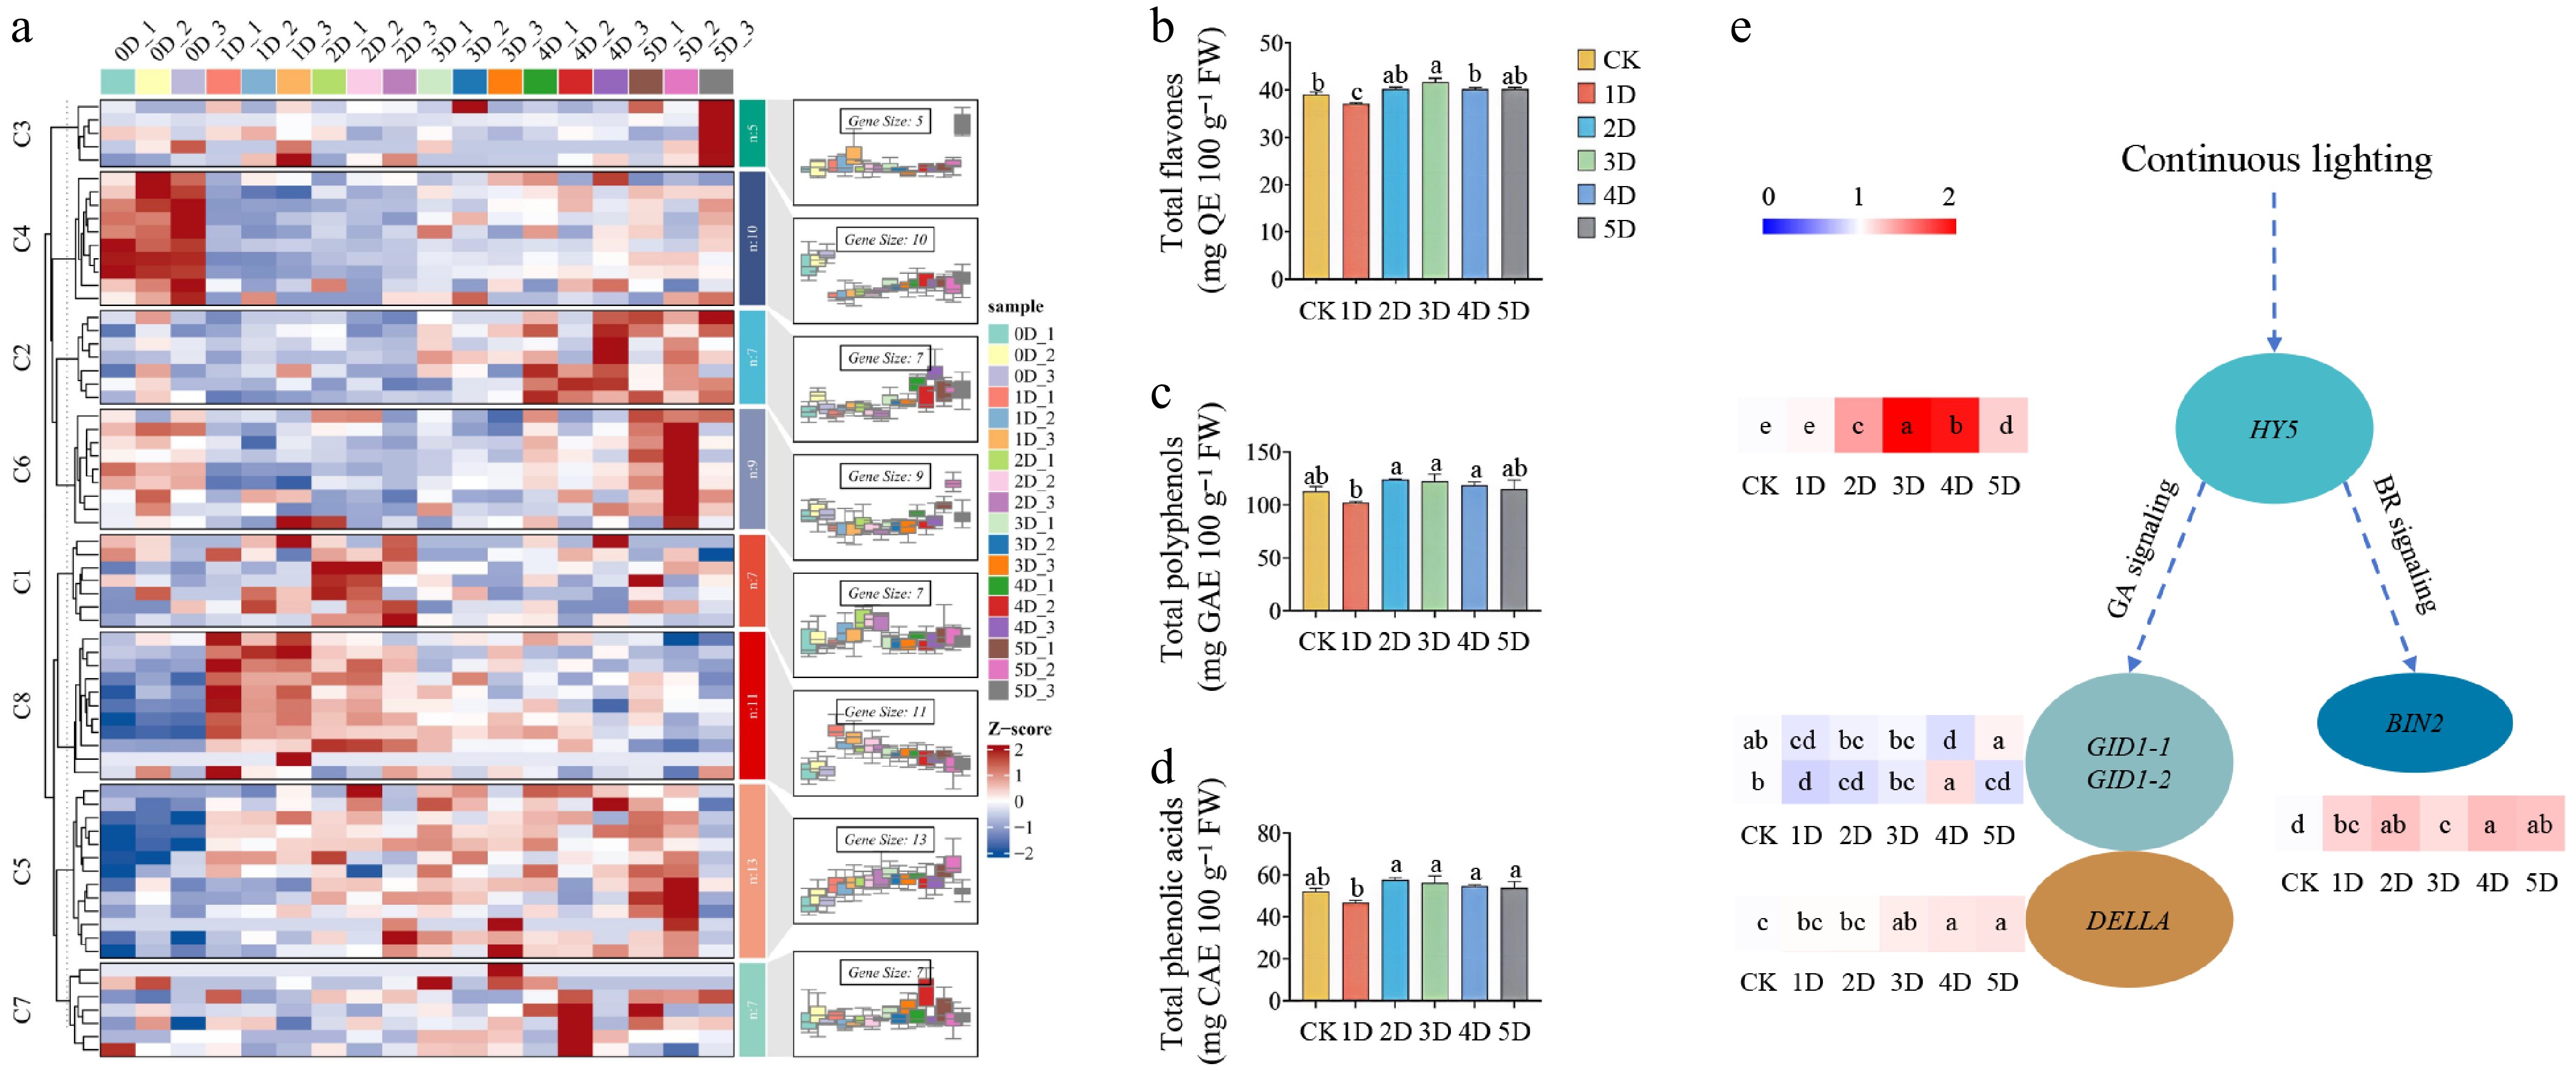
Figure 5.
Regulation of genes and quality-related indices under continuous lighting for 1 to 5 d before harvest. (a) Expression patterns of LsAATs. (b) Content of total flavones. (c) Content of polyphenols. (d) Content of phenolic acids. (e) Expression levels of genes involved in the potential regulatory pathways. High and low expression levels of genes are labeled in red and blue colors, respectively. The expression patterns of LsAATs were clustered into eight groups, and genes in different groups are provided in Supplementary Table S2.
-
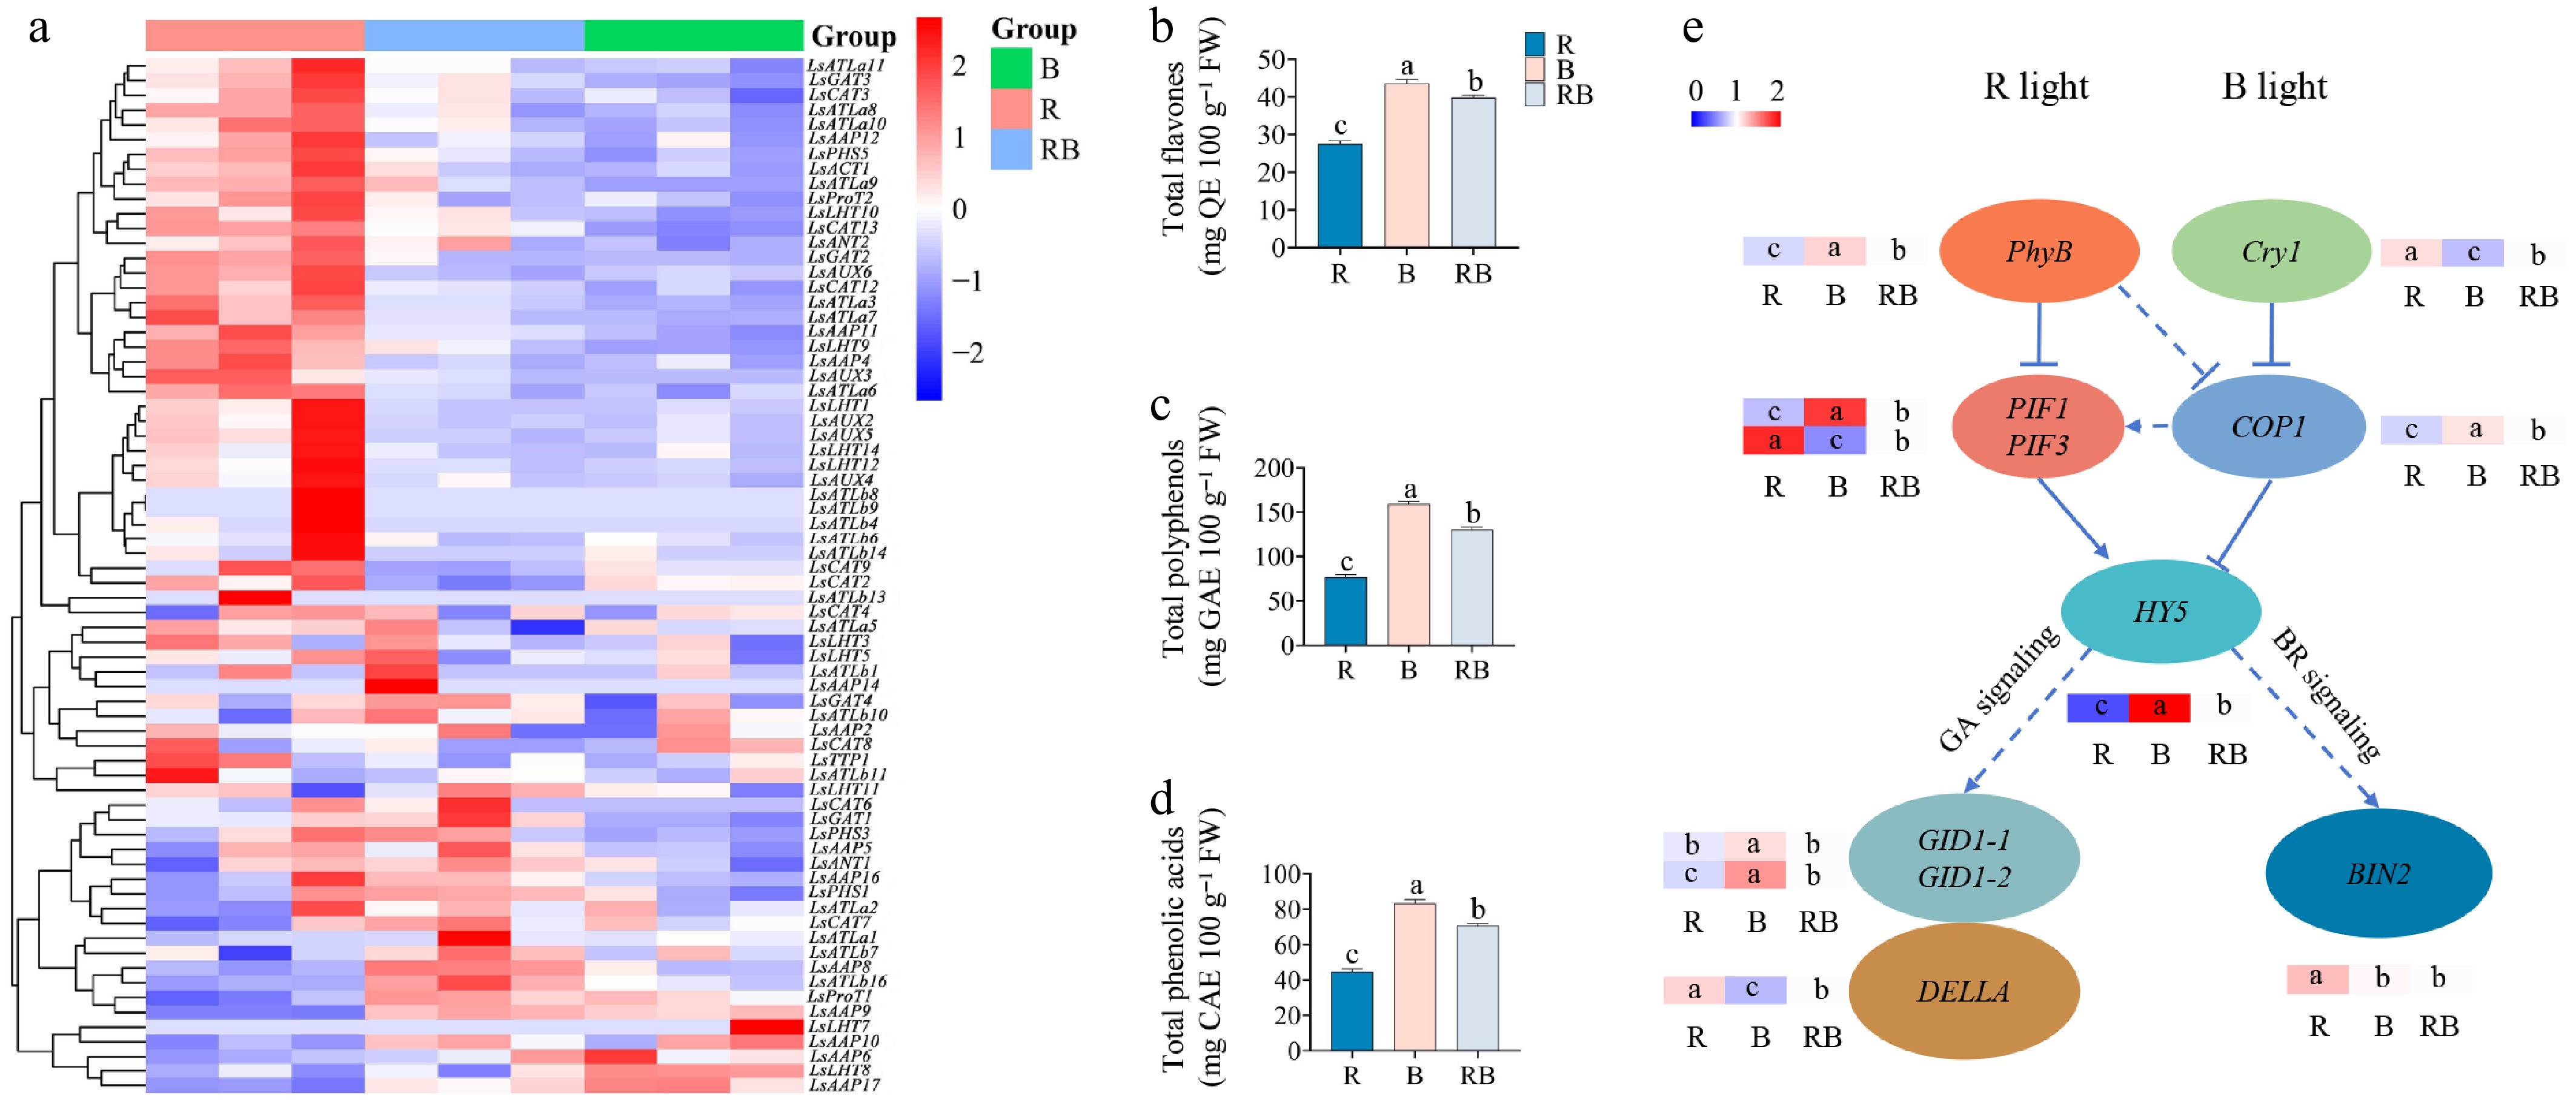
Figure 6.
Regulation of genes and quality-related indices under different light qualities for 6 d before harvest. (a) Expression of LsAATs. (b) Content of total flavones. (c) Content of polyphenols. (d) Content of phenolic acids. (e) Expression levels of genes involved in R and B light signaling pathways. High and low expression levels of genes are labeled in red and blue colors, respectively.
-
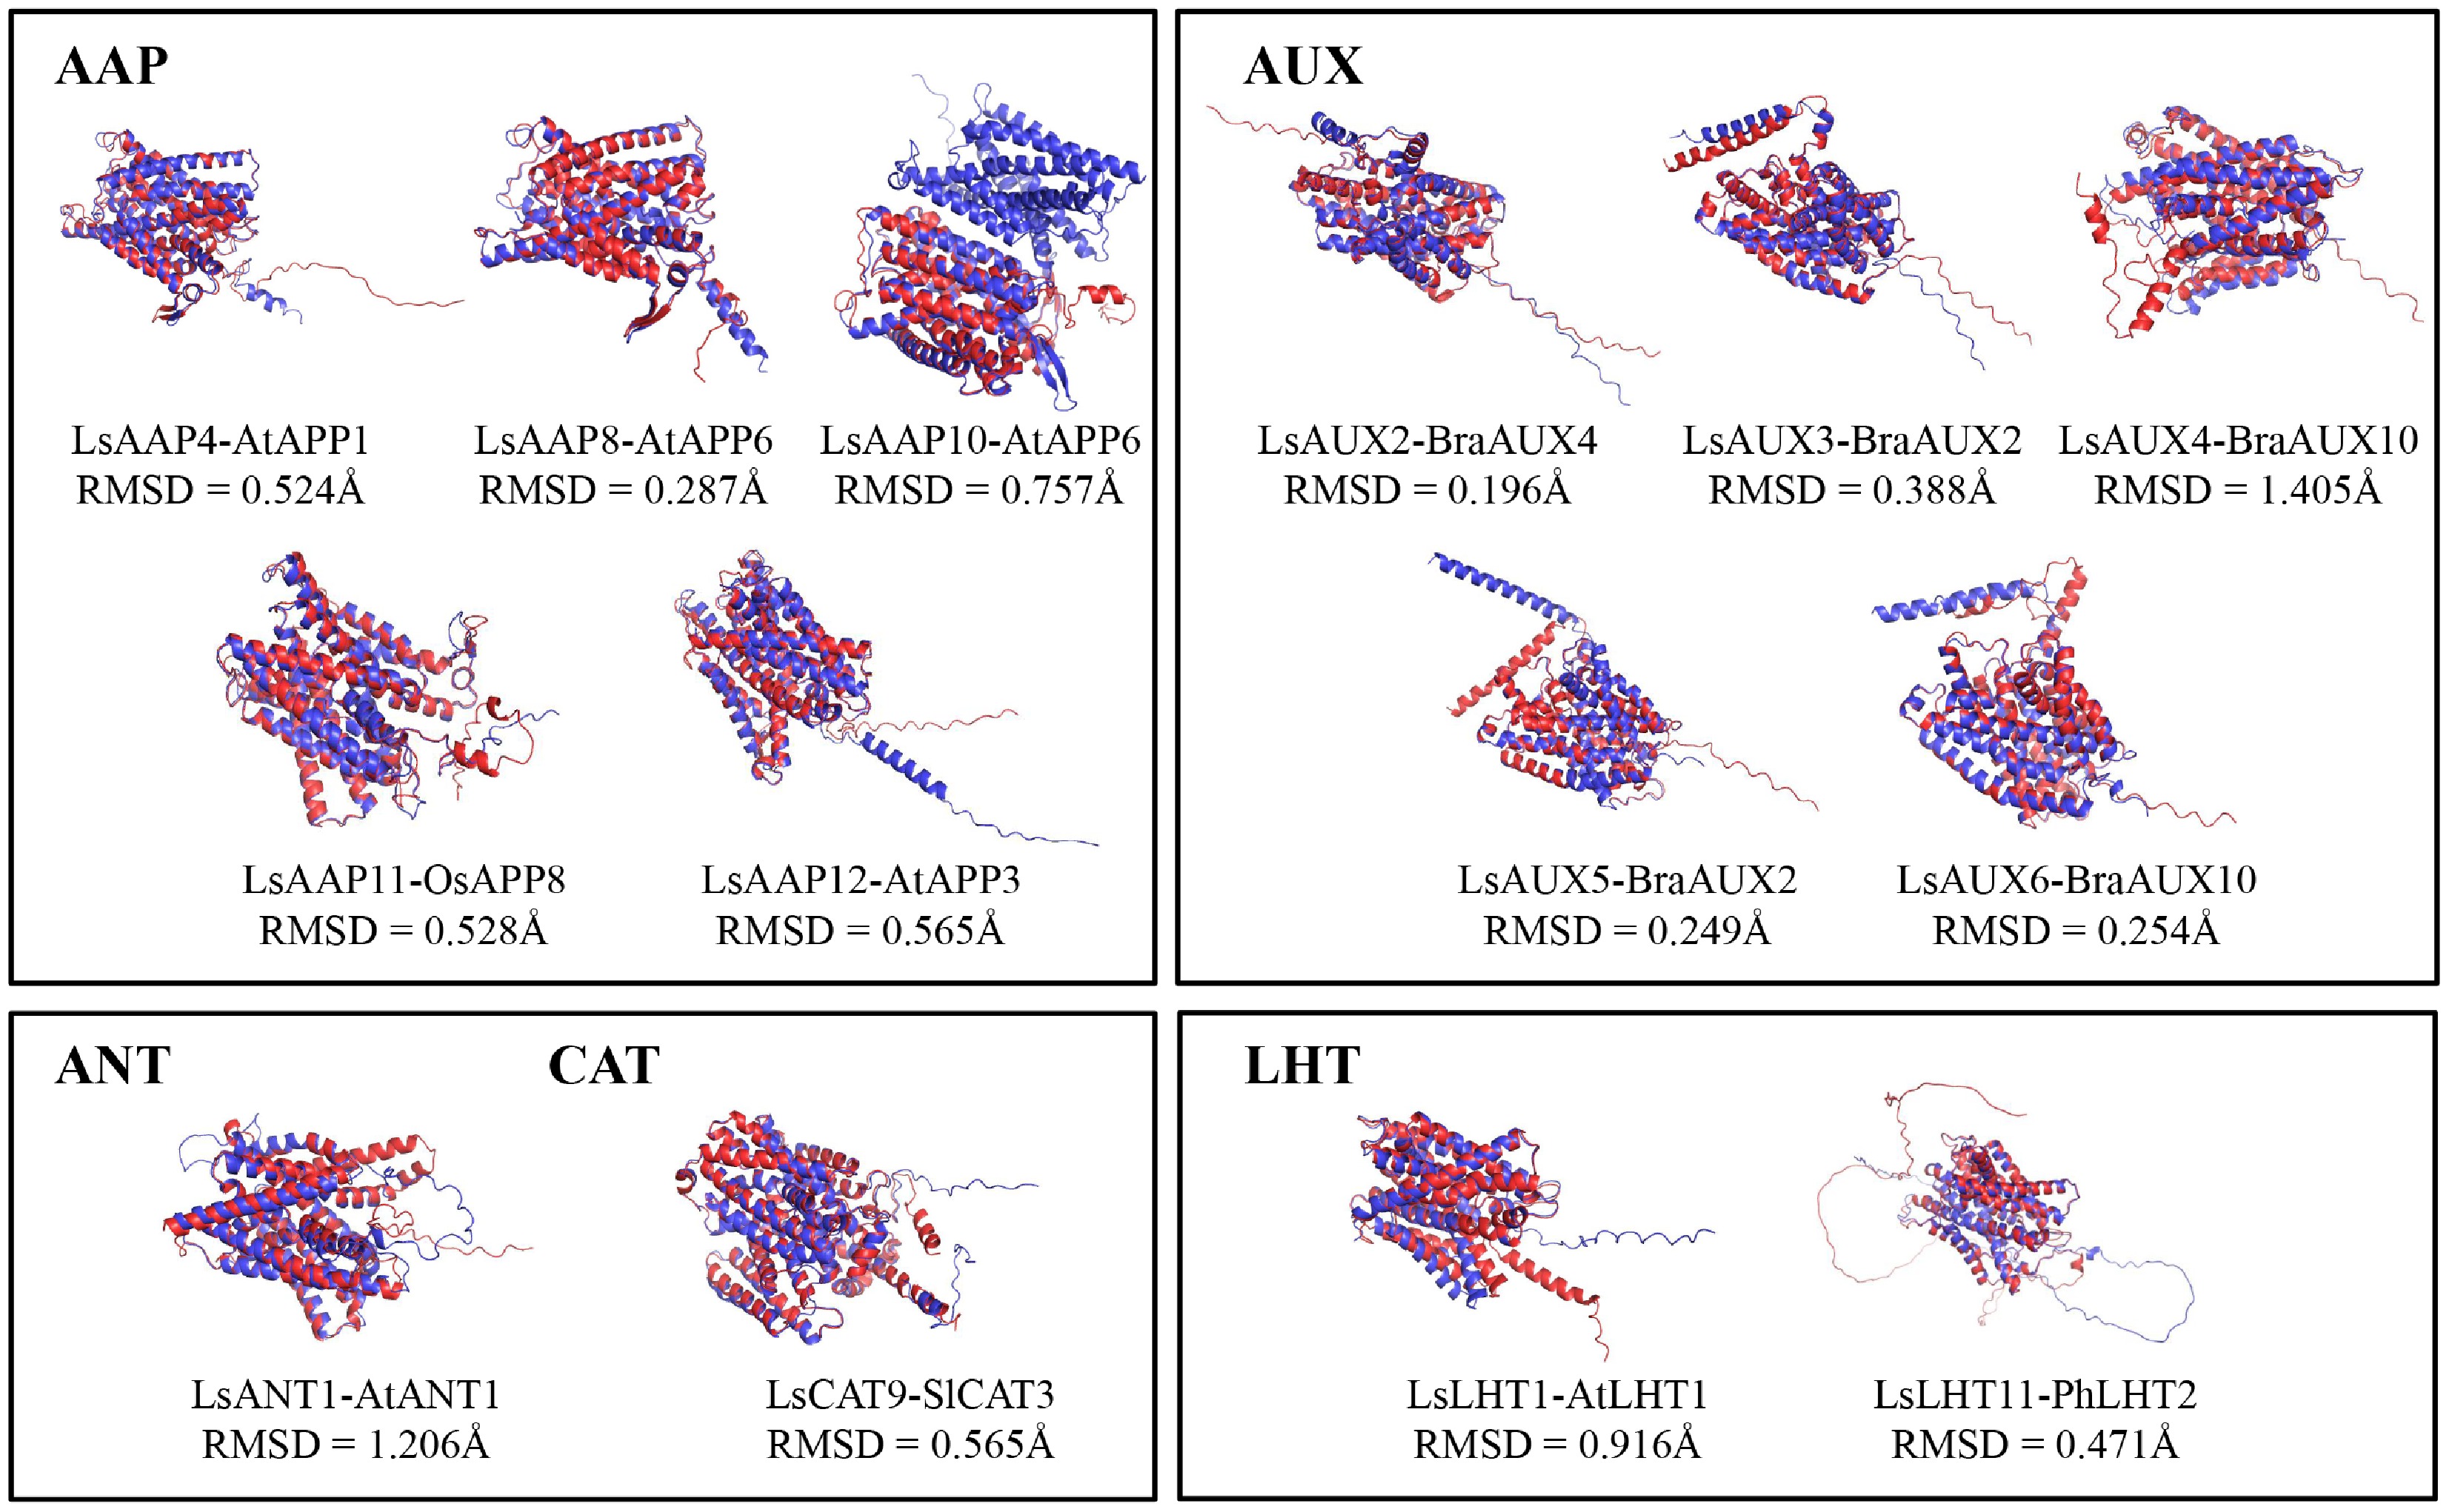
Figure 7.
Structural comparison between light-regulated LsAATs and functionally characterized AATs. Red and blue colors represent AATs in lettuce and other species, respectively.
-
Paralogous pair Ka Ks Ka/Ks Duplication date (MY) 1 LsAAP1-LsAAP4 0.203 1.533 0.132 125.61 2 LsAAP1-LsAAP5 0.221 2.229 0.099 171.472 3 LsAAP4-LsAAP5 0.162 0.966 0.168 79.165 4 LsAAP9-LsAAP12 0.356 1.938 0.184 149.076 5 LsATLa6-LsATLa7 0.167 1.321 0.126 101.585 6 LsATLb6-LsATLb8 0.341 2.143 0.159 164.855 7 LsATLb7-LsATLb8 0.214 1.396 0.153 107.395 8 LsATLb14-LsATLb16 0.236 0.768 0.307 62.964 9 LsCAT3-LsCAT4 0.260 1.227 0.212 94.400 10 LsCAT7-LsCAT8 0.118 0.848 0.139 65.237 11 LsCAT9-LsCAT10 0.182 1.666 0.109 128.176 12 LsLHT3-LsLHT4 0.201 2.570 0.078 197.688 13 LsLHT3-LsLHT5 0.216 2.079 0.104 170.423 14 LsLHT4-LsLHT5 0.084 1.046 0.081 85.737 15 LsProT2-LsProT4 0.125 0.974 0.129 79.832 Table 1.
Selection history and divergence between paralogous gene pairs.
Figures
(7)
Tables
(1)