-
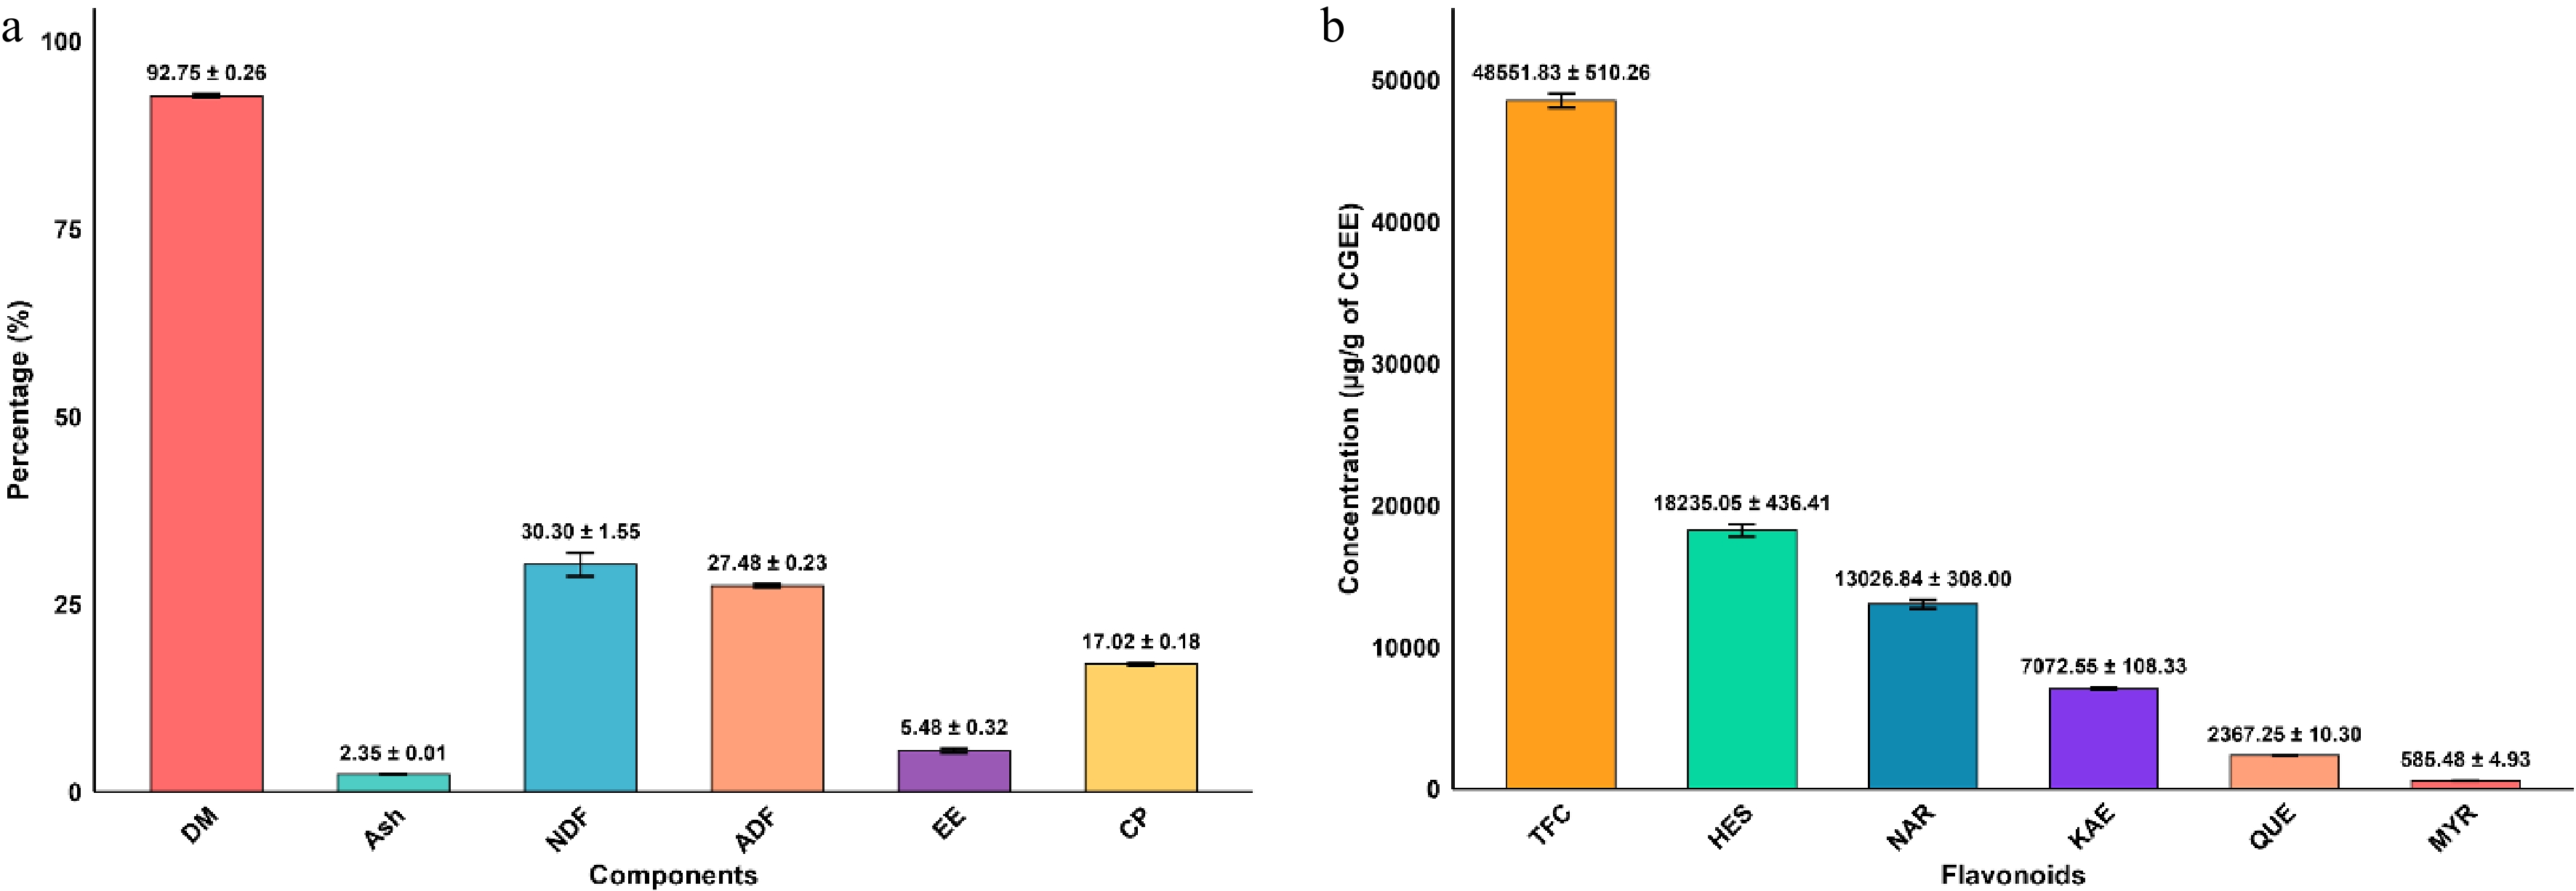
Figure 1.
(a) Proximate analysis of leaf powder showing dry matter (DM), ash, neutral detergent fiber (NDF), acid detergent fiber (ADF), ether extract (EE), and crude protein (CP) content. Descriptive statistical analysis of data presented in mean ± SD (% dry matter basis). (b) Flavonoid composition of Calotropis gigantea ethanolic extract, showing total flavonoid content (TFC) and individual flavonoid concentrations: hesperidin (HES), naringin (NAR), kaempferol (KAE), quercetin (QUE), and myricetin (MYR). Values presented as mean ± SD (µg/g extract).
-
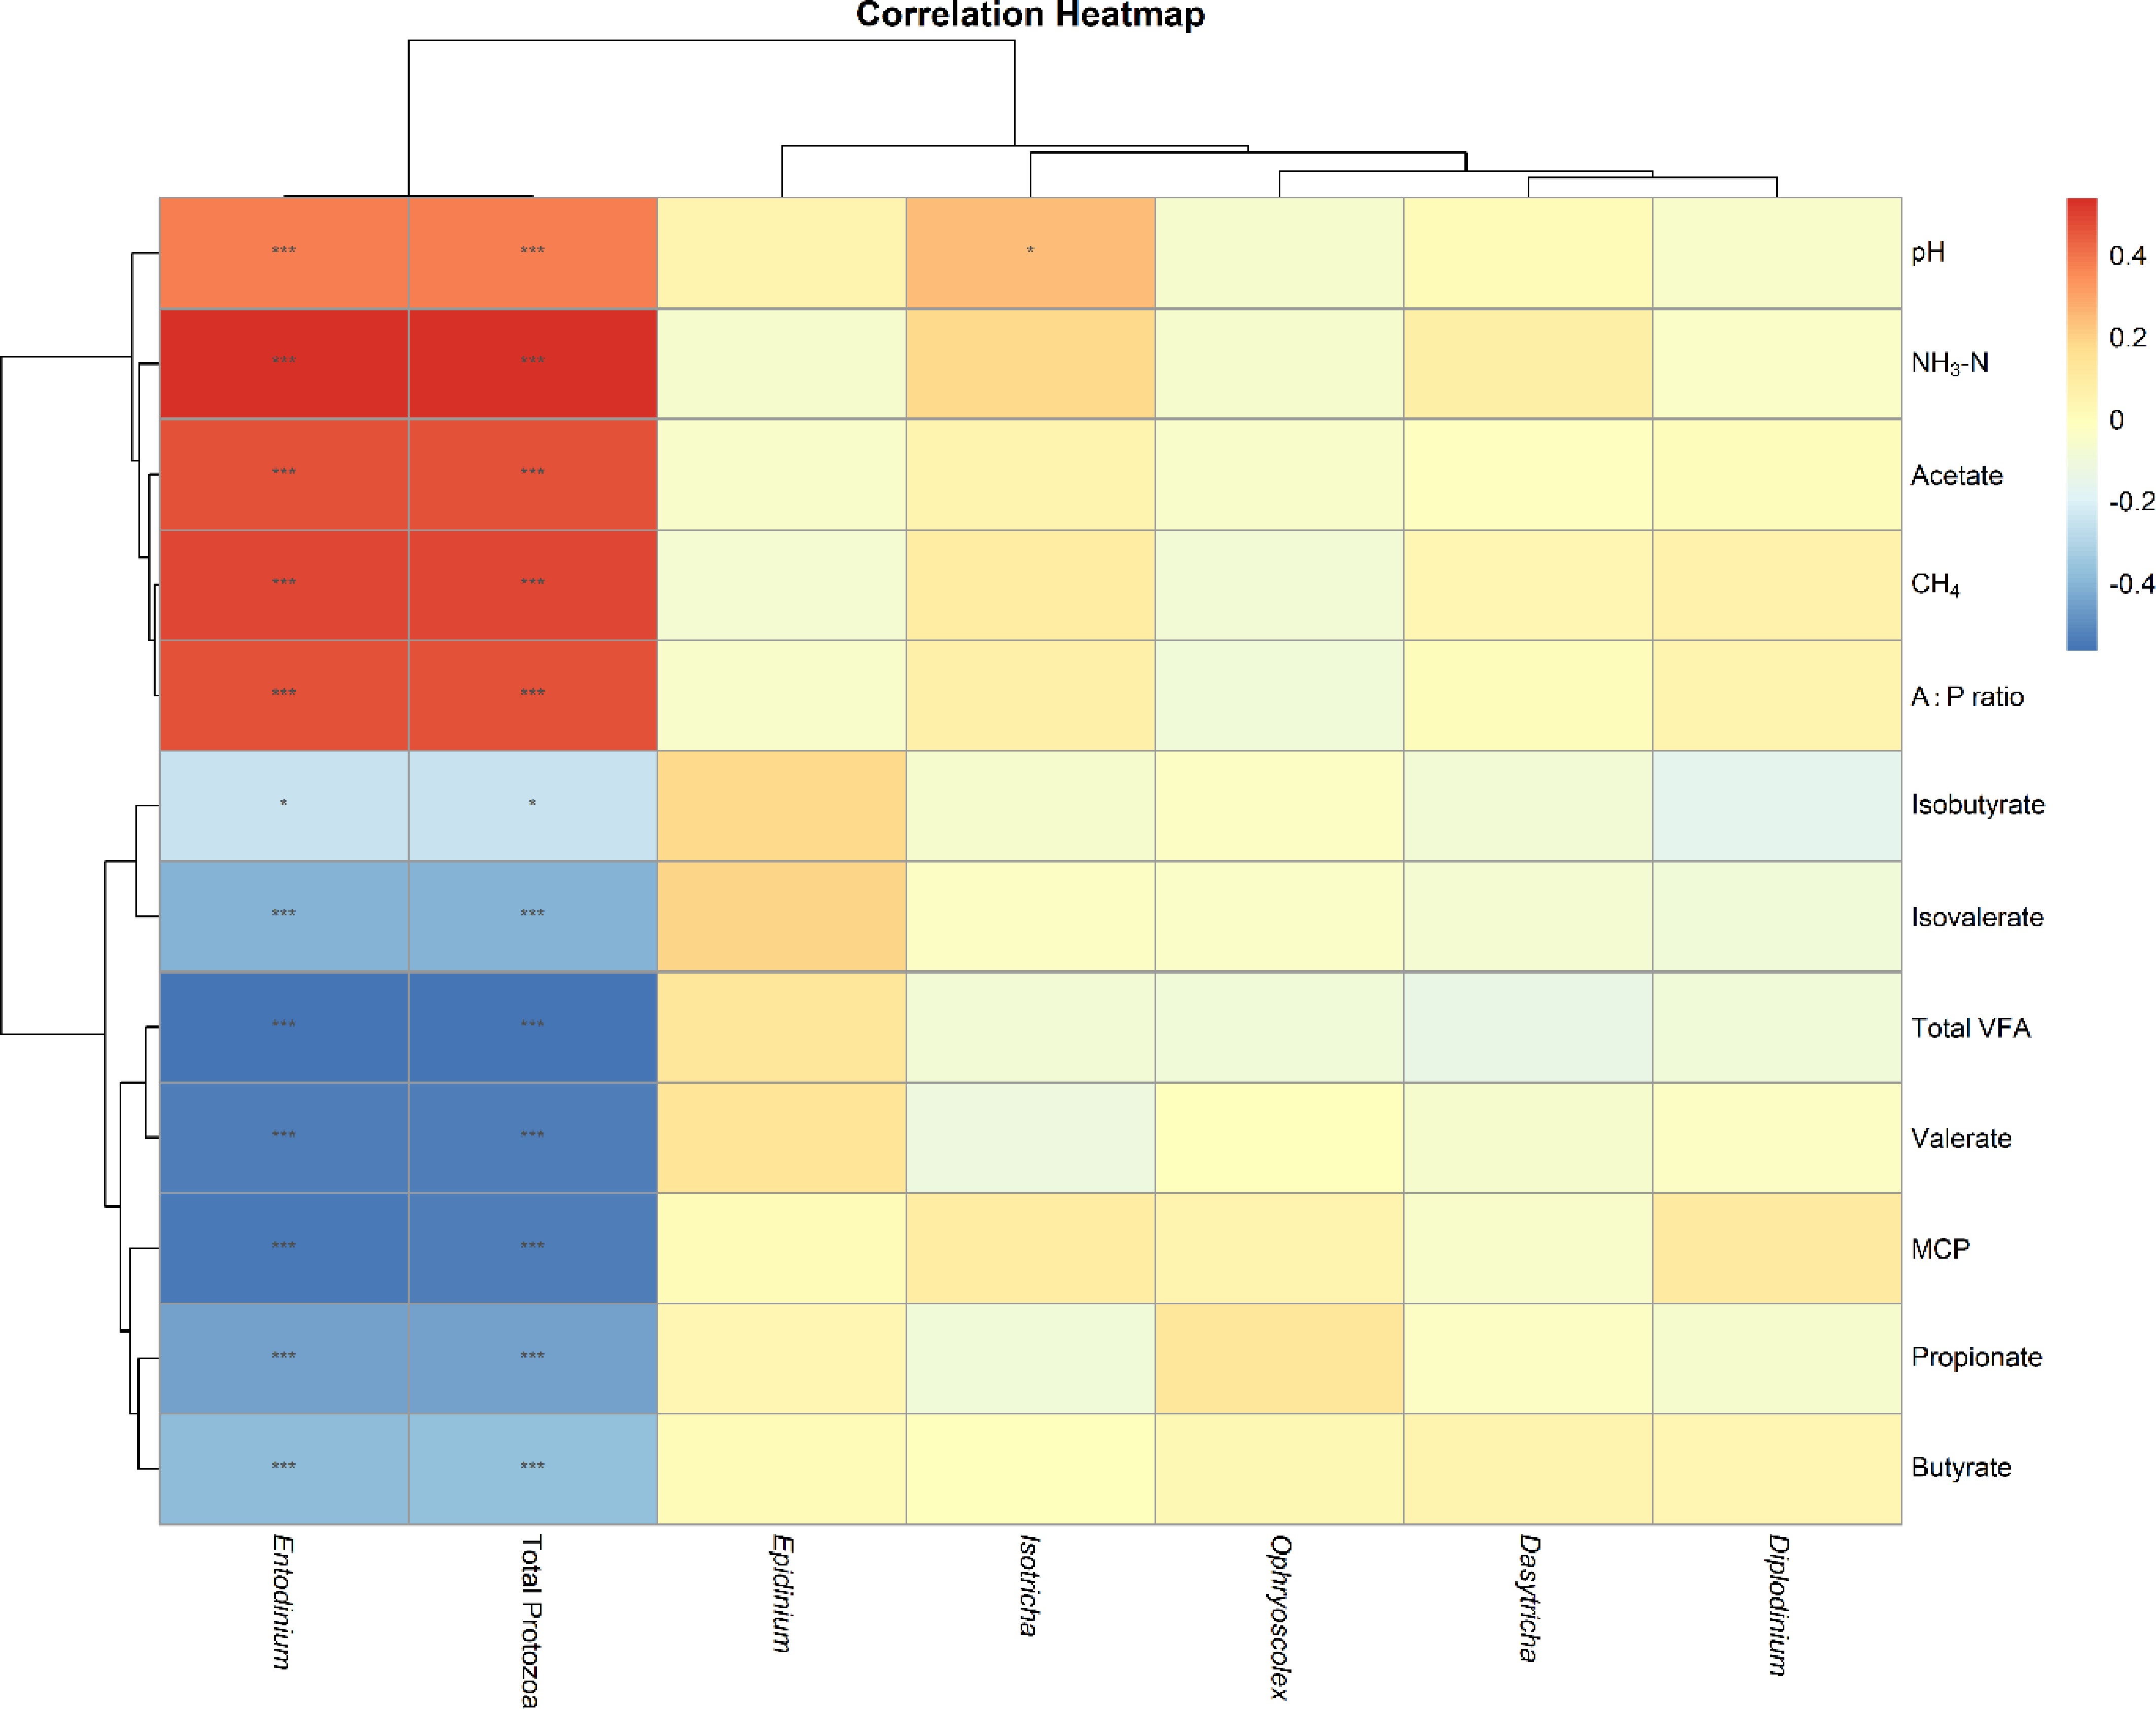
Figure 2.
Sperman's correlation analysis between protozoal genera and rumen fermentation parameters. Color intensity represents correlation strength (red: positive; blue: negative) with significance denoted as * p < 0.05, ** p < 0.01, and *** p < 0.001.
-
Parameters Treatments (4.5% DM) SEM p value CON KAE HES NAR KAE + HES KAE + NAR HES + NAR KAE + HES + NAR CGFE pH 6.47a 6.46ab 6.45ab 6.37cd 6.41abc 6.43abc 6.42abc 6.40bcd 6.34d 0.01 < 0.001 TVFA (mM) 45.2d 47.7cd 48.9cd 48.9cd 51.0cd 55.0bcd 56.2bc 62.4b 80.8a 2.17 < 0.001 Individual VFA (mol/100 mol) Acetate 54.3bc 55.7ab 56.1ab 54.8bc 56.8a 54.8bc 53.1c 53.3c 47.3d 0.38 < 0.001 Propionate 18.2b 17.4d 17.7bcd 18.0bc 17.5cd 17.8bcd 18.1bc 18.3b 20.0a 0.12 < 0.001 Butyrate 24.0bc 23.5b 22.8c 23.9bc 22.4c 23.9bc 25.4b 24.7b 27.9a 0.39 < 0.001 Isobutyrate 0.82b 0.78b 0.81b 0.76b 0.77b 0.82b 0.77b 0.82b 0.95a 0.02 < 0.001 Valerate 1.38c 1.35c 1.41bc 1.39c 1.34c 1.43bc 1.43bc 1.56b 2.17a 0.03 < 0.001 Isovalerate 1.25b 1.22b 1.21b 1.19b 1.18b 1.26b 1.24b 1.29b 1.58a 0.03 < 0.001 A:P ratio 2.99de 3.20ab 3.16abc 3.04cde 3.24a 3.08bcd 2.94de 2.91e 2.37f 0.03 < 0.001 NH3-N, mg/dL 19.4a 13.3cd 17.6ab 15.0bcd 13.2cd 13.7cd 15.9abc 12.9cd 12.0d 0.83 < 0.001 Methane*, mol/100mol 29.0bc 29.7a 29.5ab 29.3abc 29.7a 29.3ab 29.1bc 28.8c 27.0d 0.09 < 0.001 MCP, mg/mL 1.94bcd 2.01bc 1.10e 1.53cde 1.80bcd 1.77bcd 1.43de 2.13b 3.14a 0.11 < 0.001 * Estimated from standard stoichiometric equation: Methane = 0.45 × (Acetate proportion) − 0.275 × (Propionate proportion) + 0.40 × (Butyrate proportion)[1,2]. TVFA total volatile fatty acids, VFA volatile fatty acids, NH3-N ammonia nitrogen; MCP microbial crude protein. Fermentation parameters across treatments: control (CON), kaempferol (KAE), hesperidin (HES), naringin (NAR), their combinations, and Calotropis gigantea flavonoid extract (CGFE). Means with different superscripts differ (p < 0.05). SEM = standard error. Table 1.
Effect of flavonoid treatments on rumen fermentation characteristics, ammonia-N, methane, and microbial protein.
-
Log10 cells/mL Treatments (4.5% DM) SEM p value CON KAE HES NAR KAE + HES KAE + NAR HES + NAR KAE + HES + NAR CGFE Total protozoa 5.59a 5.46bc 5.53ab 5.51abc 5.44c 5.55a 5.54ab 5.35d 5.33d 0.02 < 0.001 Isotricha 3.27 2.64 1.75 1.36 1.75 2.04 1.39 1.00 1.80 0.48 0.079 Dasytricha 1.33 0.97 0.68 0.65 0.68 0.68 0.68 0.65 0.65 0.46 0.977 Entodinium 5.59a 5.45bc 5.52abc 5.51abc 5.44c 5.54a 5.53ab 5.34d 5.32d 0.02 < 0.001 Epidinium 0.32 0.65 0.32 0.36 0.32 0.32 0 0.68 0.68 0.33 0.917 Diplodinium 0.97 1.72 1.00 1.82 0.71 0.71 0.32 0.68 1.00 0.48 0.433 Ophryoscolex 3.36 2.91 2.62 3.39 3.33 3.16 3.43 2.21 3.39 0.24 0.079 Prokaryotes (log10 copies/mL) Total bacteria* 11.9ab 12.6a 12.1ab 12.0ab 12.5ab 12.0ab 11.8ab 12.4ab 11.9ab 0.17 0.006 Total Methanogens⁑ 9.23d 10.1abc 9.76bcd 9.60bcd 9.37cd 10.3ab 10.2ab 10.6a 10.2ab 0.16 < 0.001 Control (CON), kaempferol (KAE), hesperidin (HES), naringin (NAR), Calotropis gigantea extract (CGFE). Means with different superscripts within rows differ (p < 0.05). SEM = standard error of the mean, * absolute abundance expressed as log10 copies of 16S rRNA genes per mL culture, ⁑absolute abundance expressed as log10 copies of mcrA genes per mL culture. Table 2.
Effect of different flavonoid treatments on microbial populations.
Figures
(2)
Tables
(2)