-
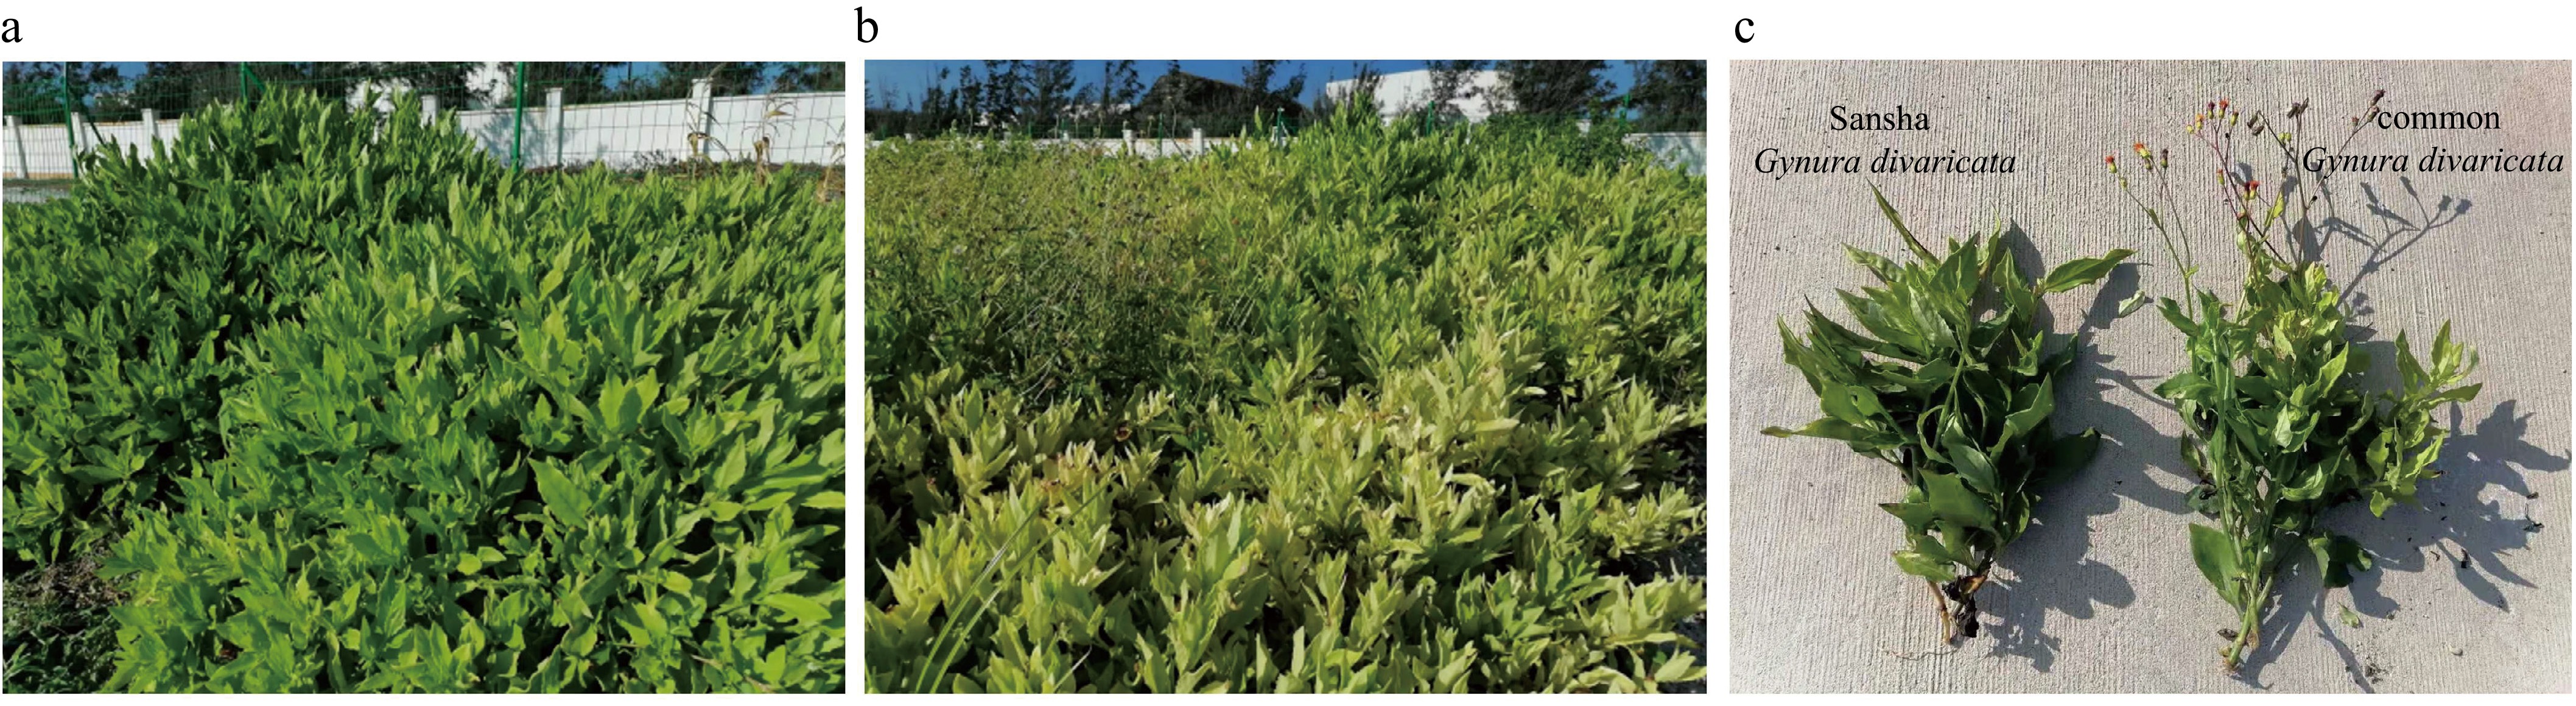
Figure 1.
Gynura divaricate and Sansha Gynura divaricate grown on Yongxing island in Sansha city. The stem segments of common Gynura divaricate and Sansha Gynura divaricate with the same shape and two internodes were planted on Yongxing Island of Sansha. In March, the plants were photographed; (a) Sansha Gynura divaricate, (b) Gynura divaricate, and (c) branches of Sansha Gynura divaricate and common Gynura divaricate.
-
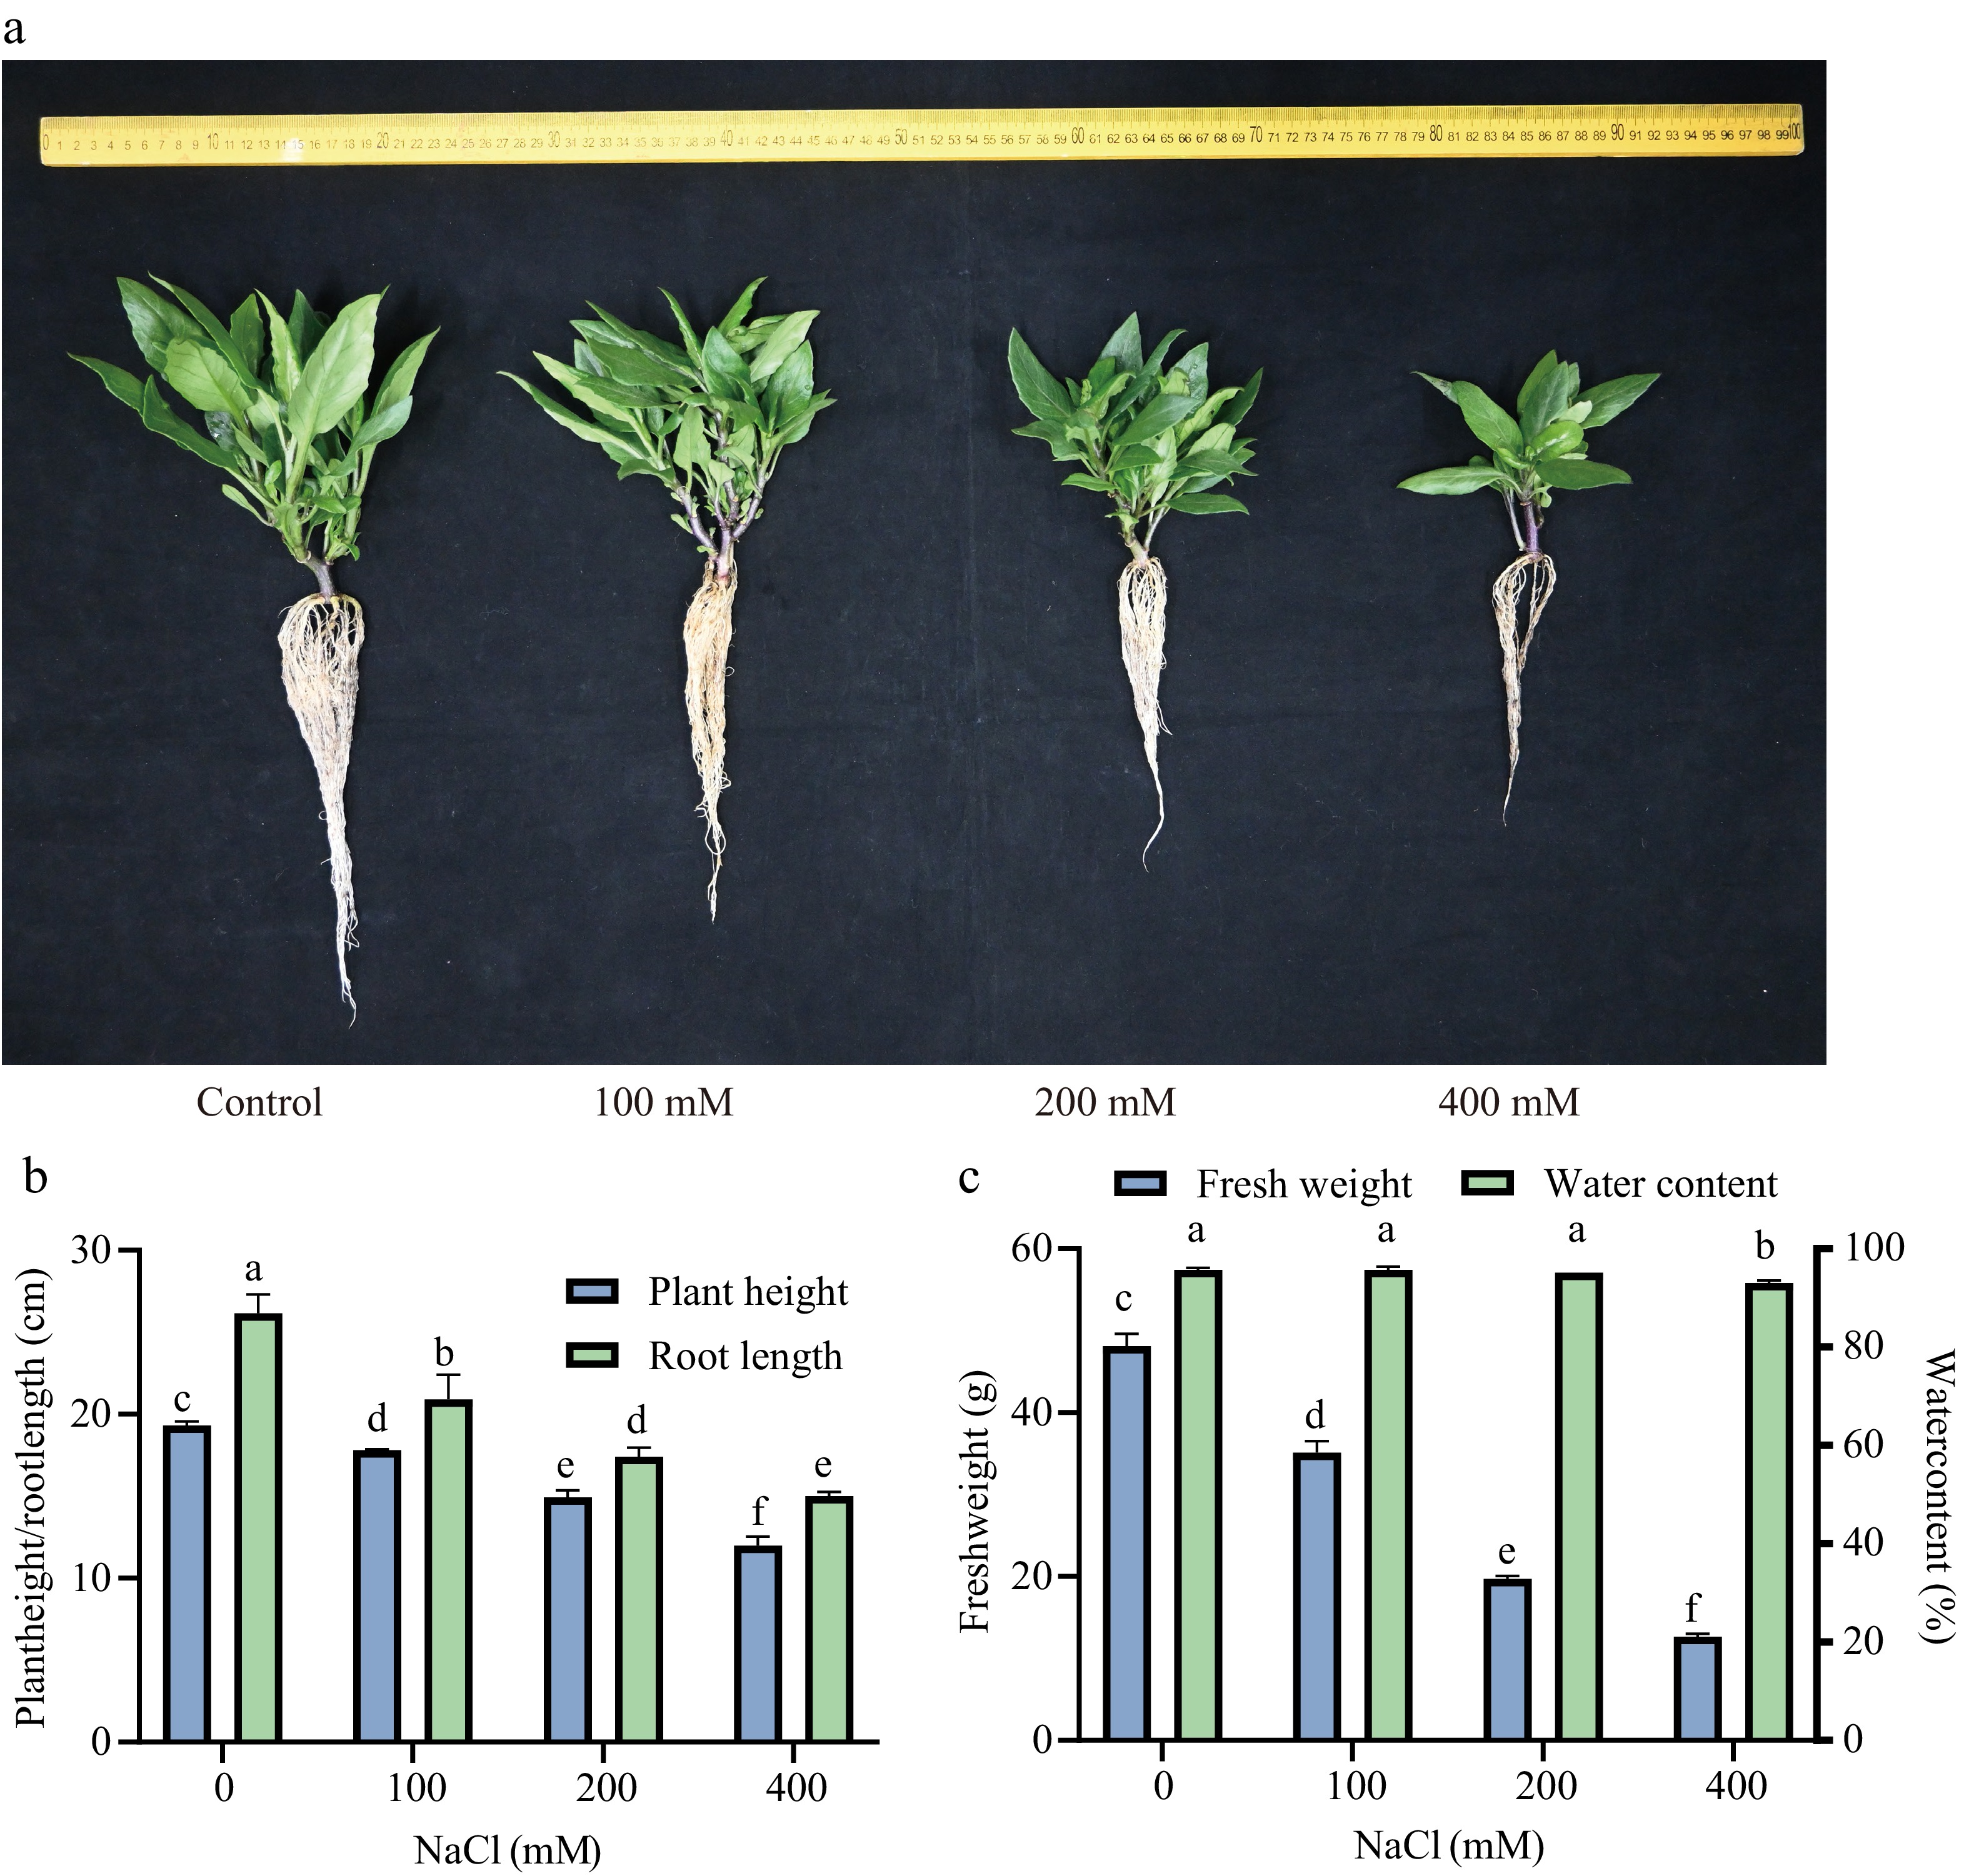
Figure 2.
Effect of salt stress on the growth of Sansha Gynura divaricate. The seedlings cultured for 2 weeks were treated with 0, 100, 200, and 400 mM NaCl. After 23 d, the seedlings were sampled and (a) photographed. (b) Plant height and root length, and (c) fresh weight and water content were measured. The data were expressed as mean ± SE of three replicates. The different letters at the top of the column indicate significant differences at p < 0.05.
-
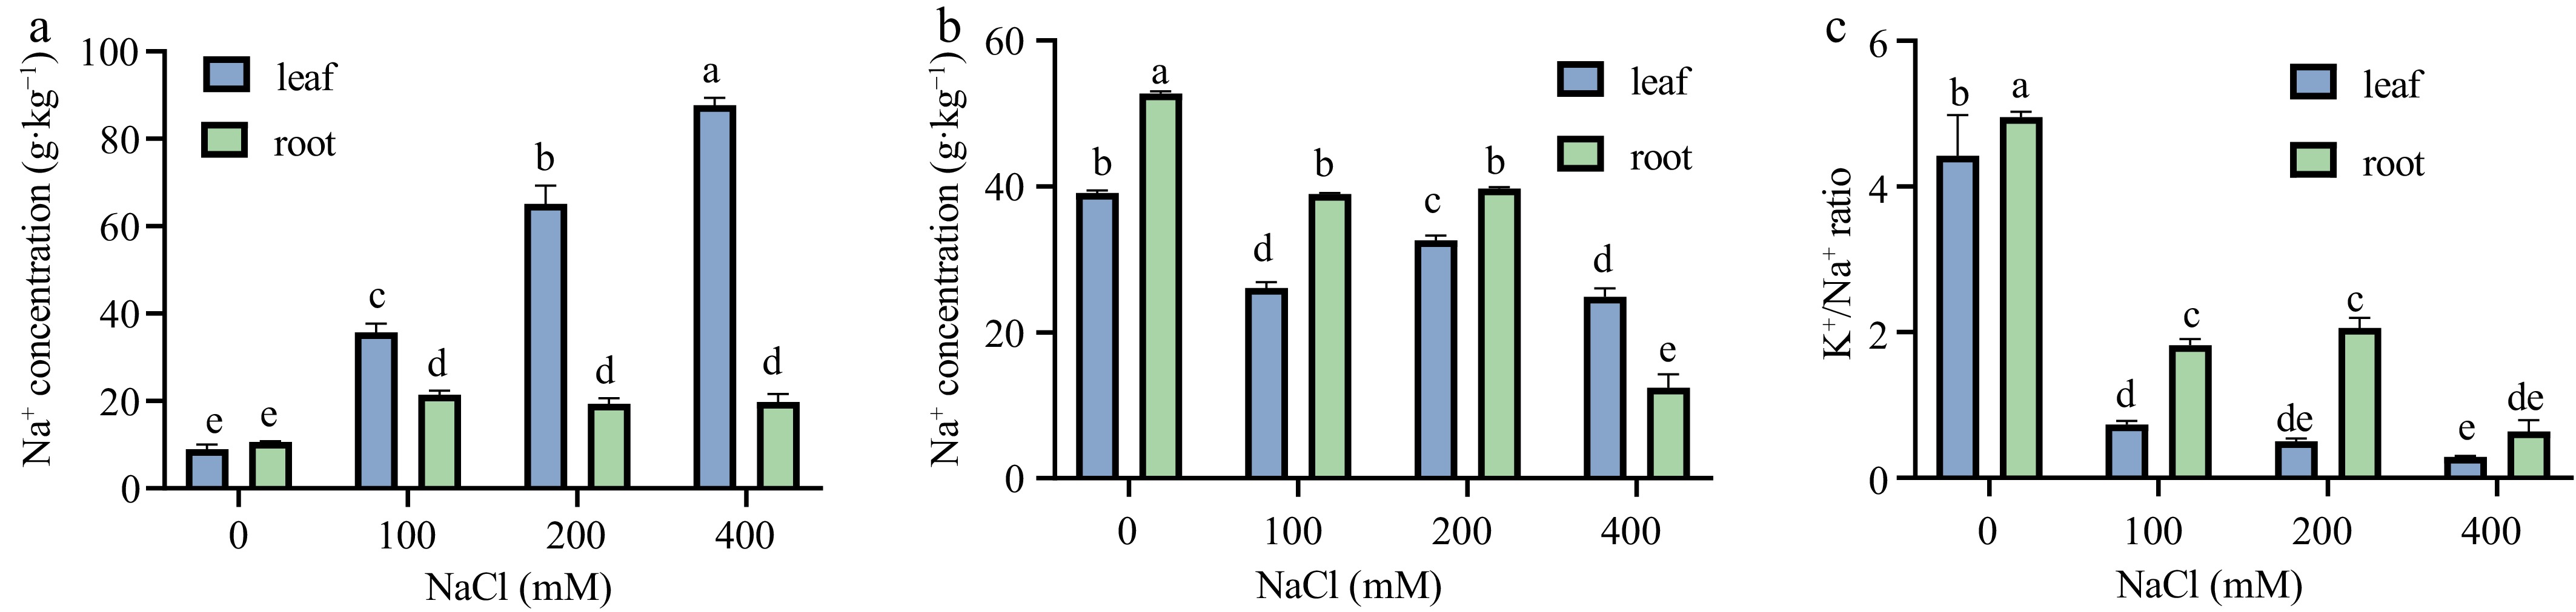
Figure 3.
Effects of salt stress on Na+ and K+ contents of Sansha Gynura divaricata. The leaves and roots of Sansha Gynura divaricata were harvested after salt treatment, and the contents of (a) Na+, and (b) K+ were determined by flame spectrophotometer. (c) The ratio of Na+ to K+. The data is expressed as mean ± SE of three replicates. The different letters at the top of the column indicate significant differences at p < 0.05.
-
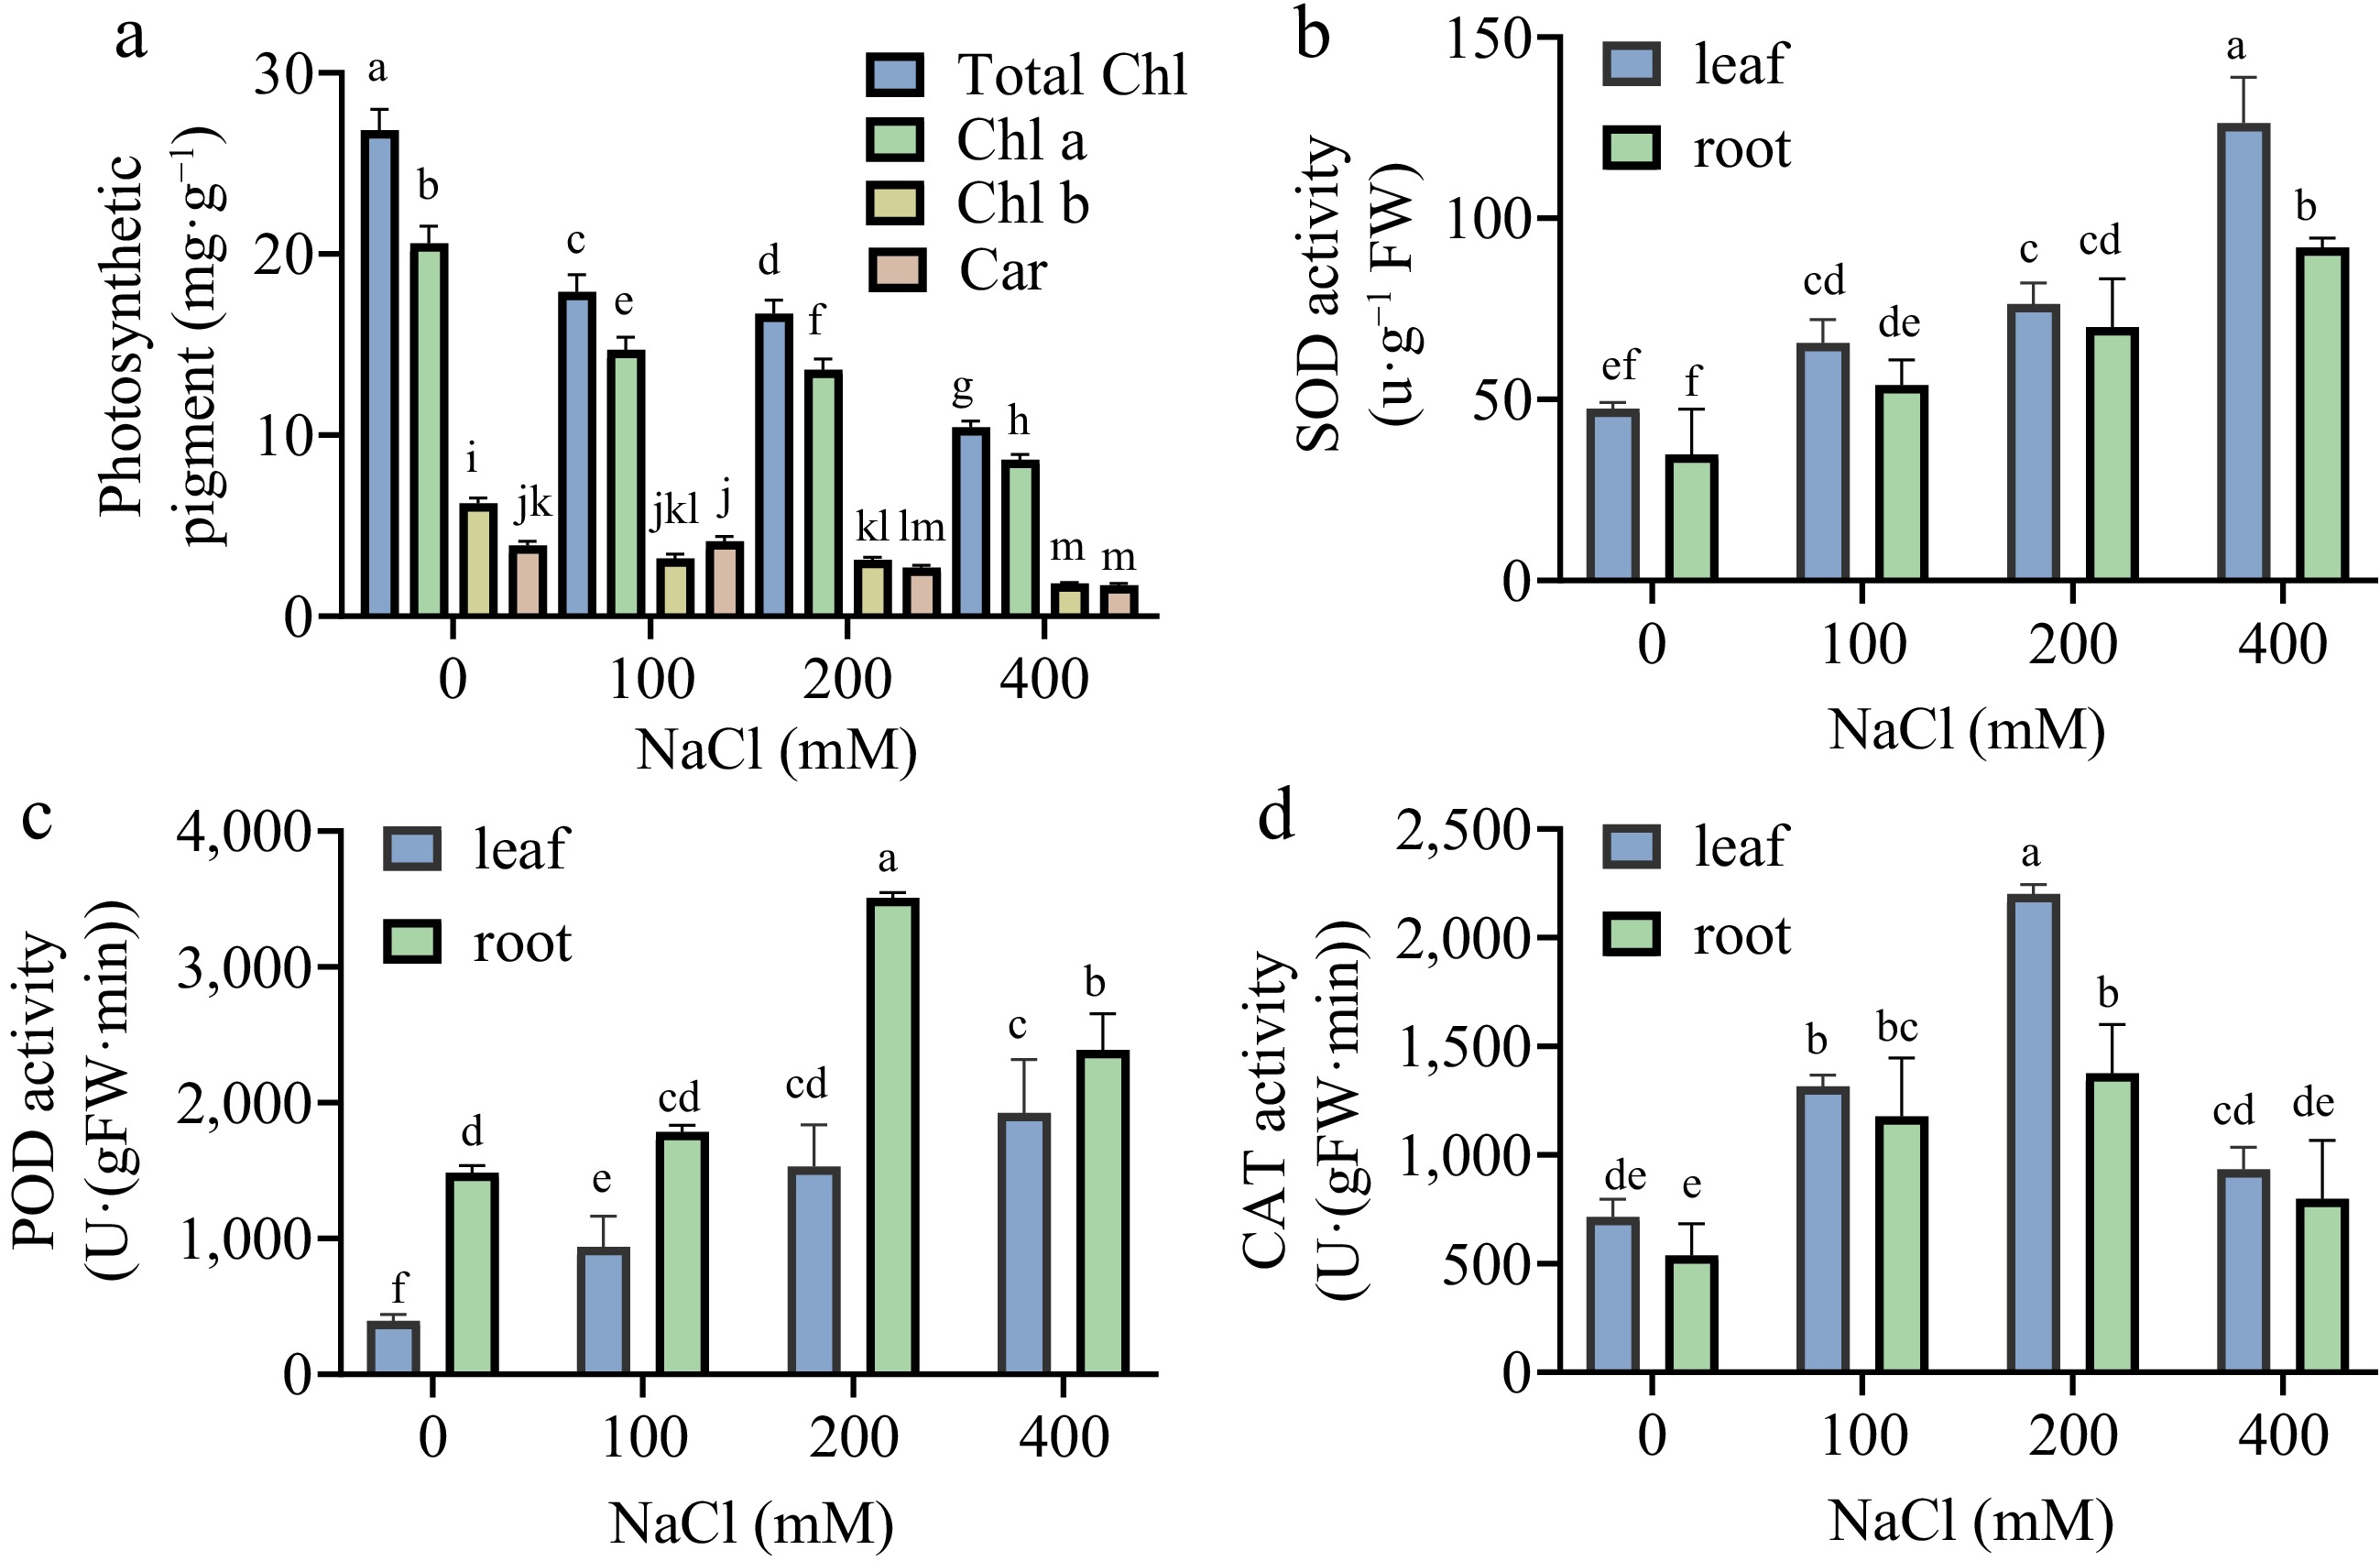
Figure 4.
Effects of salt stress on the activities of photosynthetic pigments and antioxidant enzymes of Sansha Gynura divaricata. The leaves and roots of Sansha Gynura divaricata were harvested after salt treatment, and the activities of (a) photosynthetic pigment, (b) SOD, (c) POD, and (d) CAT were determined by enzyme labeling instrument. The data is expressed as mean ± SE of three replicates. The different letters at the top of the column indicate significant differences at p < 0.05.
-
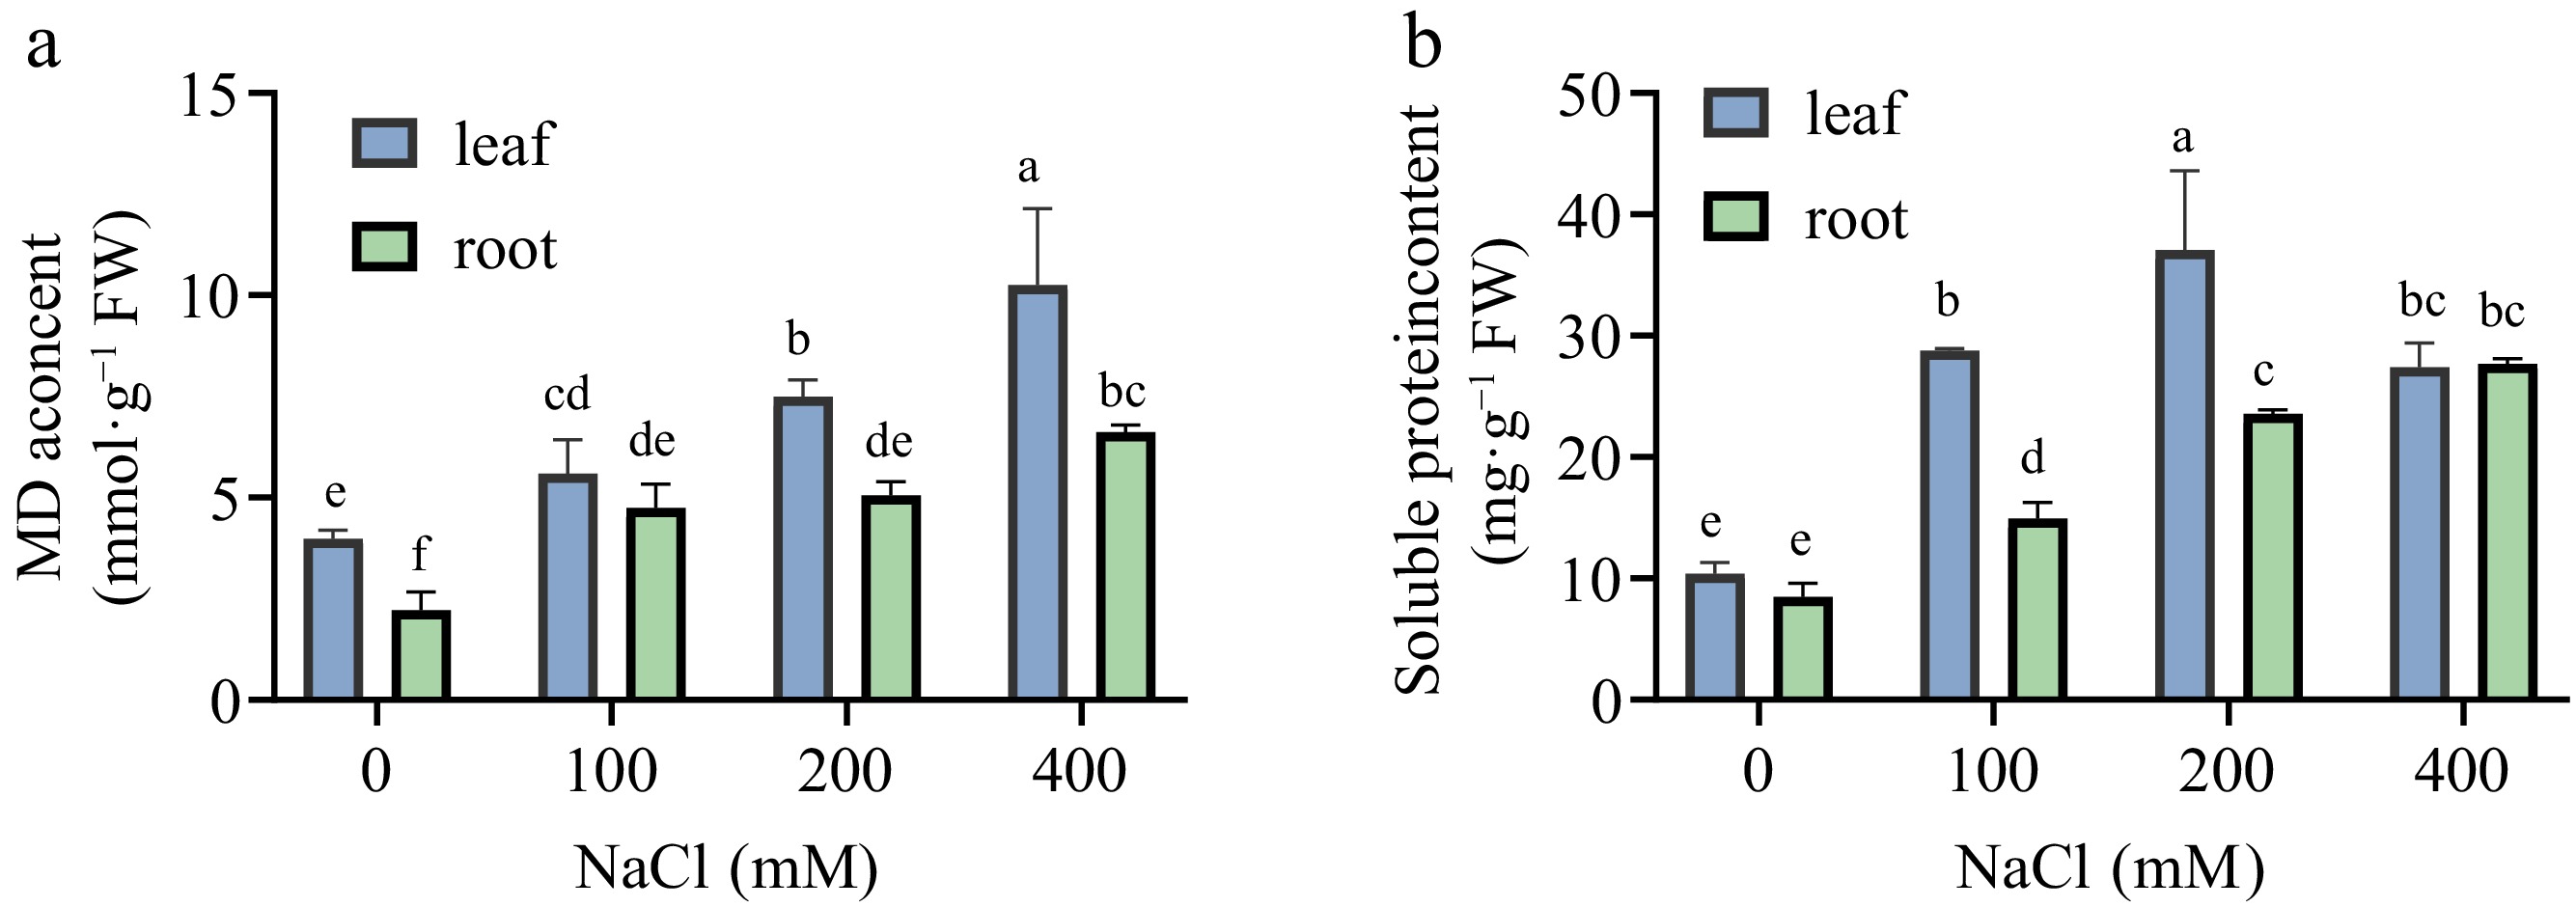
Figure 5.
Effects of salt stress on MDA content and osmotic regulation substances of Sansha Gynura divaricata. The leaves and roots of Sansha Gynura divaricata were harvested after salt treatment. The contents of (a) MDA, and (b) soluble protein were determined by enzyme labeling instrument. The data were expressed as mean ± SE of three replicates. The different letters at the top of the column indicate significant differences at p < 0.05.
-
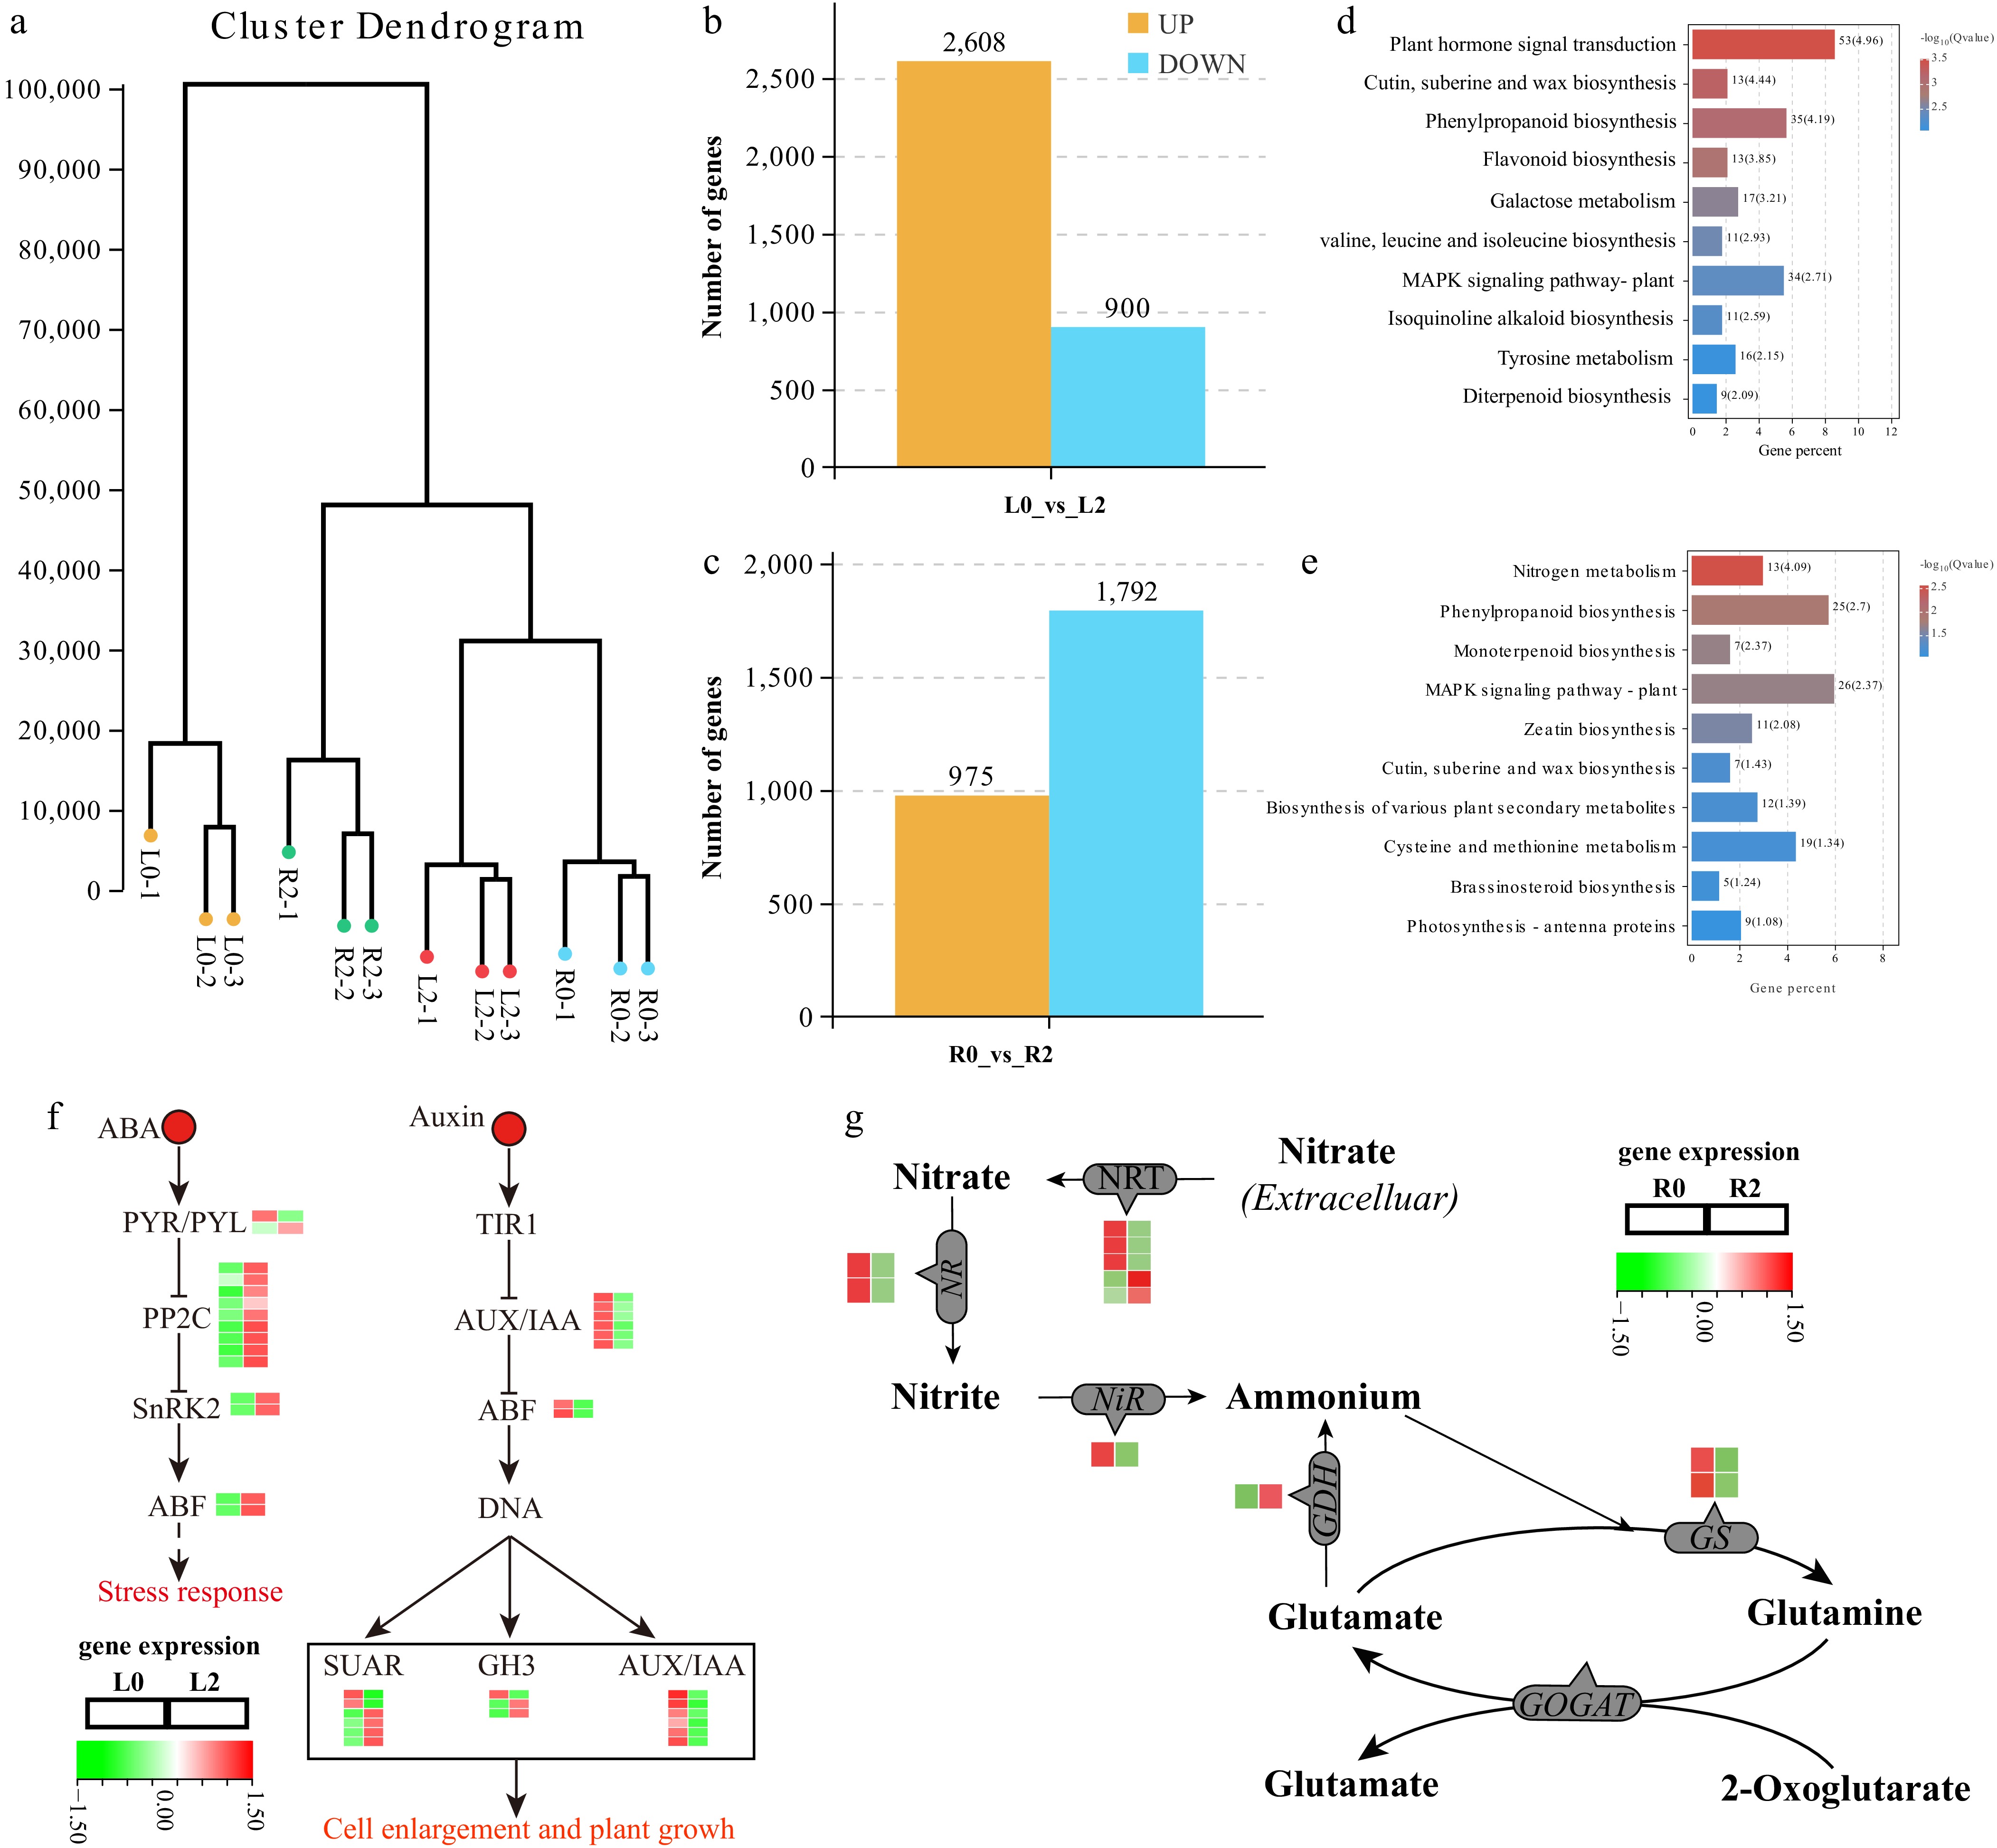
Figure 6.
RNA-Seq data expression profile of Sansha Gynura divaricata leaves and roots under salt stress. (a) Correlation analysis of transcript expression between all samples. (b) Number of DEGs in L2_vs_L0 comparison groups. (c) Number of DEGs in R2_vs_R0 comparison groups. (d) KEGG enrichment analysis of DEGs in leaves. (e) KEGG enrichment analysis of DEGs in roots. (f) Expression patterns of genes involved in plant signal transduction in leaves. (g) Expression patterns of genes involved in nitrogen metabolism in roots.
-
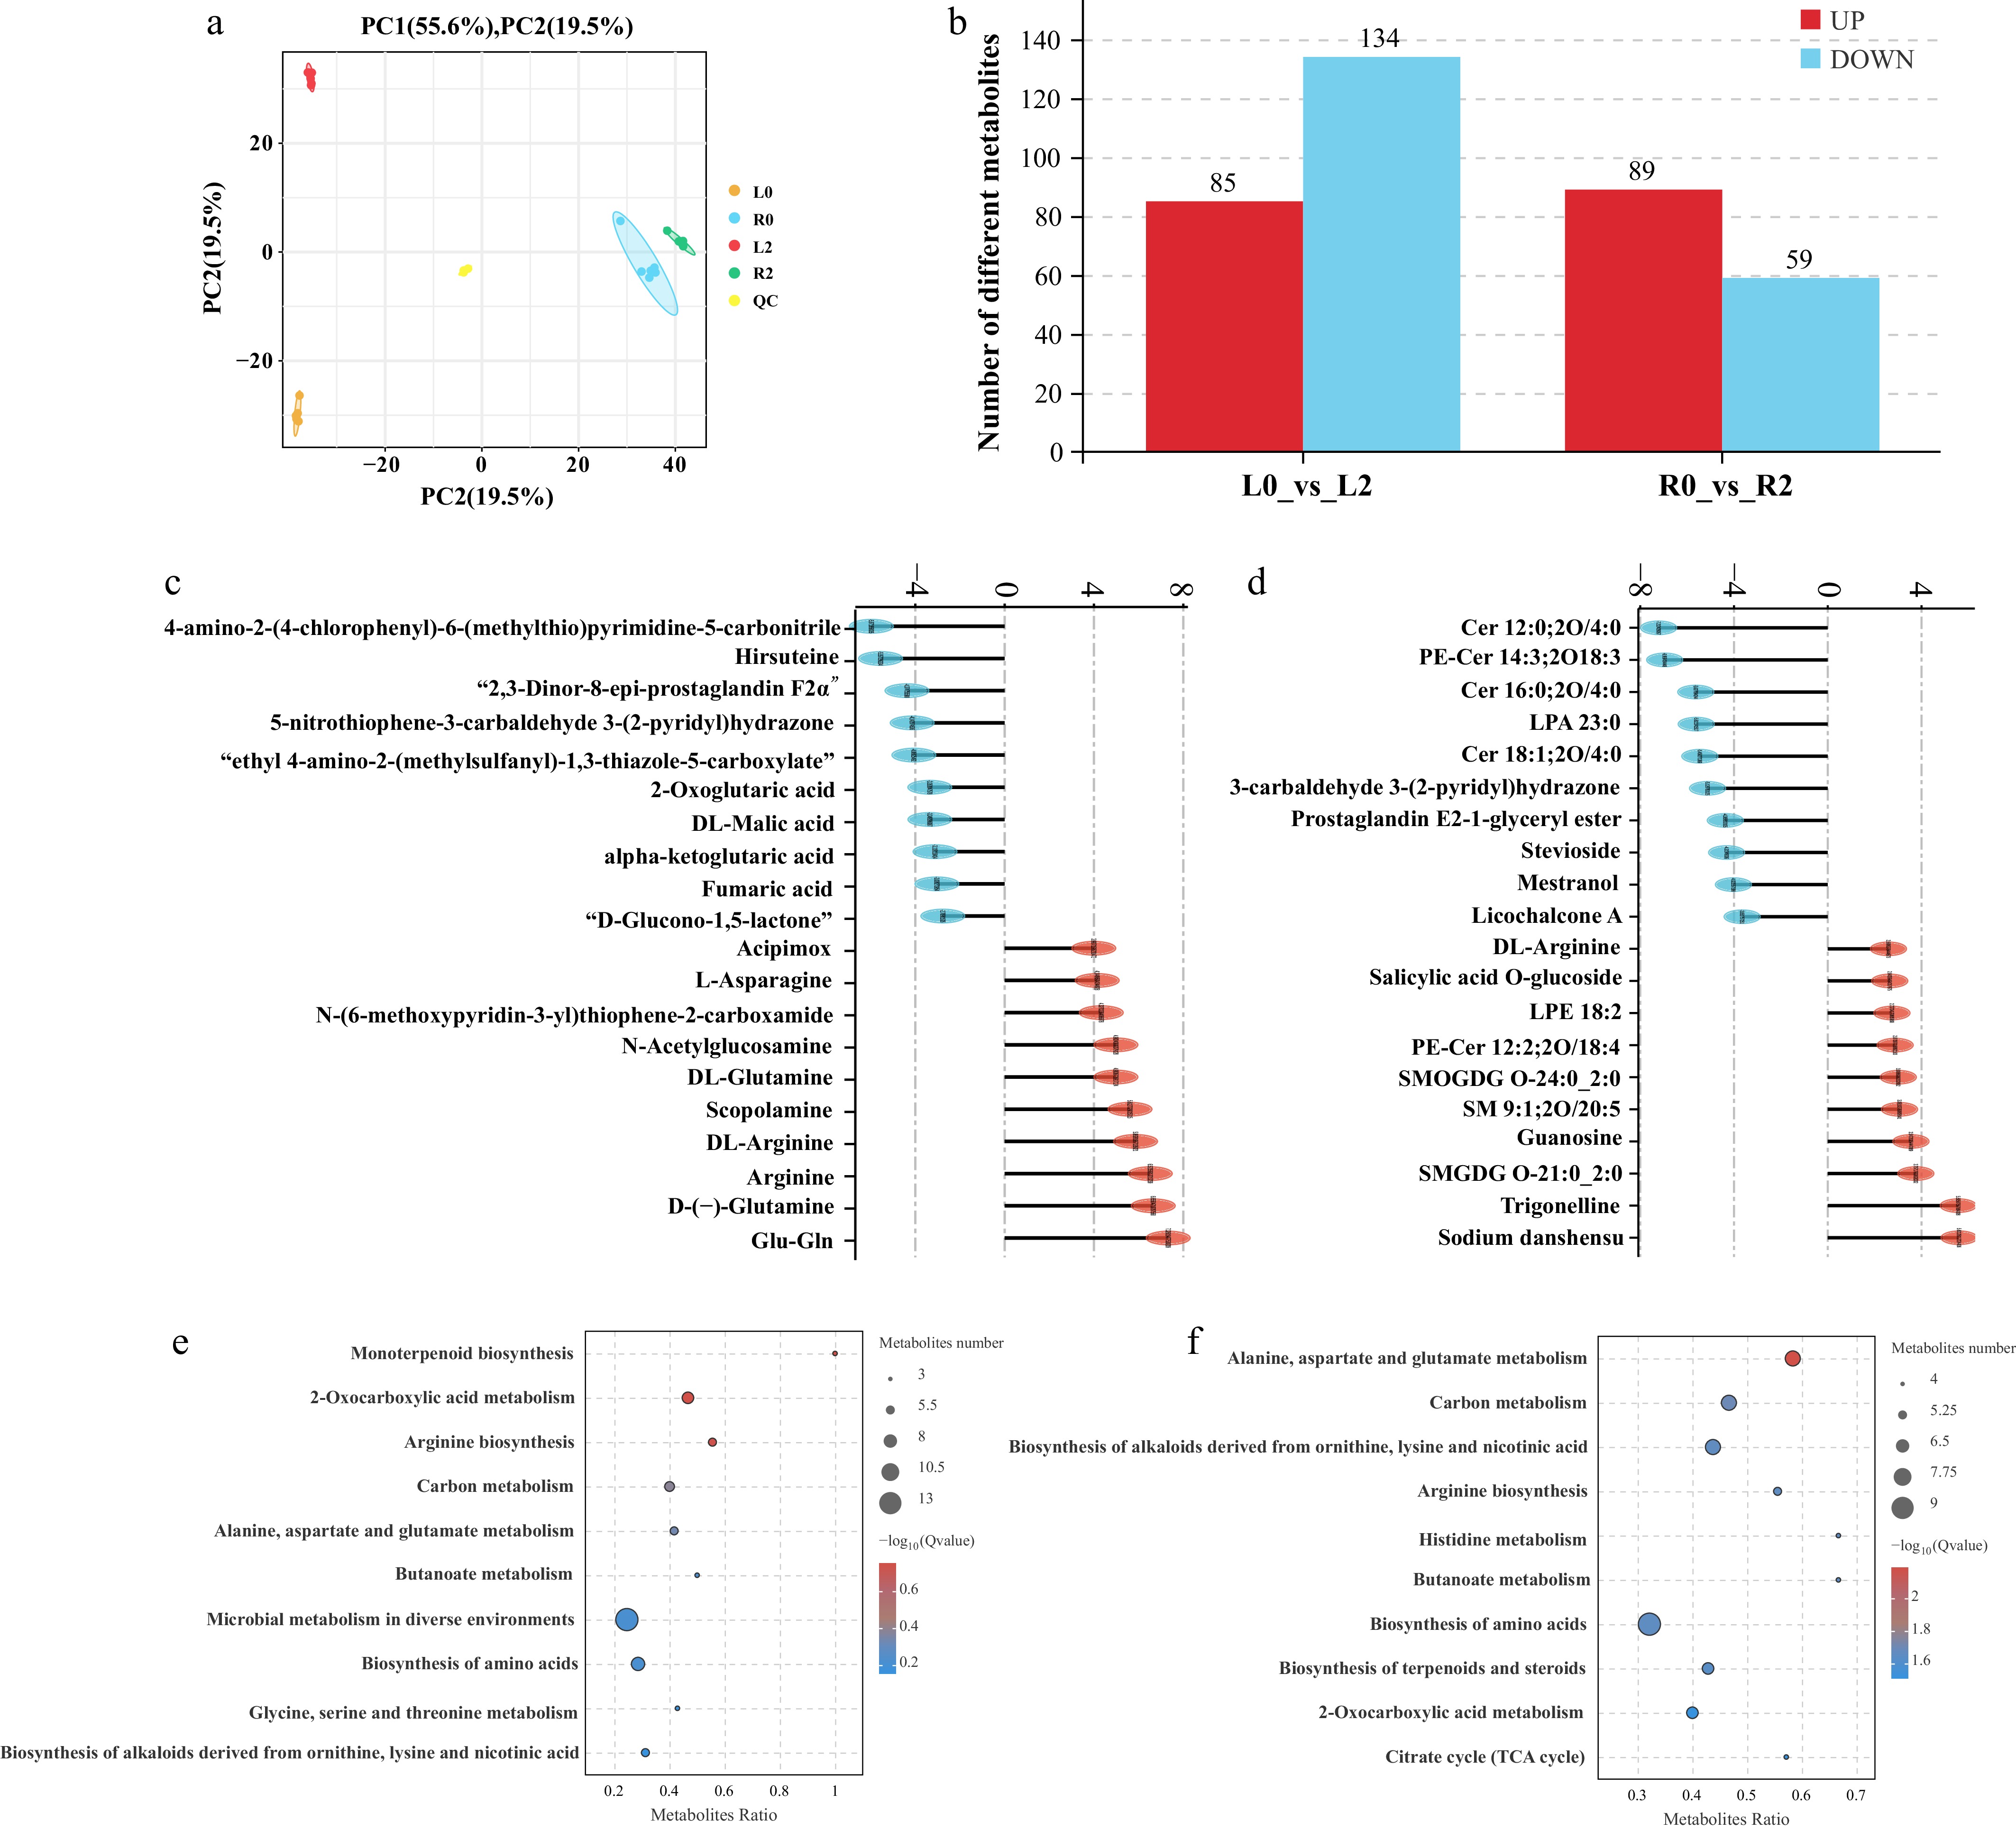
Figure 7.
Metabolomic analysis of Sansha Gynura divaricata leaves and roots under salt stress. (a) Principal component analysis (PCA) plots for all samples. (b) Number of differentially accumulated metabolites in different comparison groups. (c) The top 20 metabolites with the largest upregulated or downregulated fold changes in Sansha Gynura divaricata roots under salt stress. (d) The top 20 metabolites with the largest upregulated or downregulated fold changes in Sansha Gynura divaricata leaves under salt stress. (e) Bubble chart of KEGG pathways for differentially accumulated metabolites in roots. (f) Bubble chart of KEGG pathways for differentially accumulated metabolites in leaves.
-
Vitamins and other ingredients Value Mineral elements Value Flavonoids Value Water (g·100 g−1) 95.67 ± 0.45 Ca (mg·100 g−1) 3,330 ± 104.1 GC (mg·100 g−1) 460.29 ± 78.41 Ash content (g·100 g−1) 4.33 ± 0.45 P (mg·100 g−1) 1,917 ± 57.09 Cianidanol (mg·100 g−1) 0.79 ± 0.27 Protein (g·100 g−1) 1.26 ± 0.31 K (mg·100 g−1) 3,829 ± 291.33 EC (mg·100 g−1) 122.67 ± 10.91 VB1 (μg·100 g−1) 4.92 ± 1.82 Na (mg·100 g−1) 1,246 ± 231.55 Delphinidin chloride (mg·100 g−1) 3.77 ± 0.98 VB2 (μg·100 g−1) 14.11 ± 6.2 Mg (mg·100 g−1) 472 ± 2 EA (mg·100 g−1) 2.05 ± 0.77 Niacin (μg·100 g−1) 10.44 ± 1.32 Fe (mg·100 g−1) 28.55 ± 0.43 Glycyrrhizin (mg·100 g−1) 0.48 ± 0.01 Pantothenic acid (μg·100 g−1) 11.81 ± 5.79 Zn (mg·100 g−1) 3.68 ± 0.08 QR (mg·100 g−1) 1.71 ± 0.25 VB6 (μg·100 g−1) 27.9 ± 2.05 Cu (mg·100 g−1) 1.49 ± 0.21 Luteolin (mg·100 g−1) 0.81 ± 0.29 VB7 (μg·100 g−1) 17.61 ± 2.96 Mn (mg·100 g−1) 26.3 ± 0.46 Kaempferol (mg·100 g−1) 3.94 ± 4.77 FA (μg·100 g−1) 65.99 ± 18.63 VB1: vitamin B1; VB2: vitamin B2; VB6: vitamin B6; VB7: vitamin B7; FA: folic acid; Ca: calcium; P: phosphorus; K: potassium; Na: sodium; Mg: magnesium; Fe: ferrum; Zn: zinc; Cu: copper; Mn: manganese; GC: gallic catechin; EC: epicatechin; EA: ellagic acid; QR: quercetin. The data were expressed as mean ± SE of three replicates. The different letters at the top of the column indicate significant differences at p < 0.05. Table 1.
Nutrient composition table of Sansha Gynura divaricate.
Figures
(7)
Tables
(1)