-
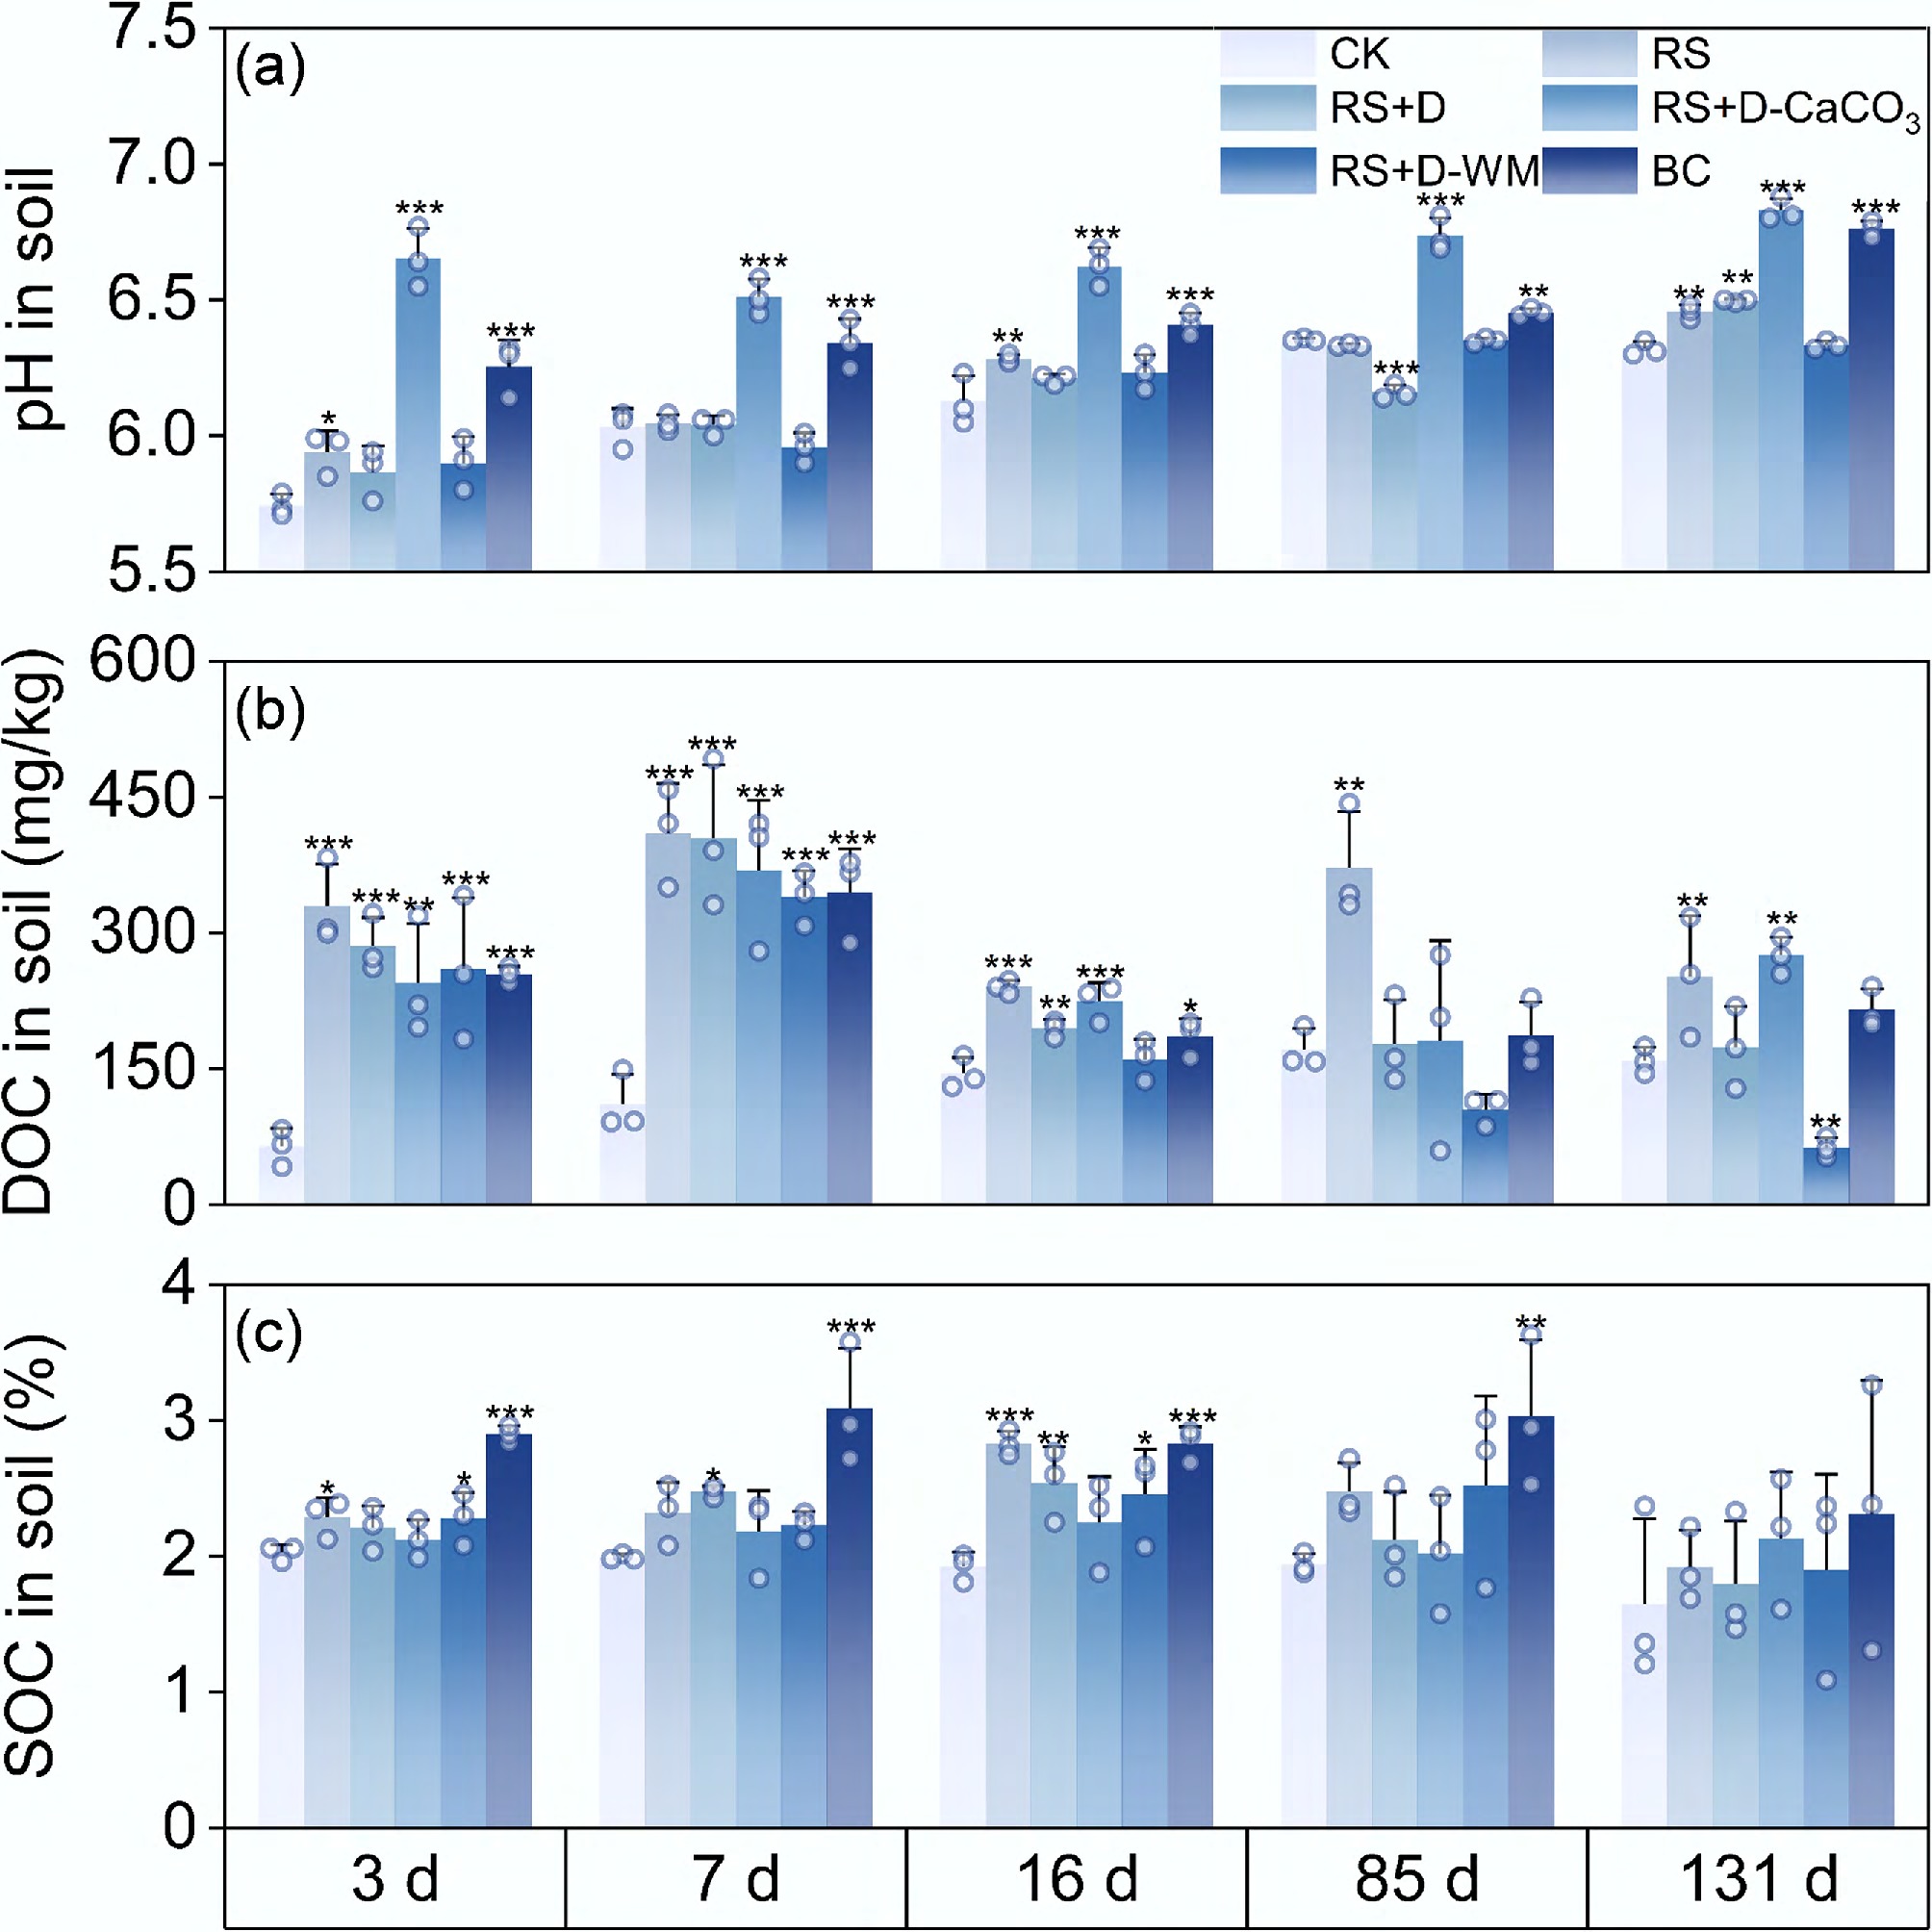
Figure 1.
(a) Soil pH, (b) dissolved organic carbon (DOC), and (c) soil organic carbon (SOC) under different scenarios of straw addition. *, **, and *** represent a significant difference at p < 0.05, p < 0.01, and p < 0.001 compared with the control. Data are presented as the mean ± standard deviation (SD), n = 3.
-
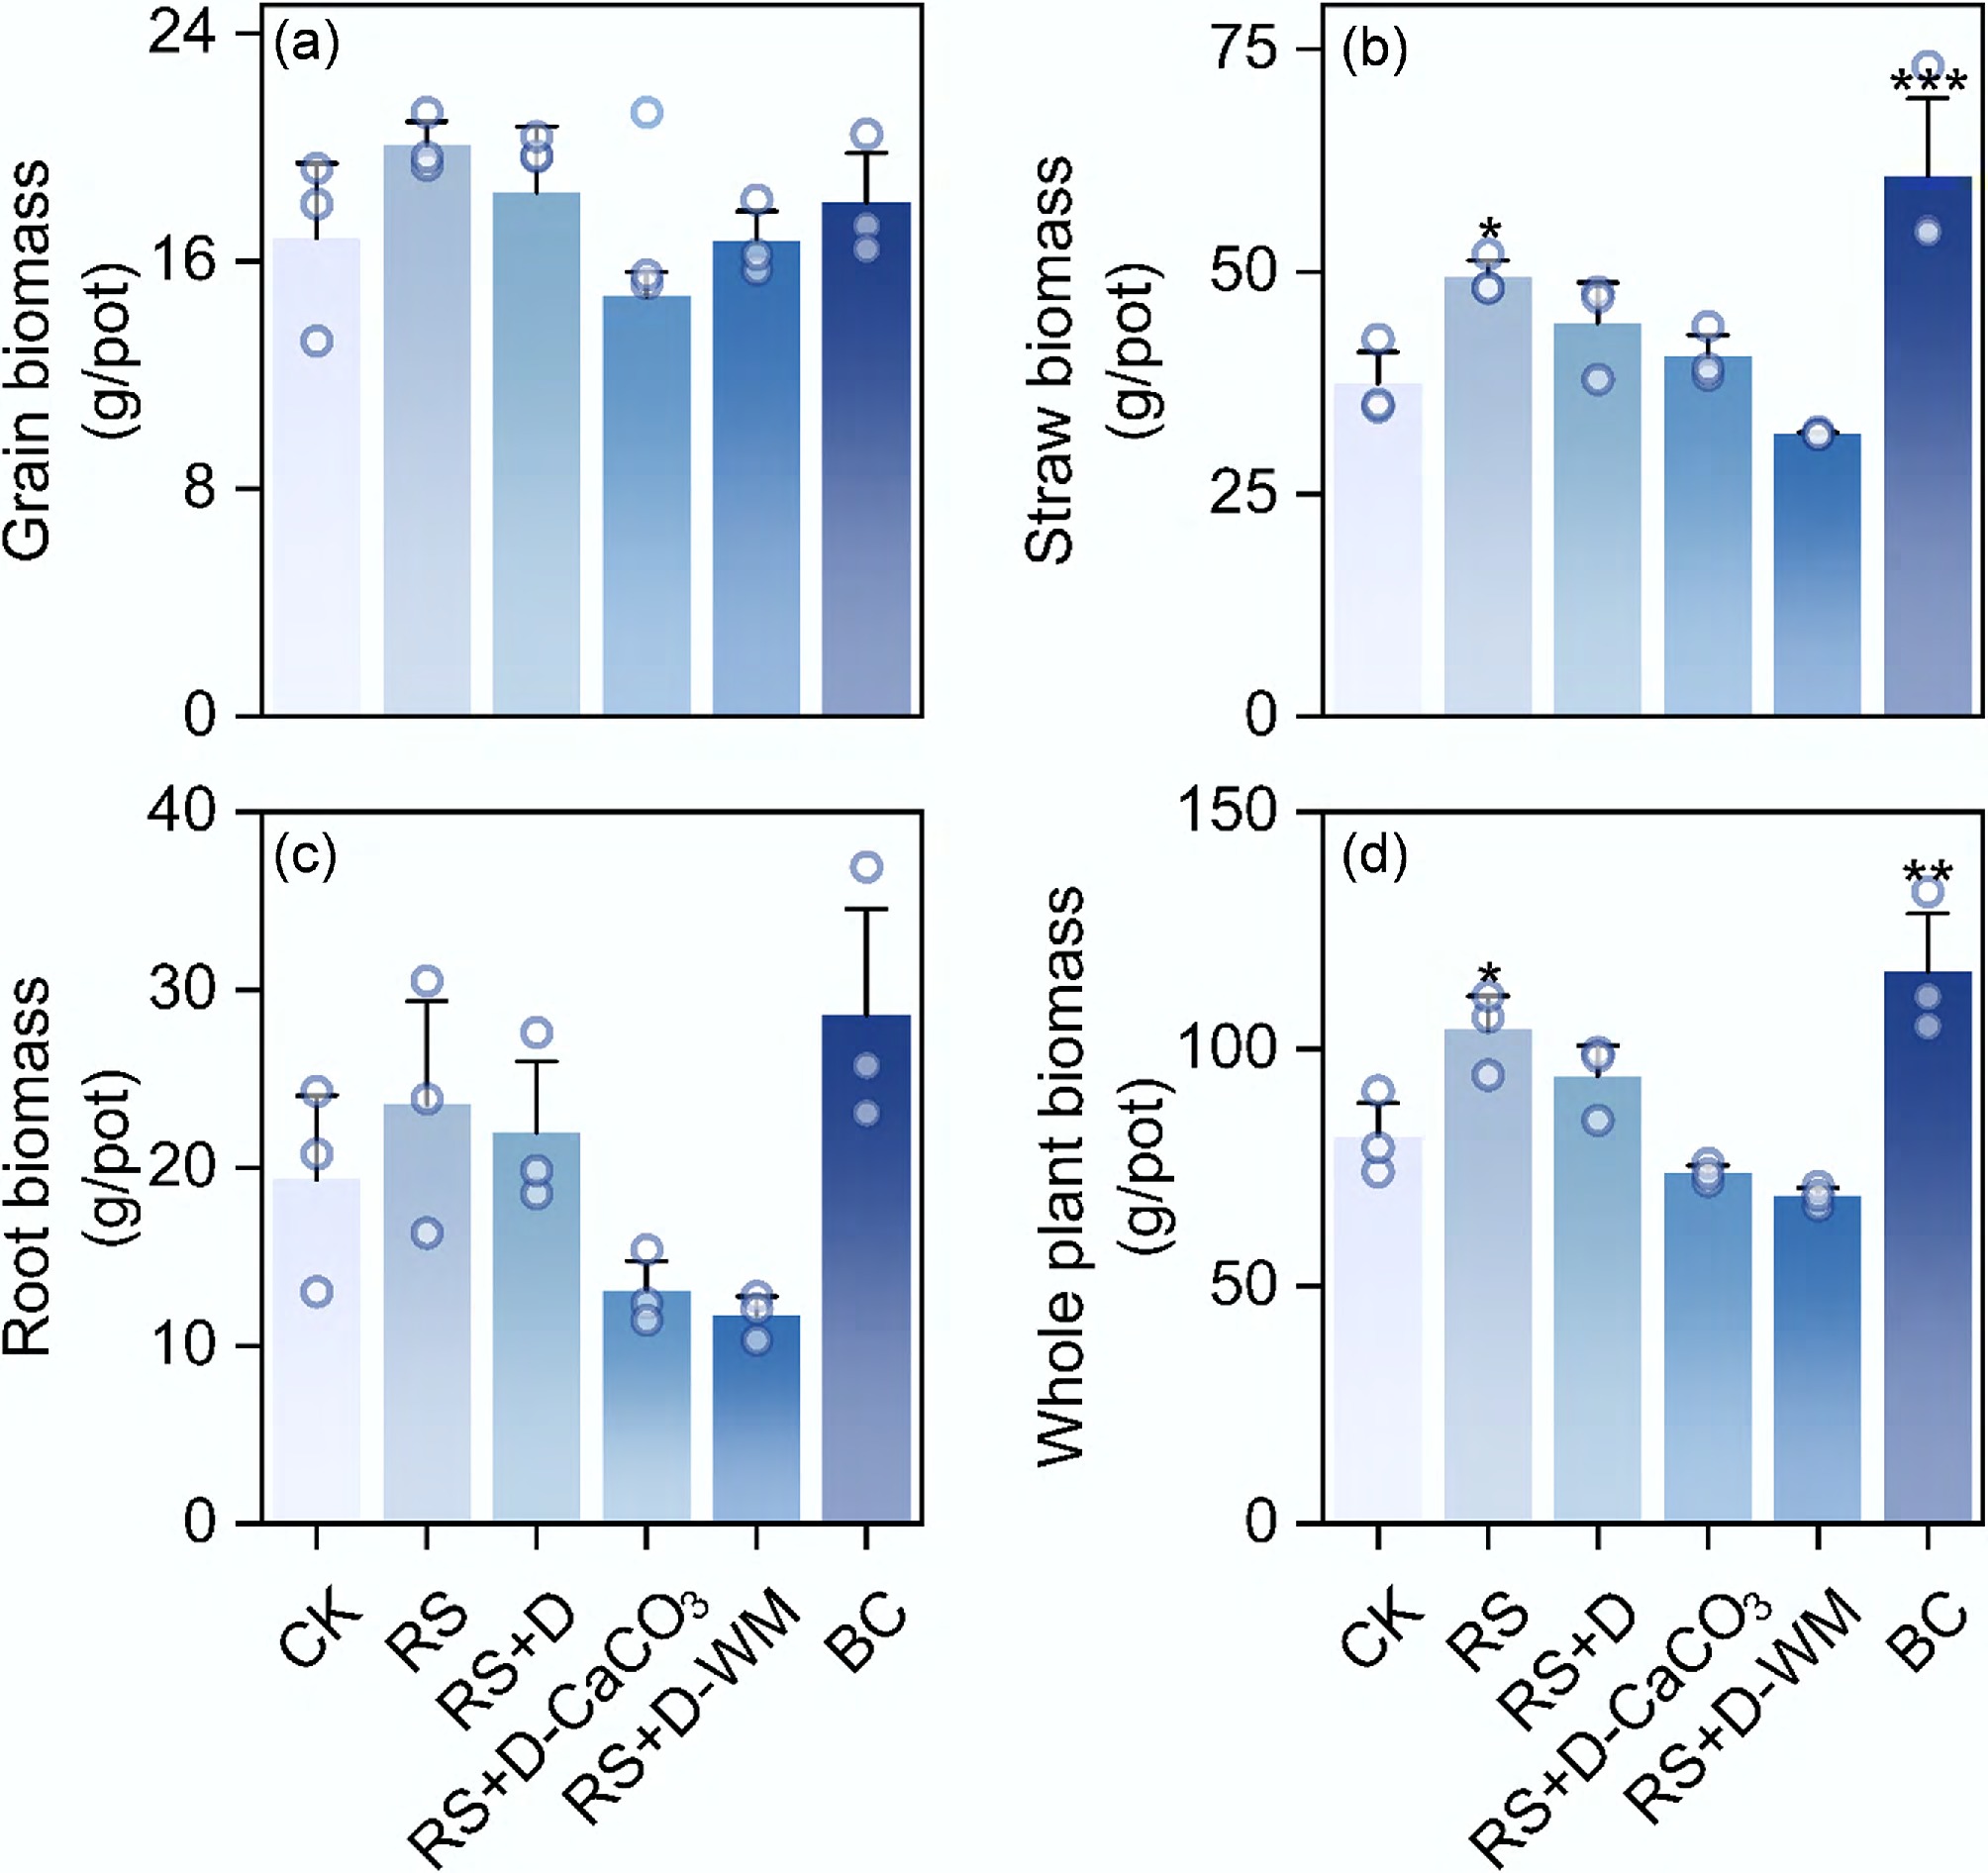
Figure 2.
The tissue and whole plant biomass under different straw addition treatments: (a) grain biomass, (b) straw biomass, (c) root biomass and (d) whole plant biomass. *, **, and *** represent a significant difference at p < 0.05, p < 0.01, and p < 0.001 compared with the control. Data are presented as the mean ± SD, n = 3.
-
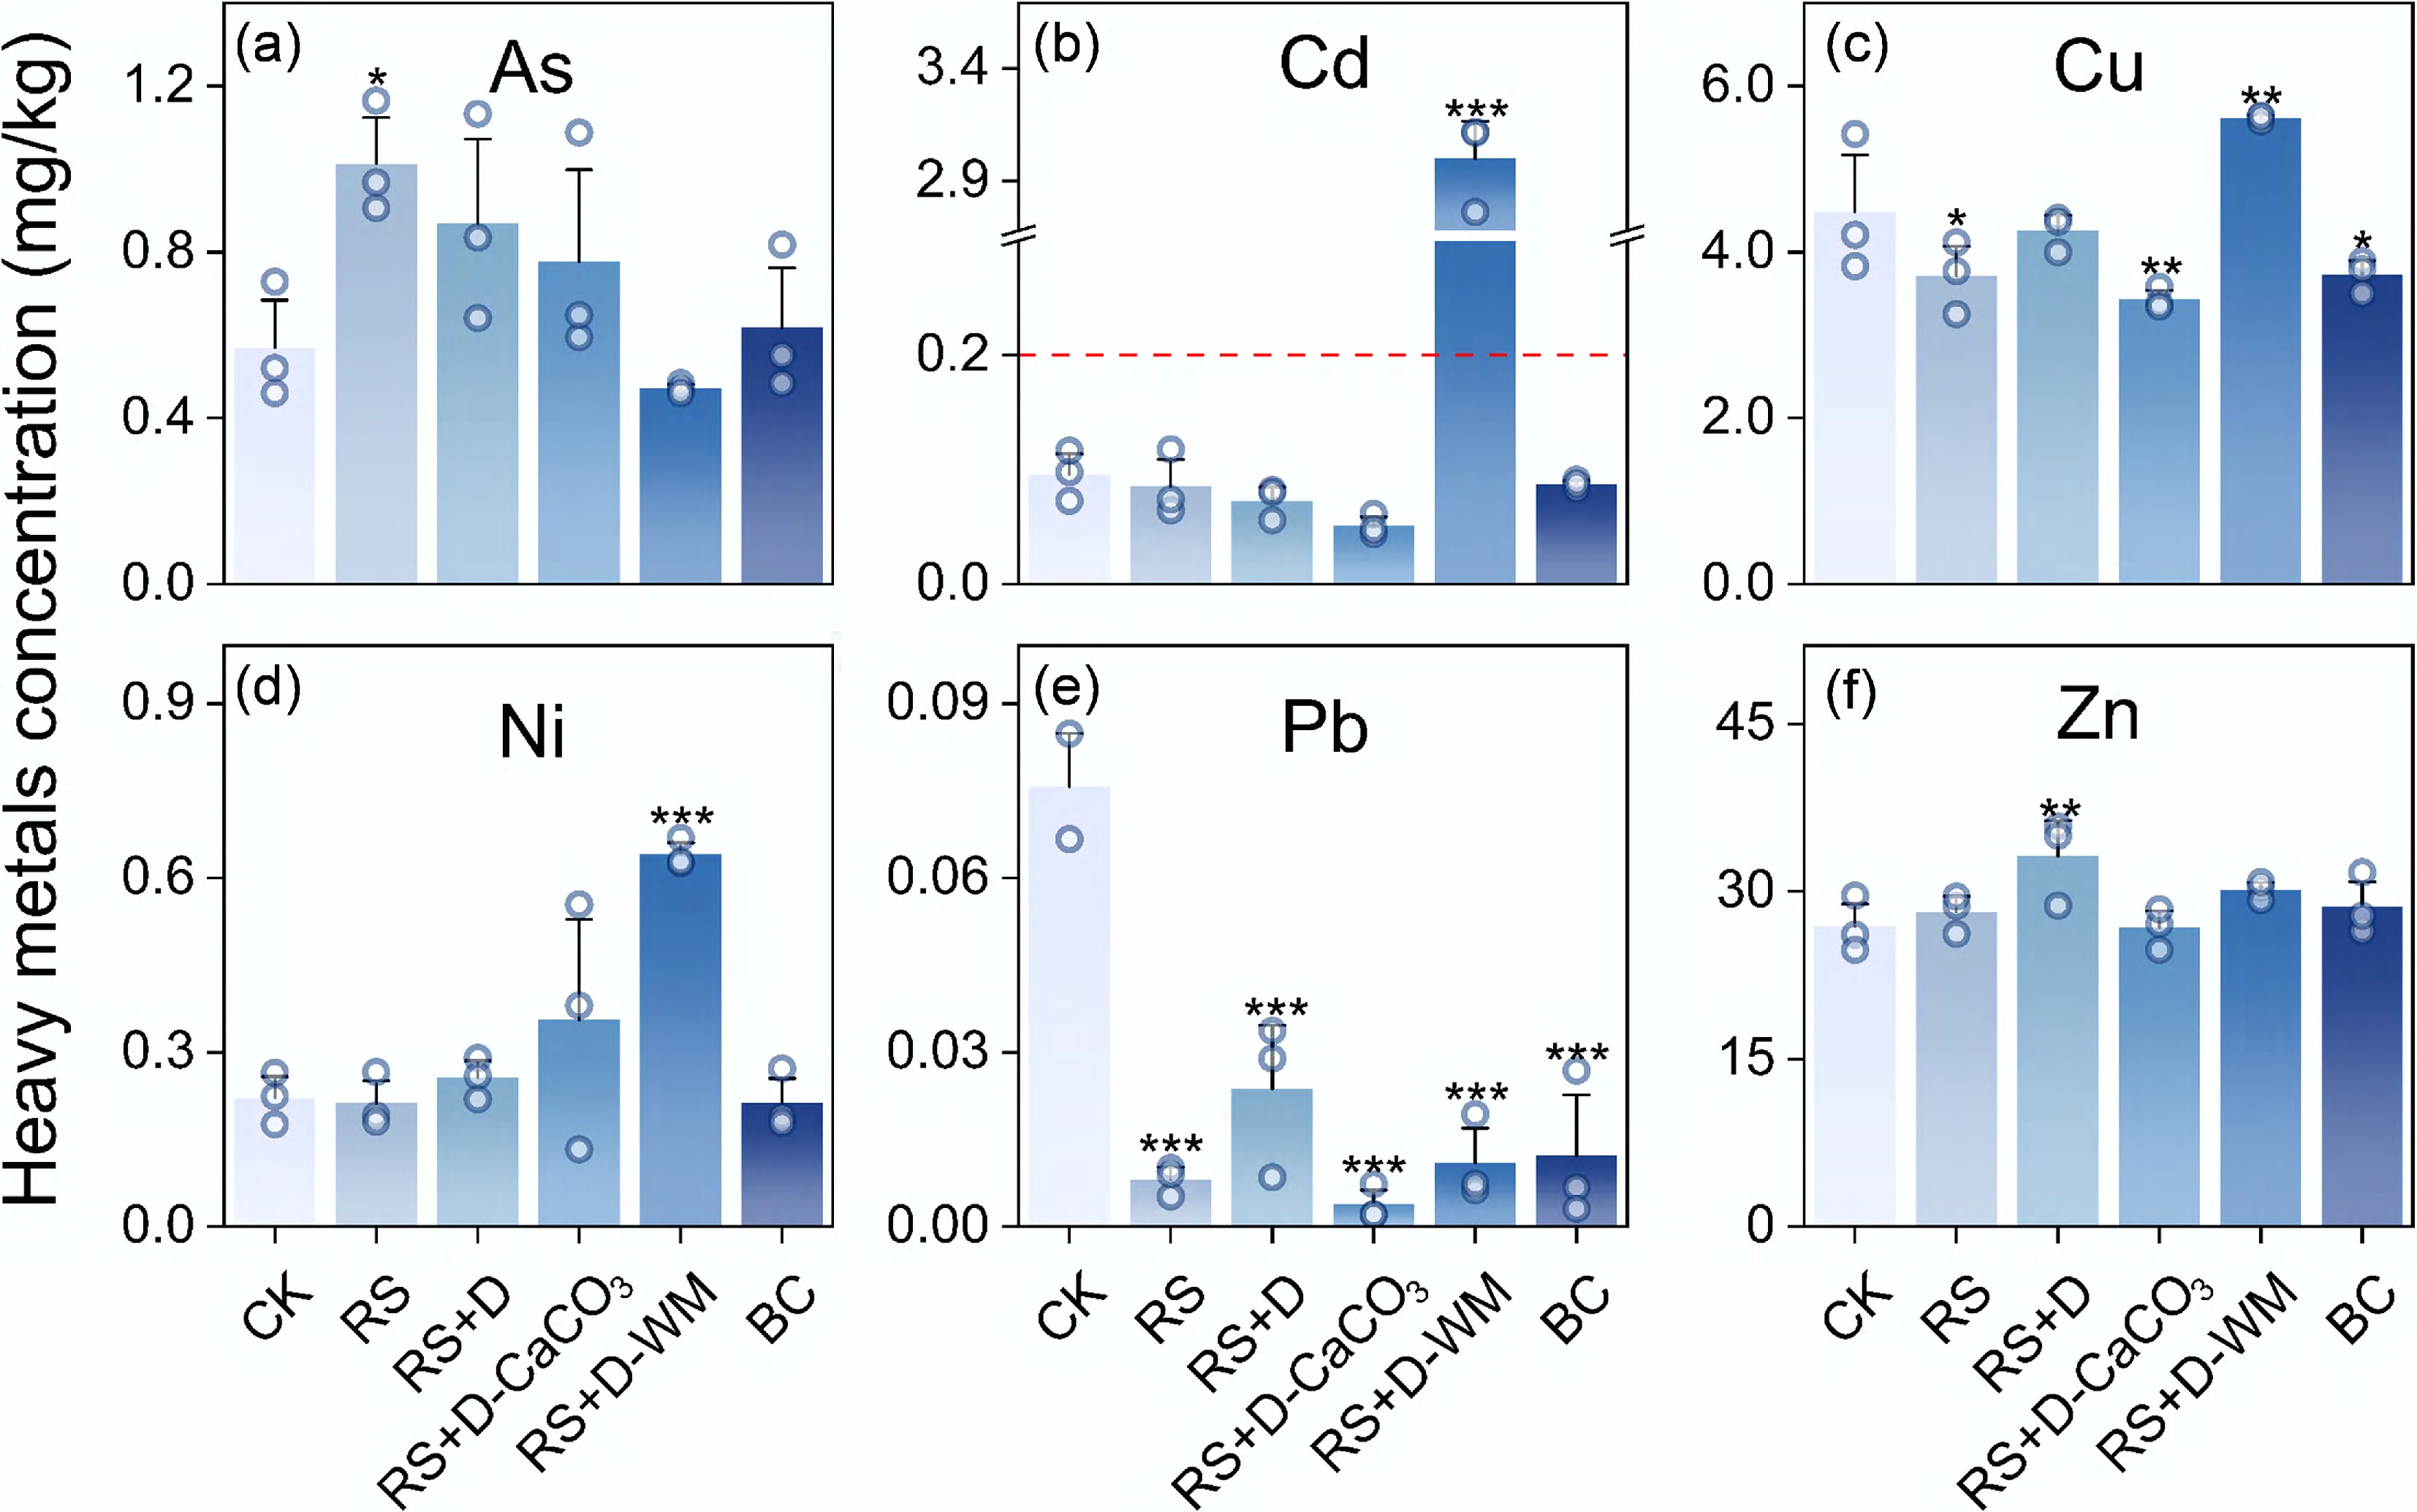
Figure 3.
Accumulation of heavy metals in rice grains under different scenarios of straw addition. Panels (a), (b), (c), (d), (e), and (f) represent the accumulation of As, Cd, Cu, Ni, Pb, and Zn, respectively. *, **, and *** represent a significant difference at p < 0.05, p < 0.01, and p < 0.001 compared with the control. Data are presented as the mean ± SD, n = 3. The red dashed line in panel (b) indicates the national limitation of Cd concentration in rice grains in China.
Figures
(3)
Tables
(0)