-
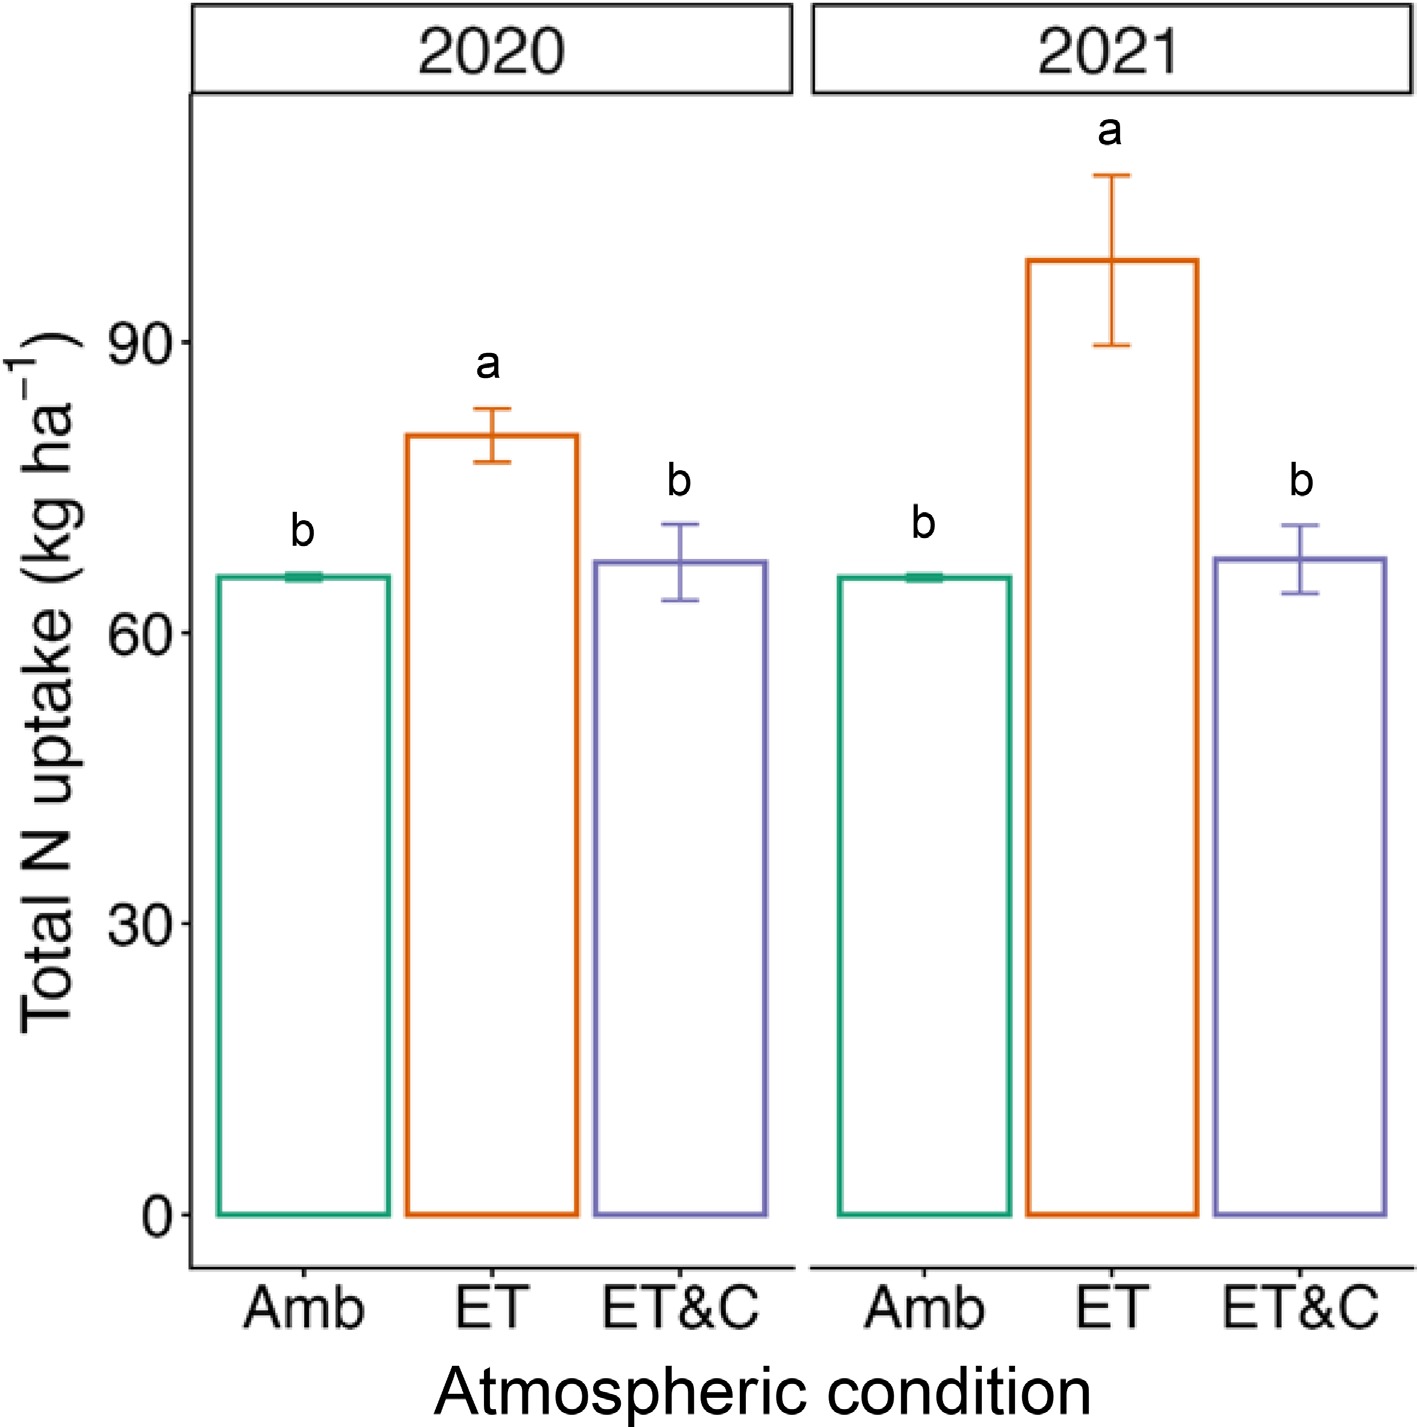
Figure 1.
Nitrogen (N) uptake of rice under different atmospheric conditions for 2 years. Error bars indicate standard deviation (n = 3 within-plot subsamples). Different letters represent statistical difference at 0.05.
-
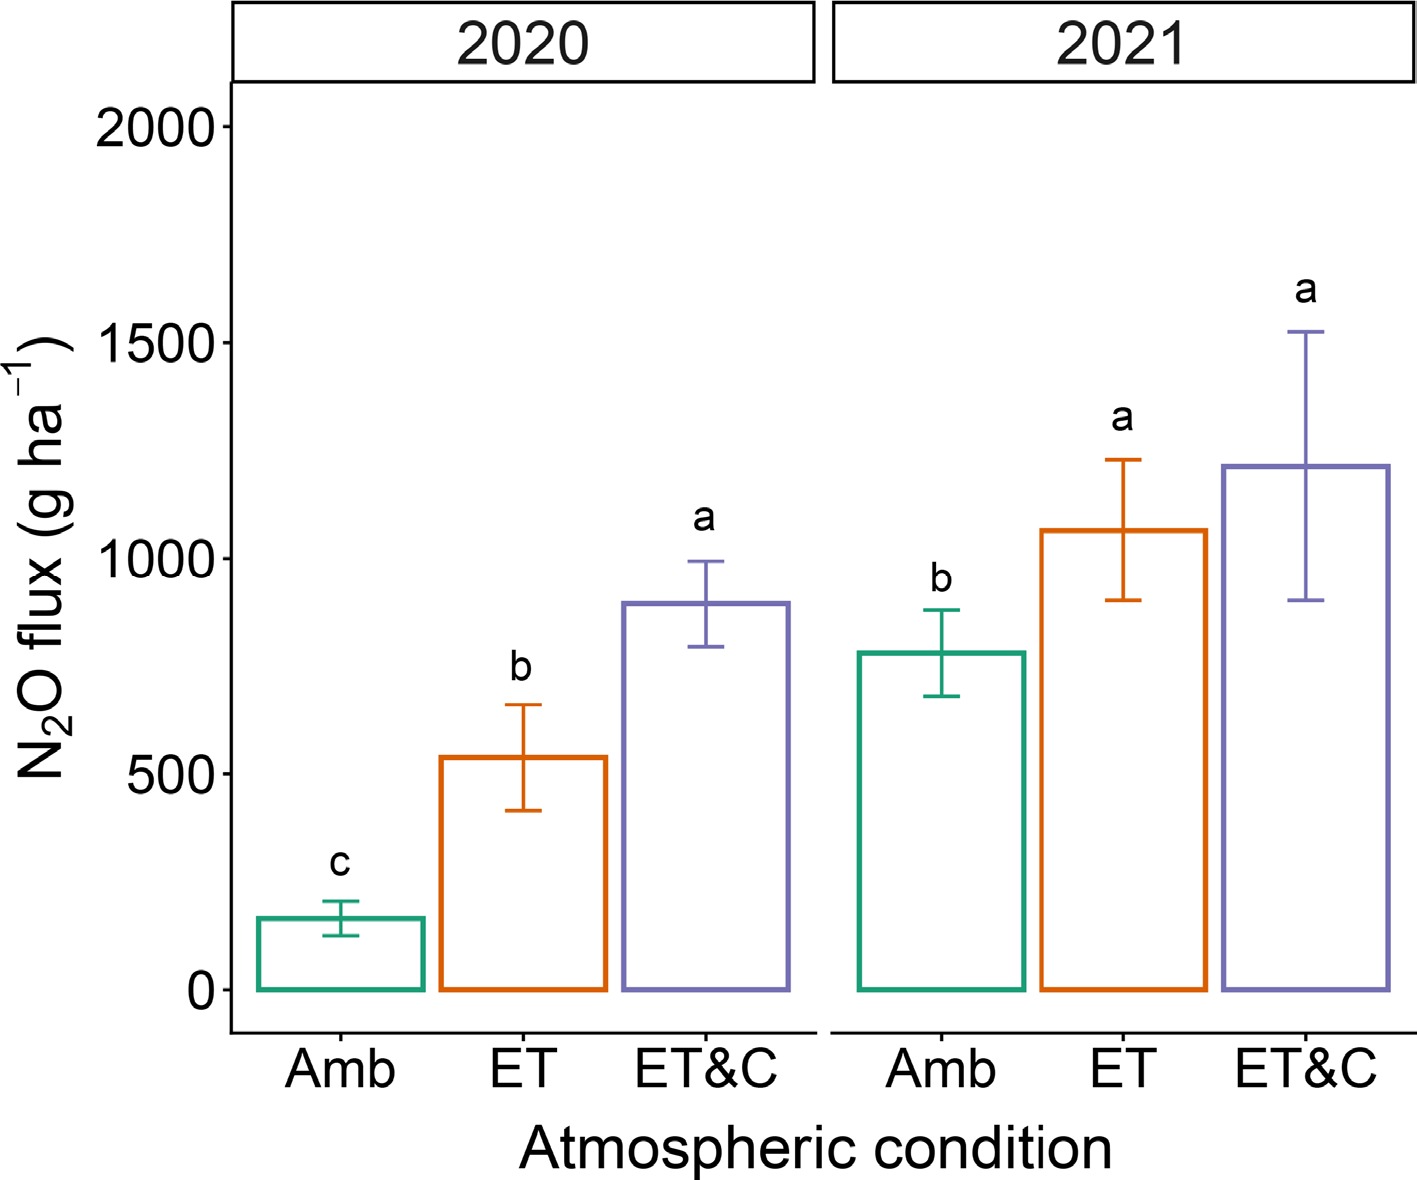
Figure 2.
Soil N2O fluxes under different atmospheric conditions for 2 years. Error bars indicate standard deviation (n = 3 within-plot subsamples). Different lowercases represent statistical difference at 0.05.
-
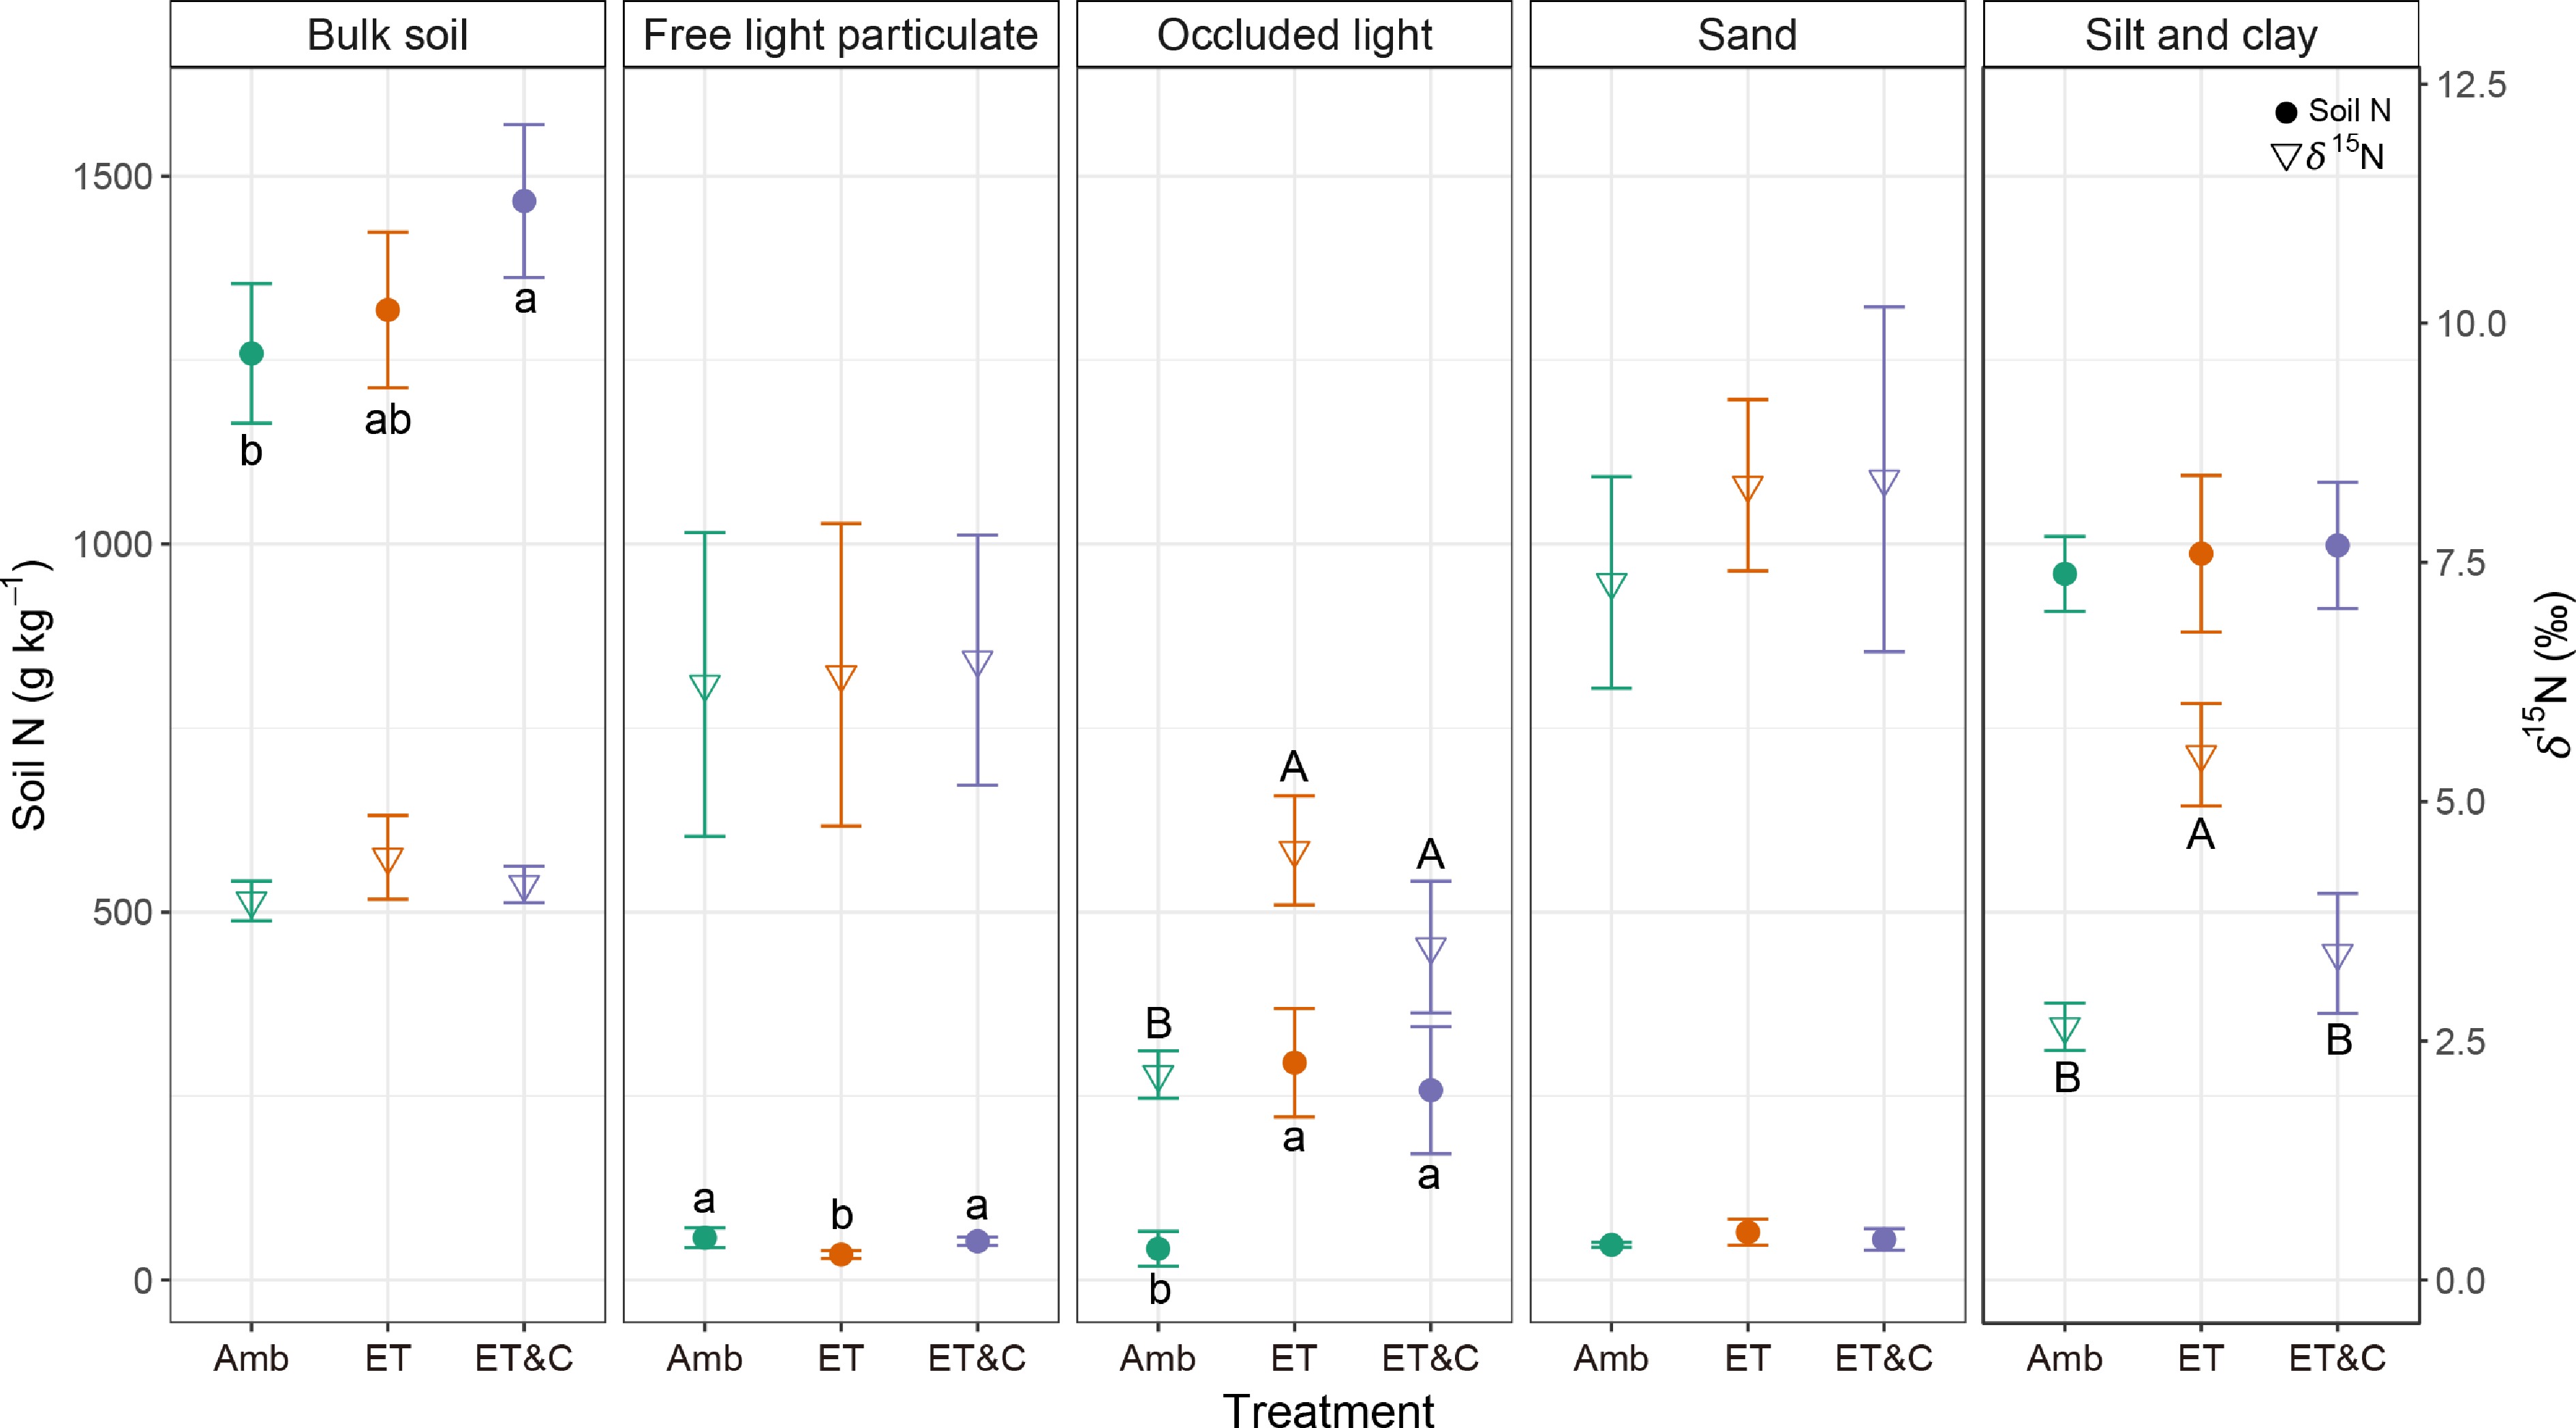
Figure 3.
Soil N content and δ15N values in each fraction under different atmospheric conditions in the 3rd year. Closed circles and open triangles represent soil N content and δ15N values, respectively. Error bars indicate standard deviation (n = 3 within-plot subsamples). Different lowercase and uppercase letters represent statistical differences at 0.05 in N content and δ15N, respectively.
-
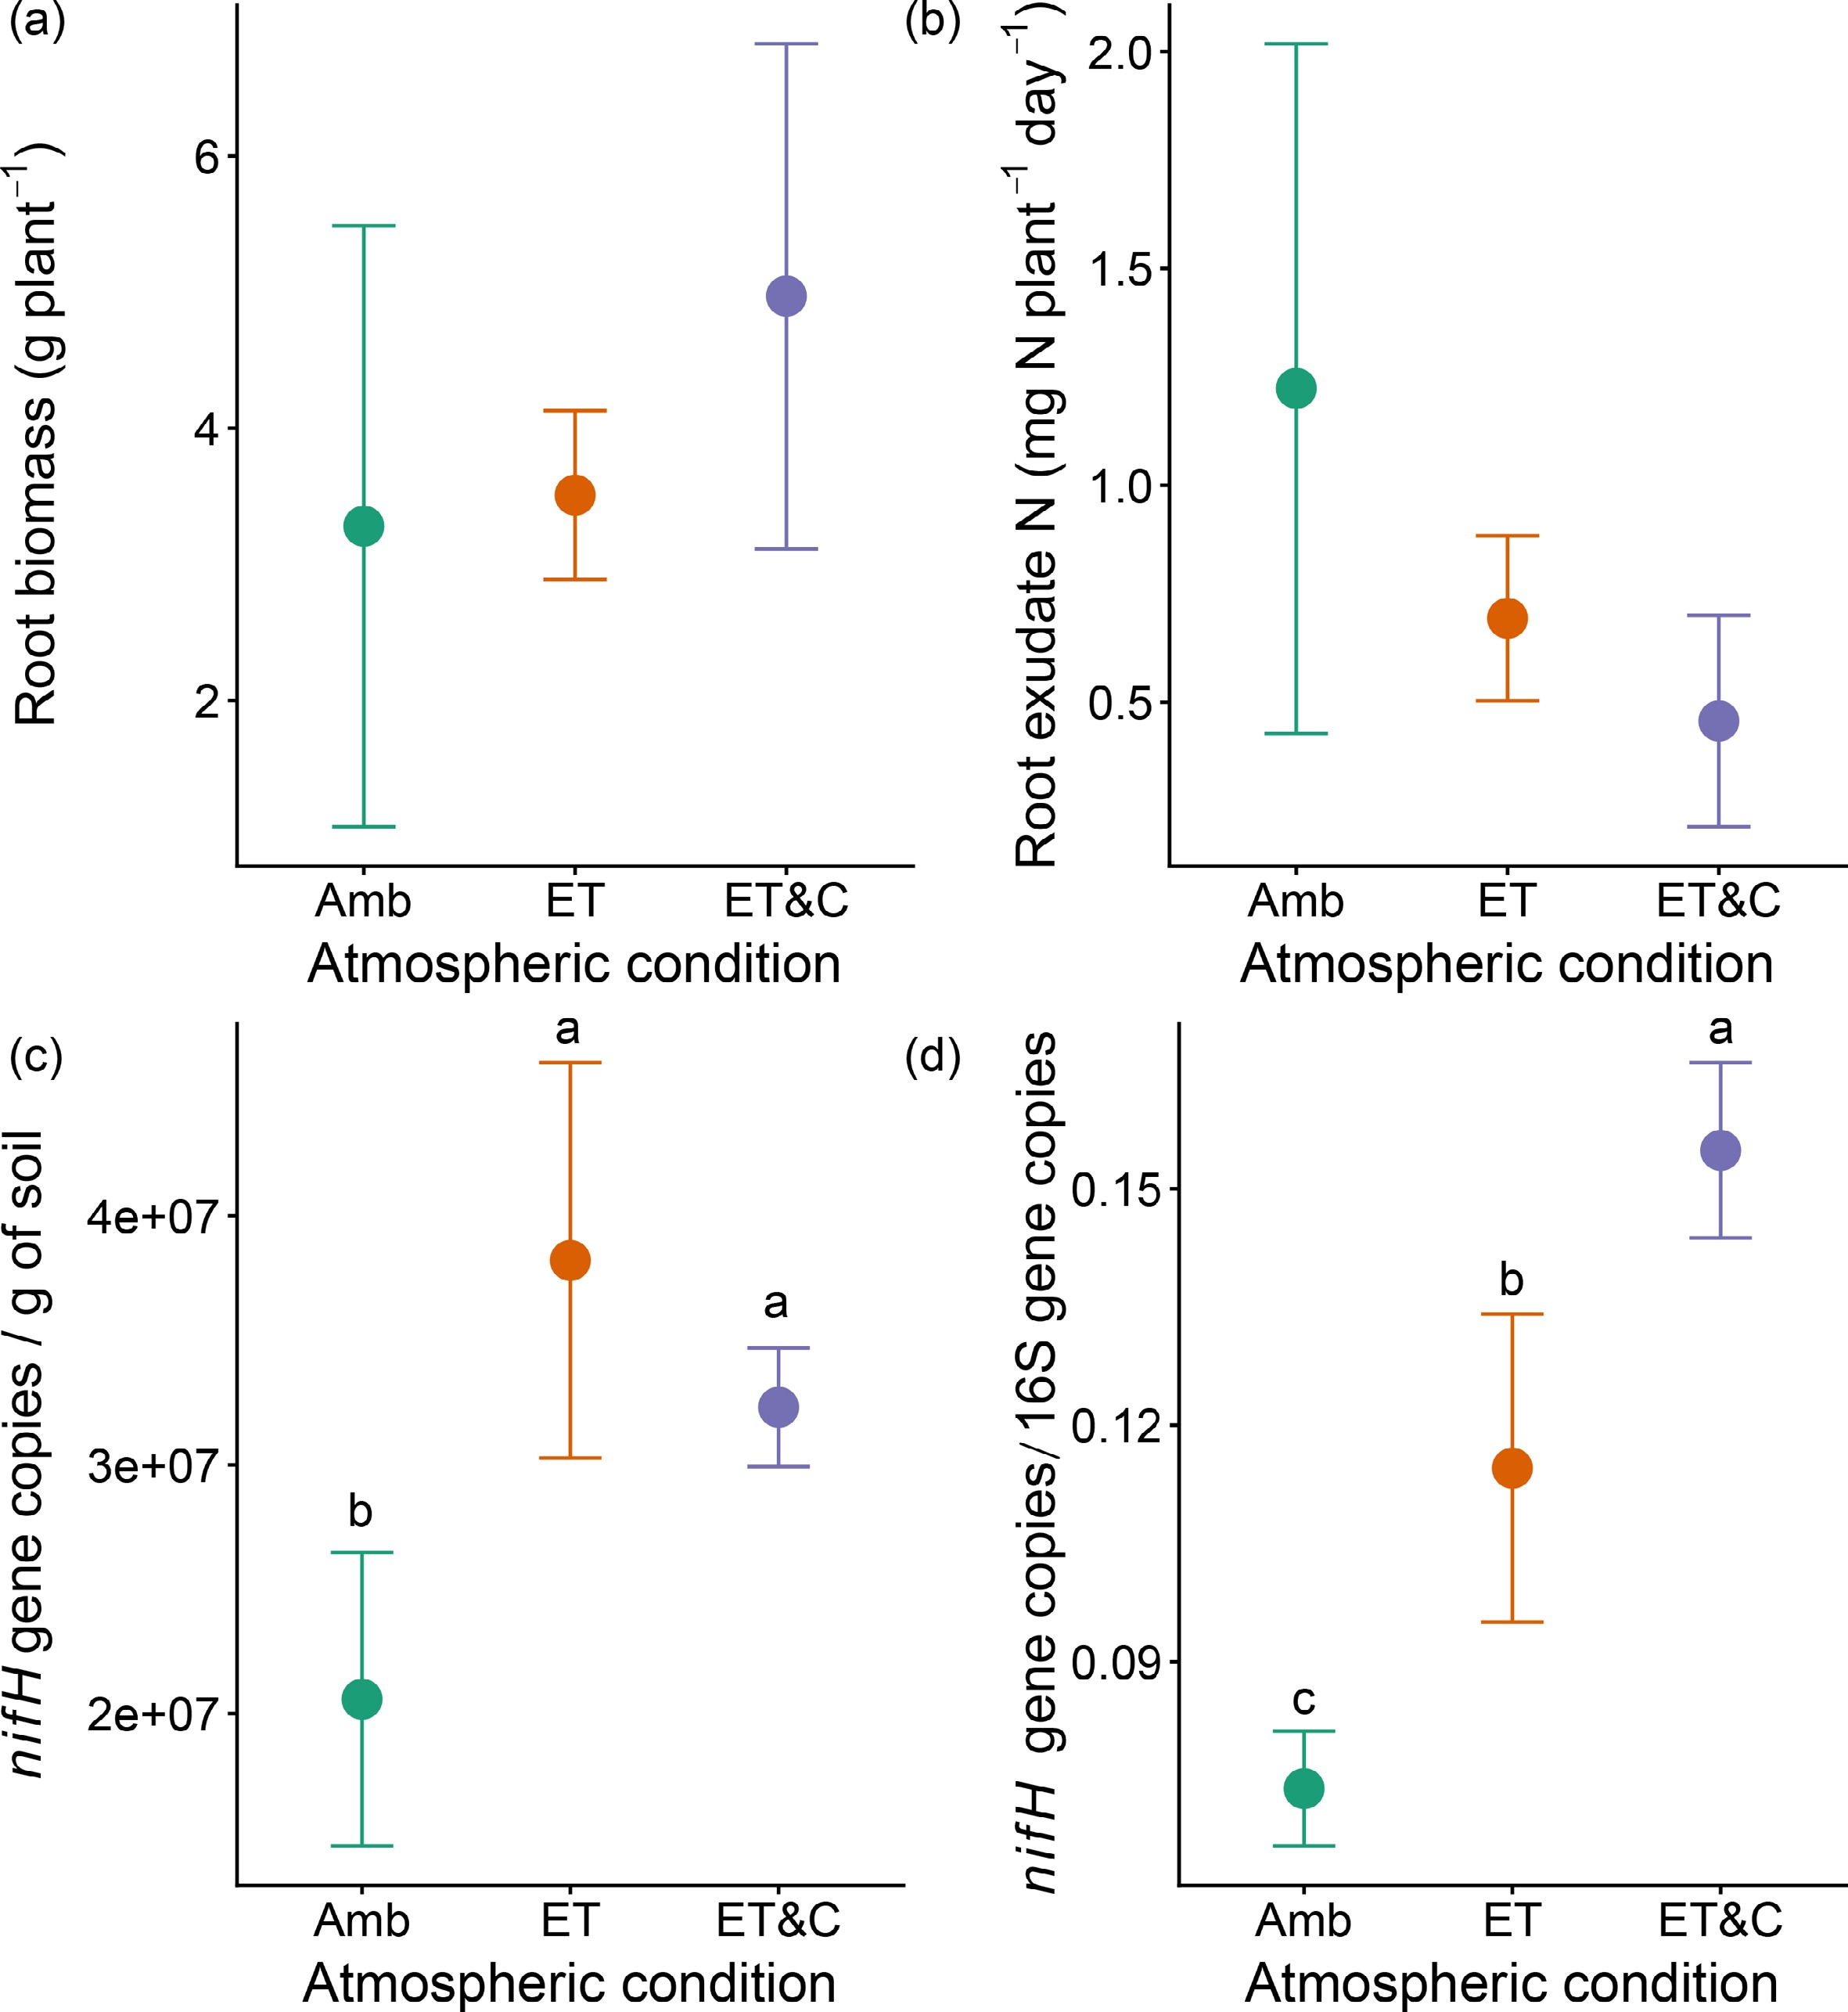
Figure 4.
(a) Root biomass, and (b) exudate N under different atmospheric conditions in the 3rd year. (c) Gene copy numbers of nifH, and (d) ratio between gene copy numbers of nifH and 16S gene under different atmospheric conditions in the 2nd year. Error bars indicate standard deviation (n = 3 within-plot subsamples). Different lowercase letters represent statistical differences at 0.05, respectively.
Figures
(4)
Tables
(0)