-
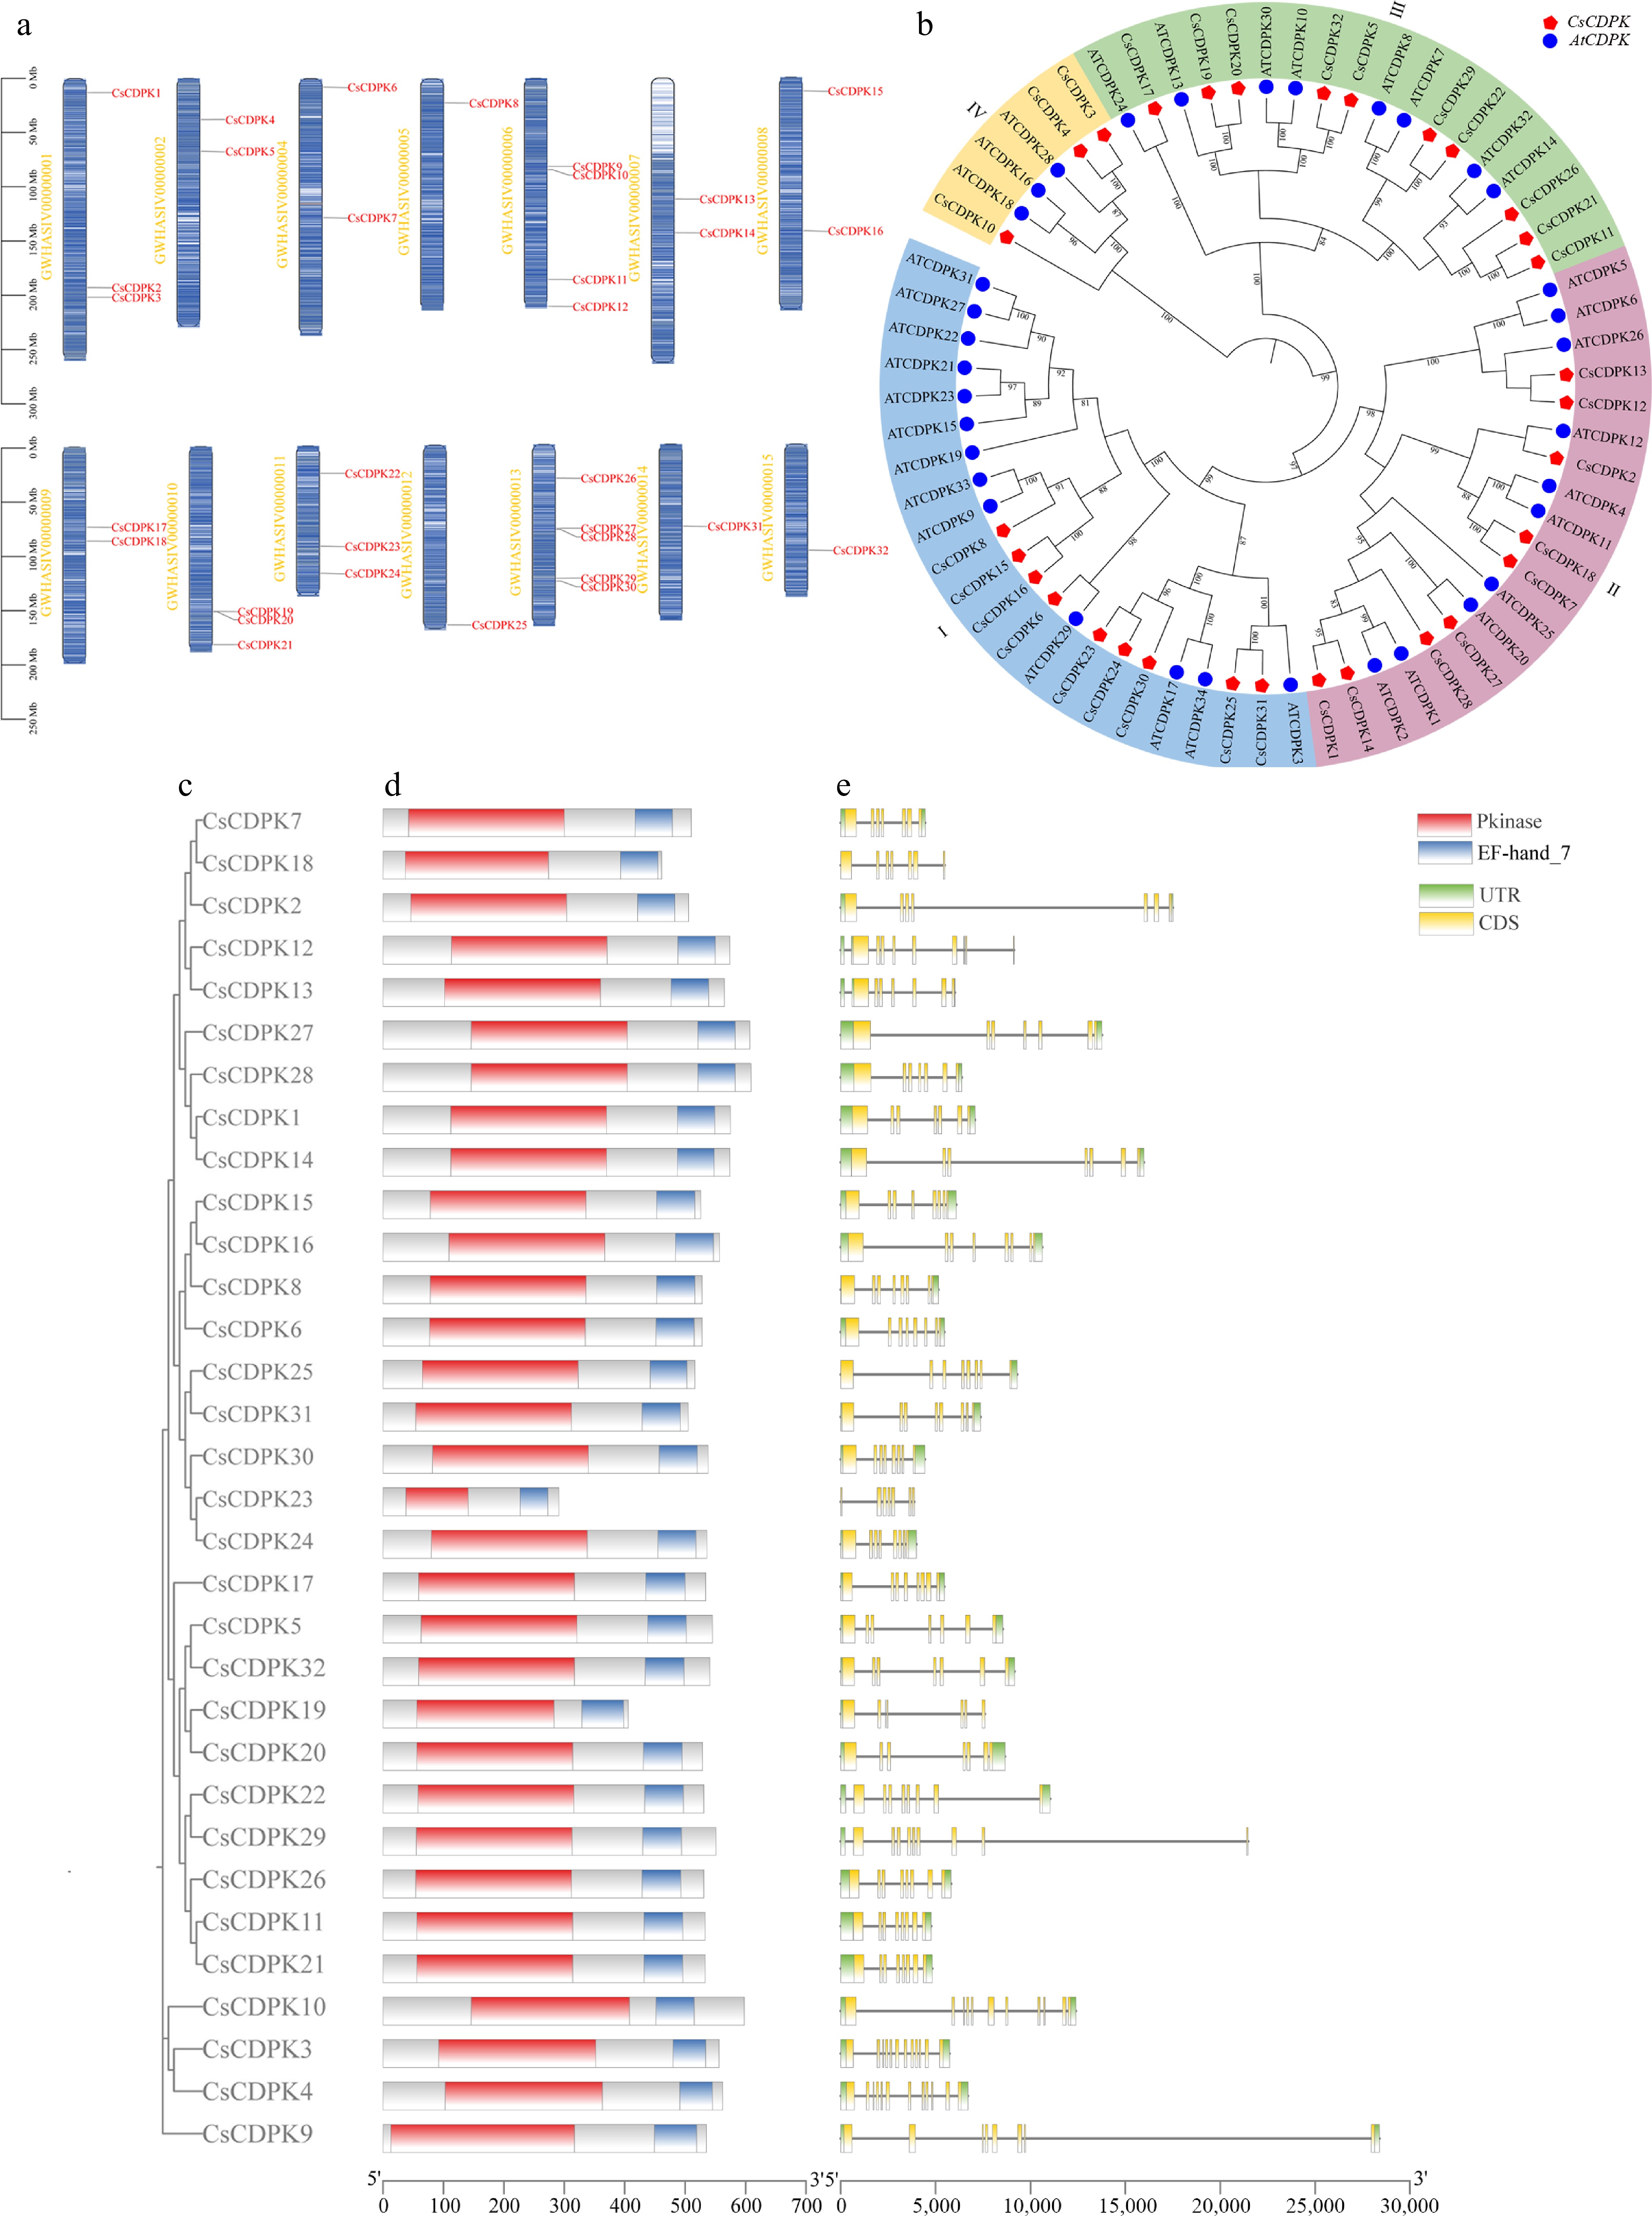
Figure 1.
Chromosomal localization of CsCDPK family members, phylogenetic tree of CDPK genes from tea plant and Arabidopsis, and analyses of conserved motifs, conserved domains, and gene structures of CsCDPK. (a) Chromosomal localization of CsCDPKs in the tea plant genome. (b) Phylogenetic relationships of CDPK proteins from tea plant and Arabidopsis. Red pentagons represent CsCDPKs, and blue circles represent AtCDPKs. The tree was constructed using the neighbor-joining method with 1,000 bootstrap replicates. (c) Phylogenetic tree of CDPKs from tea plant. (d) Distribution of conserved domains in CsCDPKs. (e) Gene structure. Yellow boxes represent CDS (coding sequences), green boxes represent UTRs (untranslated regions), and horizontal lines represent introns. CDS and UTR together constitute the exon regions.
-
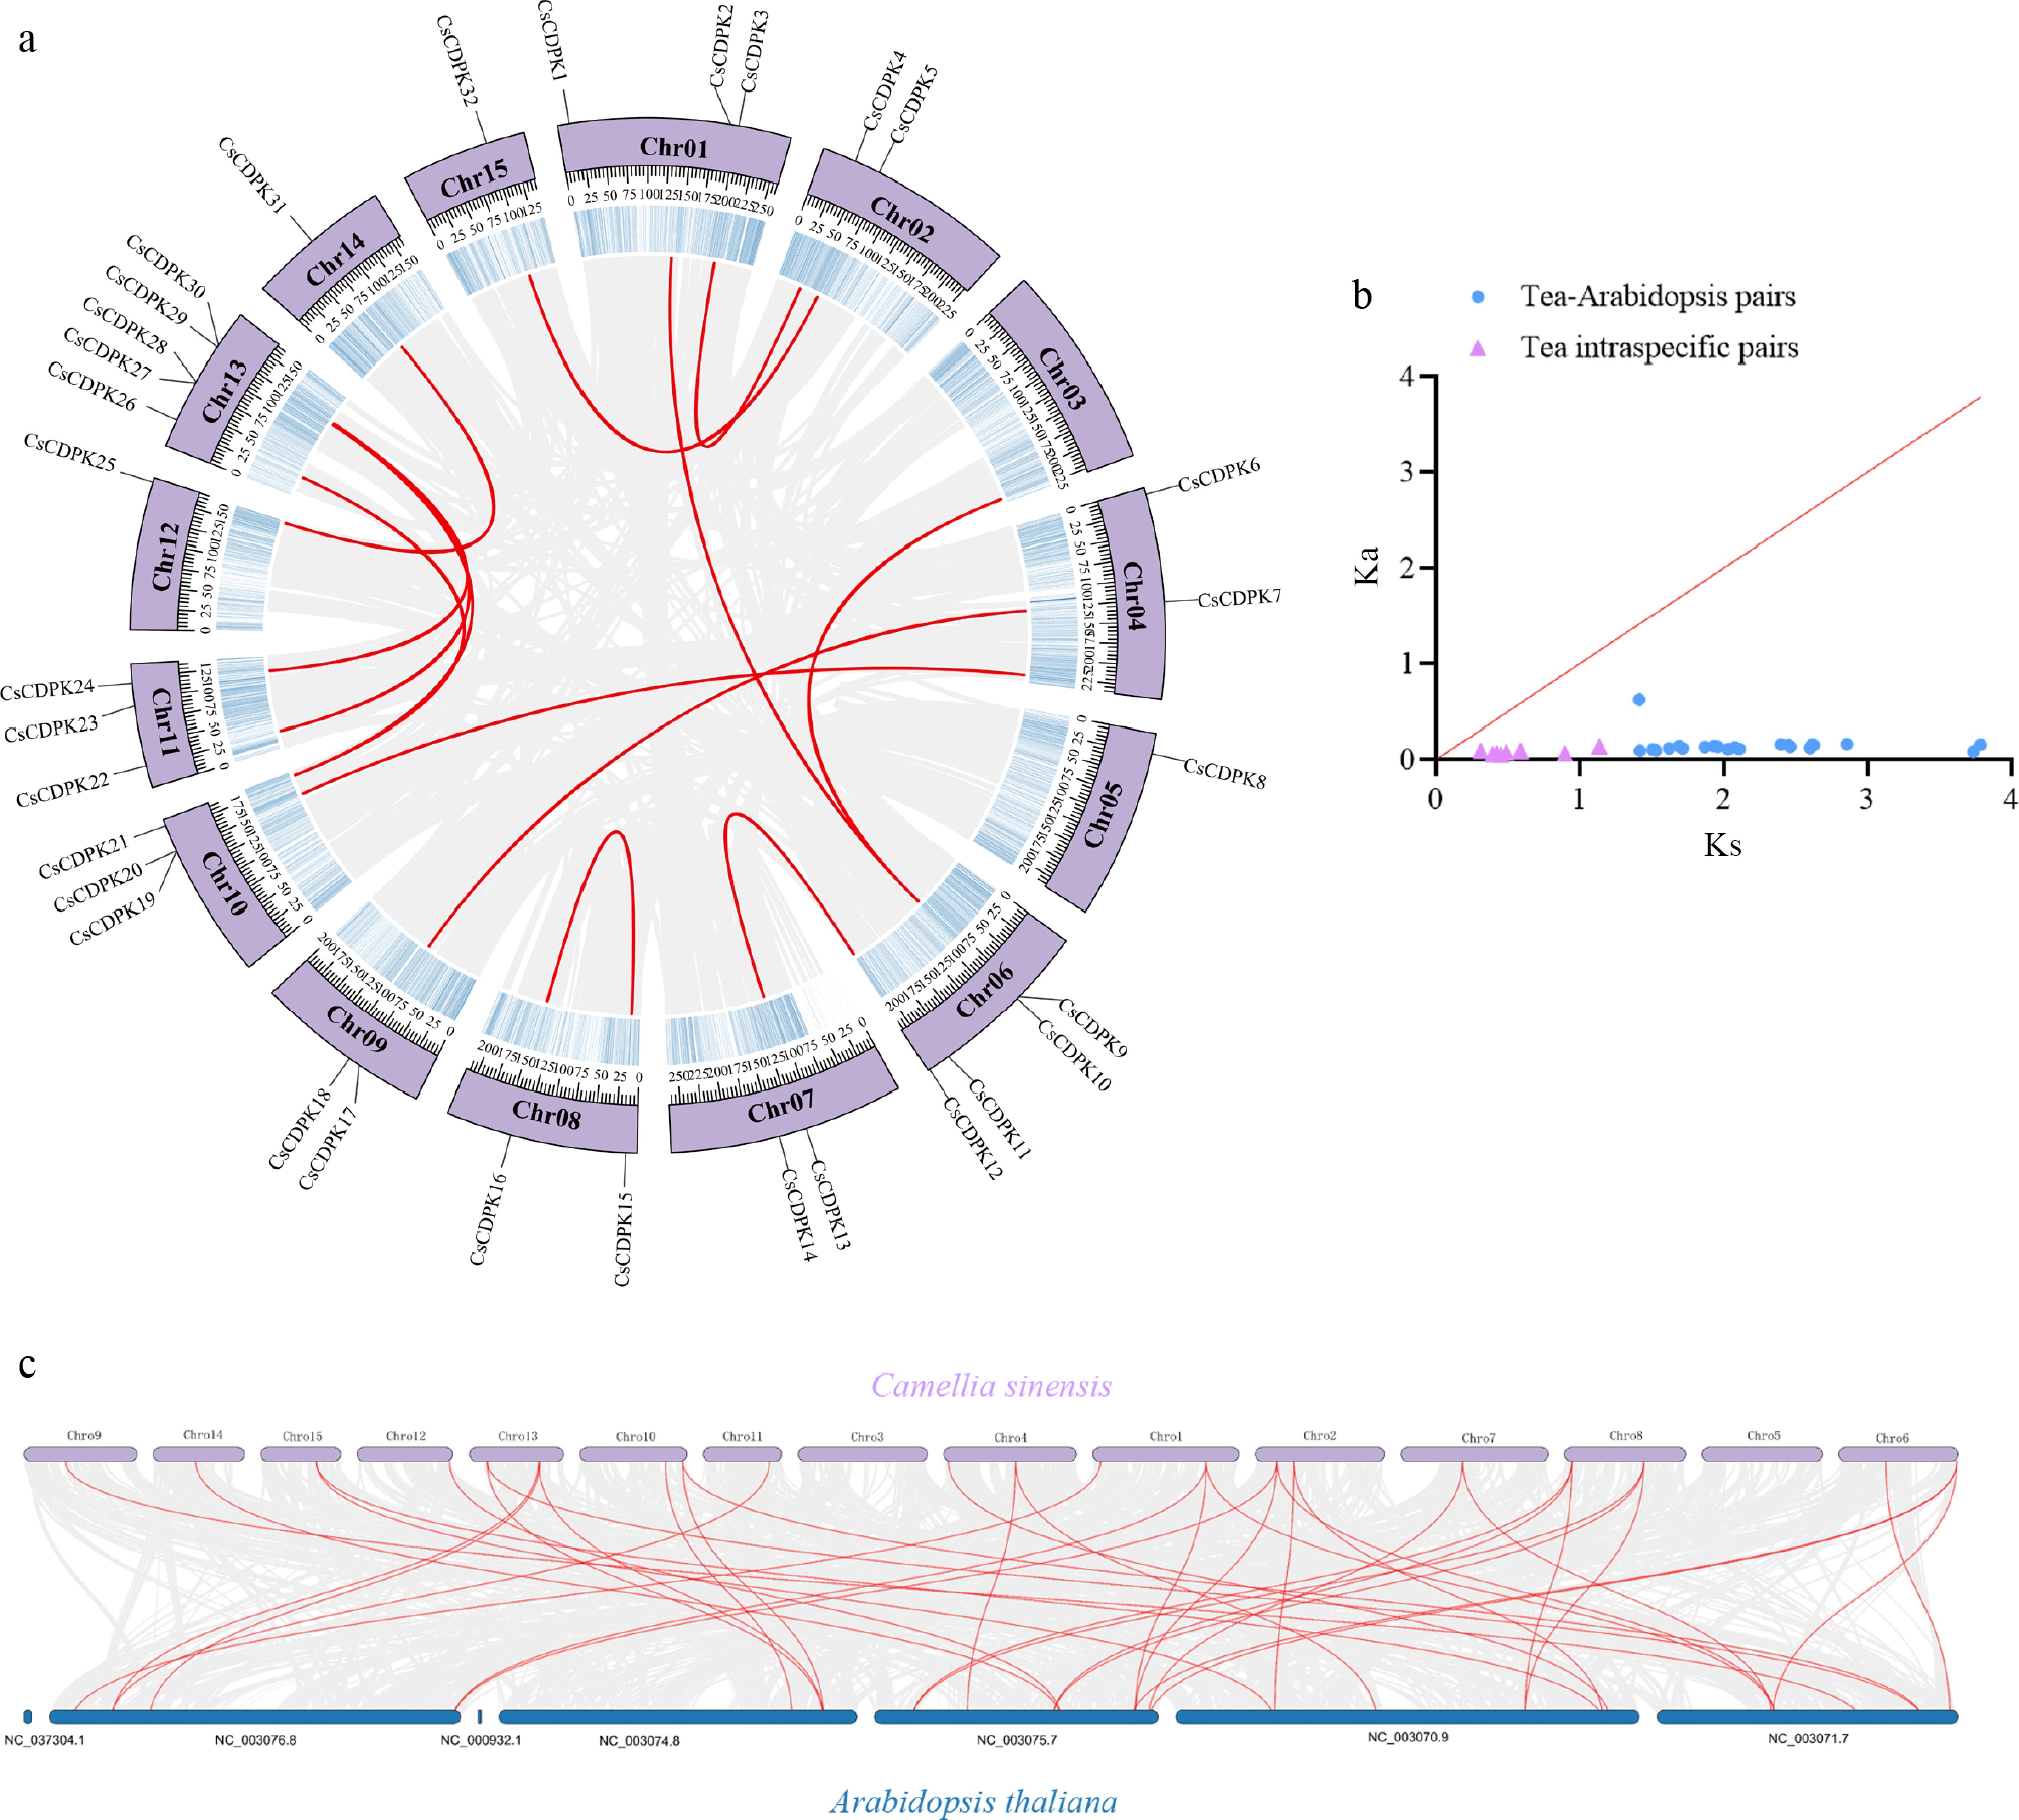
Figure 2.
Synteny analysis of CsCDPK genes. (a) Intraspecific synteny analysis within the tea plant genome. Gray lines indicate all syntenic blocks in the tea genome, and red lines indicate syntenic gene pairs involving CsCDPK genes. (b) Distribution of Ka/Ks ratios. The red line indicates Ka/Ks = 1. Points below the red line represent Ka/Ks < 1 (purifying selection), and points above the red line represent Ka/Ks > 1 (positive selection). (c) Interspecific synteny analysis between tea plant and Arabidopsis. Gray lines indicate all syntenic gene pairs between the Arabidopsis and tea plant genomes, and red lines indicate syntenic gene pairs of CDPK genes between Arabidopsis and tea plants.
-
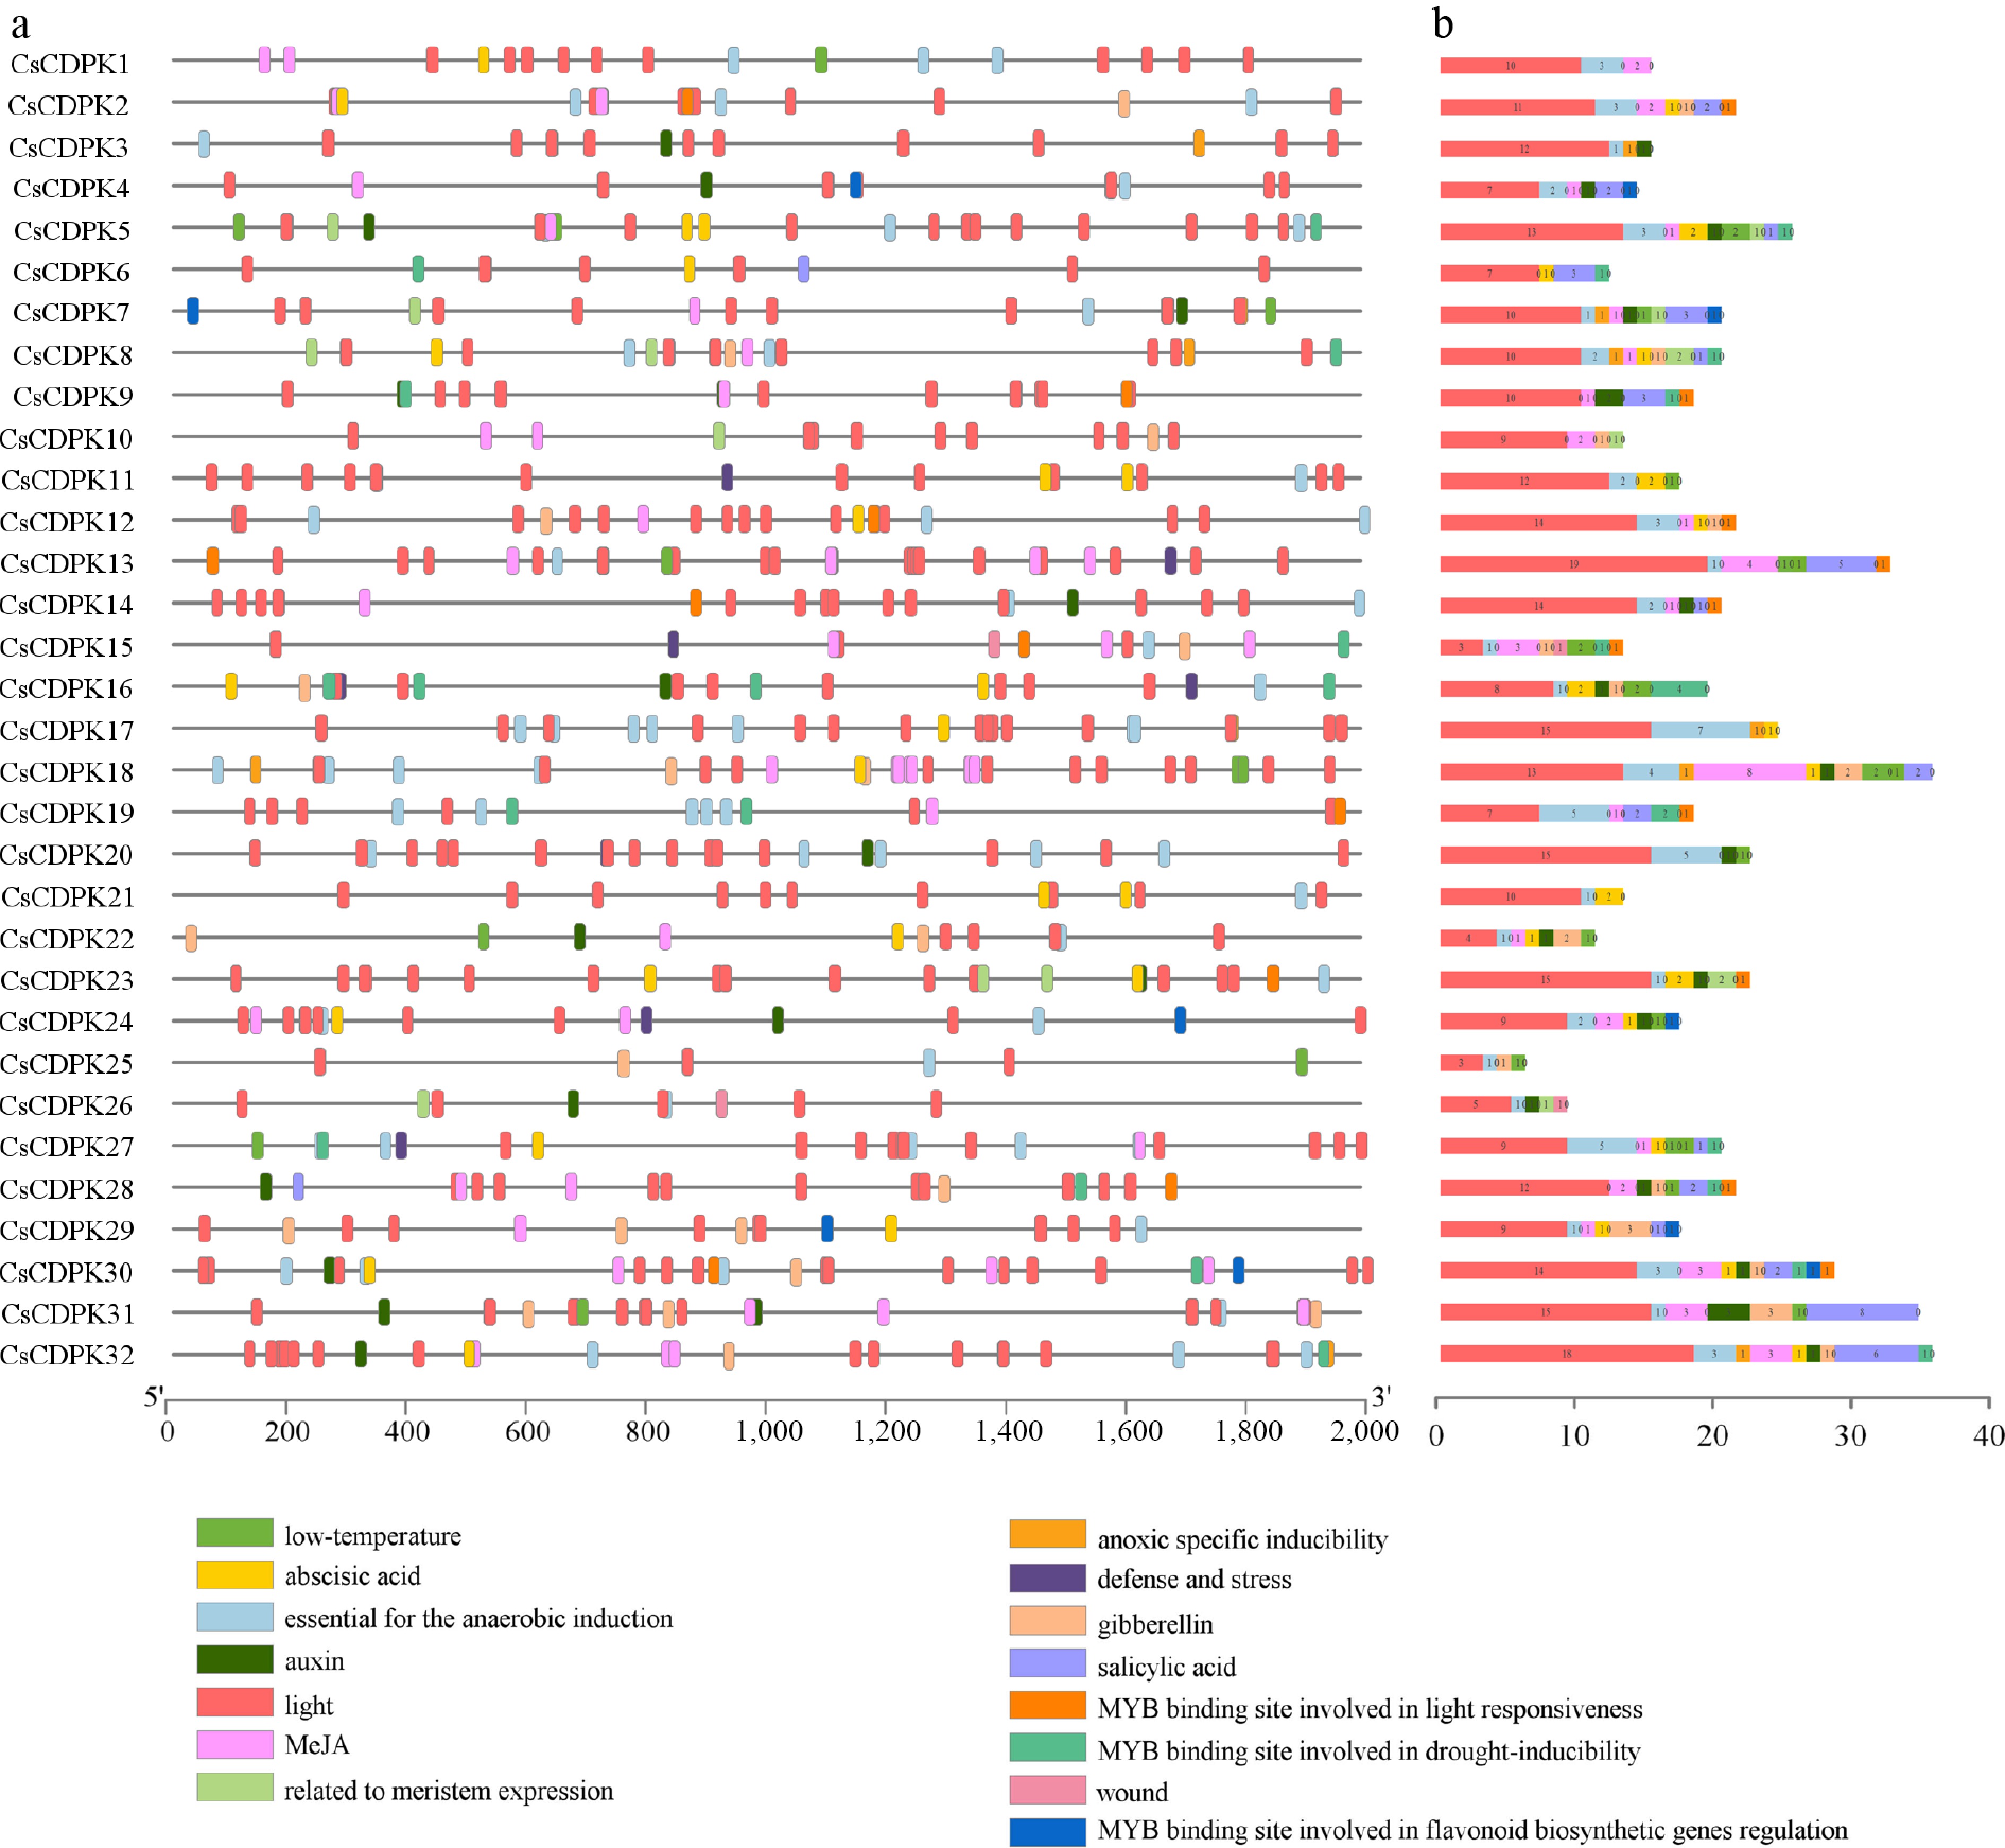
Figure 3.
Cis-acting regulatory elements in the promoter regions of CsCDPK genes. (a) Distribution of cis-acting elements in the promoters of CsCDPK genes; different colors represent different elements. (b) Stacked bar chart showing the number of cis-acting elements in CsCDPK promoters.
-
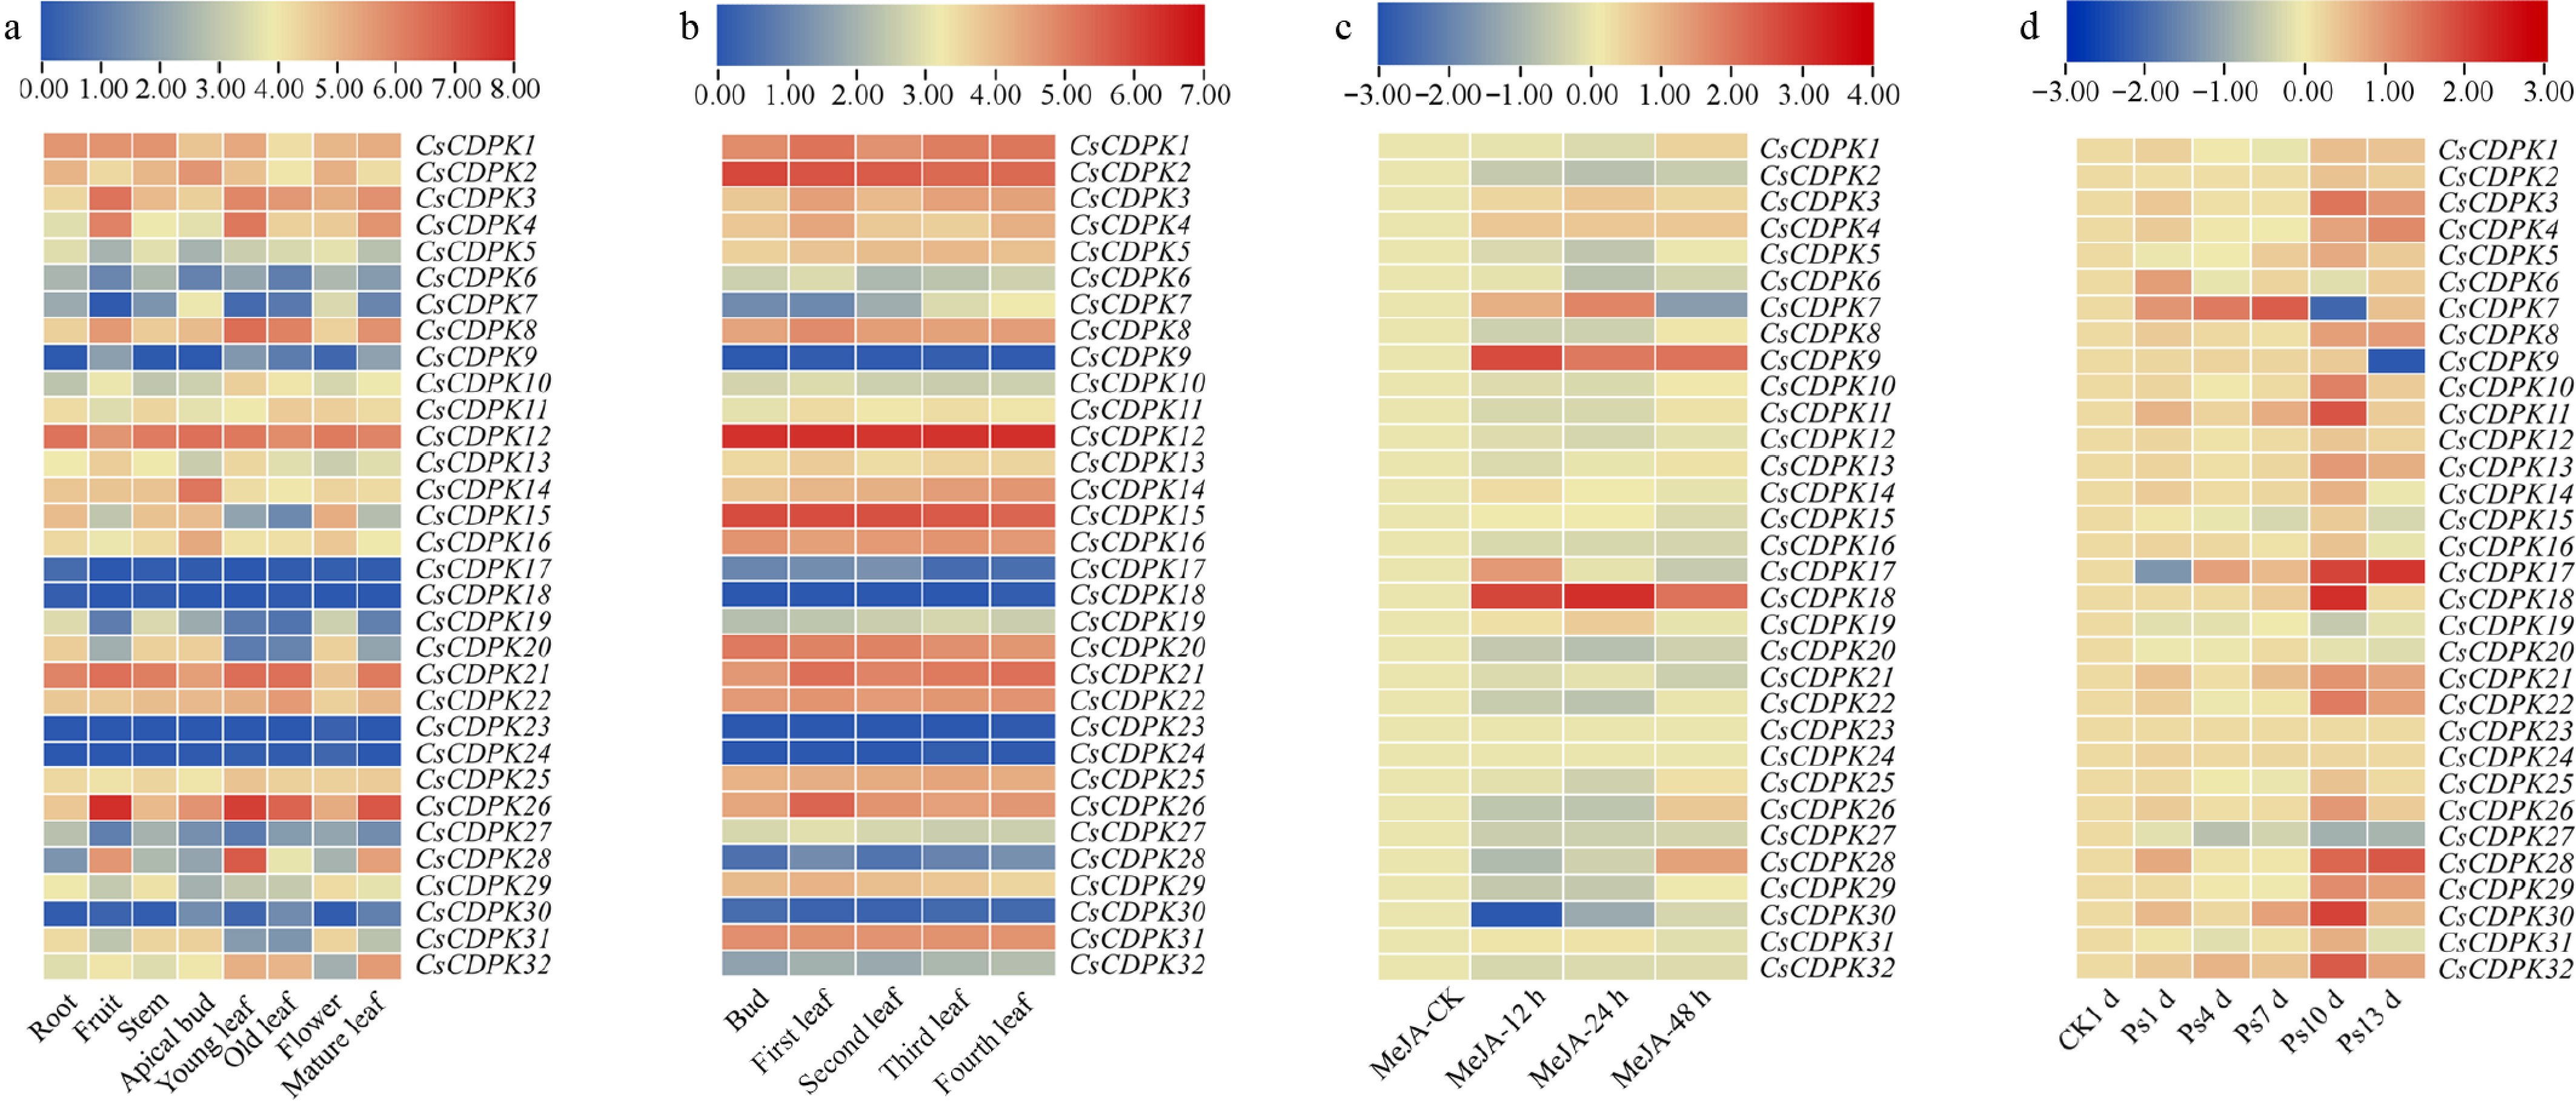
Figure 4.
Expression profiles of CsCDPK genes in different tissues and under stress-related treatments. (a) Expression patterns in tea plant tissues. The heatmap was generated using log2(TPM + 1) without row normalization. Color intensity directly reflects the absolute expression level of each gene across different tissues. (b) Expression patterns in bud and leaf tissues. Data processing and visualization are the same as in (a). (c) Expression dynamics after exogenous MeJA treatment. The heatmap was generated using log2([TPM_treatment + 1]/[TPM_0 h + 1]). Red indicates upregulation relative to 0 h, and blue indicates downregulation. (d) Expression dynamics after gray blight pathogen infection. Data processing and visualization are the same as in (c). The color scale is shown above the heatmap; the specific range is indicated in the figure. Expression data were obtained from the TPIA2.0 database.
-
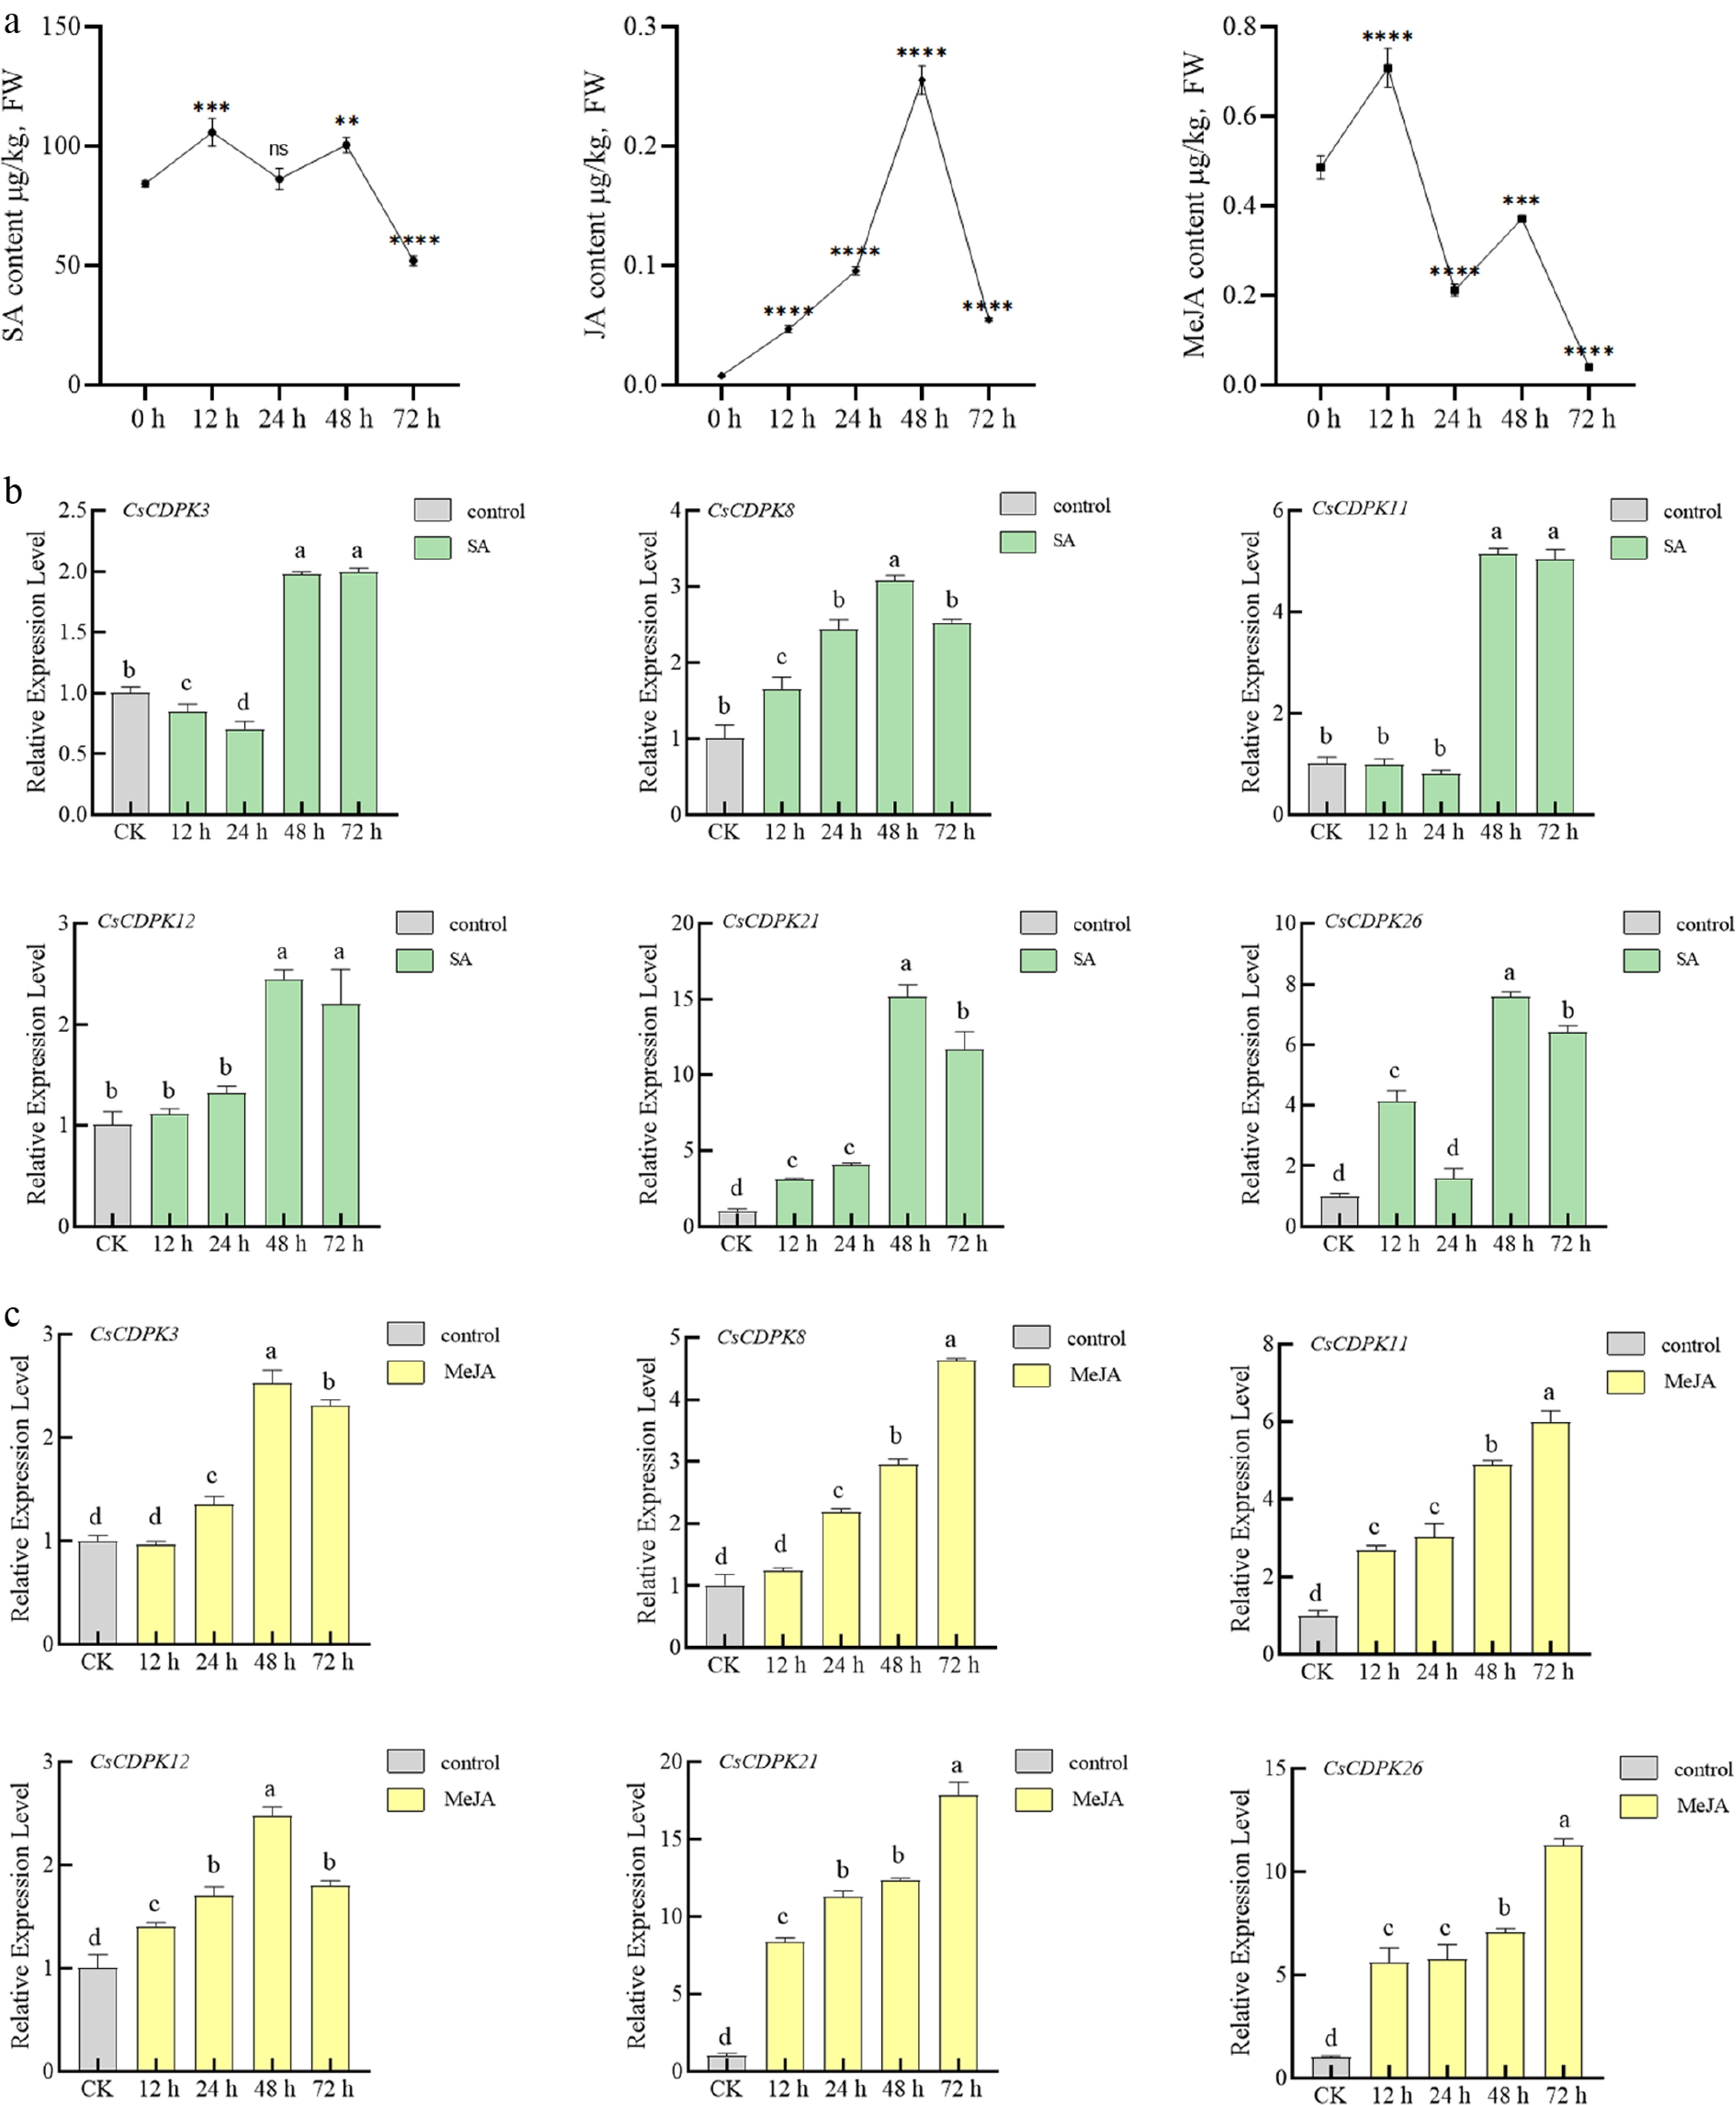
Figure 5.
Dynamic changes in endogenous hormone contents in tea plants after pathogen infection and expression responses of CsCDPK genes to exogenous hormone treatments. (a) Dynamic changes of endogenous SA, JA, and MeJA in tea plant leaves after inoculation with Pseudocercospora camelliae. Each post-inoculation time point was compared with the 0 h control using one-way ANOVA followed by Dunnett's multiple comparison test. Comparisons among non-zero time points were not performed. ns, not significant; ** p < 0.01, *** p ≤ 0.001, **** p < 0.0001. (b) Expression of six CsCDPK genes in response to SA. (c) Expression of six CsCDPK genes in response to MeJA. Different letters indicate significant differences among groups (p < 0.05; one-way ANOVA with Tukey's post hoc test). Groups sharing the same letter are not significantly different.
-
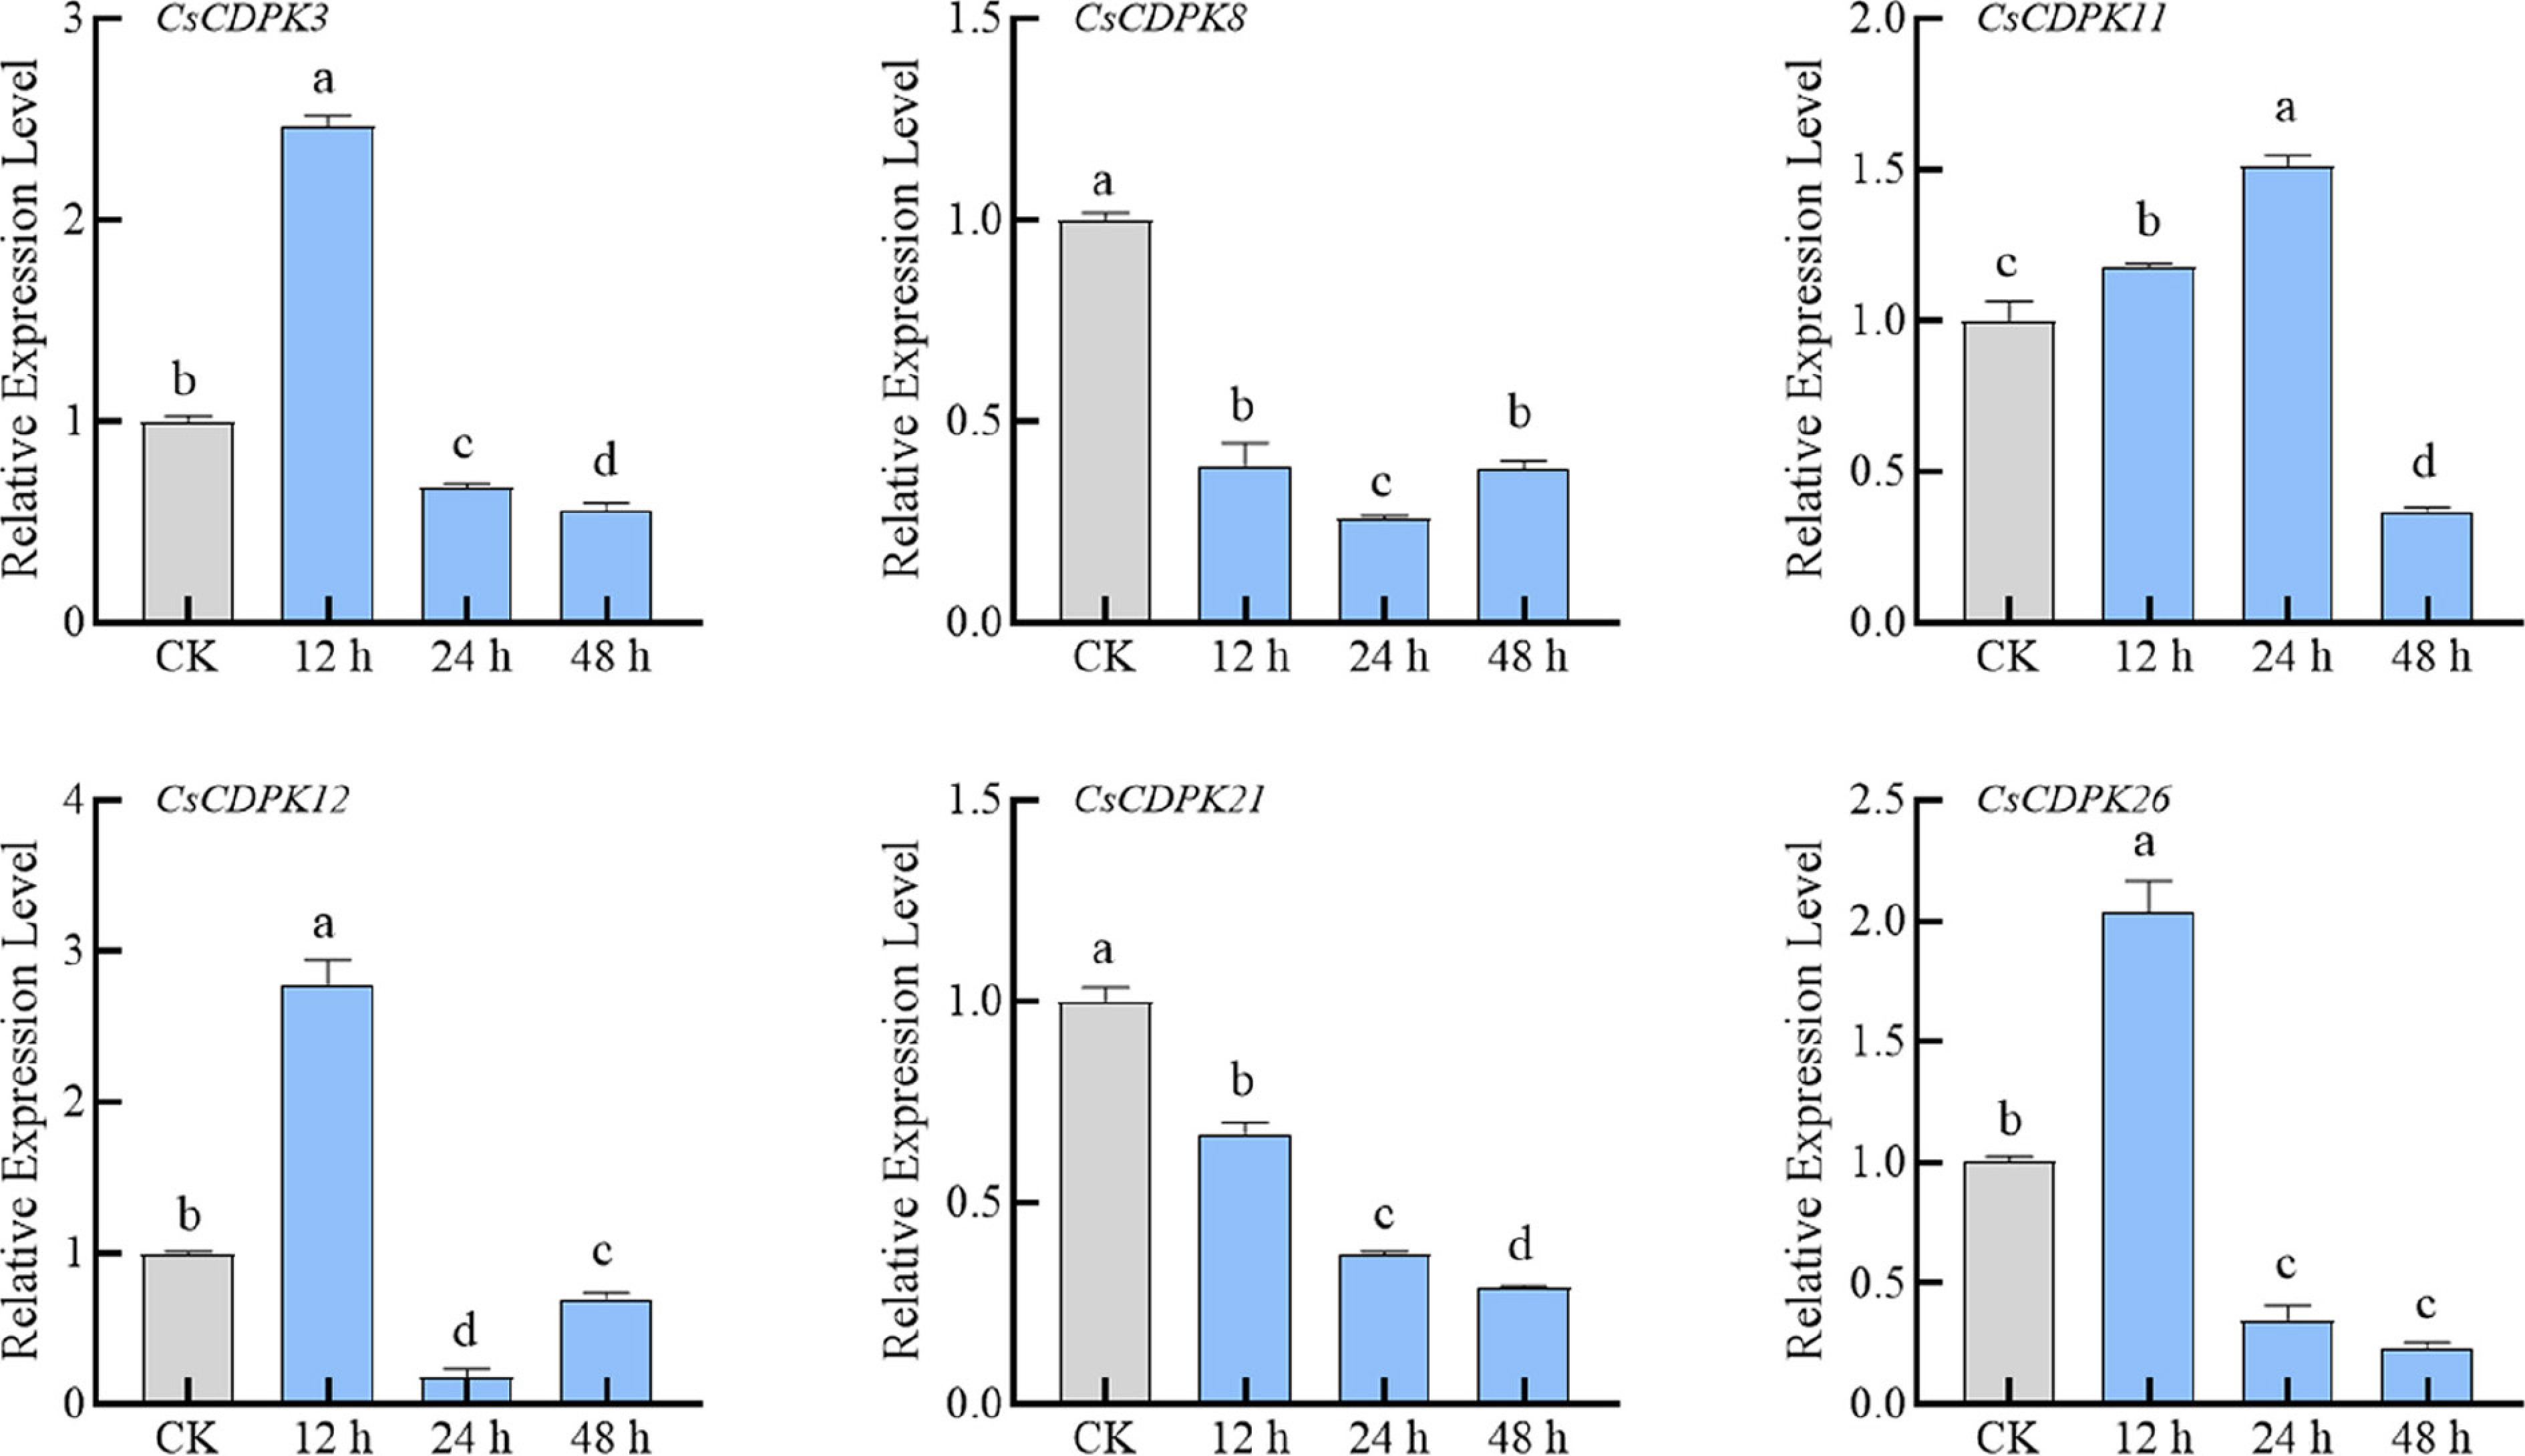
Figure 6.
Expression analysis of six selected CsCDPK genes after AsODN treatment. Different letters indicate significant differences among groups (p < 0.05; one-way ANOVA with Tukey's post hoc test). Groups sharing the same letter are not significantly different.
-
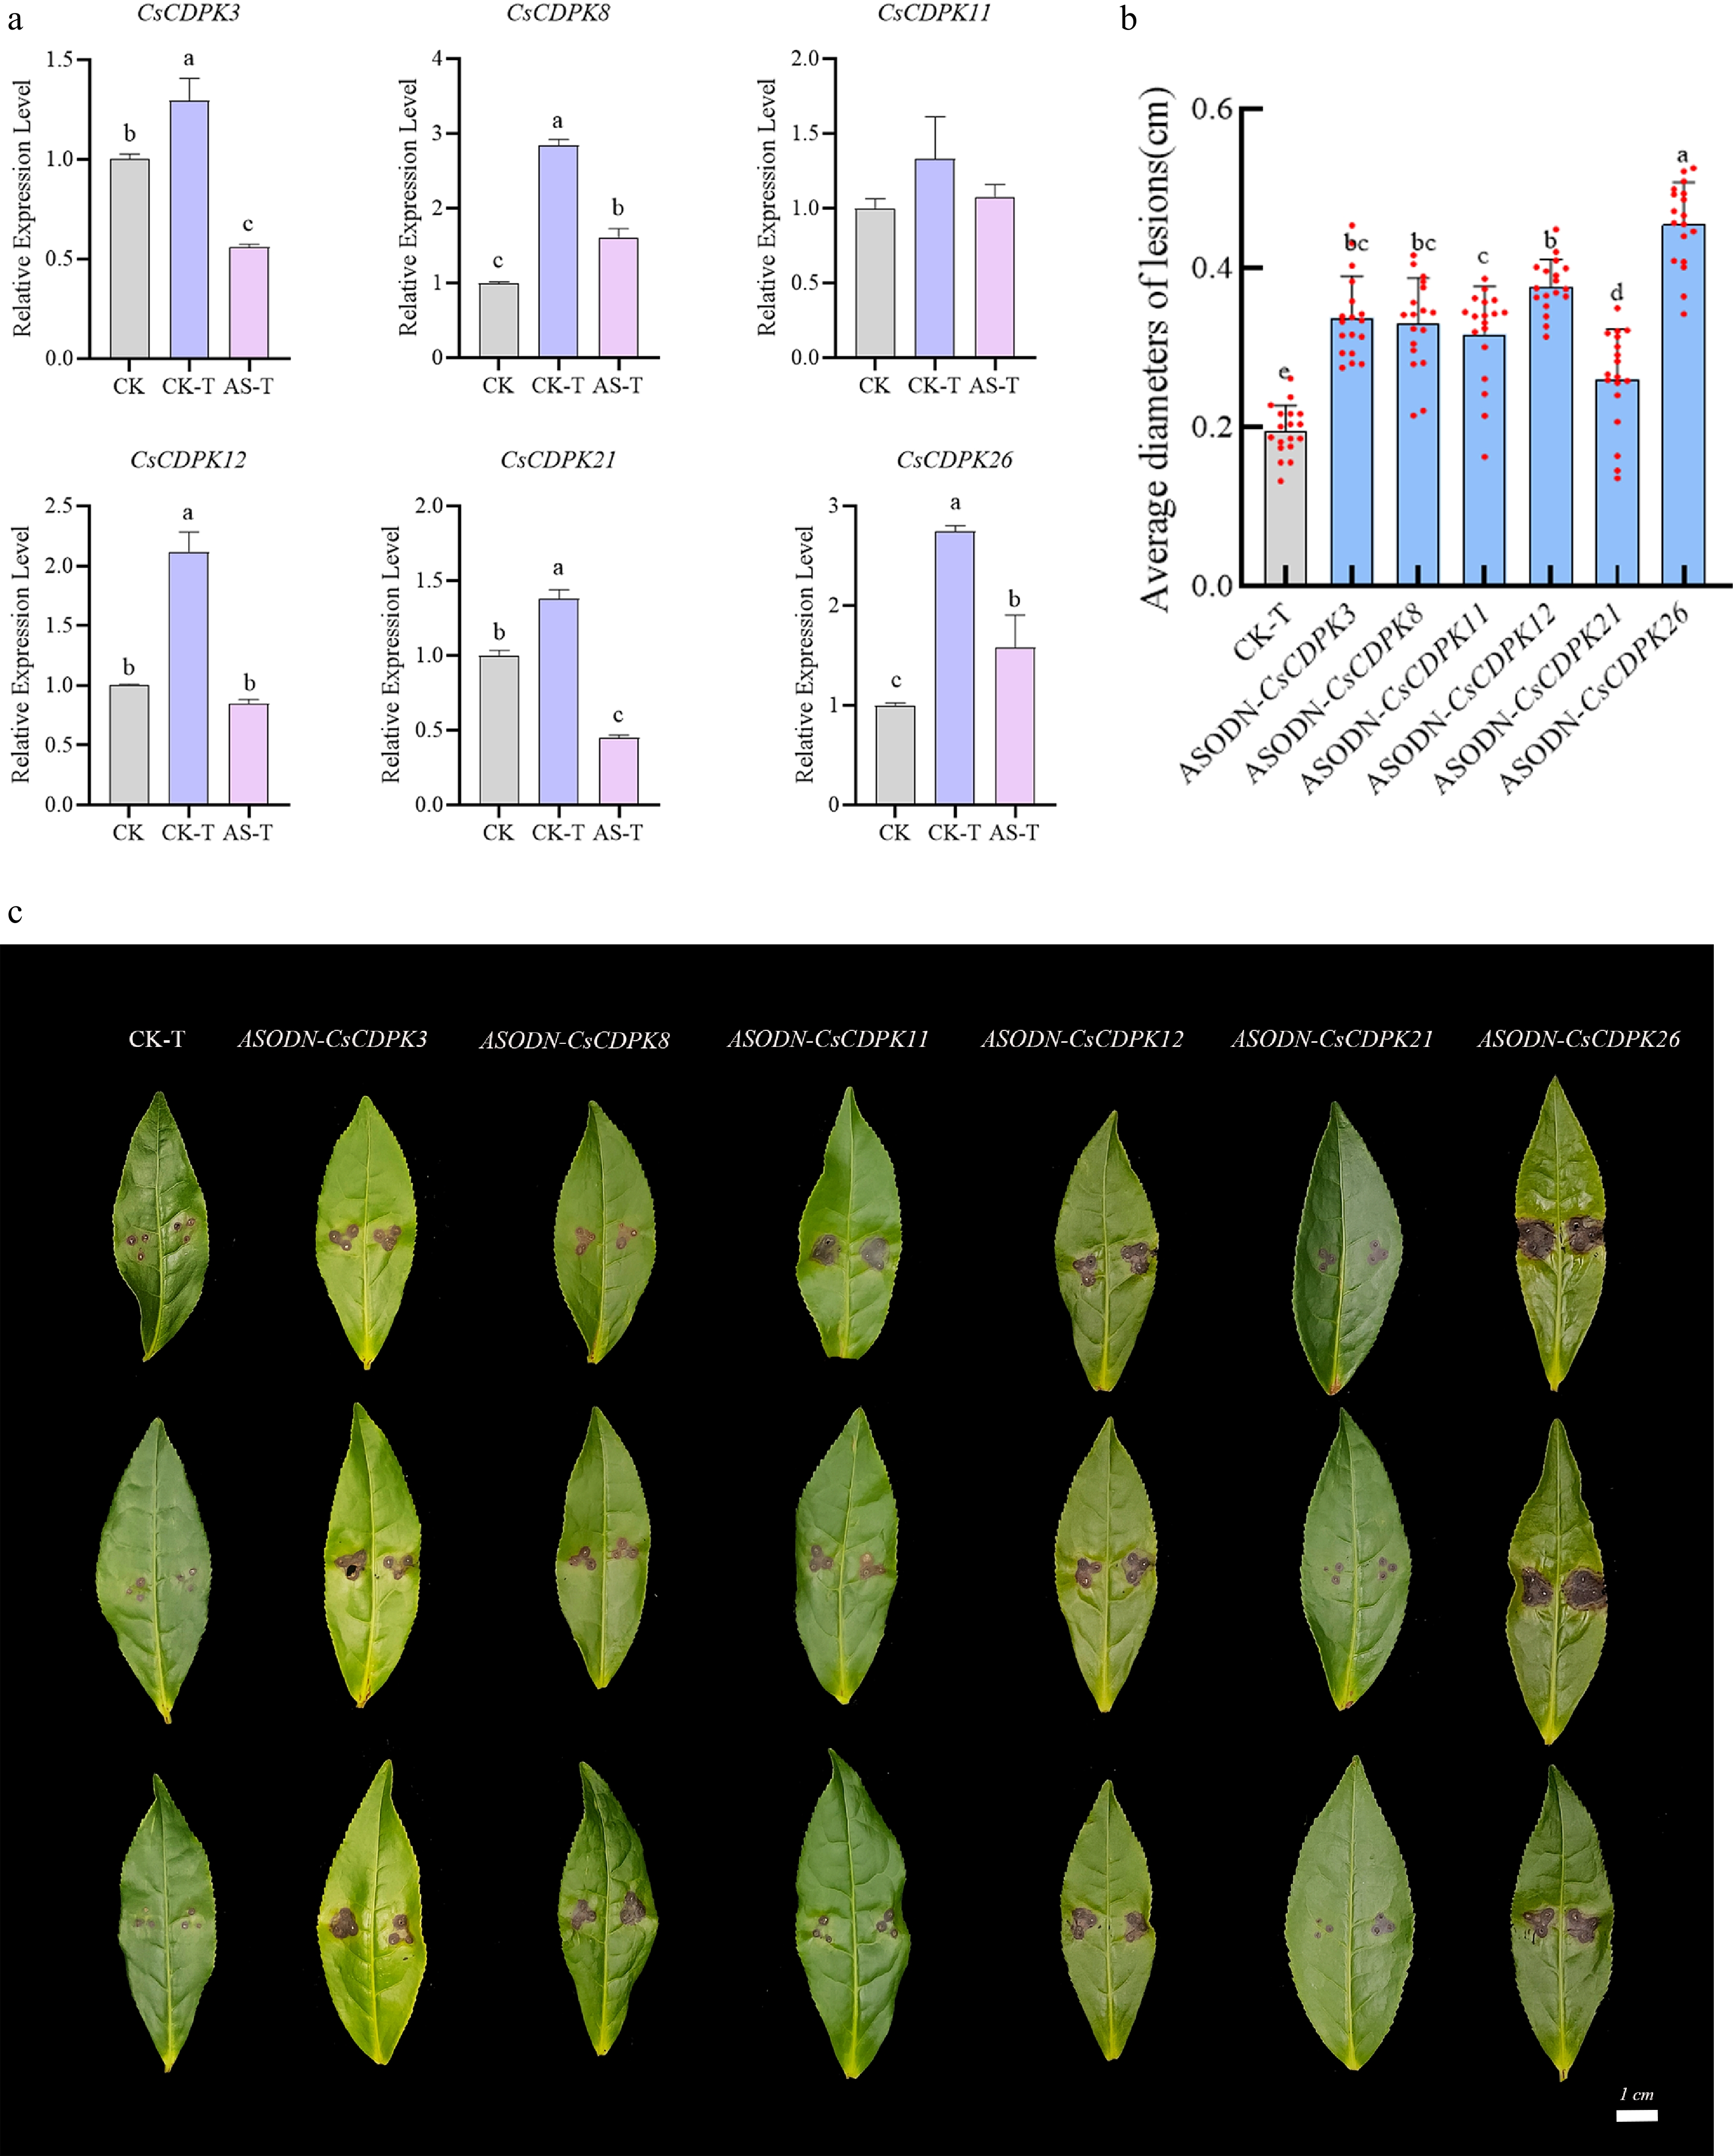
Figure 7.
Analysis of the effects of silencing six selected CsCDPK genes on disease resistance in tea plants. (a) Expression of six CsCDPK genes in silenced leaves after pathogen inoculation, CK: healthy control plants, CK-T: healthy plants inoculated with gray blight treatment, AS-T: silenced plants inoculated with gray blight treatment. (b) Statistical analysis of lesion diameters. Each gene included 18 biological replicates. (c) Representative disease lesions on tea leaves at 3 d after pathogen inoculation. Data are presented as mean ± SD. Different lowercase letters indicate significant differences (p < 0.05), while the same letter indicates no significant difference. No letters indicate no significant differences.
-
Gene name Amino acids/aa Molecular weight/kDa Theoretical pI Instability index Aliphatic index Hydropathicity Subcellular localization CsCDPK1 575 64.08 5.47 46.51 80.03 −0.39 Chloroplast CsCDPK2 506 56.51 5.19 43.60 85.55 −0.33 Cytoplasm CsCDPK3 556 62.90 8.63 42.56 79.08 −0.61 Chloroplast CsCDPK4 562 63.72 9.21 42.60 76.53 −0.66 Chloroplast CsCDPK5 545 62.11 6.25 33.93 83.87 −0.45 Endoplasmic reticulum CsCDPK6 528 59.31 5.58 45.96 83.30 −0.46 Cytoplasm CsCDPK7 510 57.47 5.26 36.65 82.06 −0.38 Chloroplast CsCDPK8 528 59.12 6.24 45.73 80.17 −0.45 Cytoplasm CsCDPK9 535 58.91 6.11 46.28 91.48 −0.19 Cytoplasm CsCDPK10 598 66.65 8.98 45.26 81.77 −0.40 Cytoplasm CsCDPK11 533 60.62 6.19 34.14 81.56 −0.54 Cytoplasm CsCDPK12 574 64.20 5.55 45.83 81.88 −0.41 Chloroplast CsCDPK13 565 63.59 5.58 37.94 83.88 −0.38 Cytoplasm CsCDPK14 574 64.13 5.38 42.13 79.46 −0.38 Chloroplast CsCDPK15 526 59.13 5.87 37.43 77.66 −0.47 Cytoplasm CsCDPK16 557 62.97 6.59 45.13 74.58 −0.59 Cytoplasm CsCDPK17 534 60.96 5.73 35.57 83.95 −0.45 Cytoplasm CsCDPK18 461 51.97 5.45 42.24 87.57 −0.34 Cytoplasm CsCDPK19 406 45.58 6.54 40.19 85.00 −0.30 Cytoplasm CsCDPK20 529 59.54 5.60 40.93 86.43 −0.37 Cytoplasm CsCDPK21 533 60.55 6.32 33.28 81.91 −0.53 Cytoplasm CsCDPK22 531 59.77 6.24 34.97 84.48 −0.43 Cytoplasm CsCDPK23 291 33.30 6.72 45.36 93.81 −0.35 Cytoplasm CsCDPK24 536 59.84 5.48 37.62 77.72 −0.52 Cytoplasm CsCDPK25 516 58.11 5.73 43.13 76.90 −0.50 Chloroplast CsCDPK26 531 60.01 6.38 36.47 82.58 −0.50 Cytoplasm CsCDPK27 607 66.88 5.30 42.03 84.96 −0.35 Cytoplasm CsCDPK28 609 68.24 5.45 49.93 83.55 −0.36 Cytoplasm CsCDPK29 551 62.30 6.63 43.88 83.72 −0.43 Cytoplasm CsCDPK30 538 59.83 5.45 34.10 77.04 −0.50 Cytoplasm CsCDPK31 505 57.19 5.85 36.88 79.15 −0.46 Peroxisome CsCDPK32 541 61.54 6.16 33.52 85.19 −0.42 Cytoplasm Table 1.
Physicochemical properties and predicted subcellular localization of CsCDPK proteins.
Figures
(7)
Tables
(1)