-
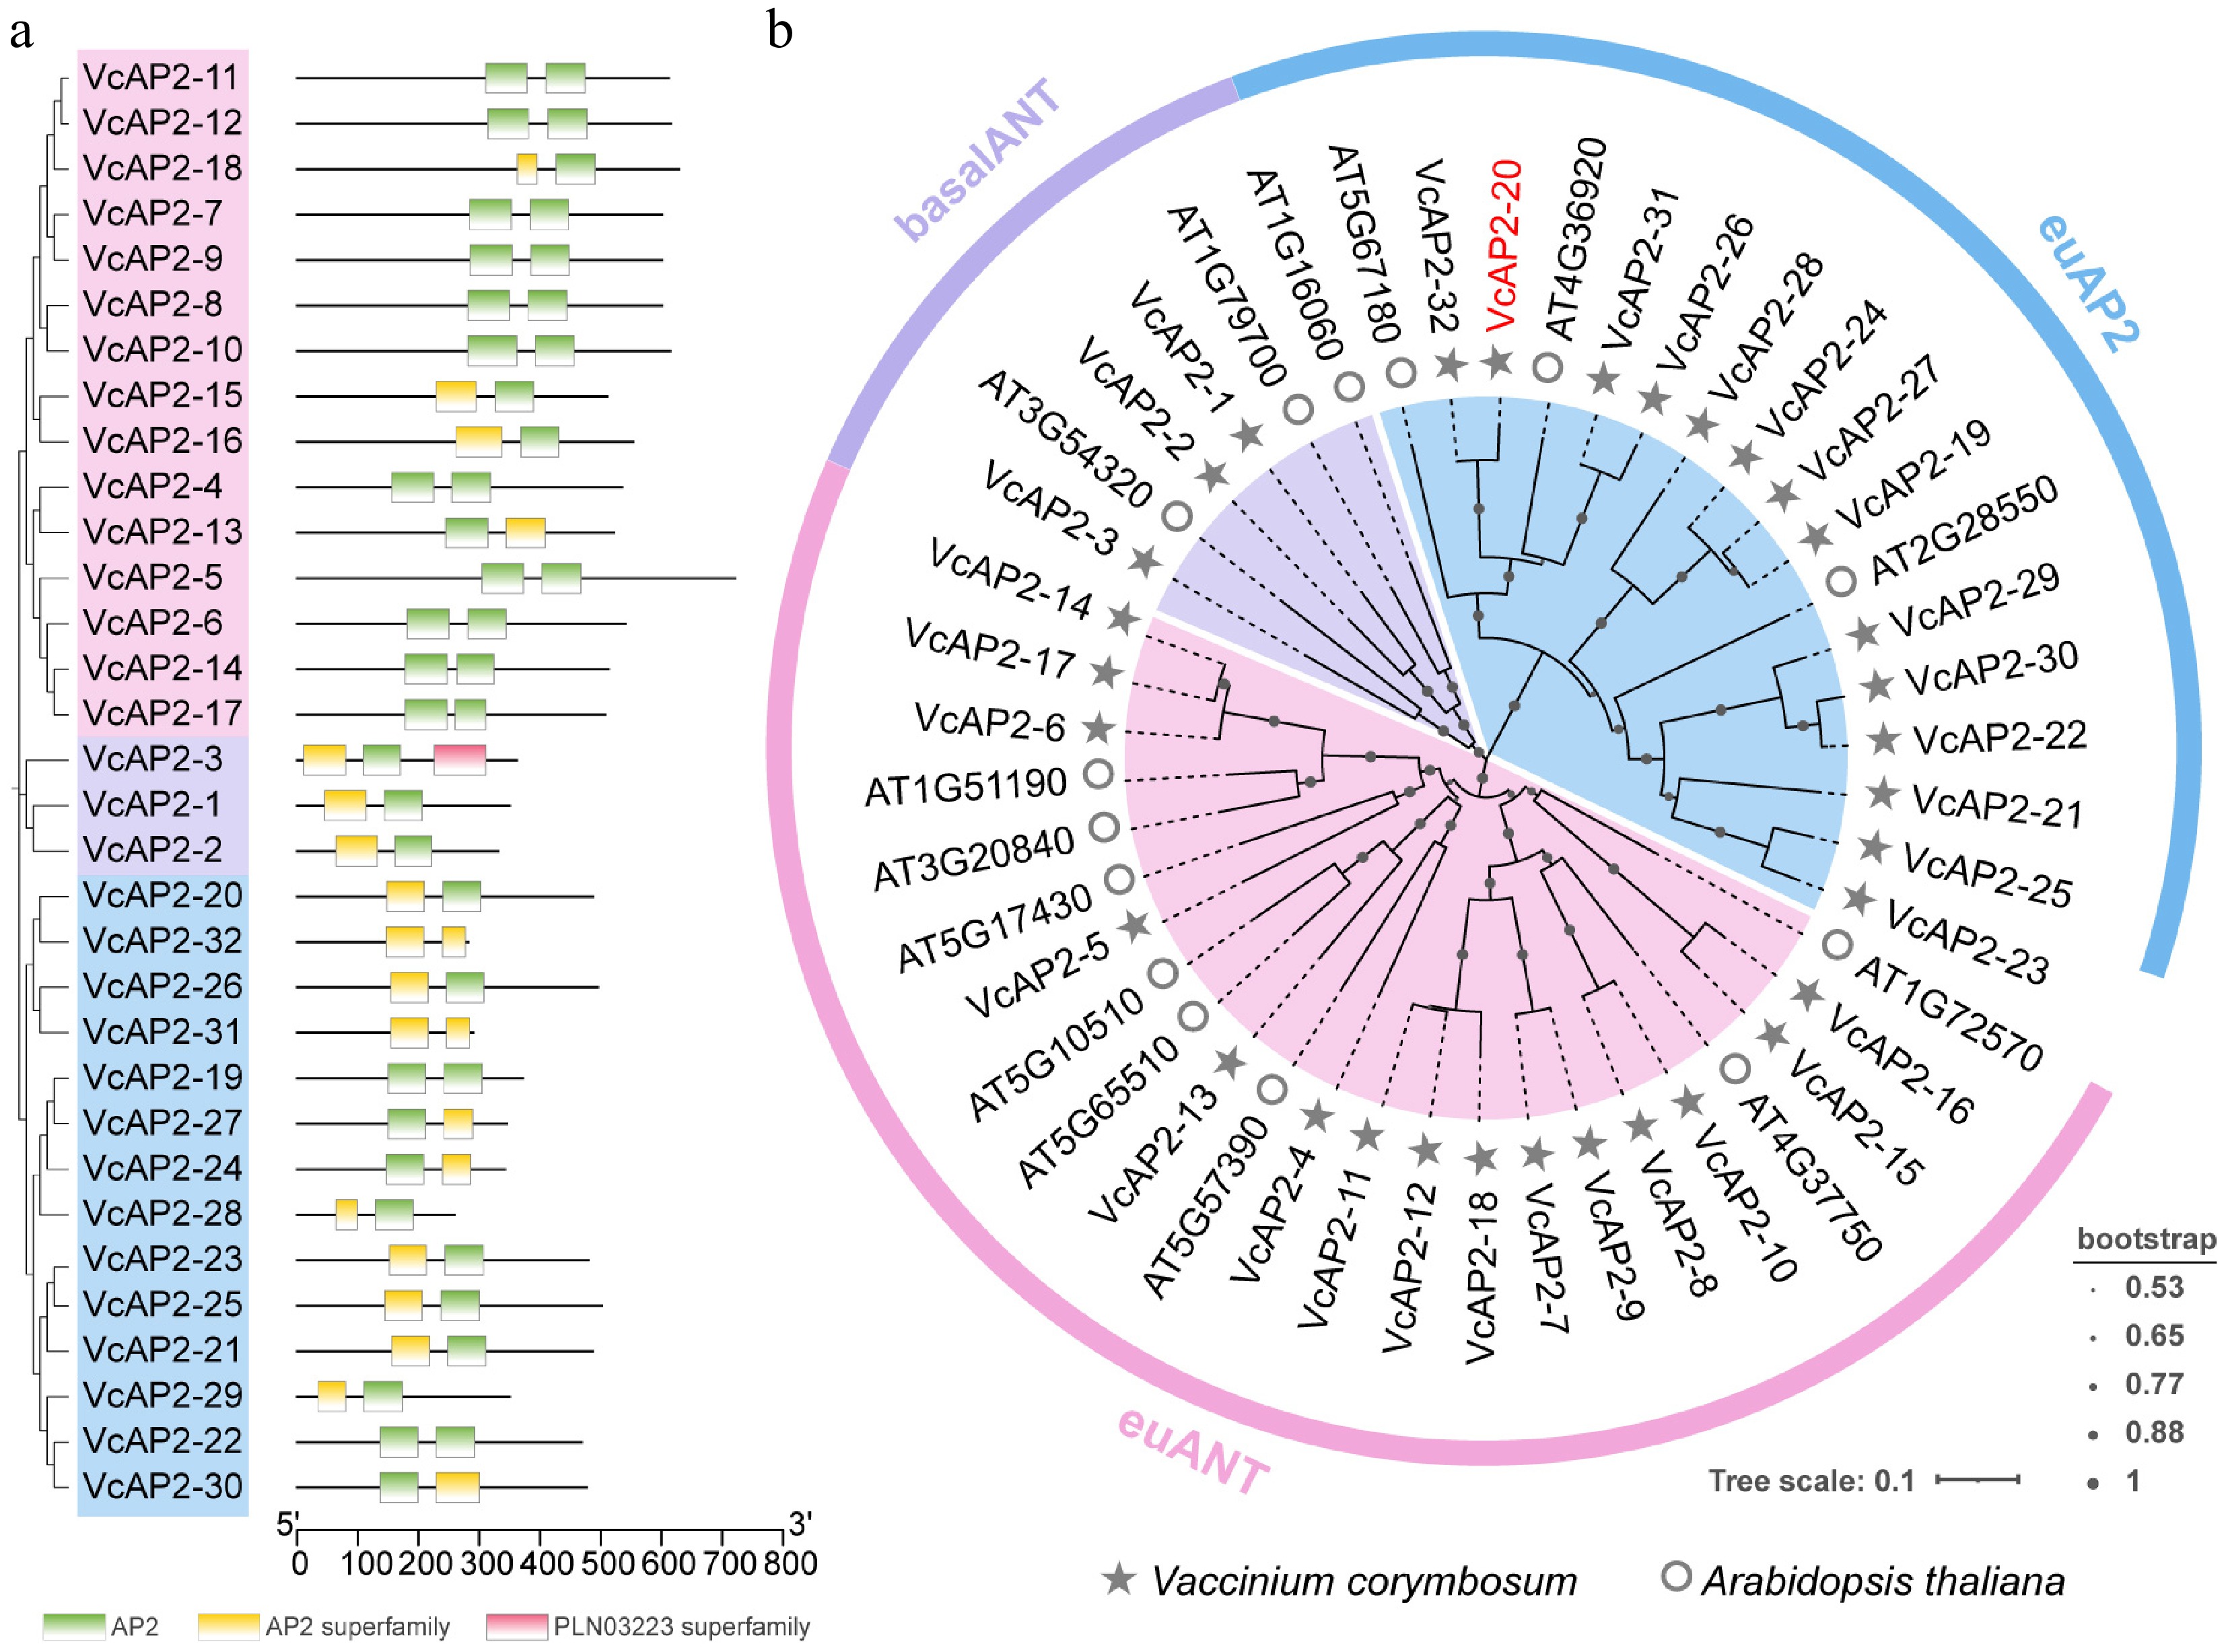
Figure 1.
Genome-wide identification of VcAP2 subfamily members in blueberry. (a) Conserved domains of the VcAP2 subfamily members in blueberry. The AP2 subfamily proteins were clustered into three subgroups: euAP2 (blue), euANT (pink), and basalANT (purple). (b) Phylogenetic analysis of the AP2 proteins from blueberry (Vaccinium corymbosum) and Arabidopsis (Arabidopsis thaliana). Proteins from blueberry and Arabidopsis are marked by a star, and a circle, respectively. VcAP2-20 belongs to the euAP2 subgroup.
-
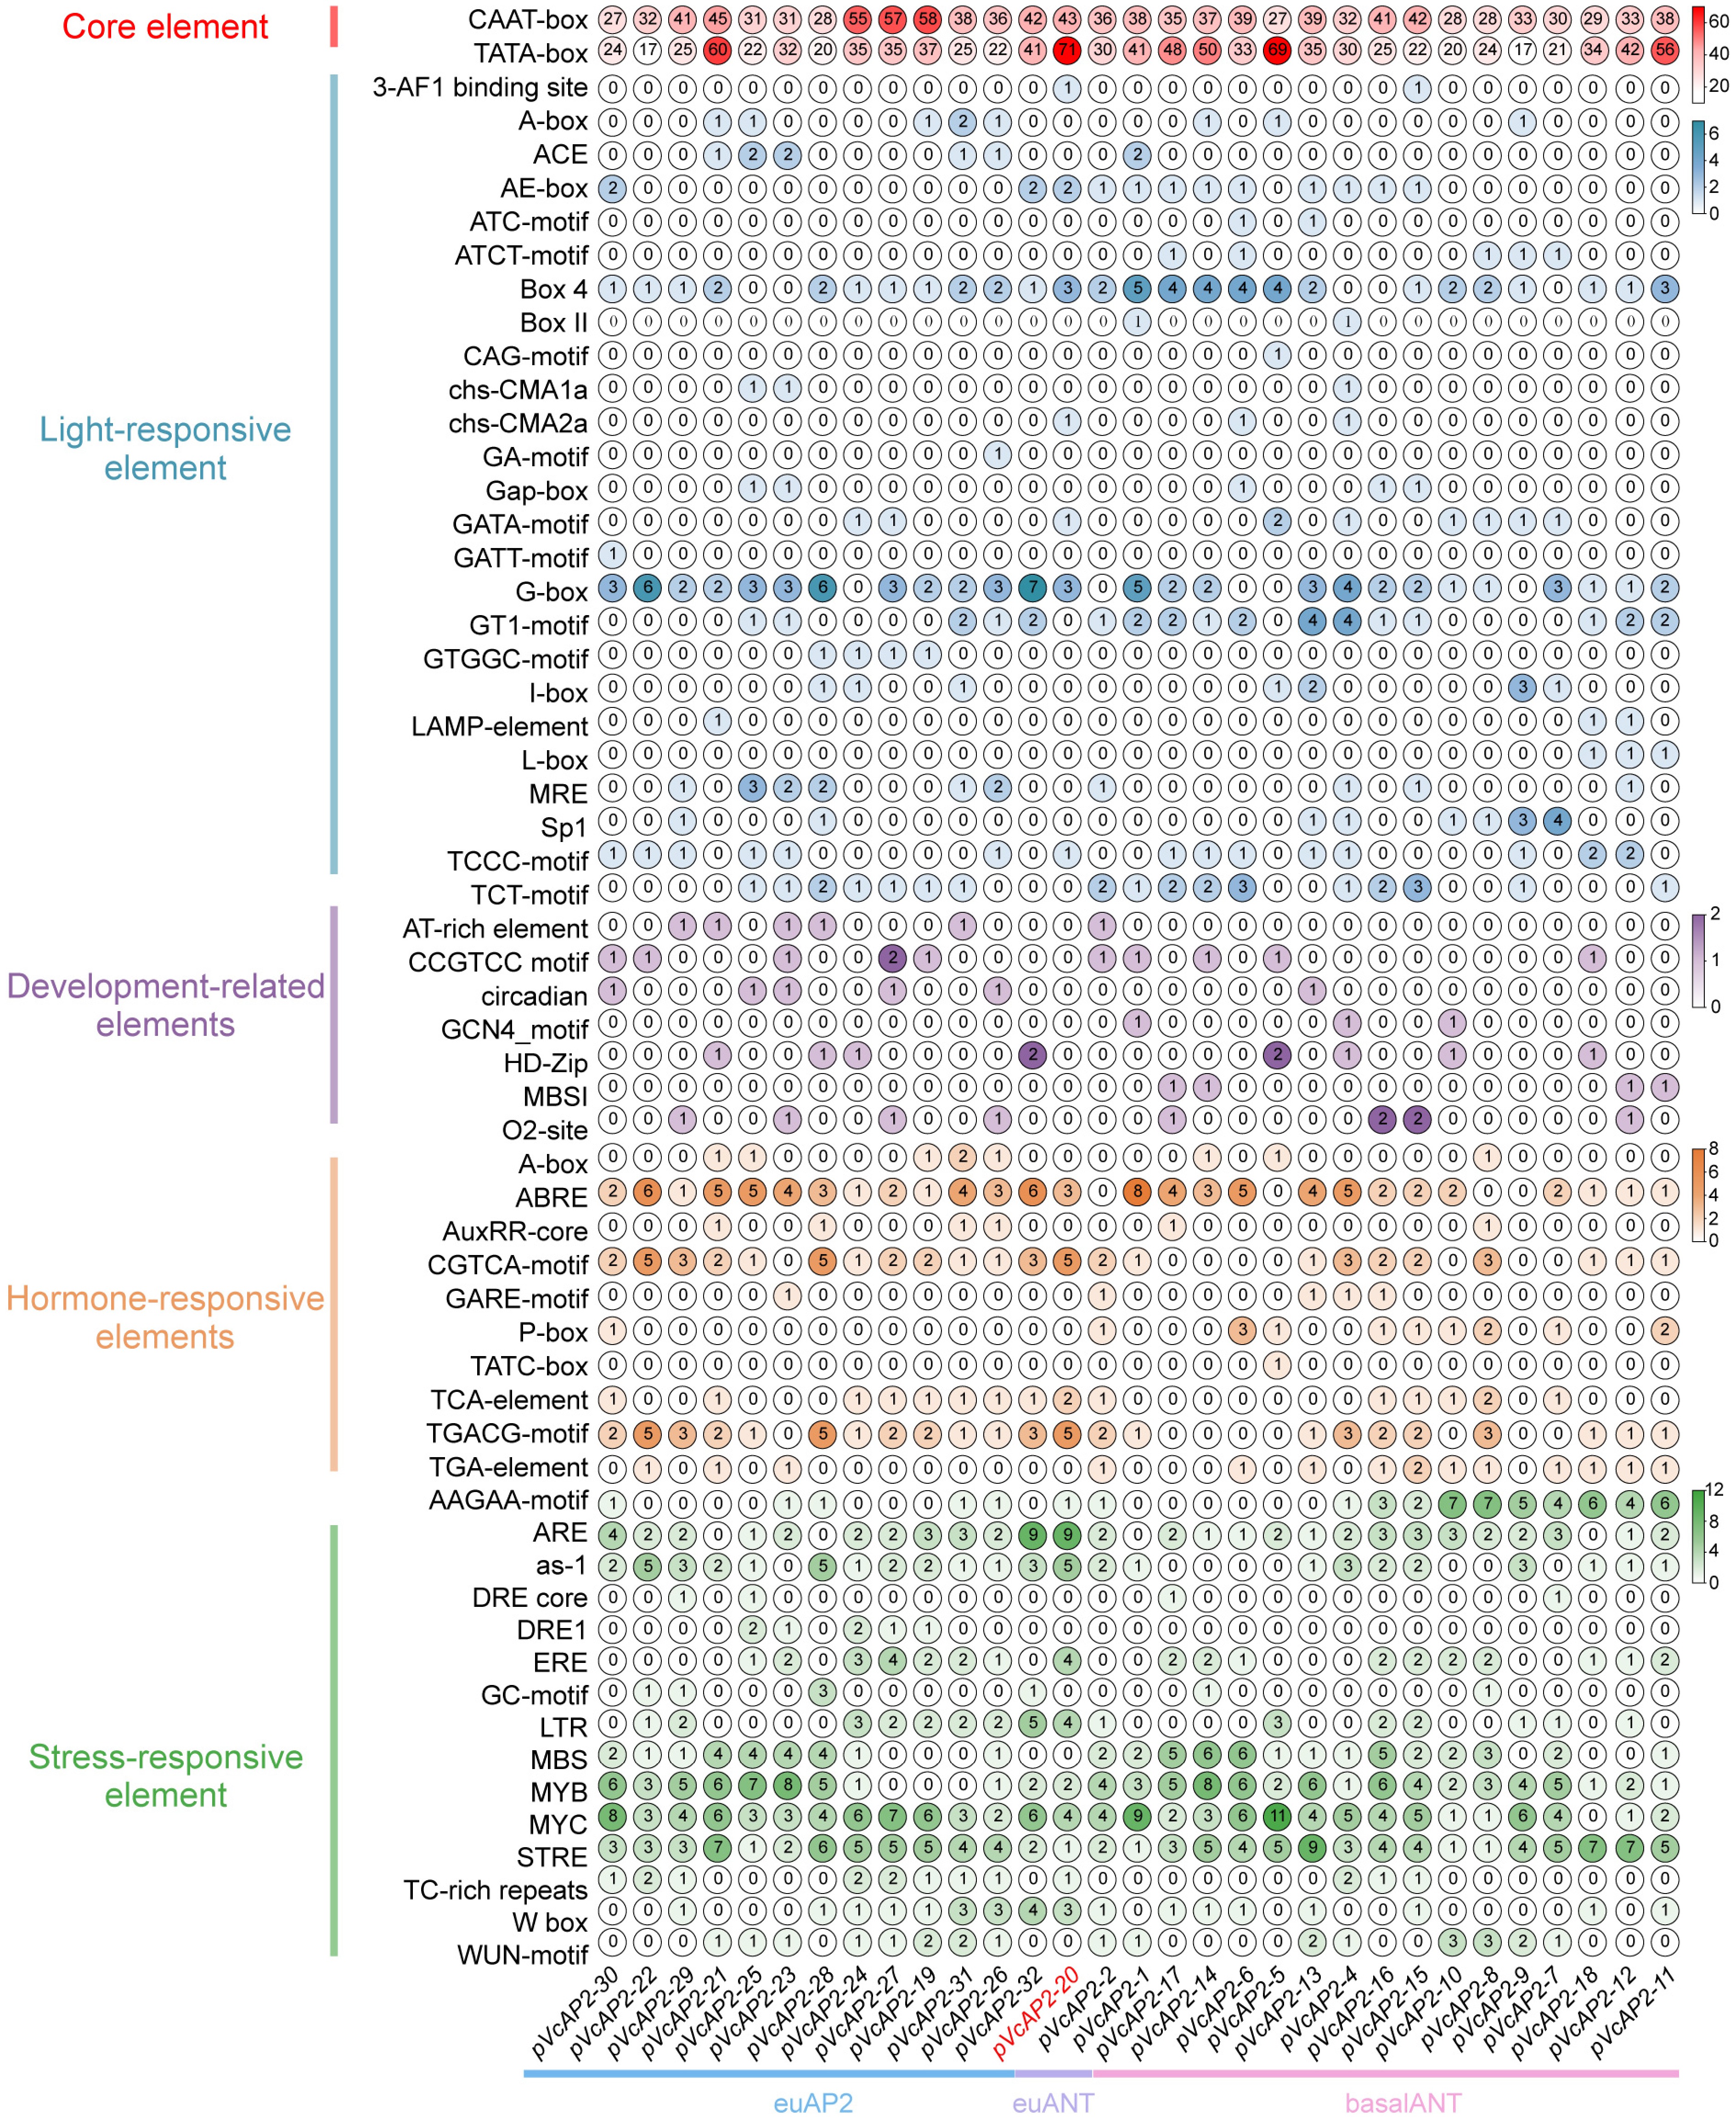
Figure 2.
Cis-acting elements analysis in the promoters of VcAP2 subfamily members. Promoter sequences were analyzed using the PlantCARE database to predict cis-acting regulatory elements, which were categorized into five functional types: core elements (red), light-responsive elements (blue), development-related elements (purple), hormone-responsive elements (orange), and stress-responsive elements (green). The numbers within the circle indicate the count of each element in each VcAP2 promoter.
-
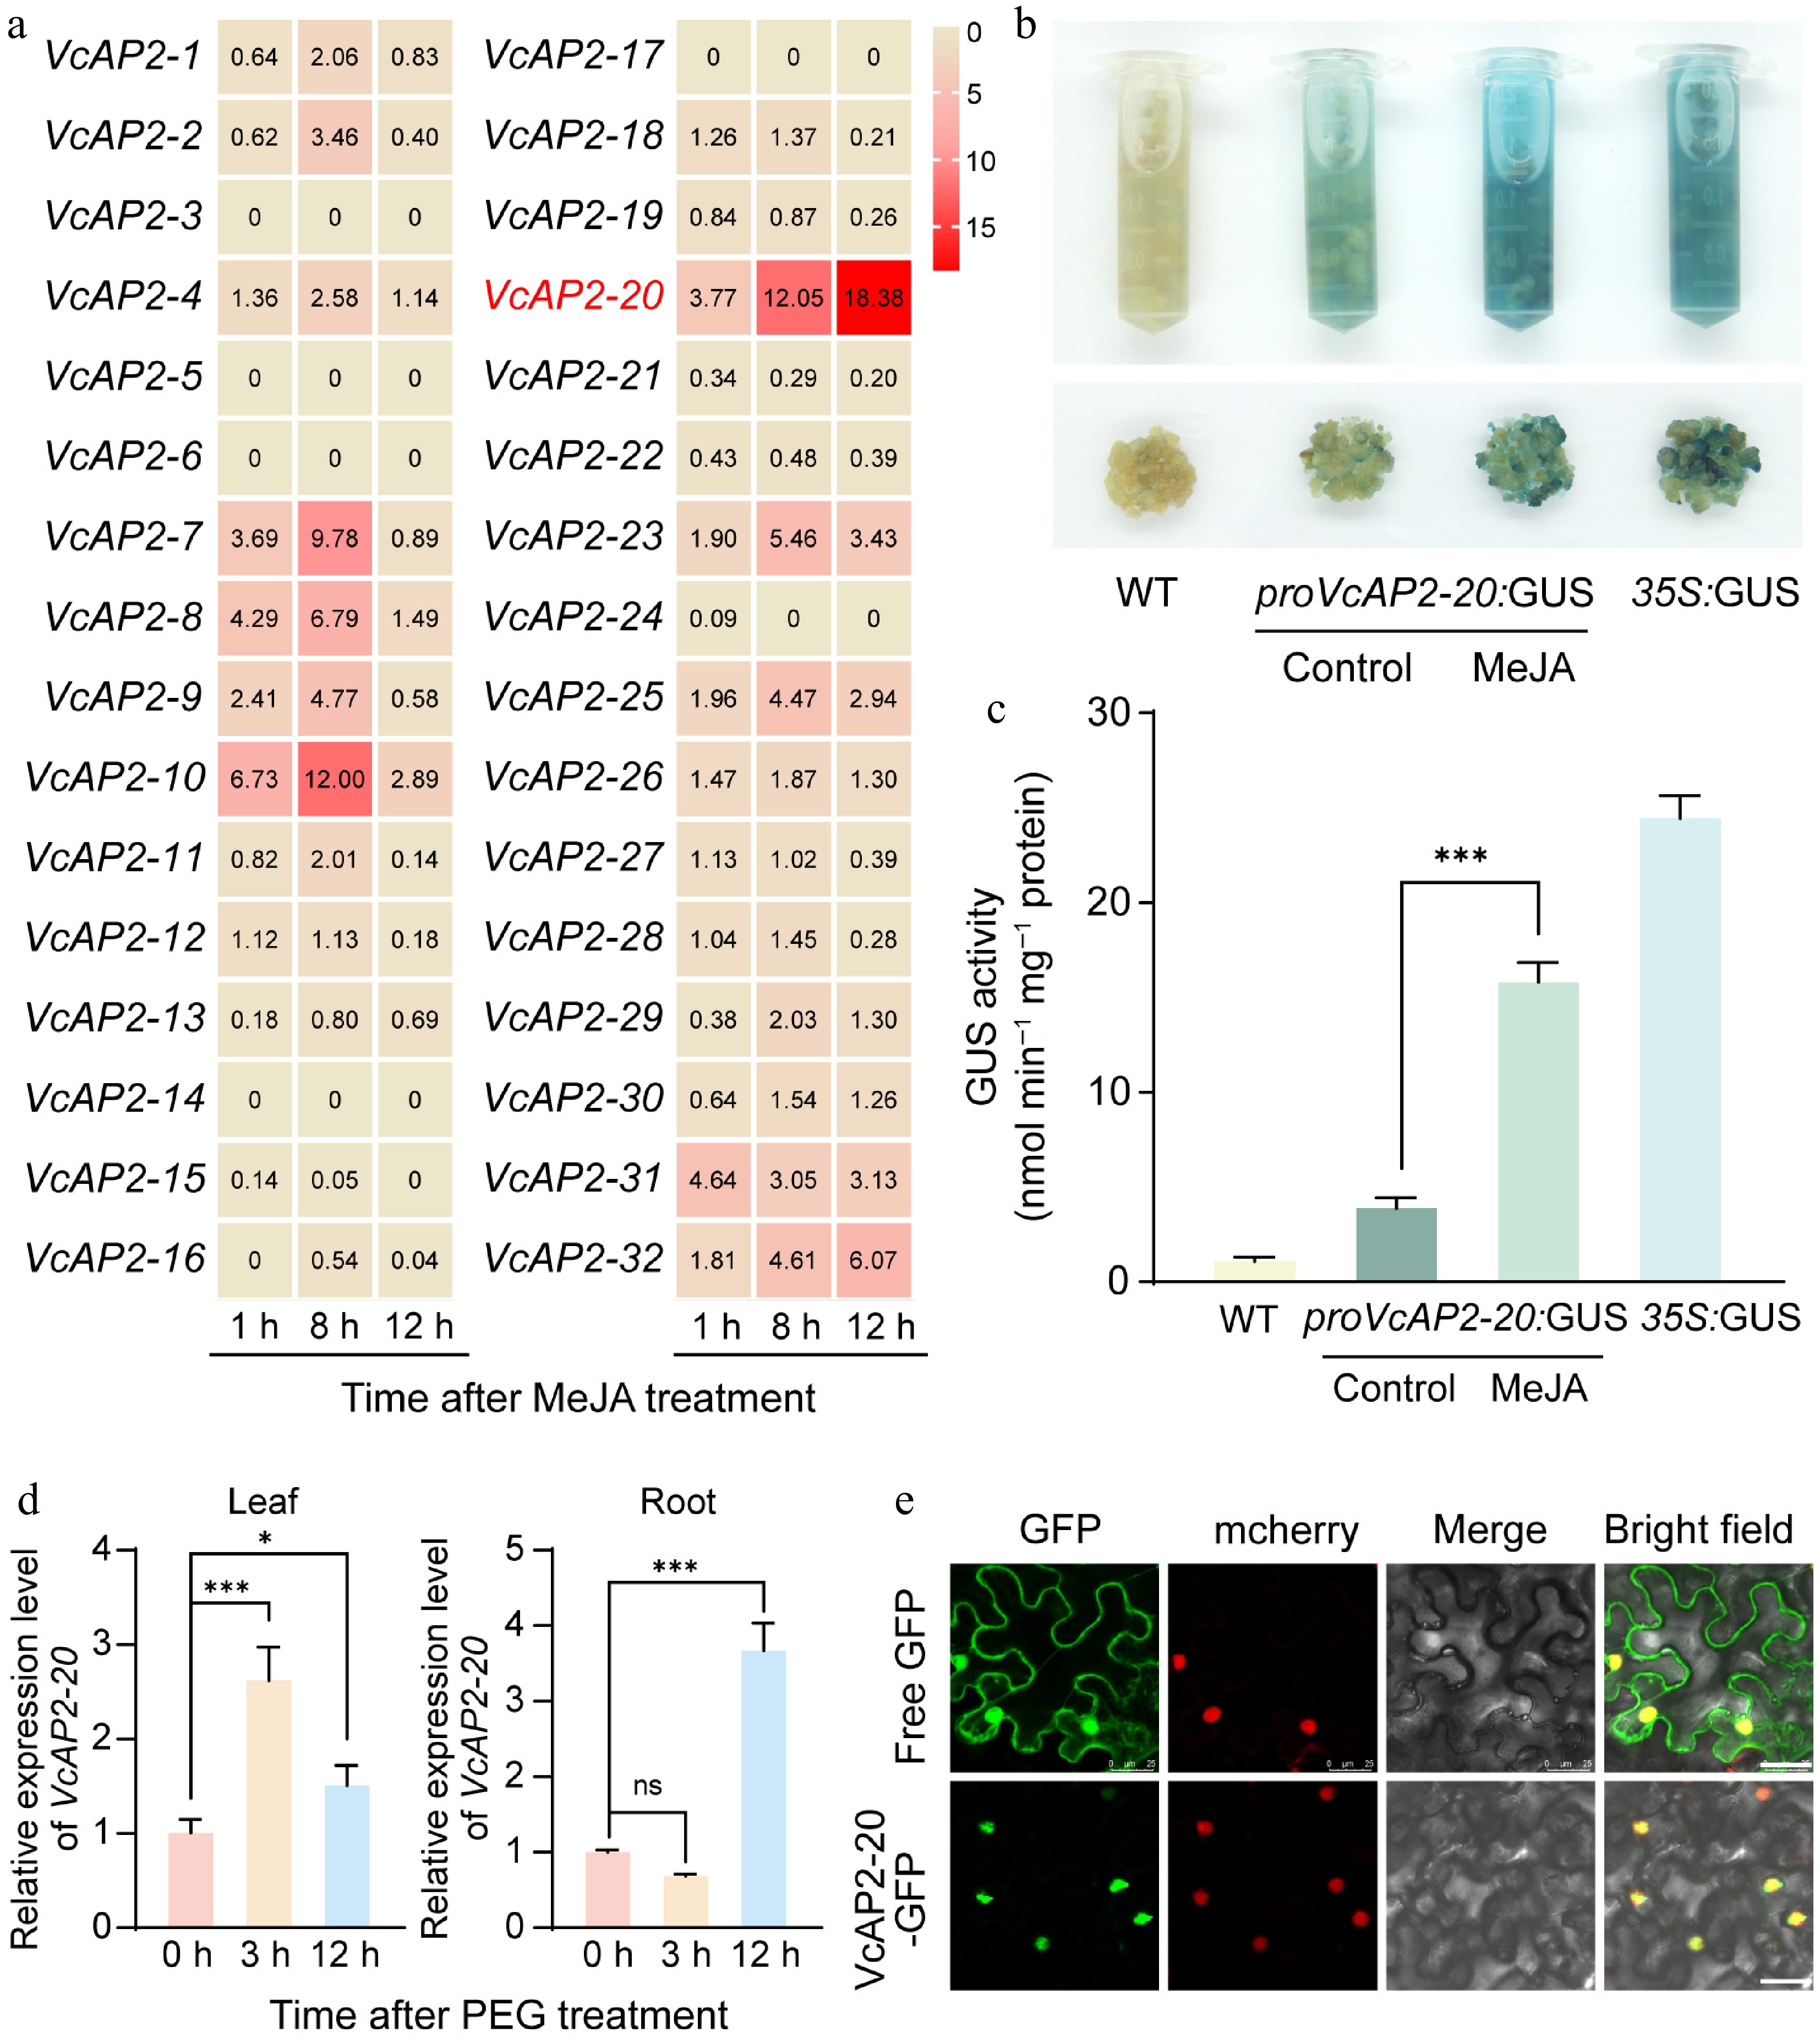
Figure 3.
VcAP2-20 expression is induced by methyl jasmonate (MeJA) treatment and drought stress. (a) Heatmap showing the expression profiles of VcAP2s in blueberry leaves under MeJA treatment. Transcriptome data were downloaded from GigaDB Dataset (
https://gigadb.org/dataset/100537 ). (b) Confirmation of 100 μM MeJA treatment enhanced the promoter activity of VcAP2-20 using the GUS staining in blueberry calli. Calli grown under normal conditions served as the control. (c) Bar charts showing the quantification of the GUS activity in (b). (d) RT-qPCR analysis of relative expression levels of VcAP2-20 in blueberry leaves and roots under drought stress simulated by 10% PEG6000. Values are presented as mean ± SD from three biological replicates. Statistical significance was determined by Student's t-test: * p < 0.05, ** p < 0.01, *** p < 0.001. (e) Subcellular localization of the 35S:VcAP2-20-GFP fusion protein in tobacco (Nicotiana benthamiana) leaf epidermal cells. The WRKY40-mCherry fusion protein served as a nuclear localization marker, while free GFP was used as the control. Scale bar = 25 μm. -
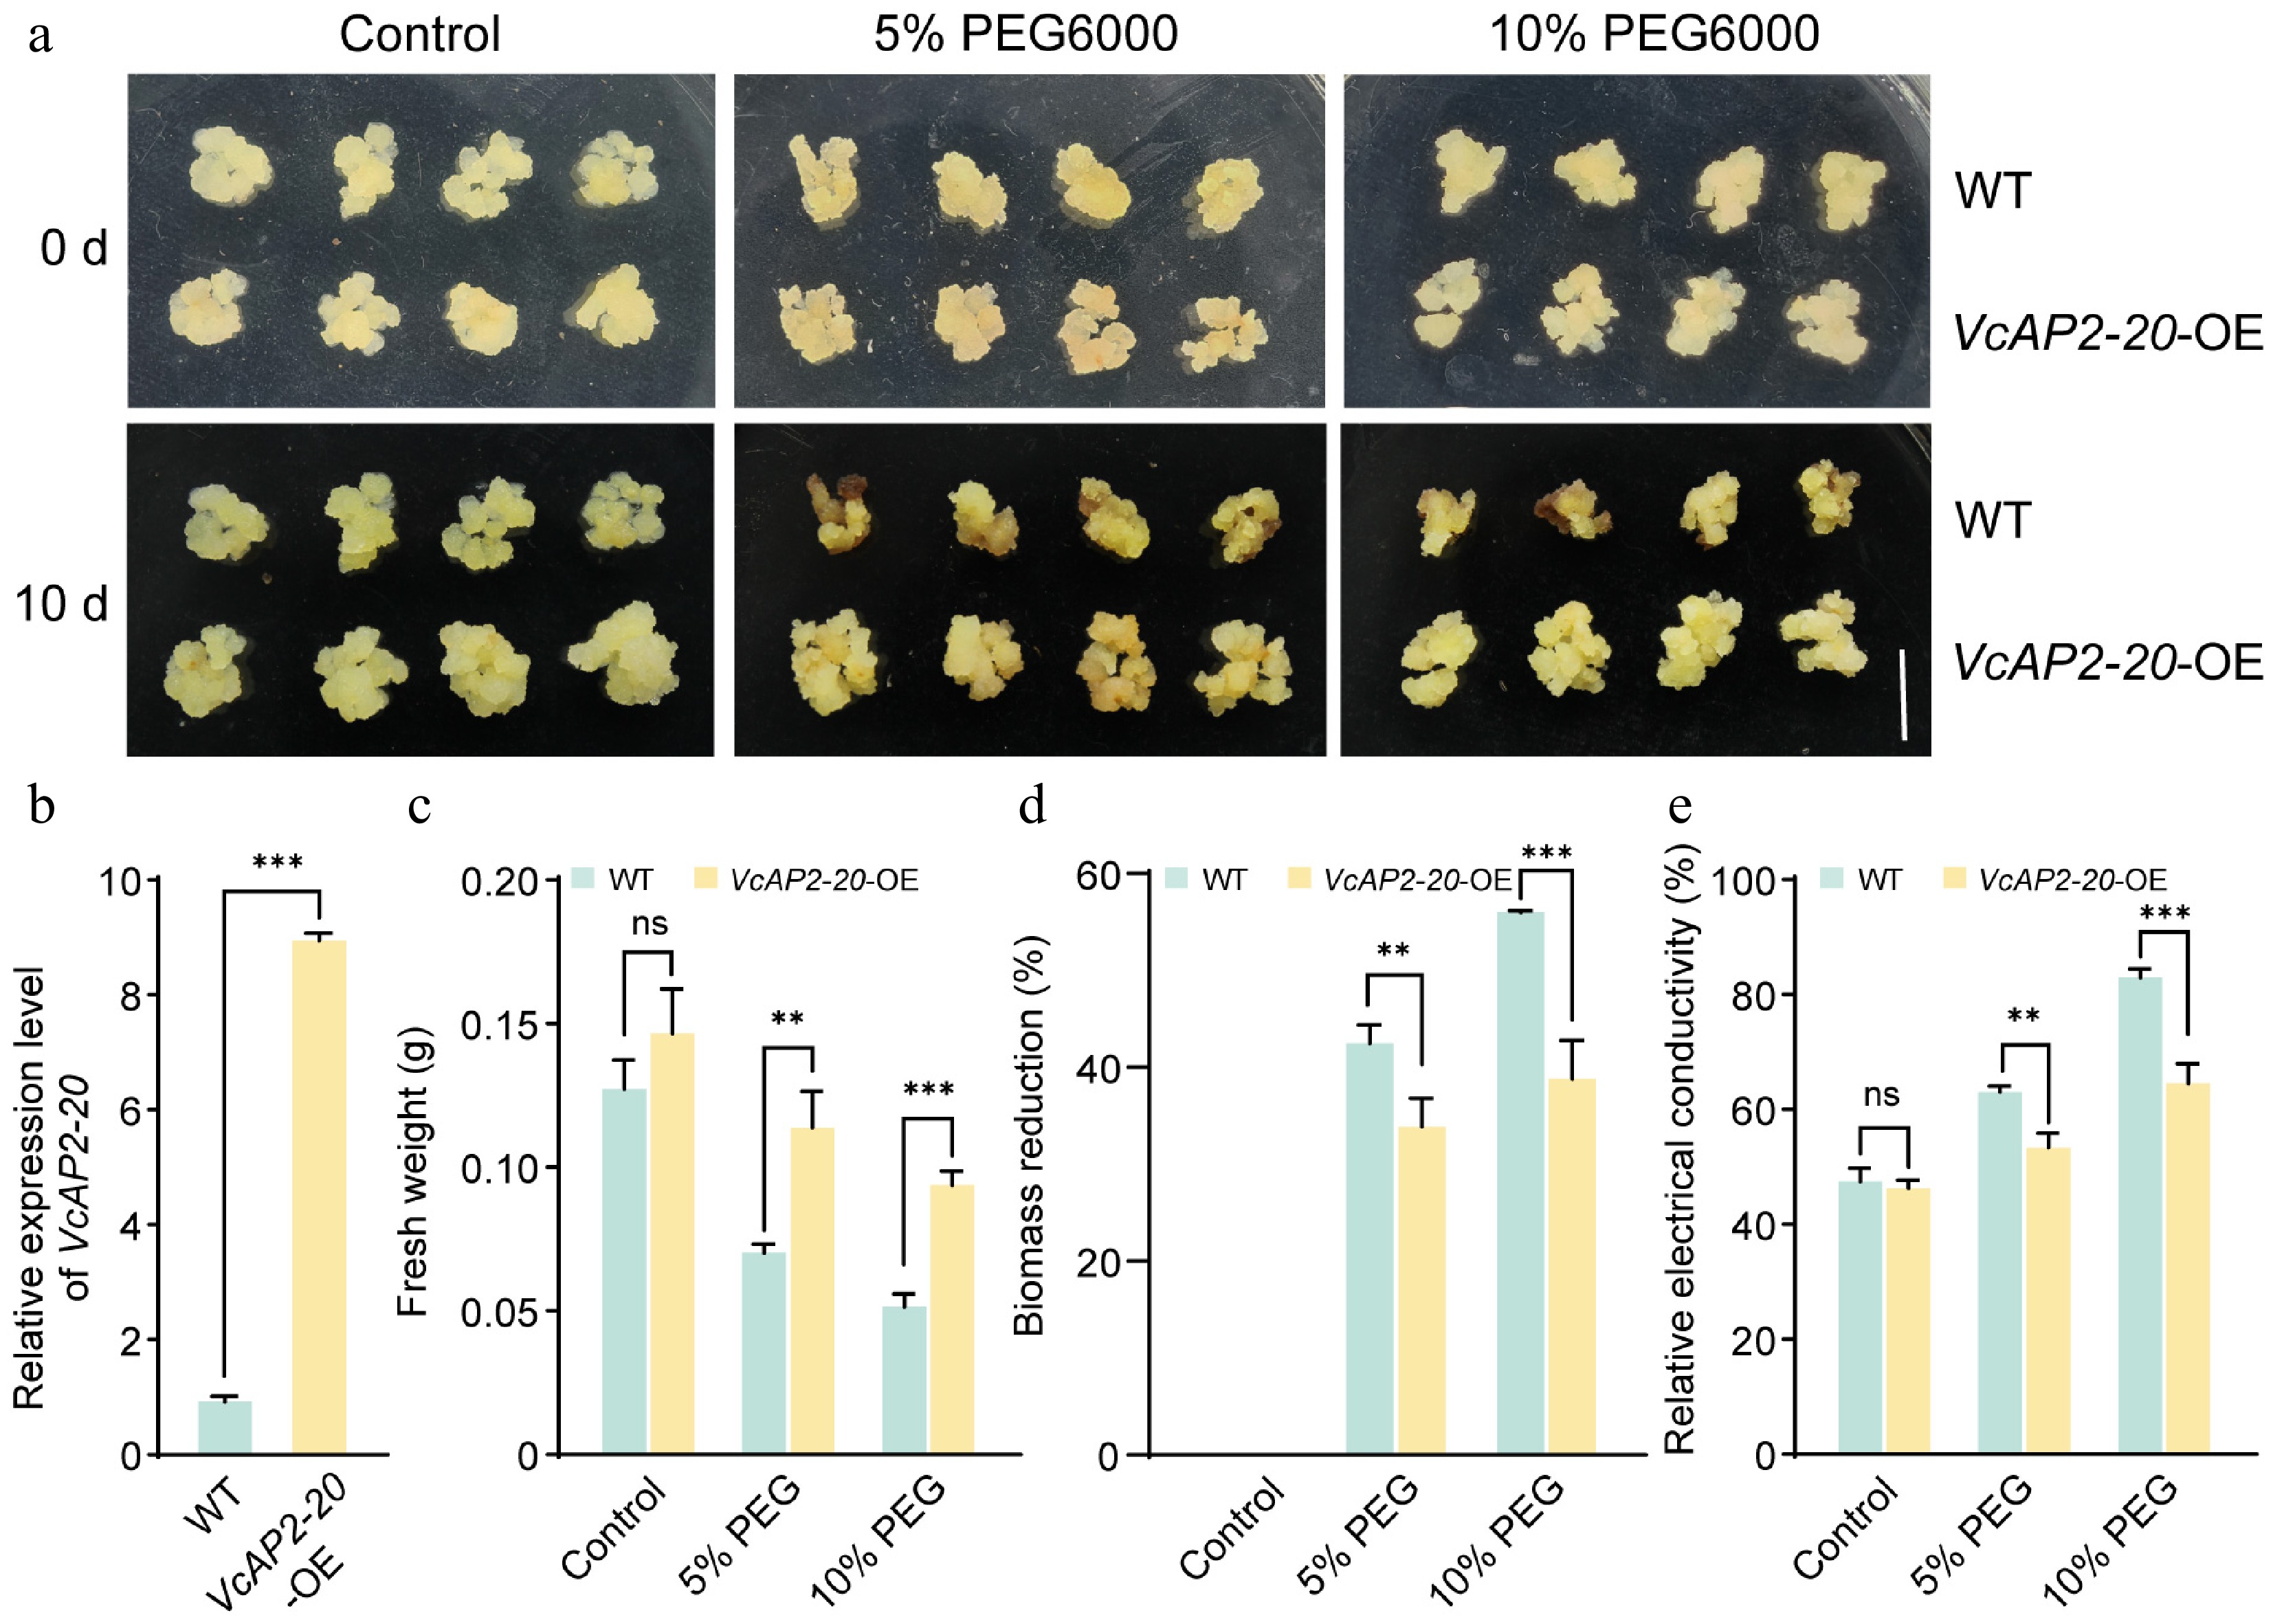
Figure 4.
Overexpression of VcAP2-20 enhances drought tolerance in blueberry calli. (a) Phenotypes of wild-type (WT), and VcAP2-20-overexpressing (VcAP2-20-OE) blueberry calli after 0 and 10 d of drought stress, simulated by 5% or 10% PEG6000. Calli grown under normal conditions served as controls. Scale bar = 1 cm. (b) RT-qPCR analysis of relative expression levels of VcAP2-20 in WT and VcAP2-20-OE blueberry calli. Physiological indices of WT and VcAP2-20-OE calli under drought stress: (c) fresh weight, (d) biomass reduction, and (e) relative electrical conductivity. Values are presented as mean ± SD from three biological replicates. Statistical significance was determined by Student's t-test: * p < 0.05, ** p < 0.01, *** p < 0.001.
-
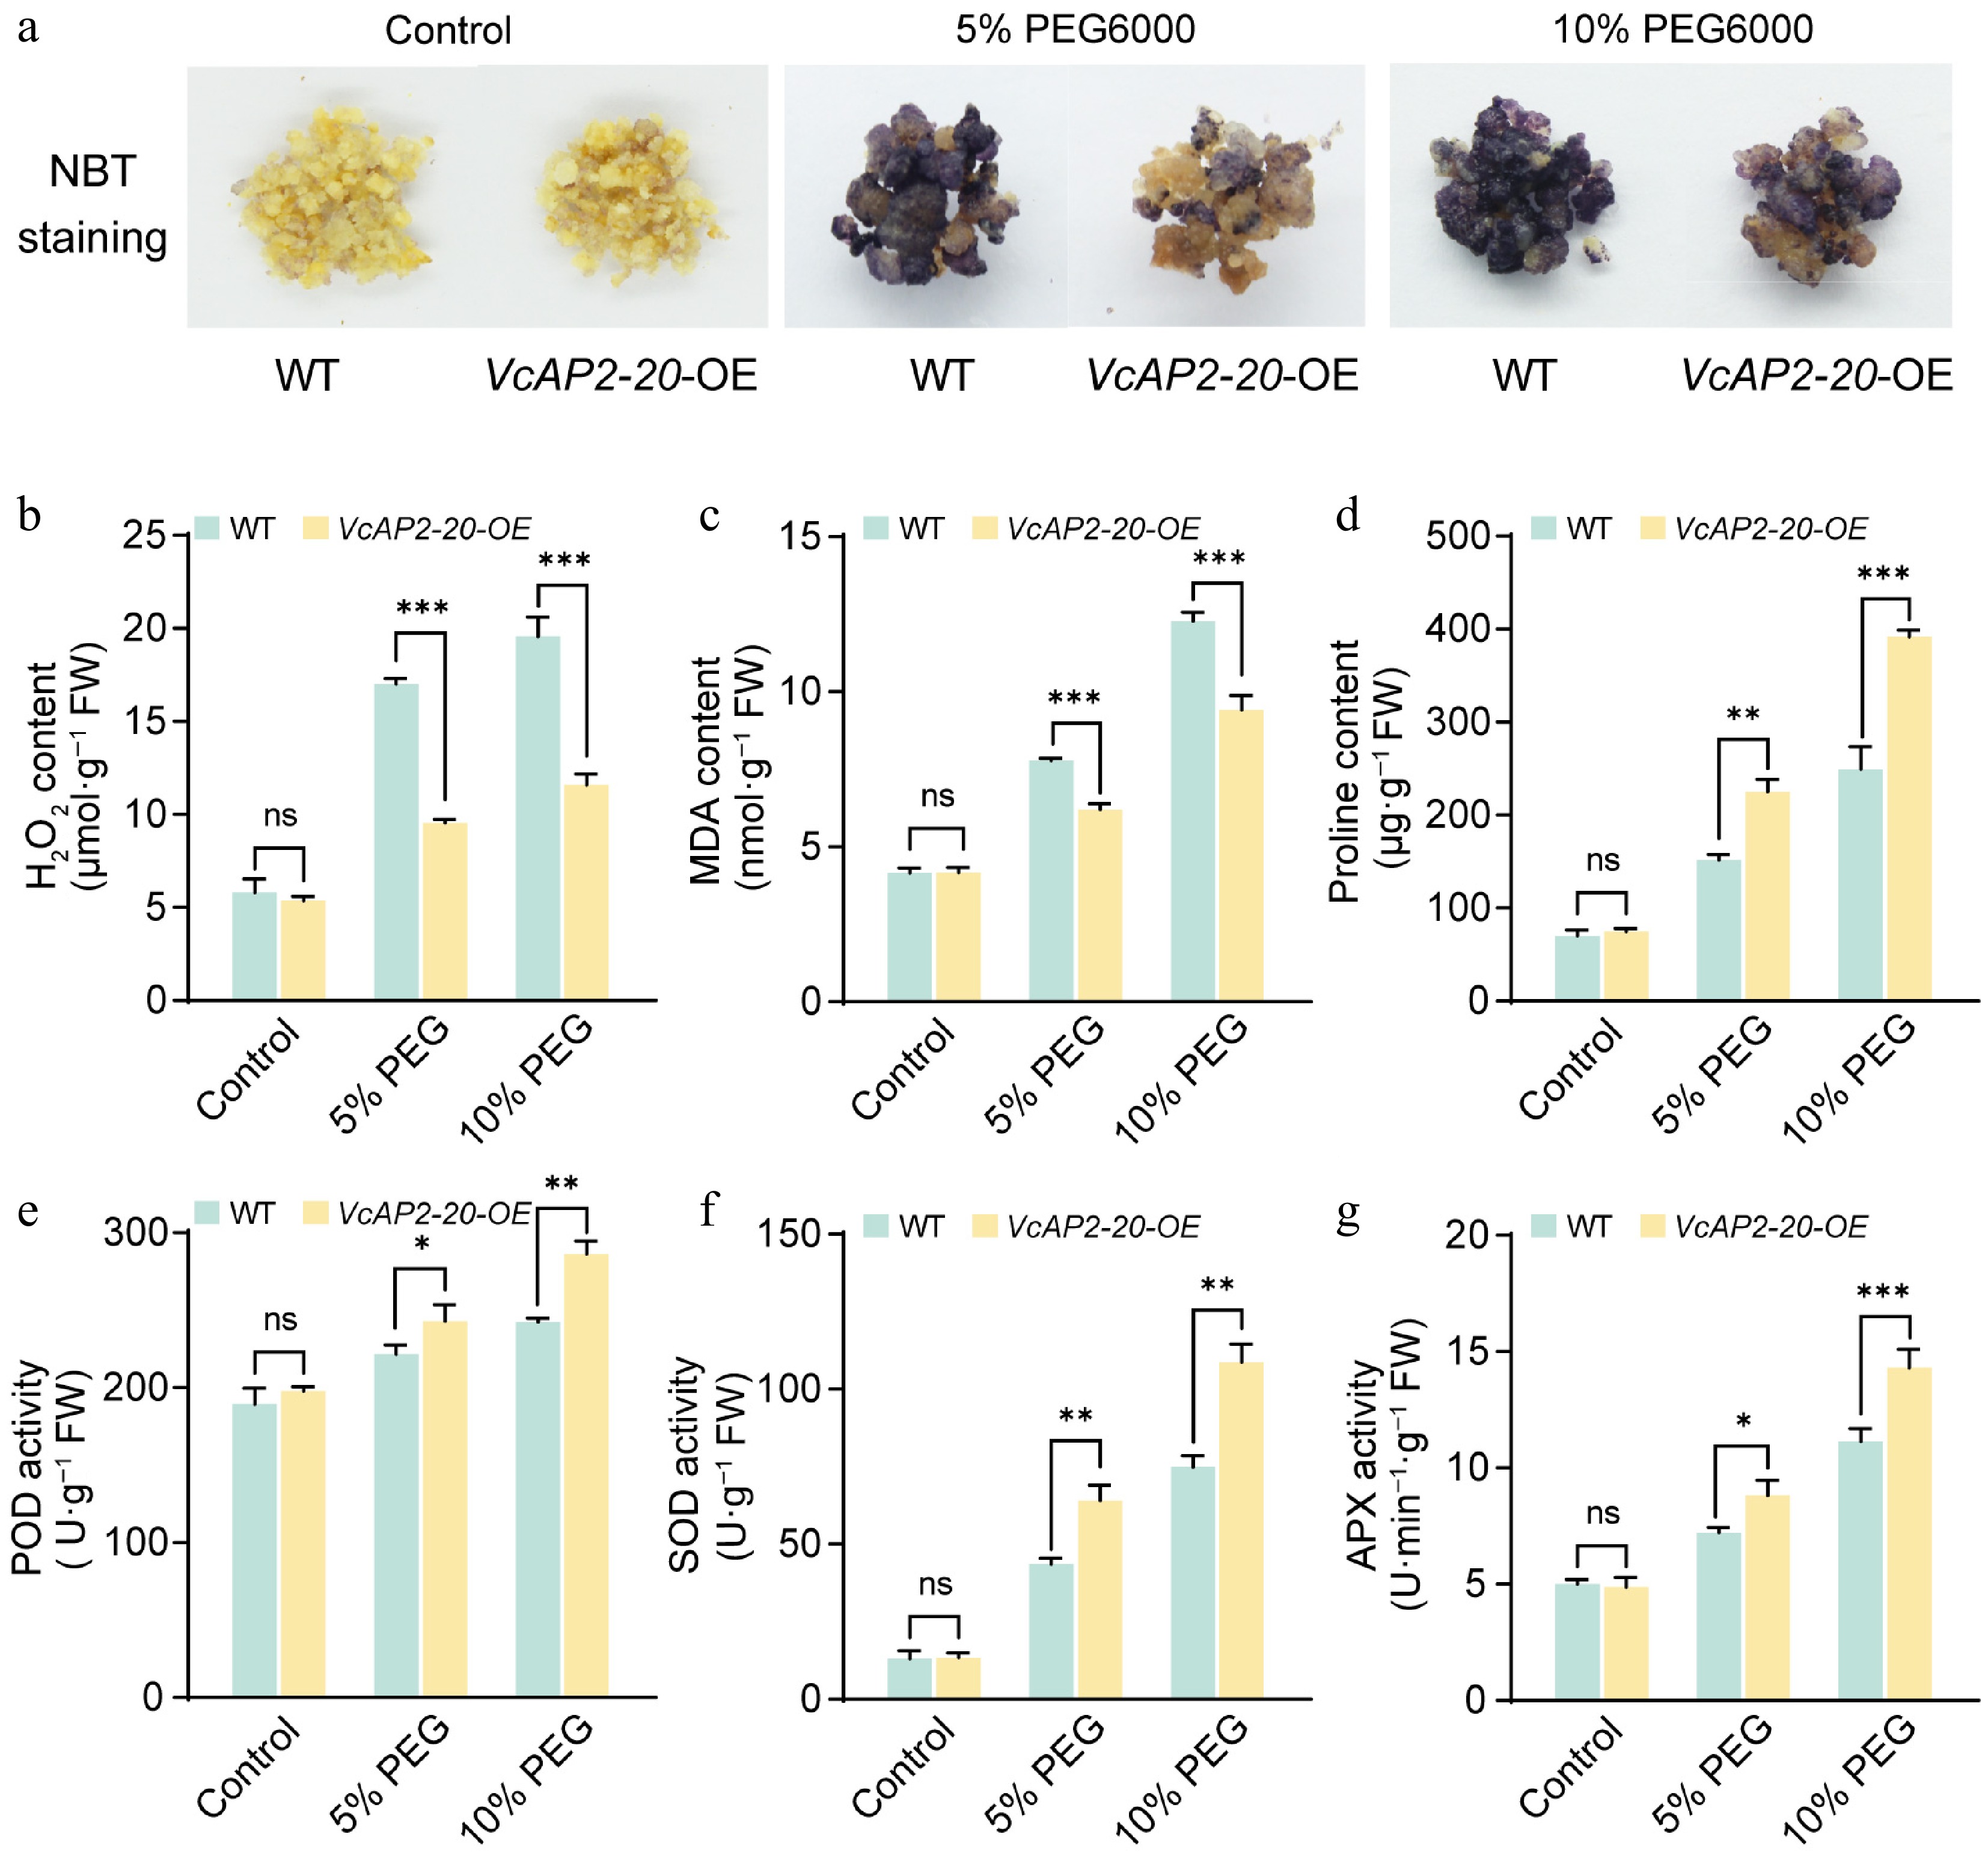
Figure 5.
Overexpression of VcAP2-20 enhances reactive oxygen species (ROS) scavenging in blueberry calli. (a) NBT staining indicating superoxide accumulation in wild-type (WT) and VcAP2-20-overexpressing (VcAP2-20-OE) blueberry calli after 10-d treatment with 5% or 10% PEG6000. Untreated calli under normal conditions served as controls. Contents of (b) H2O2, (c) malondialdehyde (MDA), and (d) proline, as well as activities of antioxidant enzymes; (e) peroxidase (POD), (f) superoxide dismutase (SOD), and (g) ascorbate peroxidase (APX) in WT and VcAP2-20-OE blueberry calli following the same treatments. FW, fresh weight. Values are presented as mean ± SD from three biological replicates. Statistical significance was determined by Student's t-test: * p < 0.05, ** p < 0.01, *** p < 0.001.
-
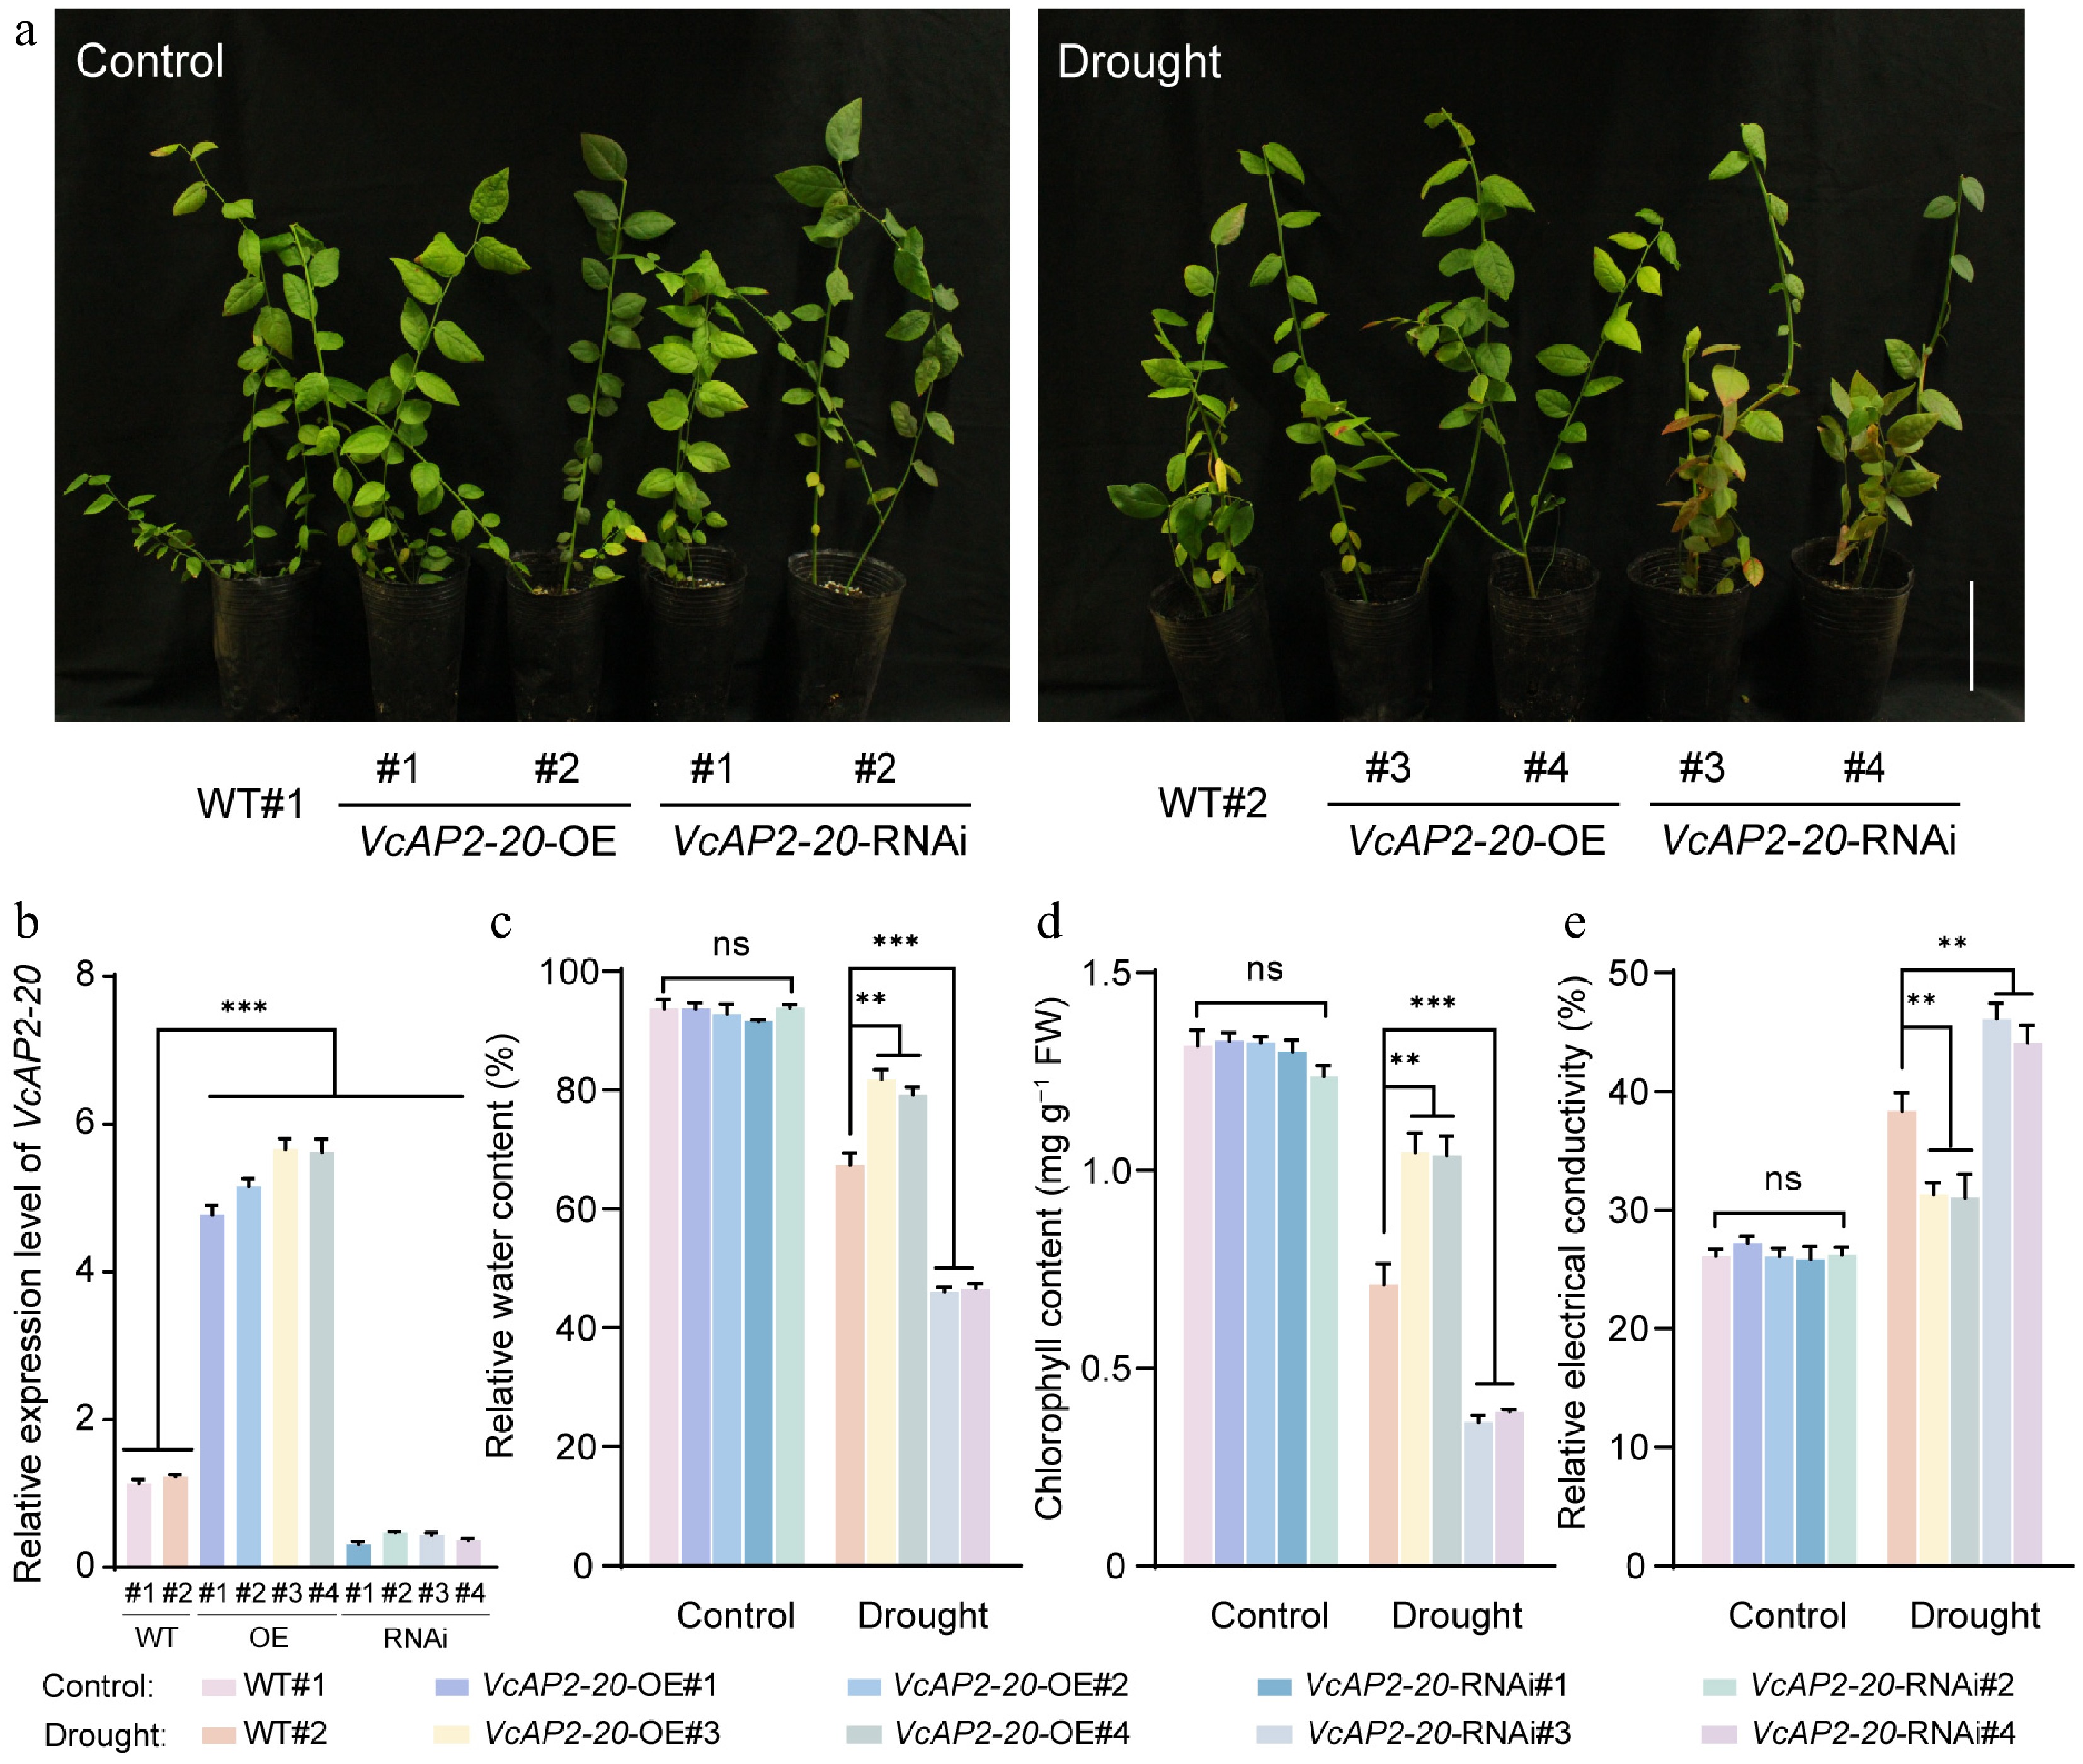
Figure 6.
VcAP2-20 promotes drought tolerance in blueberry seedlings. (a) Phenotypes of wild-type (WT) and transgenic blueberry seedlings after 25 d of natural drought treatment, with normally watered plants serving as controls. VcAP2-20-OE: VcAP2-20-overexpression line; VcAP2-20-RNAi: RNA interference-mediated VcAP2-20 suppression line. Scale bar = 10 cm. (b) RT-qPCR analysis of relative expression levels of VcAP2-20 in WT and transgenic blueberry seedlings. Physiological parameters of seedlings under drought stress; (c) relative water content, (d) chlorophyll content, and (e) relative electrical conductivity. Values are presented as mean ± SD from three biological replicates. Statistical significance was determined by Student's t-test: * p < 0.05, ** p < 0.01, *** p < 0.001.
-
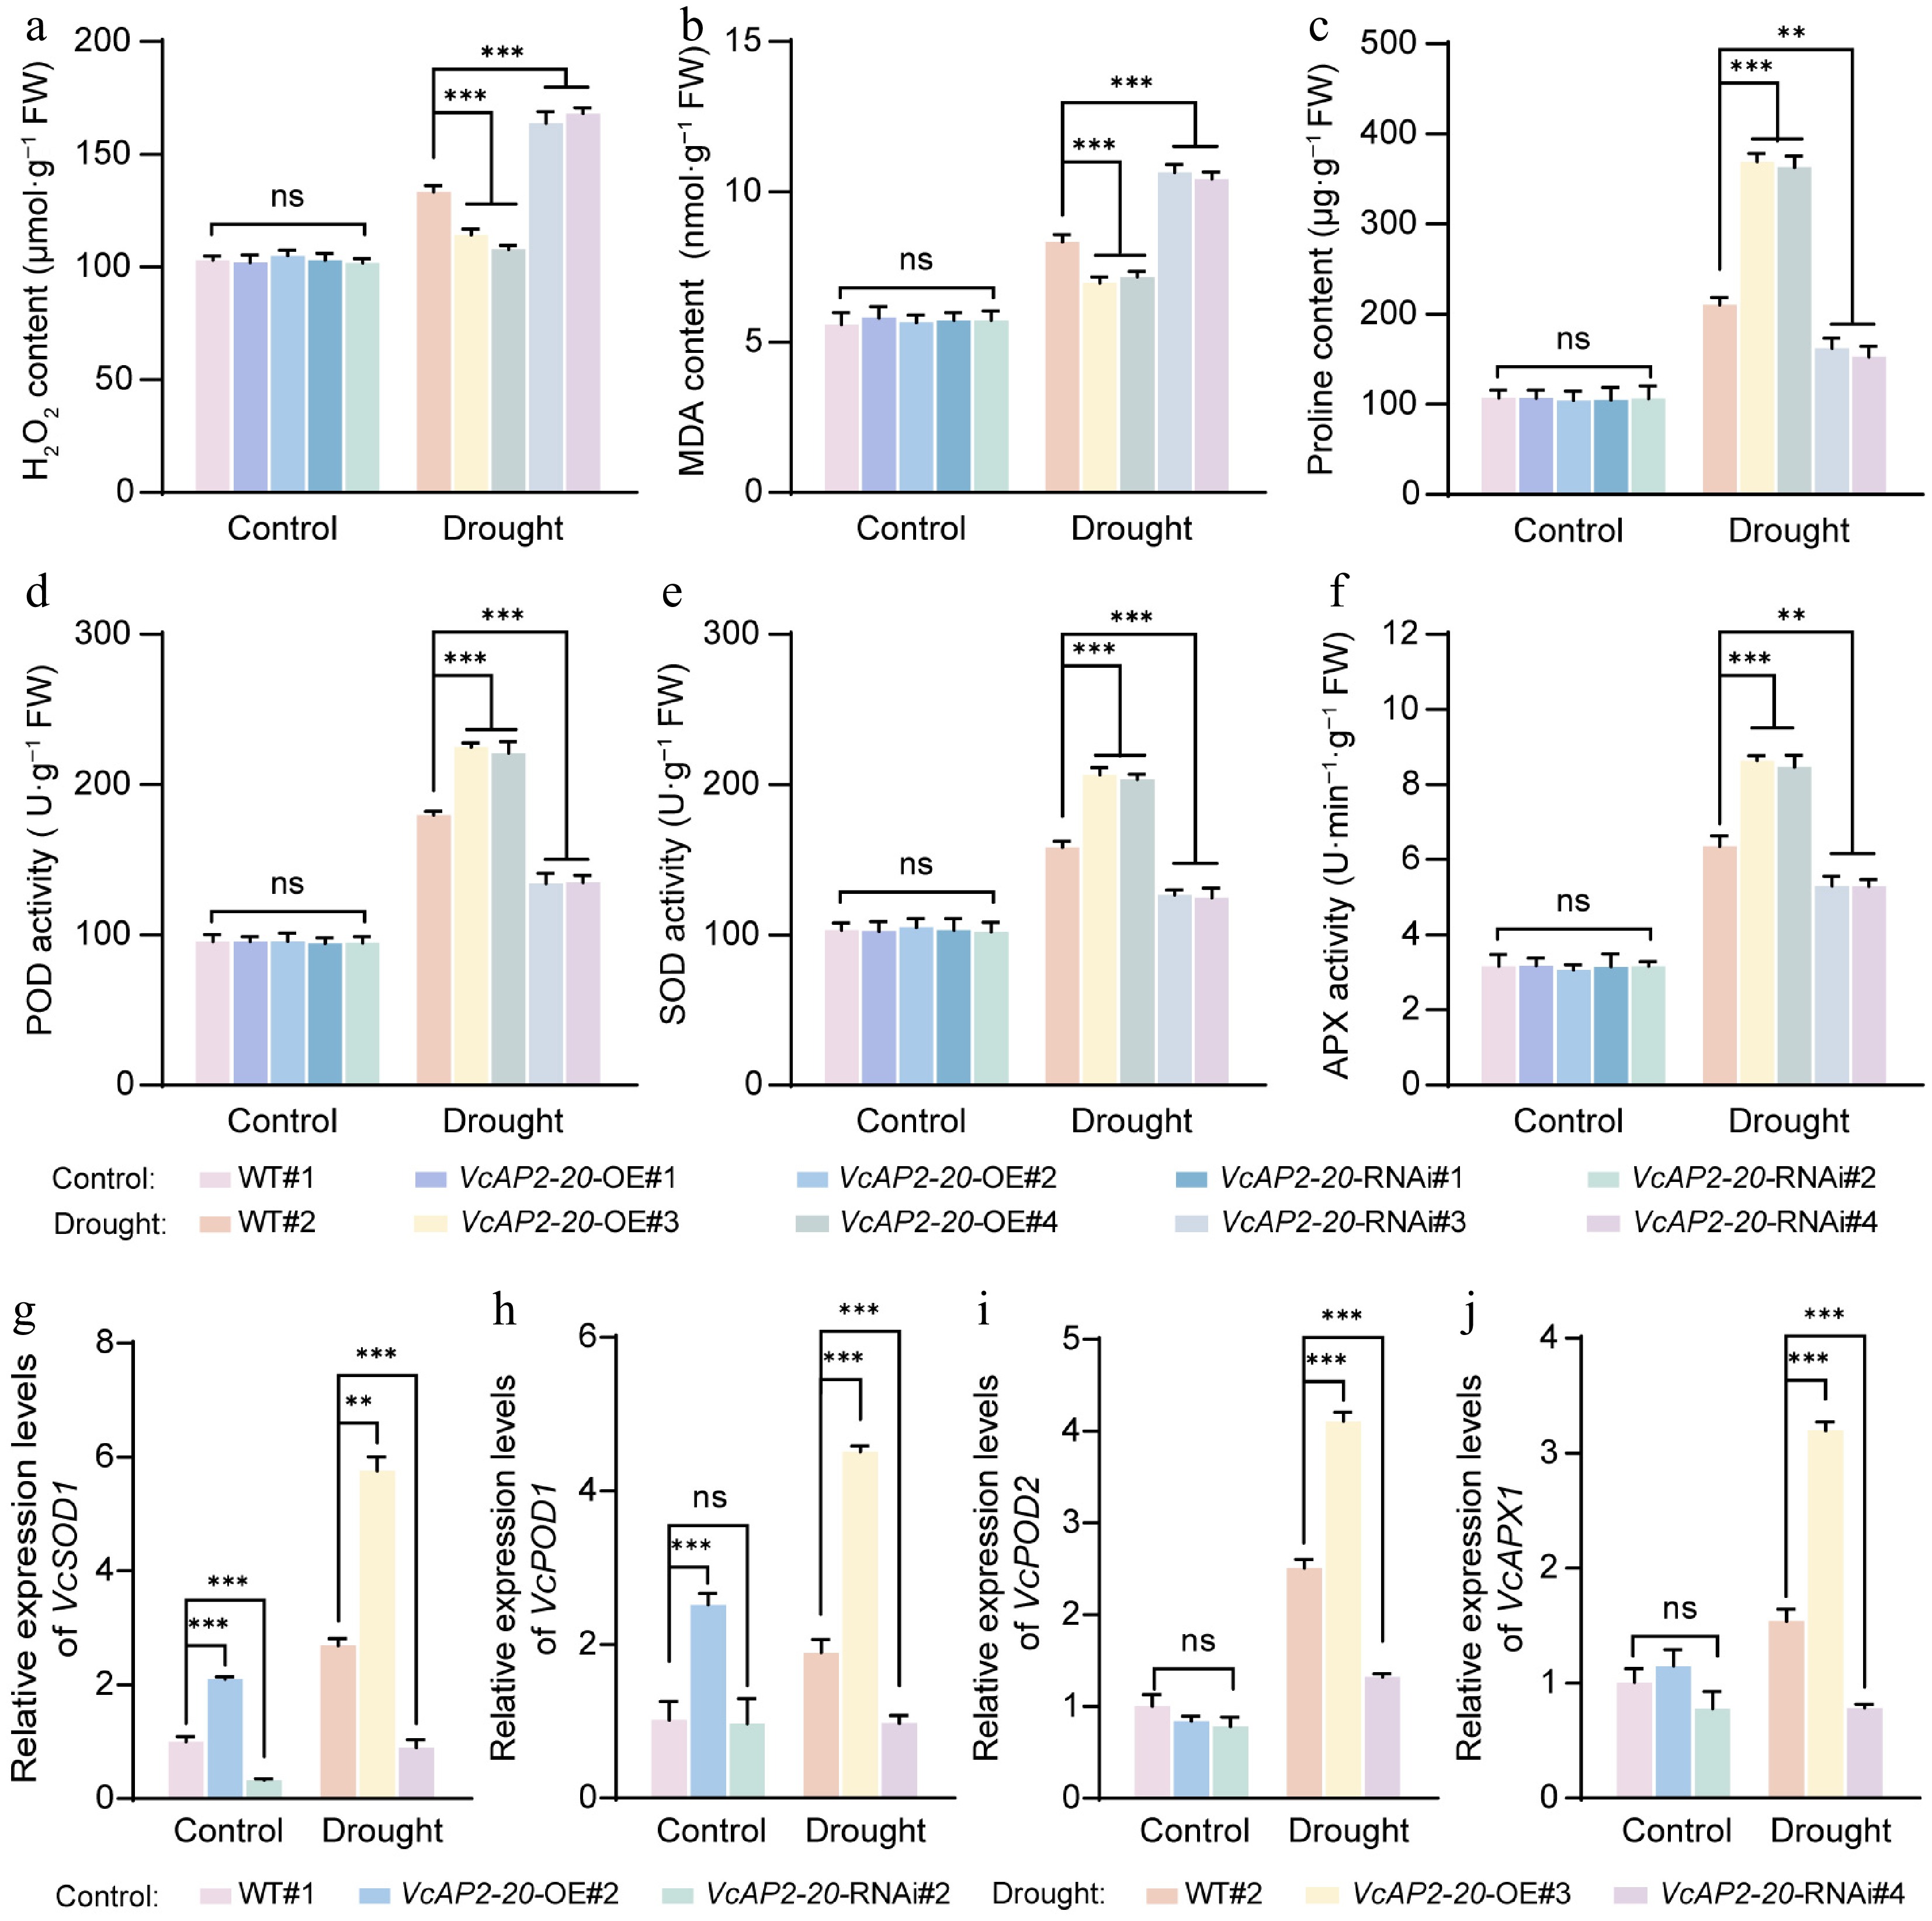
Figure 7.
VcAP2-20 enhances ROS scavenging capacity by activating drought-responsive genes. Contents of (a) H2O2, (b) MDA, and (c) proline, as well as activities of antioxidant enzymes; (d) POD, (e) SOD, and (f) APX in WT and transgenic blueberry seedlings following the same treatments. FW, fresh weight. (g)−(j) RT-qPCR analysis of antioxidant gene expression in leaves; (g) VcSOD1, (h) VcPOD1, (i) VcPOD2, and (j) VcAPX1. Values are presented as mean ± SD from three biological replicates. Statistical significance was determined by Student's t-test: * p < 0.05, ** p < 0.01, *** p < 0.001.
Figures
(7)
Tables
(0)