-
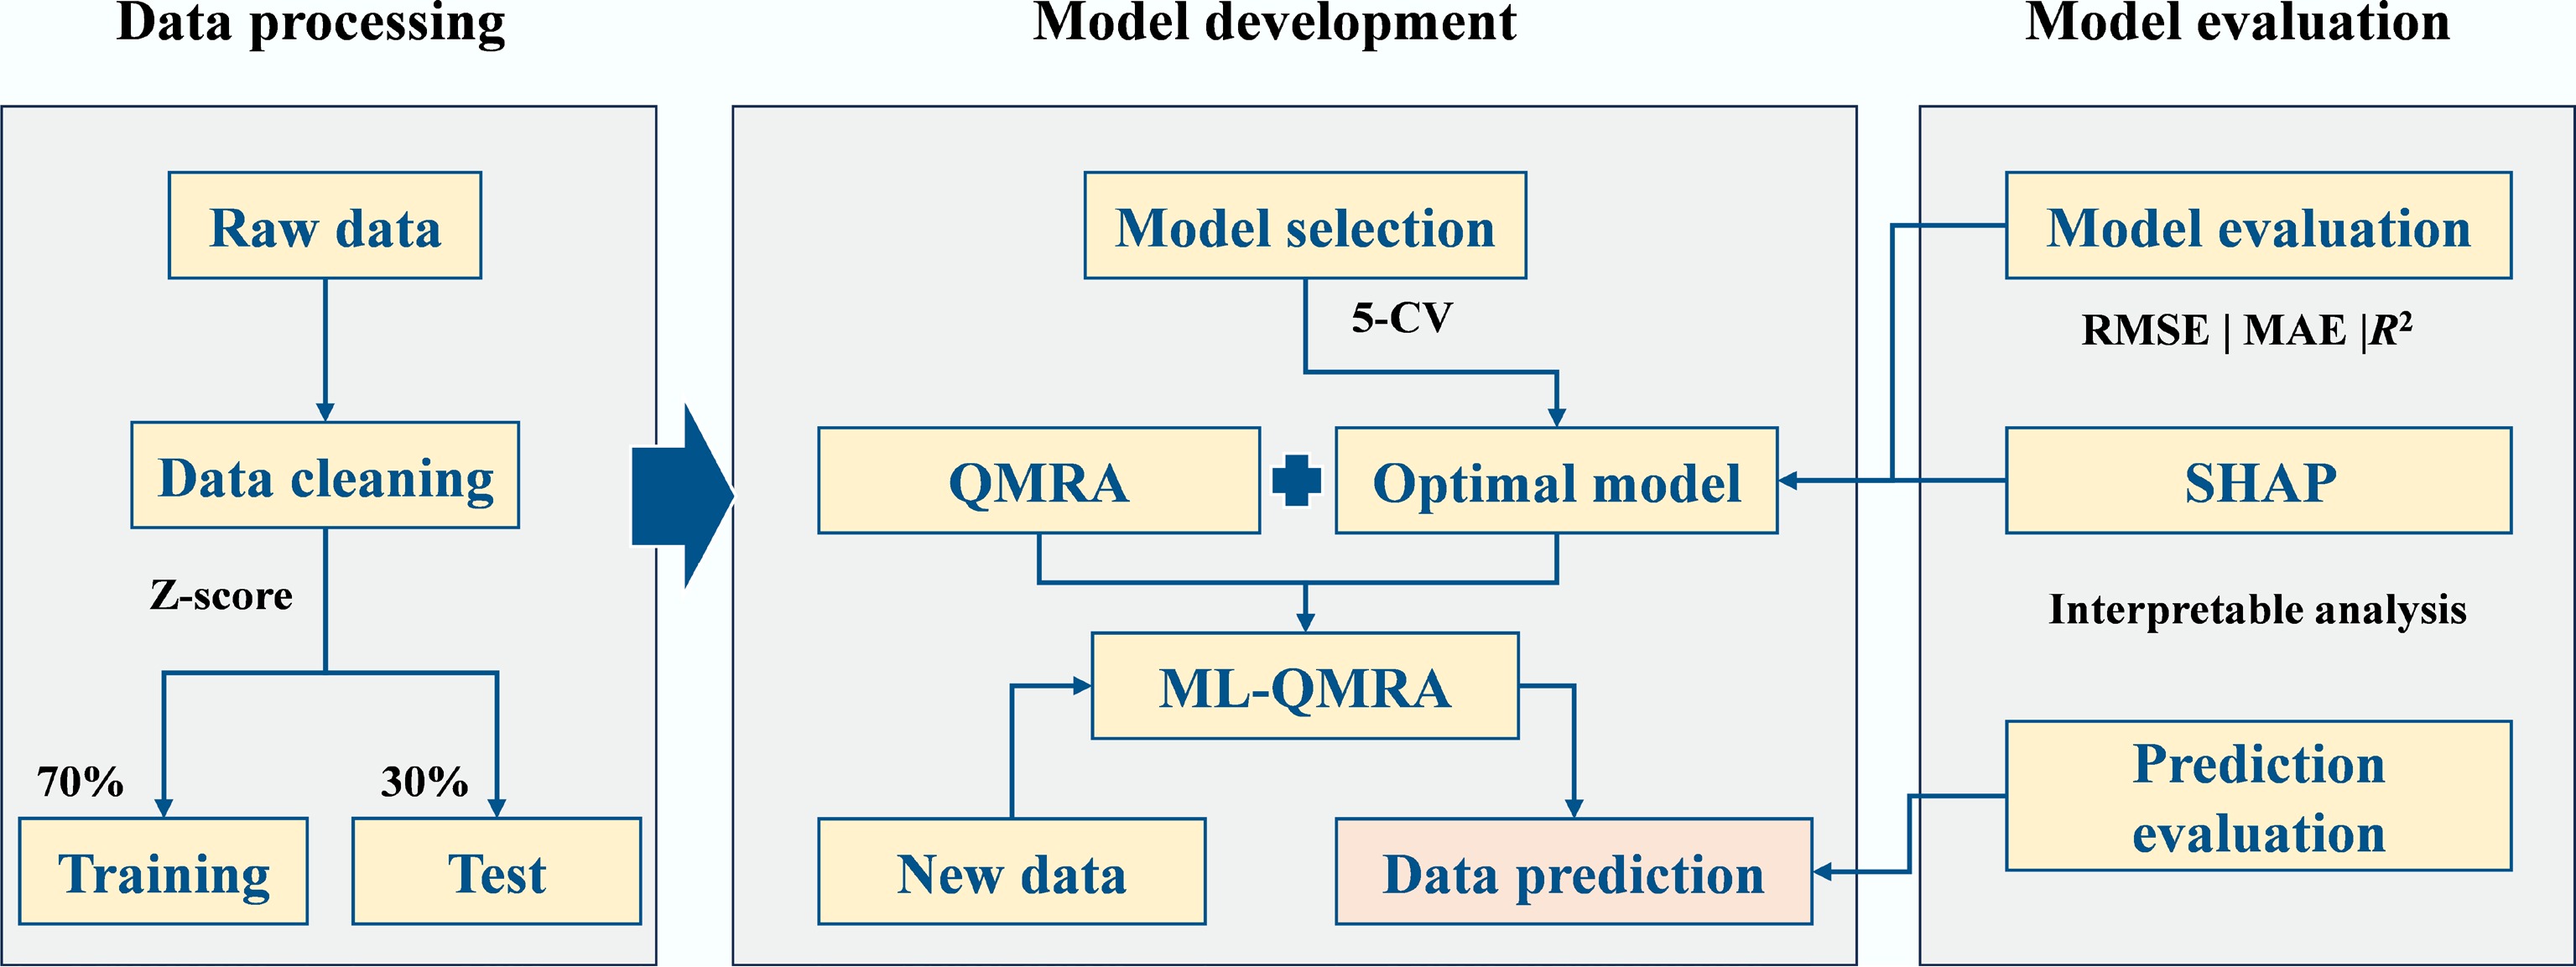
Figure 1.
Flowchart of data processing and model development.
-
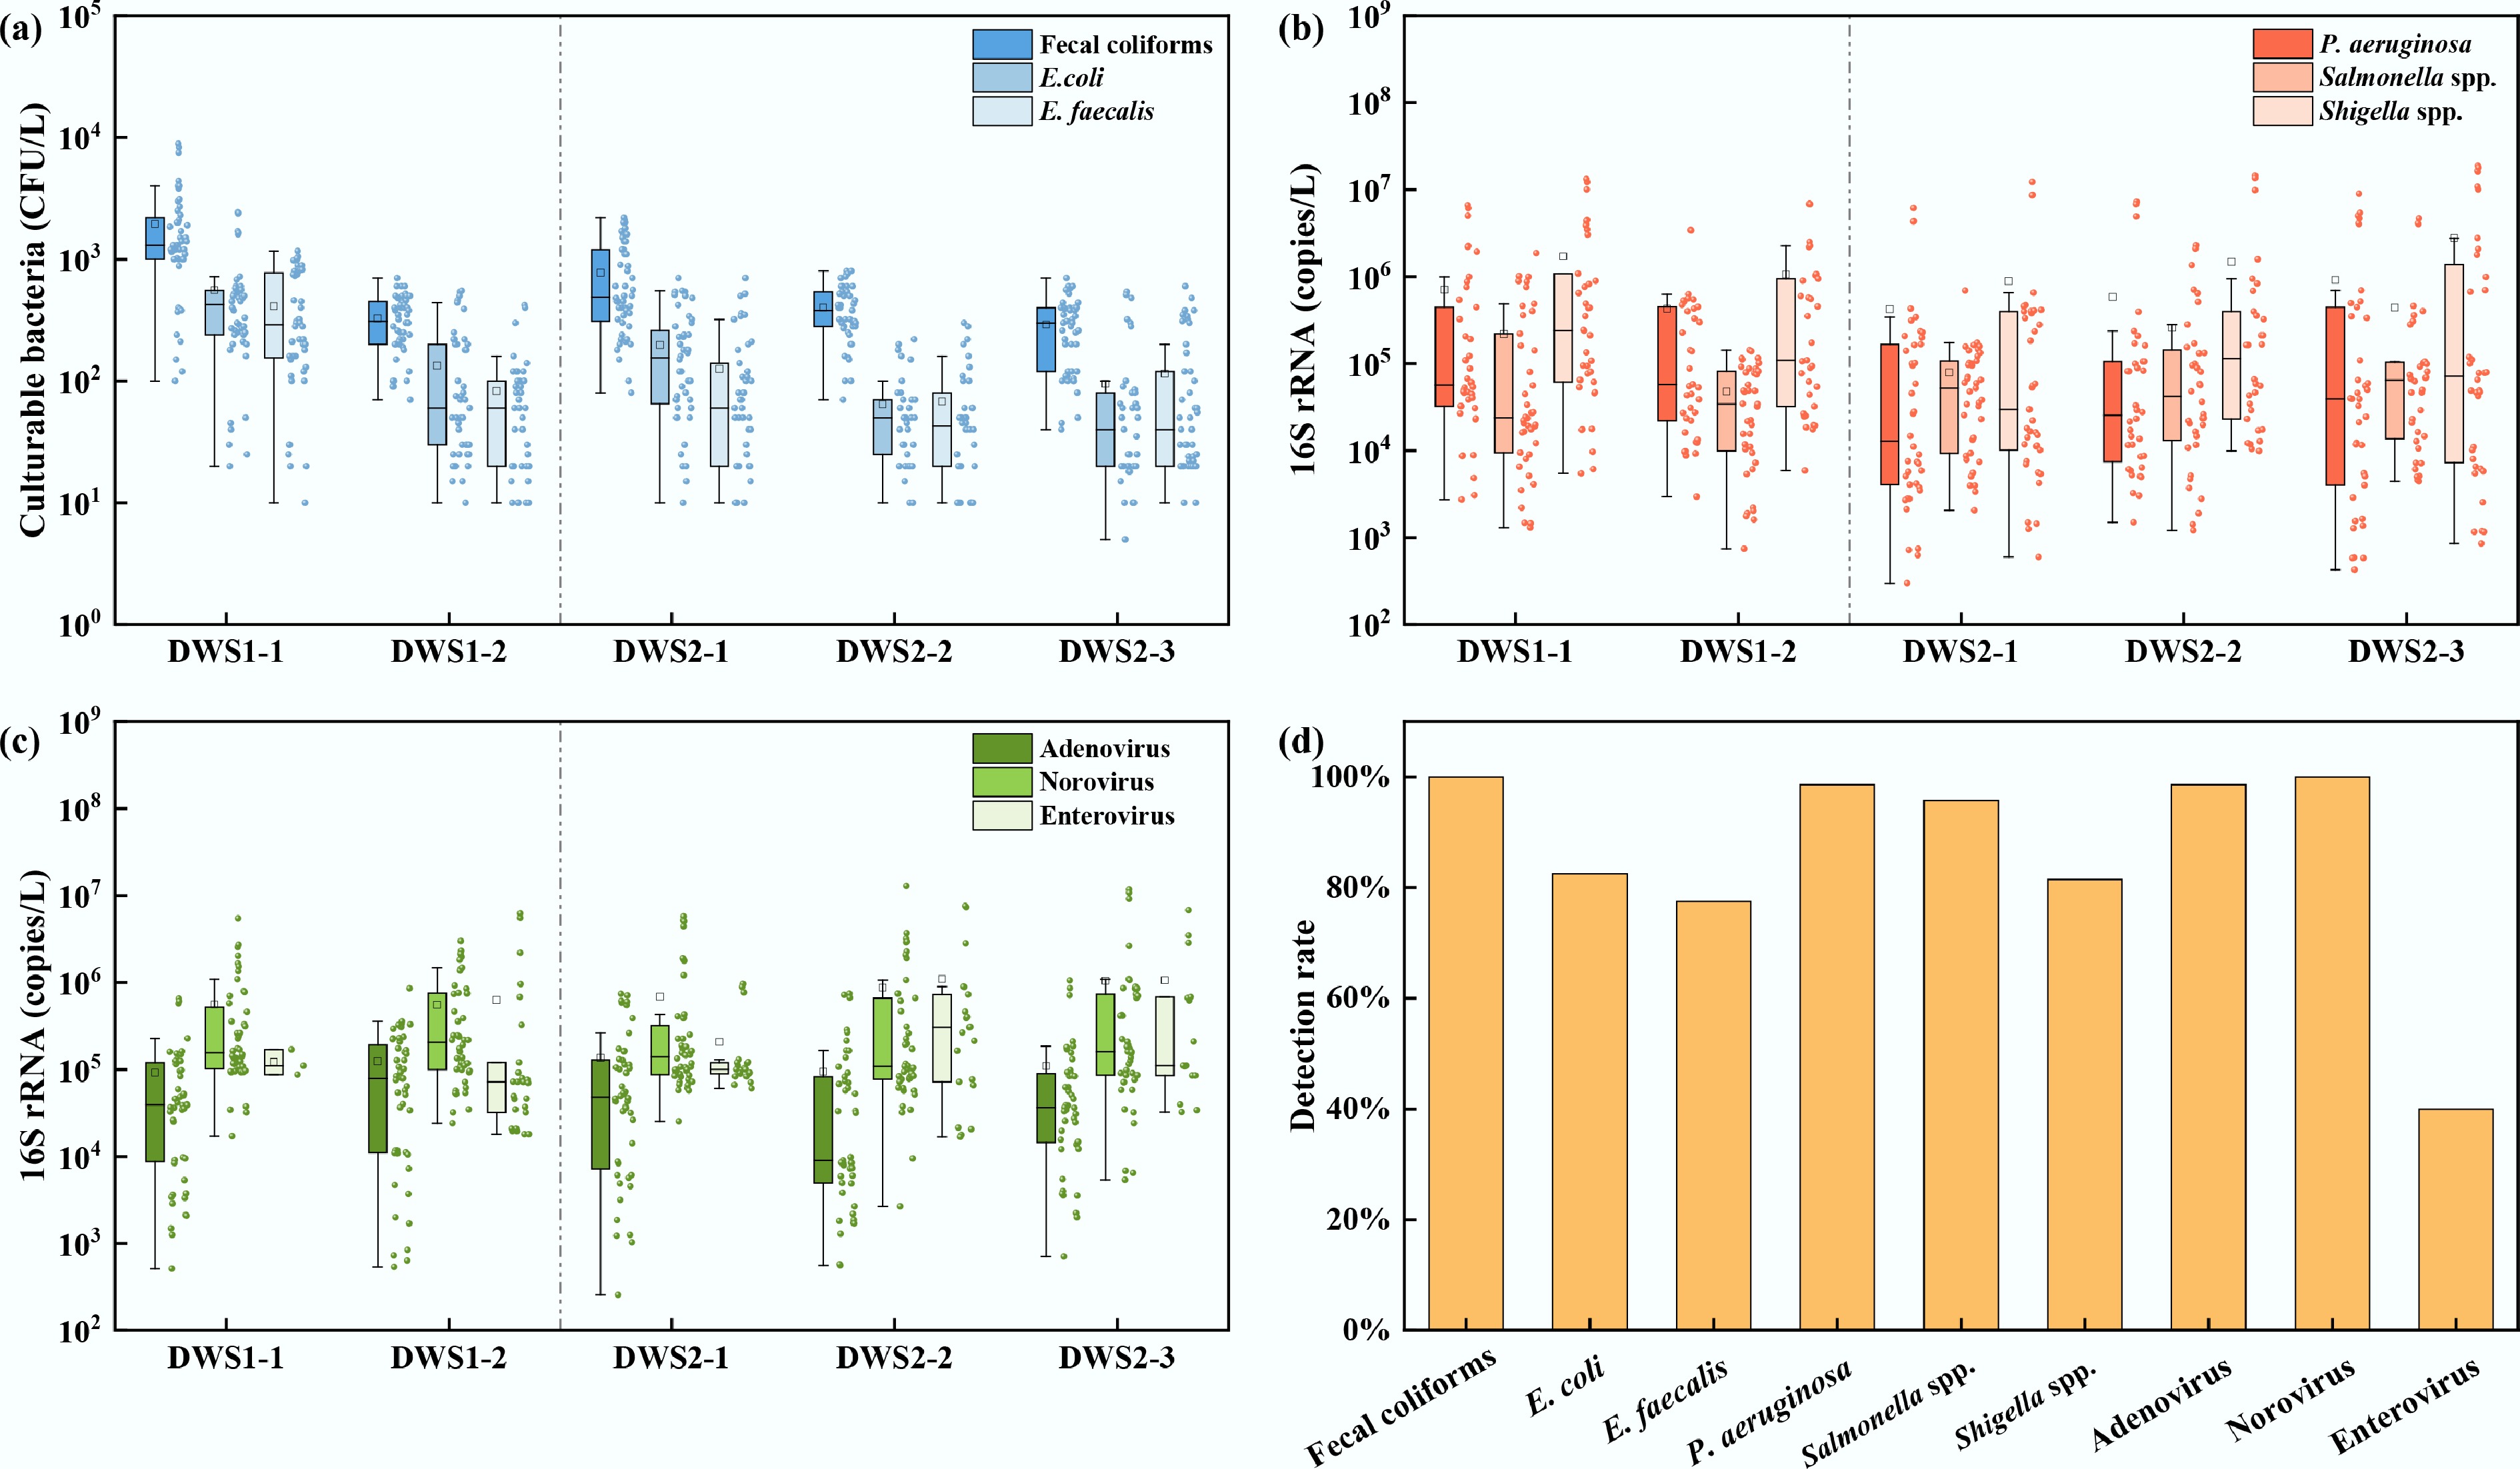
Figure 2.
Microbial distributions at DWS1 and DWS2. (a) Indicator bacteria: fecal coliforms, E. coli, and E. faecalis. (b) Pathogenic bacteria: P. aeruginosa, Salmonella spp., Shigella spp. (c) Viruses: Adenovirus, Norovirus, Enterovirus; and (d) detection frequency (%).
-
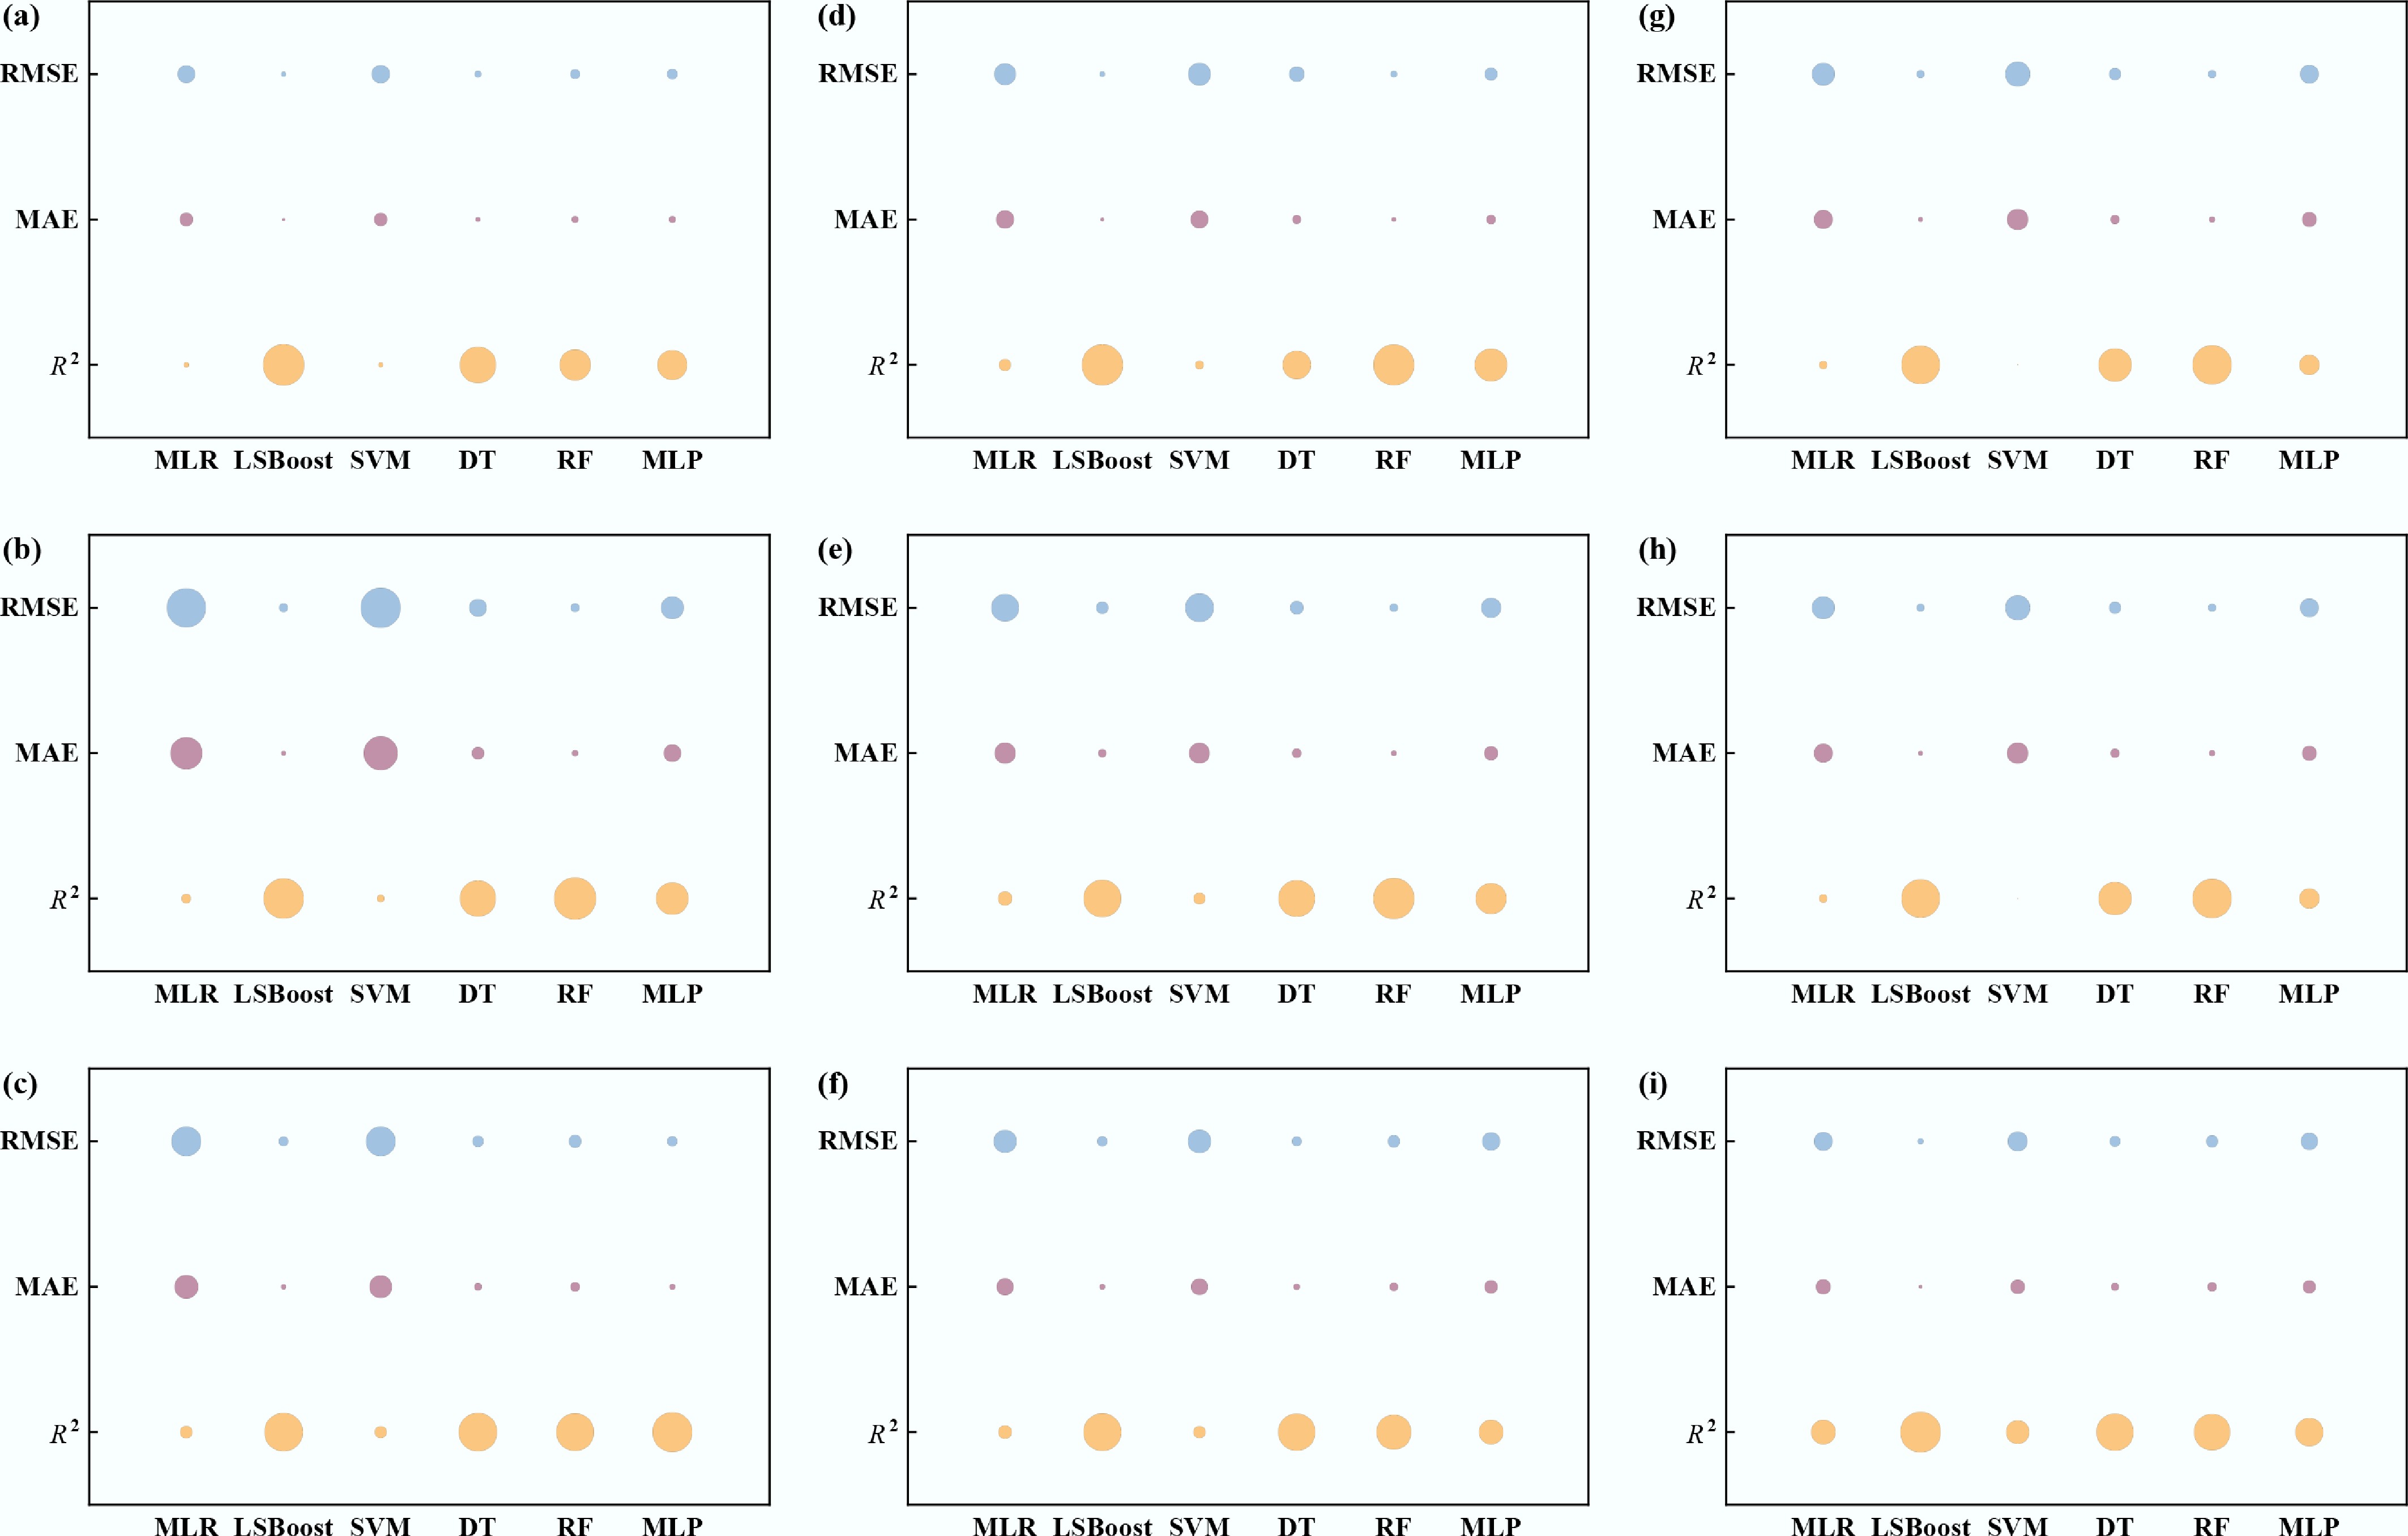
Figure 3.
Performance comparison of six machine learning models on test sets using bubble charts. (a) Fecal coliforms, (b) E. coli, (c) E. faecalis, (d) P. aeruginosa, (e) Salmonella spp., (f) Shigella spp., (g) Adenovirus, (h) Norovirus, and (i) Enterovirus. (Higher R2 and lower MAE/RMSE indicate better performance).
-
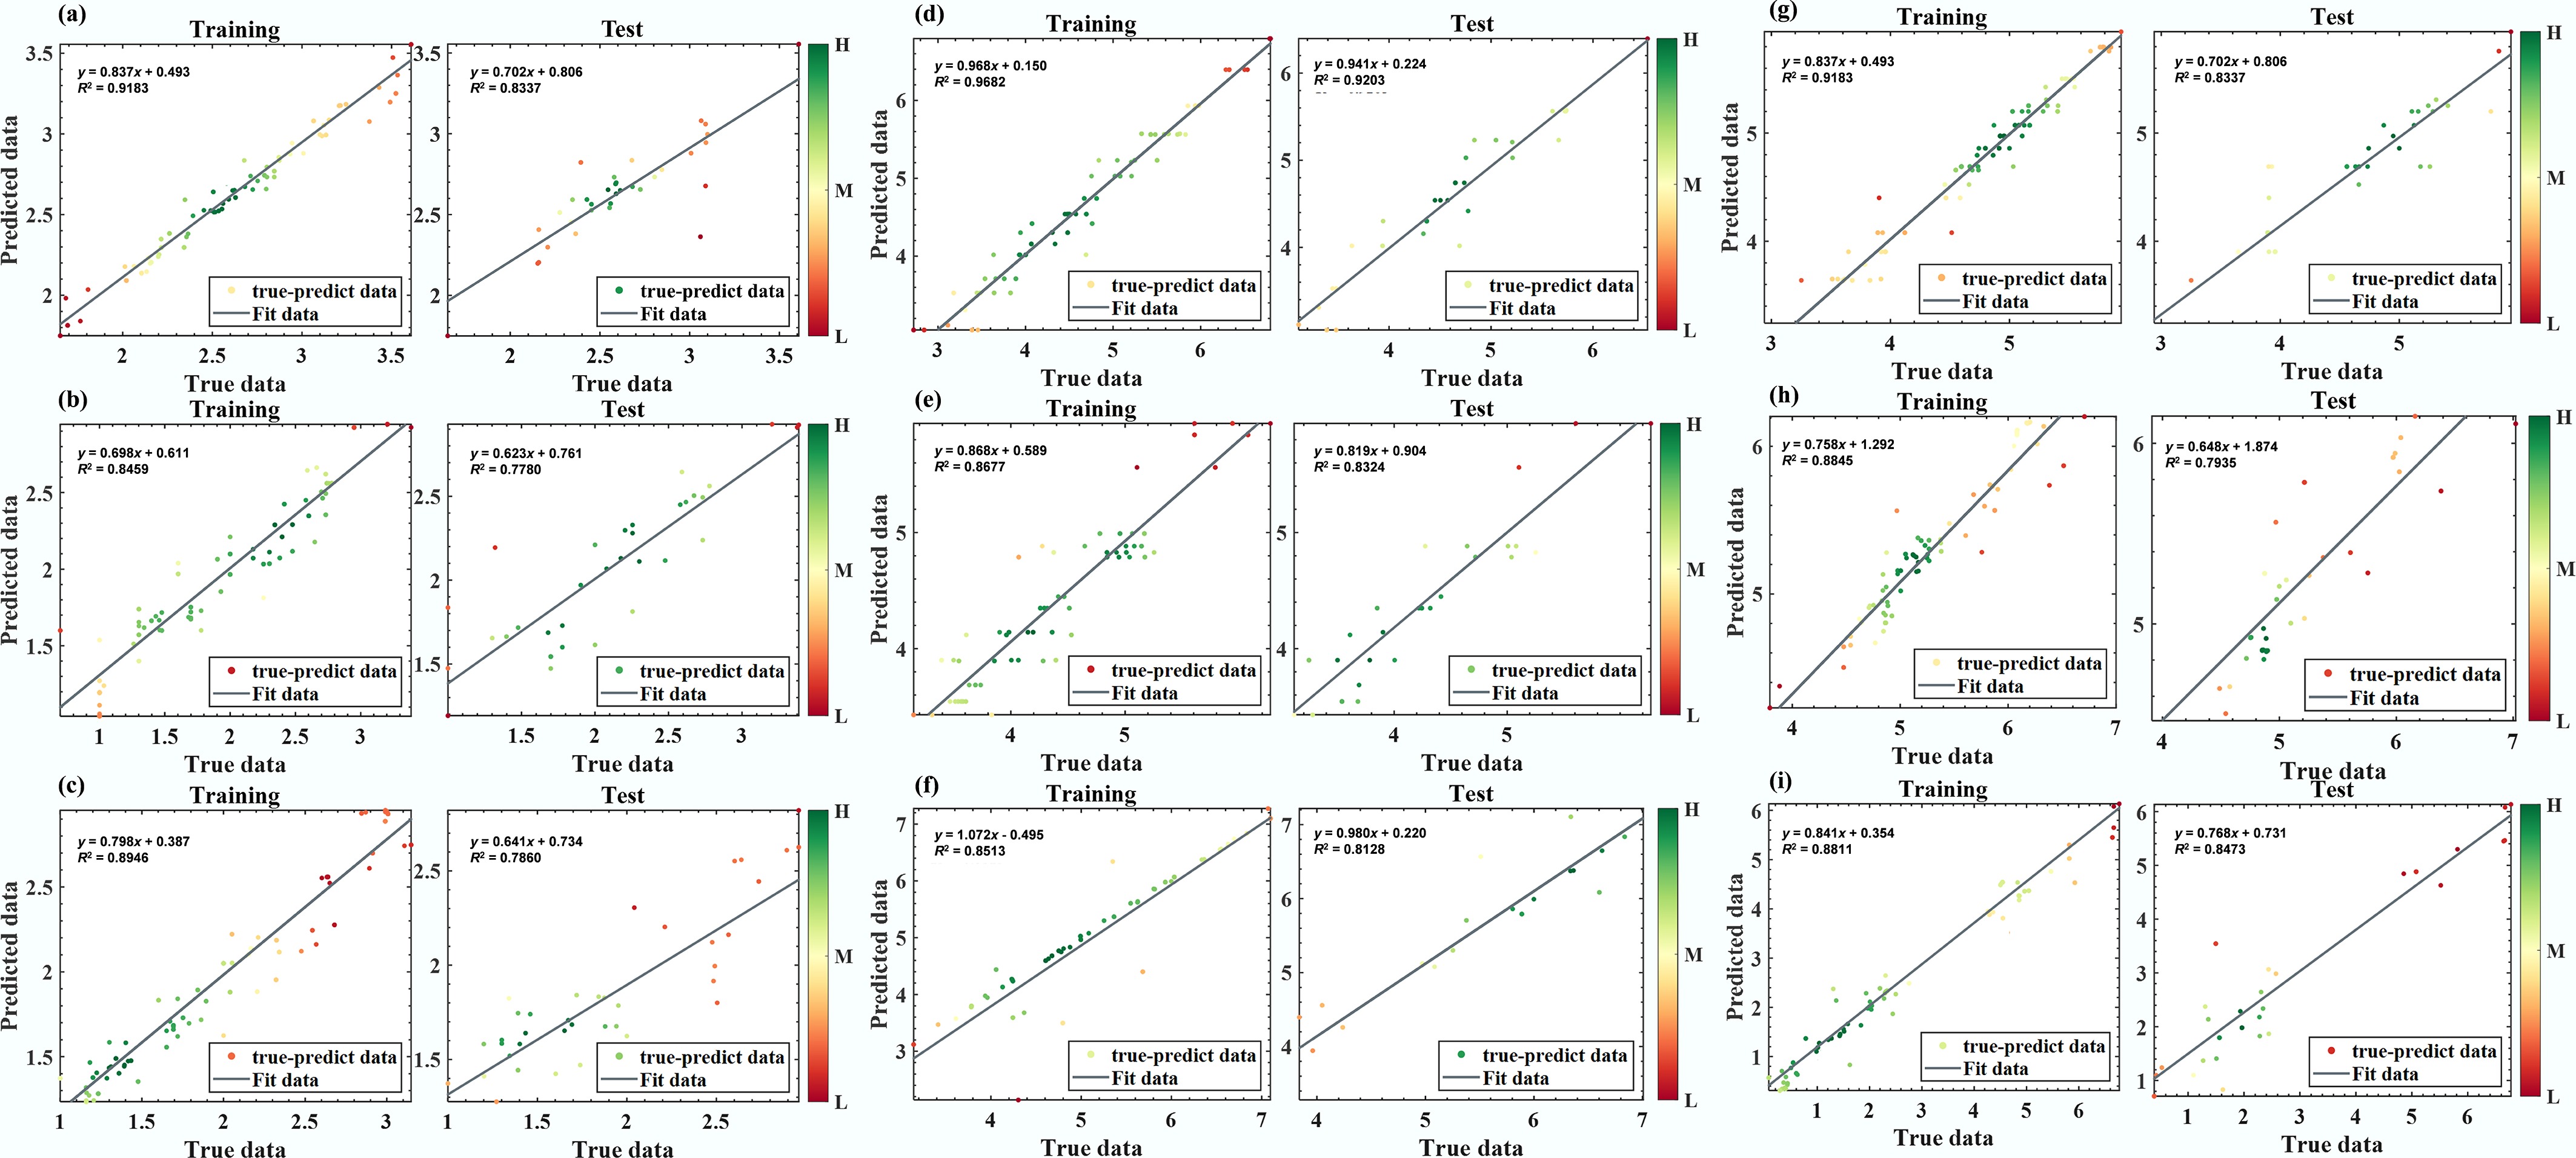
Figure 4.
Performance of optimal predictive models for each pathogen on the training and test sets. (a) RF-Fecal coliforms. (b) RF-E. coli. (c) RF-E. faecalis. (d) DT-P. aeruginosa. (e) DT-Salmonella spp. (f) MLP-Shigella spp. (g) DT-Adenovirus. (h) RF-Norovirus. (i) RF-Enterovirus.
-
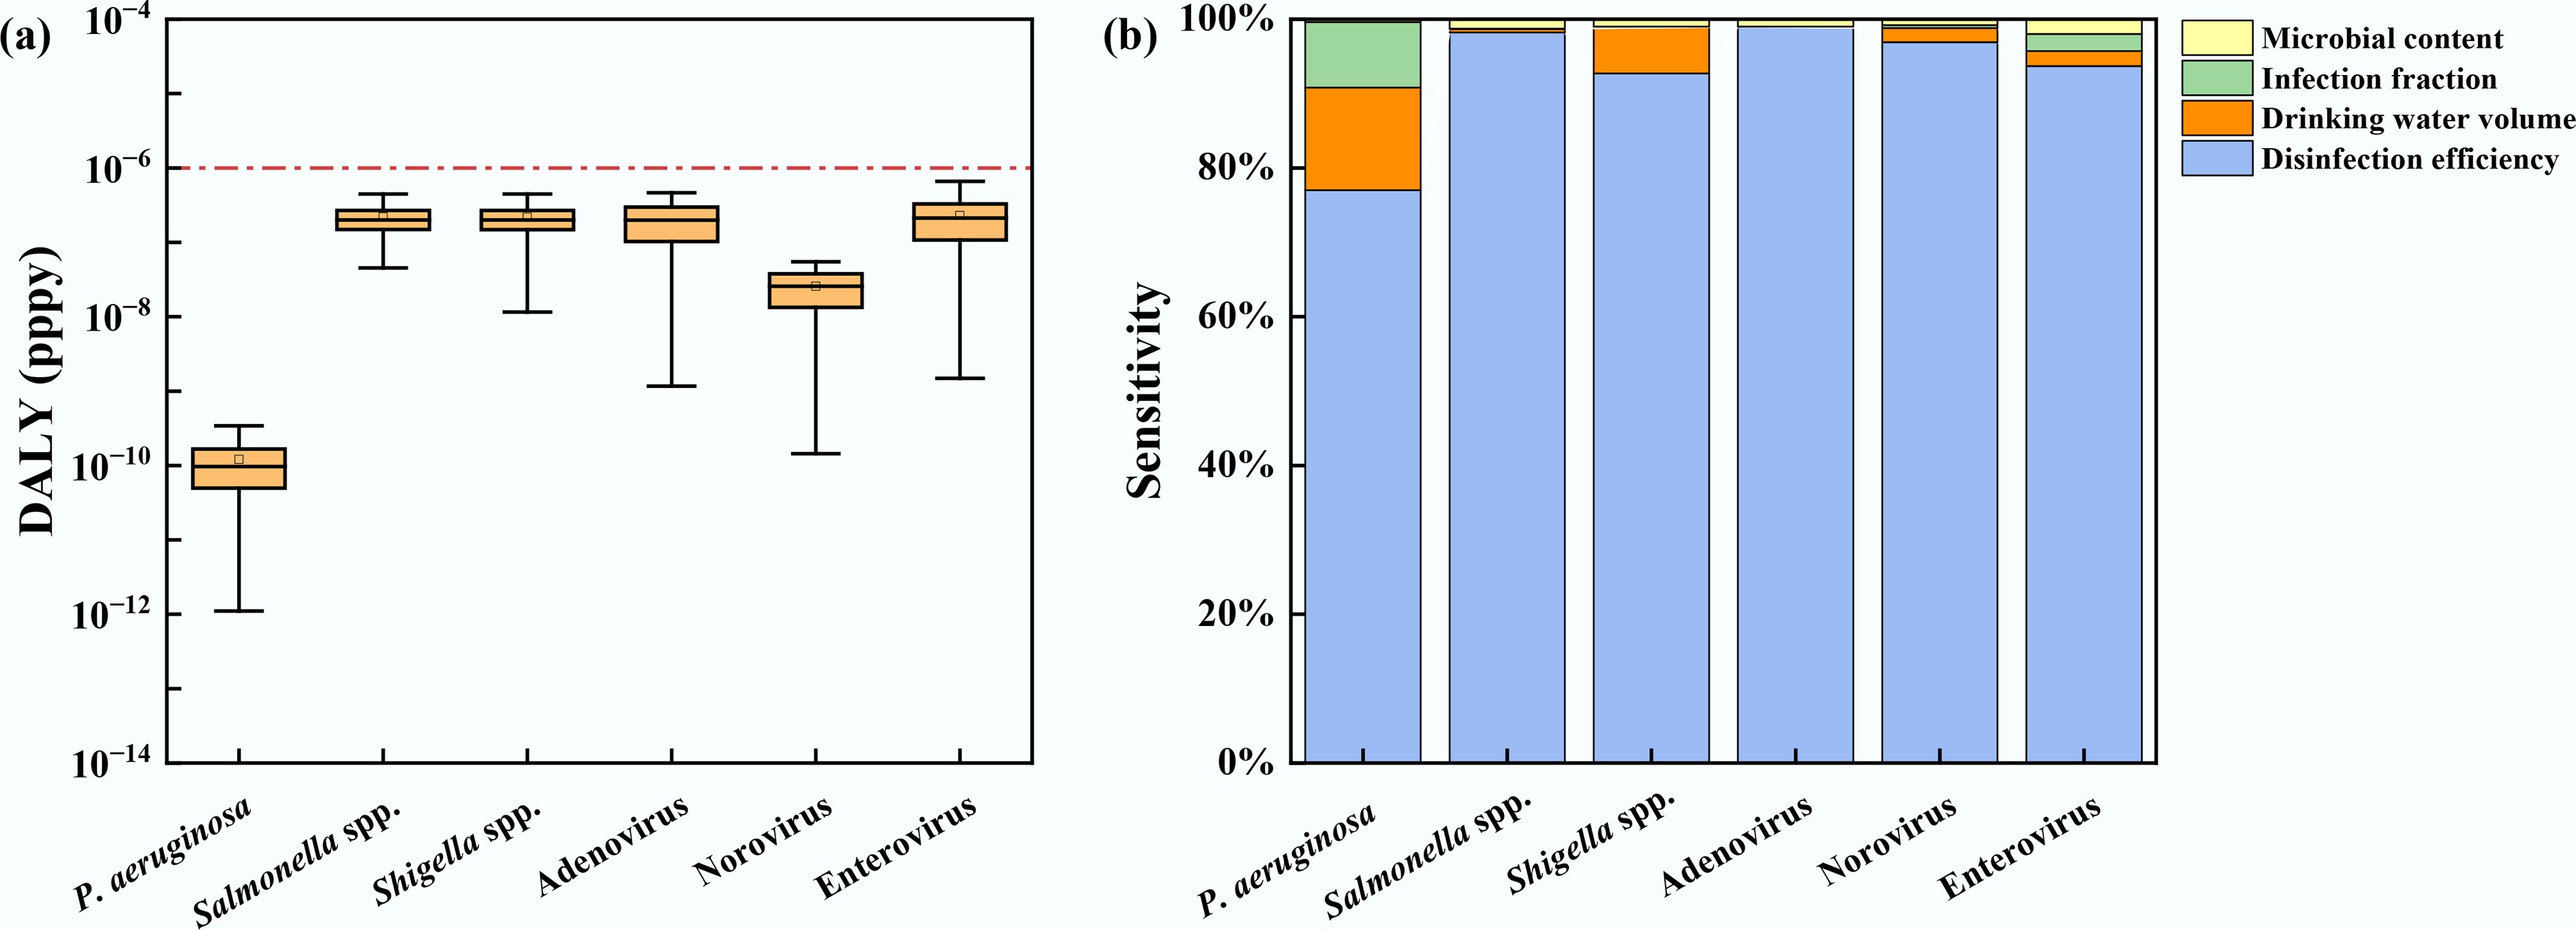
Figure 5.
(a) Risk assessment, and (b) sensitivity analysis of pathogens in drinking water sources.
-
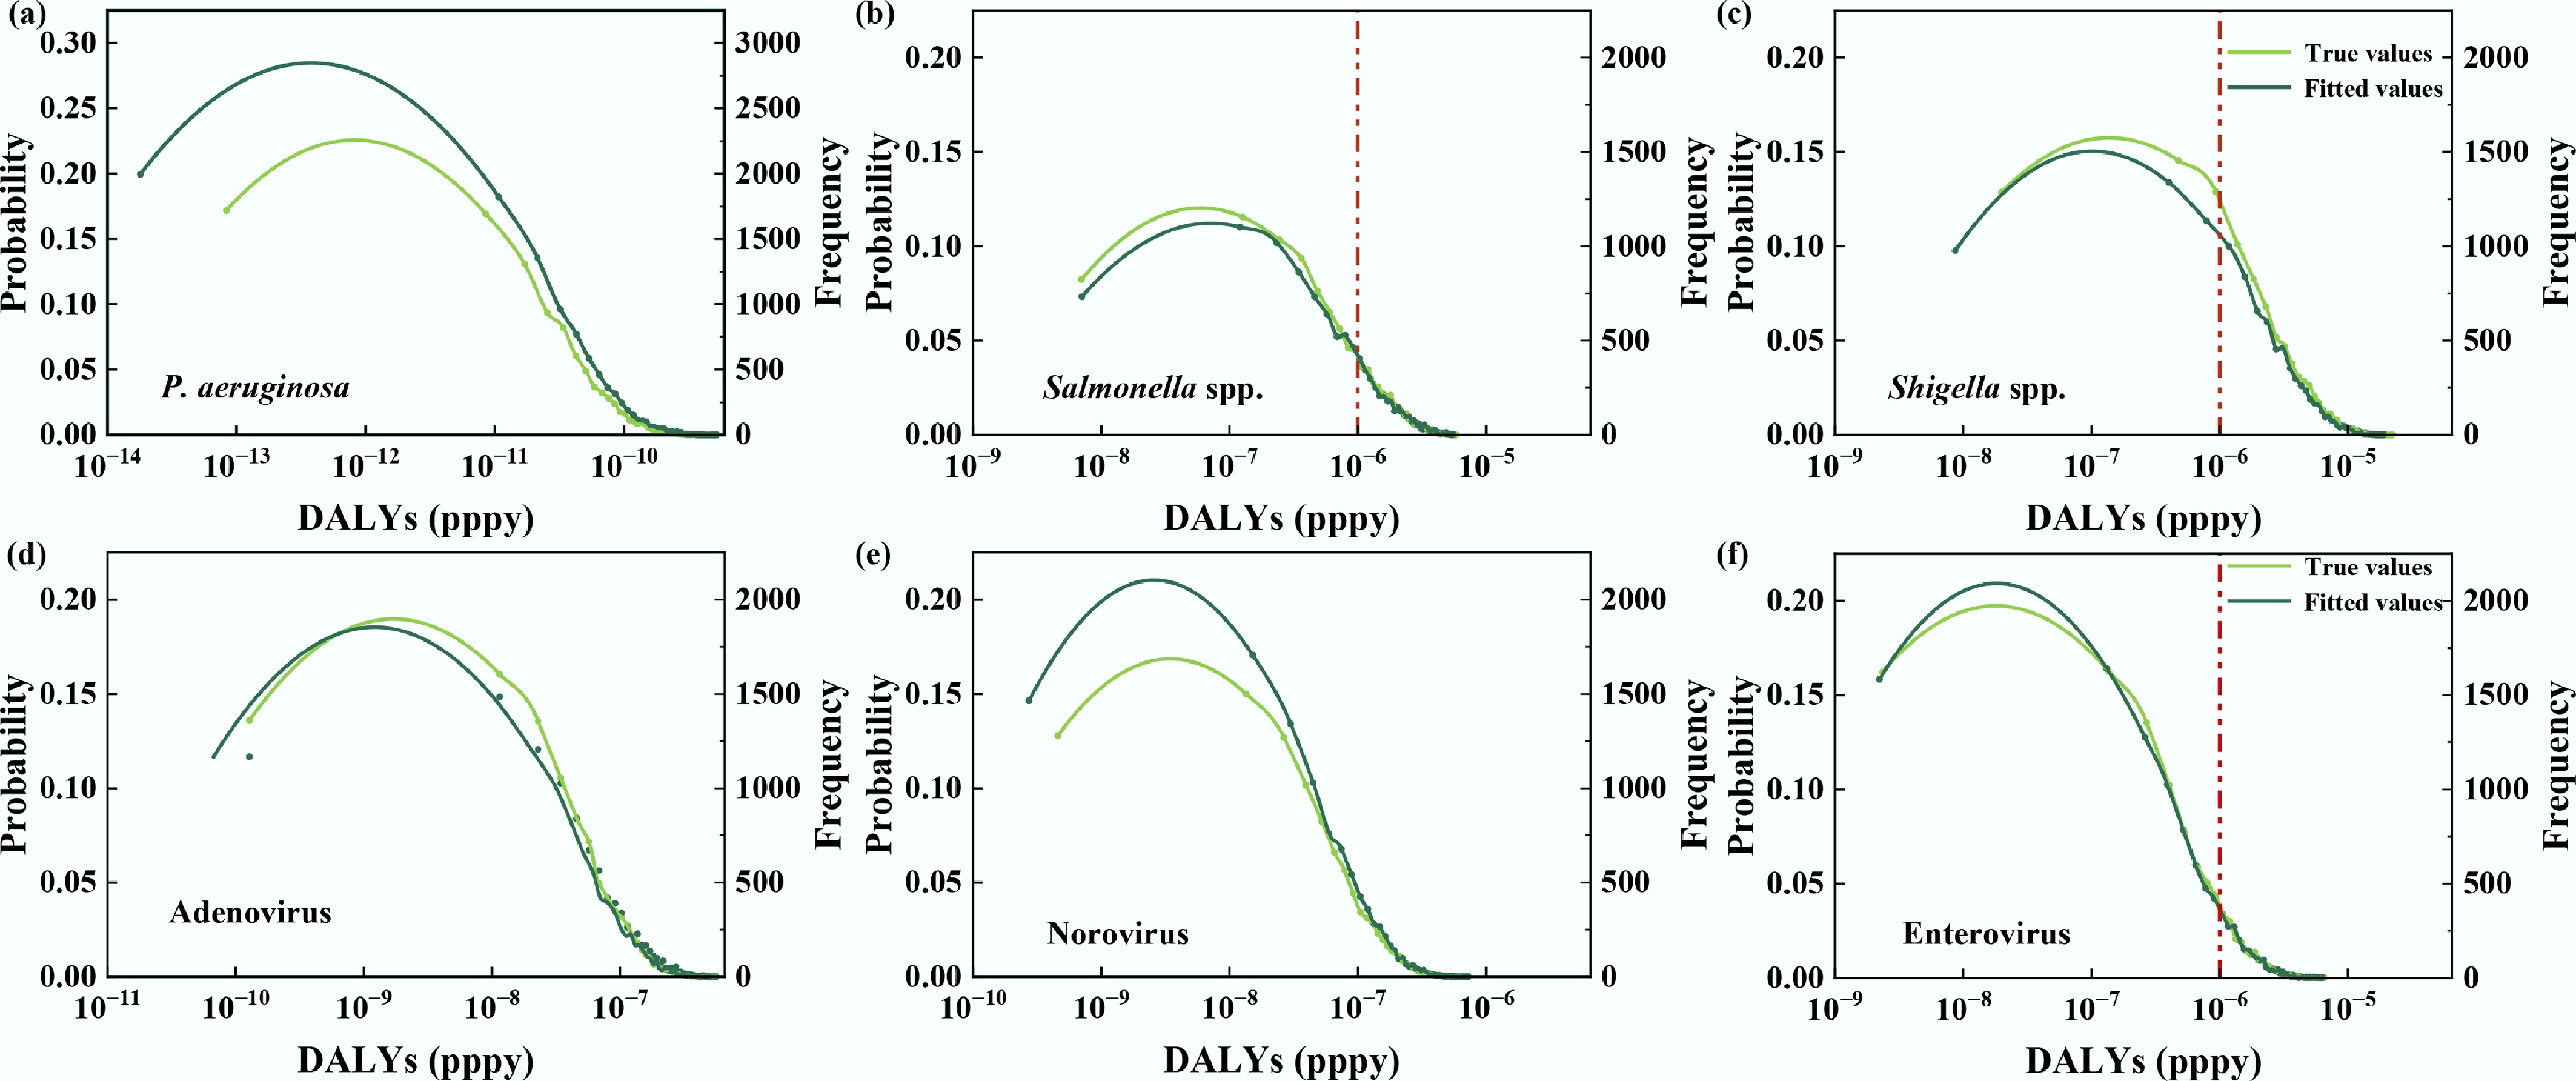
Figure 6.
Comparison of directly calculated and predicted disability-adjusted life years (DALYs) for six pathogens via drinking water exposure using Monte Carlo simulation. (a) P. aeruginosa, (b) Salmonella spp., (c) Shigella spp., (d) Adenovirus, (e) Norovirus, and (f) Enterovirus.
-
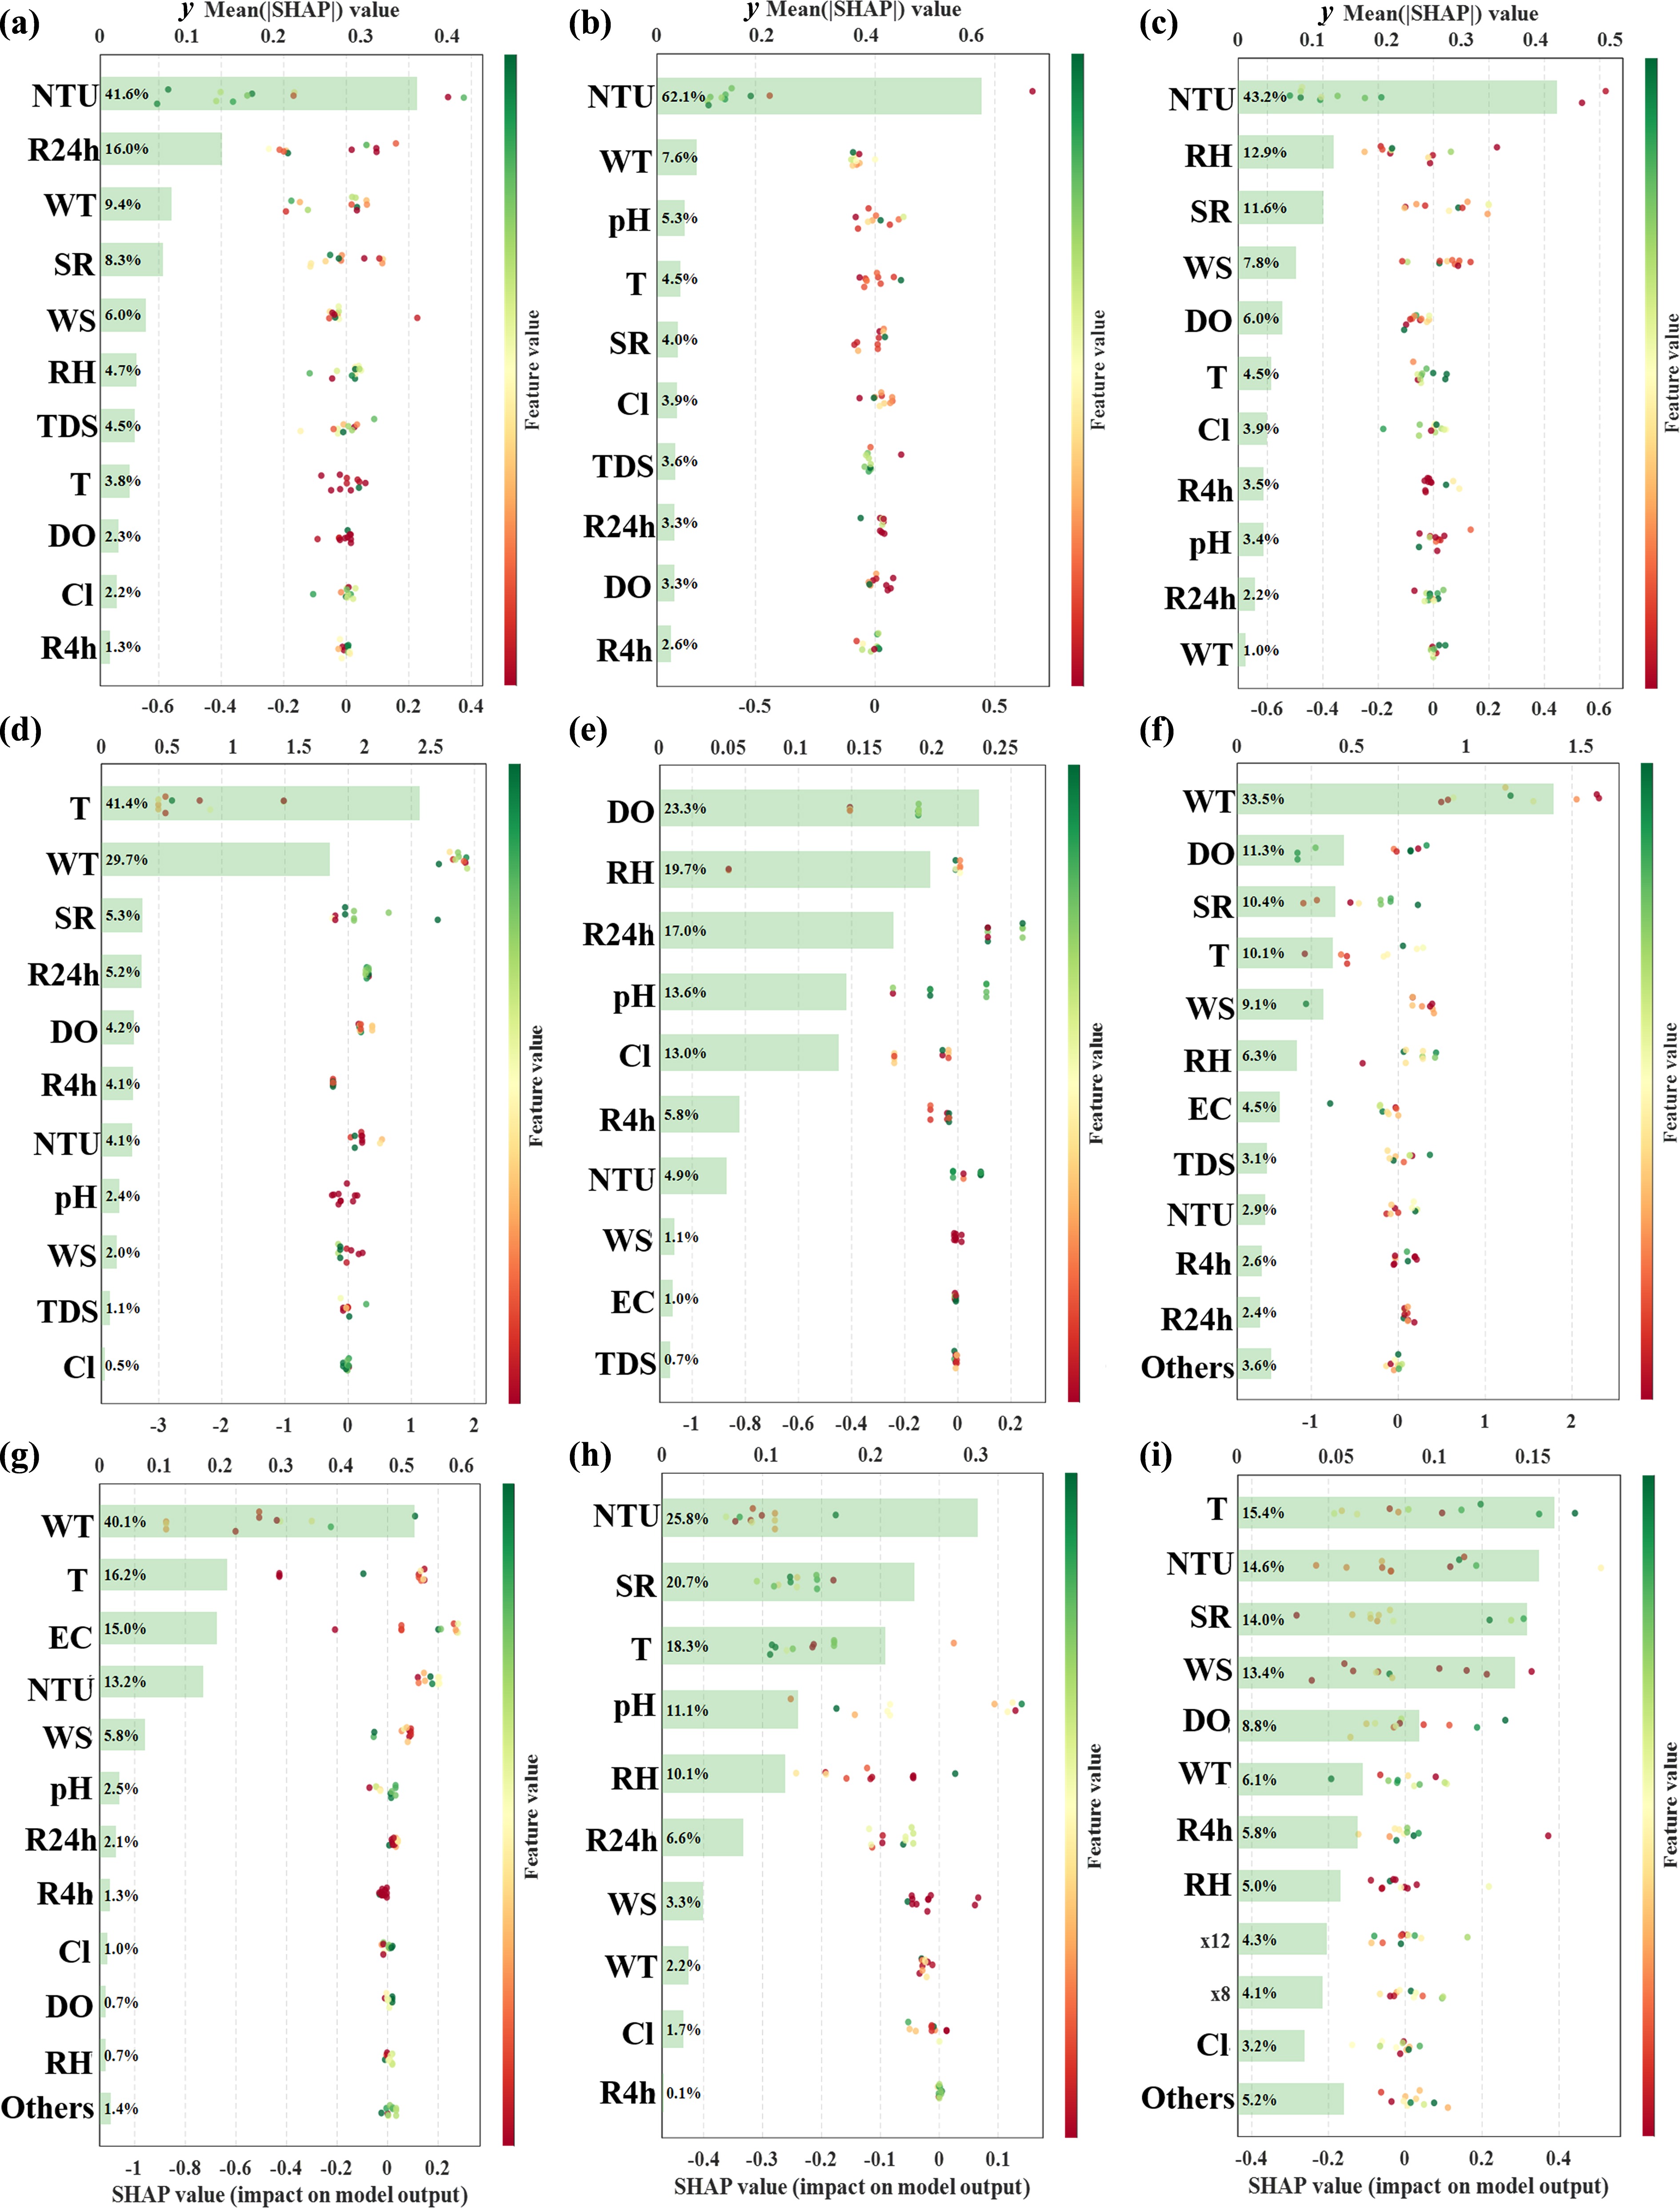
Figure 7.
SHAP value ranking of optimal predictive models for different pathogens. (a) Fecal coliforms, (b) E. coli, (c) E. faecalis, (d) P. aeruginosa, (e) Salmonella spp., (f) Shigella spp., (g) Adenovirus, (h) Norovirus, and (i) Enterovirus.
-
DWS1-1 DWS1-2 DWS2-1 DWS2-2 DWS2-3 Water temperature (WT, °C) 23.17 ± 8.56 23.70 ± 8.86 25.10 ± 7.37 23.48 ± 7.30 23.67 ± 7.50 pH 7.62 ± 0.43 8.01 ± 0.60 7.77 ± 0.39 8.05 ± 0.26 8.16 ± 0.34 Conductivity (EC, μS/cm) 454.61 ± 100.61 491.19 ± 91.31 663.96 ± 375.93 446.95 ± 119.20 403.13 ± 94.32 Chlorine residual (Cl, mg/L) 0.045 ± 0.014 0.035 ± 0.019 0.034 ± 0.023 0.040 ± 0.013 0.0325 ± 0.016 Total dissolved solids (TDS, mg/L) 227.5 ± 50.48 220.34 ± 88.67 332.09 ± 187.87 216.79 ± 52.68 201.55 ± 47.07 Turbidity (NTU) 38.71 ± 12.41 27.55 ± 10.68 77.2 ± 73.25 39.39 ± 54.69 15.45 ± 4.24 Dissolved oxygen (DO, mg/L) 6.26 ± 2.60 6.93 ± 1.31 5.96 ± 1.69 7.18 ± 1.94 6.46 ± 1.90 Air temperature (T, °C) 23.20 ± 8.50 23.14 ± 8.68 22.15 ± 8.35 21.86 ± 8.37 22.54 ± 7.80 Relative humidity (RH, %) 57.58 ± 12.67 56.95 ± 11.70 72.68 ± 14.70 70.79 ± 16.29 70.81 ± 15.46 Rainfall 4 h before sampling (R4h, mm) 0.028 ± 0.075 0.027 ± 0.075 0.066 ± 0.081 0.050 ± 0.058 0.069 ± 0.081 Rainfall 24 h before sampling (R24h, mm) 0.026 ± 0.038 0.026 ± 0.039 0.15 ± 0.31 0.145 ± 0.323 0.149 ± 0.307 Wind speed (m/s) 3.90 ± 1.84 3.76 ± 1.69 3.56 ± 1.99 4.02 ± 1.61 3.35 ± 1.96 Solar radiation (W/m2) 644.68 ± 217.49 622.12 ± 251.81 514.82 ± 183.96 524.33 ± 197.59 504.85 ± 193.10 Values are presented as mean ± standard deviation. Table 1.
Physicochemical characteristics of surface water samples collected from two drinking water sources (DWS1 and DWS2)
Figures
(7)
Tables
(1)