













-
The emergence and re-emergence of pathogens pose a substantial challenge to global public health[1]. Waterborne pathogen contamination in ambient water bodies and related diseases is a major water quality concern throughout the world[2]. According to the WHO[3], approximately 2 billion people worldwide use drinking water sources contaminated with microbial pathogens, and an estimated 485,000 deaths occur annually due to waterborne diseases. In most countries, the microbiological quality of water is assessed primarily using fecal indicator bacteria (FIB) such as Escherichia coli (E. coli), Enterococcus faecalis (E. faecalis), and fecal coliforms[4]. However, recent studies have shown that FIB concentrations often do not correlate well with the presence of specific pathogenic organisms[5,6]. This discrepancy underscores the urgent need for direct pathogen detection and advanced risk assessment frameworks to address microbial hazards comprehensively.
Common pathogens in drinking water sources include pathogenic bacteria such as Pseudomonas aeruginosa, Salmonella spp., and Shigella spp., and viruses including Adenovirus, Norovirus, and Enterovirus. These pathogens can enter the human body through the respiratory tract, gastrointestinal system, or skin, causing illnesses such as typhoid fever, diarrhea, and dysentery[7−10]. These pathogens have been detected to varying degrees in drinking water sources[11], rivers[12−15], lakes[16], oceans[17], and sewage[18].
Traditional culture-based methods for microorganism detection (e.g., membrane filtration and dilution plating) typically require 24–72 h of incubation to obtain detection results[19]. To overcome these limitations, molecular techniques such as quantitative polymerase chain reaction (qPCR) have been increasingly adopted for their high sensitivity and specificity in detecting a broad range of microbial pathogens. While molecular approaches provide rapid and precise results, they often require sophisticated equipment and trained personnel, which may limit their application in low-resource settings.
Conventional linear models have limited capacity to capture the complex, non-linear, and interactive relationships between water quality parameters and microbial contamination. In recent years, machine learning (ML) approaches have shown considerable potential for modeling such relationships and enabling more accurate prediction of microbial contamination levels from routinely monitored indicators[20−22]. Mohammed et al.[23] developed various machine learning models based on water quality and environmental variables to predict the real-time concentrations of FIB in raw source water. Panidhapu et al.[24] proposed an empirical modeling approach based on machine learning algorithms such as Random Forest (RF) and Naïve Bayes, which integrates water quality, environmental, and meteorological variables to enable real-time prediction of FIB levels. However, most studies have focused primarily on FIB, whereas relatively few have explored the use of ML for the direct prediction of waterborne pathogens, despite its potential to support public health risk assessment. If pathogen concentrations can be reliably predicted from routinely monitored environmental and water-quality variables, these predictions could be further incorporated into quantitative microbial risk assessment (QMRA) to estimate infection risks and associated health burdens in a more timely and scalable manner. Such integration would provide a more practical and dynamic framework for assessing waterborne health risks under real conditions.
This study investigated the contamination levels of three fecal indicator bacteria (fecal coliforms, E. coli, E. faecalis) and six pathogens (P. aeruginosa, Salmonella spp., Shigella spp., Adenovirus, Norovirus, and Enterovirus) in surface water samples collected from a major city in Eastern China. Six machine learning algorithms, Multiple Linear Regression (MLR), Least Squares Boosting (LSBoost), Decision Tree (DT), Support Vector Machine (SVM), RF, and Multilayer Perceptron (MLP), were employed to develop predictive models using water quality indicators. The optimal model was integrated with QMRA to form a framework for estimating disability-adjusted life years (DALYs). Additionally, SHapley Additive exPlanations (SHAP) analysis was conducted to interpret feature contributions to model predictions. This integrated framework offers a reliable and transparent solution for microbial water quality management.
-
Surface water samples (n = 95) were collected in a major city in Eastern China from May 2024 to December 2025, with three to five sampling campaigns conducted in each season. During each sampling campaign, samples were collected from five fixed sites across the two drinking water sources (DWS1 and DWS2) within the same sampling period to reduce temporal mismatch among sites. At each site, 2–3 L of water was collected using sterilized glass bottles. All samples were stored at 4 °C and transported to the laboratory for processing within 4 h[25]. On-site measurements of water temperature (WT), pH, conductivity, total dissolved solids (TDS), dissolved oxygen (DO), turbidity (NTU), and residual chlorine (Cl) were conducted using a portable water quality analyzer (DZB-712F, Leici, China), a turbidimeter (2100Q, HACH, USA), and a portable spectrophotometer (PCII, HACH, USA). Meteorological data, including air temperature (T), humidity (RH), solar radiation (SR), wind speed, 4-h (R4h), and 24-h (R24h) cumulative rainfall prior to sampling were obtained from the European Centre for Medium-Range Weather Forecasts (ECMWF). The physicochemical characteristics of surface water samples collected from DWS1 and DWS2 are presented in Table 1.
Table 1. Physicochemical characteristics of surface water samples collected from two drinking water sources (DWS1 and DWS2)
DWS1-1 DWS1-2 DWS2-1 DWS2-2 DWS2-3 Water temperature (WT, °C) 23.17 ± 8.56 23.70 ± 8.86 25.10 ± 7.37 23.48 ± 7.30 23.67 ± 7.50 pH 7.62 ± 0.43 8.01 ± 0.60 7.77 ± 0.39 8.05 ± 0.26 8.16 ± 0.34 Conductivity (EC, μS/cm) 454.61 ± 100.61 491.19 ± 91.31 663.96 ± 375.93 446.95 ± 119.20 403.13 ± 94.32 Chlorine residual (Cl, mg/L) 0.045 ± 0.014 0.035 ± 0.019 0.034 ± 0.023 0.040 ± 0.013 0.0325 ± 0.016 Total dissolved solids (TDS, mg/L) 227.5 ± 50.48 220.34 ± 88.67 332.09 ± 187.87 216.79 ± 52.68 201.55 ± 47.07 Turbidity (NTU) 38.71 ± 12.41 27.55 ± 10.68 77.2 ± 73.25 39.39 ± 54.69 15.45 ± 4.24 Dissolved oxygen (DO, mg/L) 6.26 ± 2.60 6.93 ± 1.31 5.96 ± 1.69 7.18 ± 1.94 6.46 ± 1.90 Air temperature (T, °C) 23.20 ± 8.50 23.14 ± 8.68 22.15 ± 8.35 21.86 ± 8.37 22.54 ± 7.80 Relative humidity (RH, %) 57.58 ± 12.67 56.95 ± 11.70 72.68 ± 14.70 70.79 ± 16.29 70.81 ± 15.46 Rainfall 4 h before sampling (R4h, mm) 0.028 ± 0.075 0.027 ± 0.075 0.066 ± 0.081 0.050 ± 0.058 0.069 ± 0.081 Rainfall 24 h before sampling (R24h, mm) 0.026 ± 0.038 0.026 ± 0.039 0.15 ± 0.31 0.145 ± 0.323 0.149 ± 0.307 Wind speed (m/s) 3.90 ± 1.84 3.76 ± 1.69 3.56 ± 1.99 4.02 ± 1.61 3.35 ± 1.96 Solar radiation (W/m2) 644.68 ± 217.49 622.12 ± 251.81 514.82 ± 183.96 524.33 ± 197.59 504.85 ± 193.10 Values are presented as mean ± standard deviation. Detection of waterborne pathogens in surface water
Cultivation experiments of indicator bacteria
-
According to the Chinese National Standard: Standard Examination Methods for Drinking Water – Part 12: Microbiological indicators (GB/T 5750.12-2023), culturable bacteria in water samples were quantified using a membrane filtration method. Each water sample was filtered through a 0.45-μm mixed cellulose ester (MCE) membrane (Titan, Shanghai, China). All analyses were performed in triplicate, and the results are expressed as colony-forming units (CFU).
Water sample enrichment, DNA, and RNA extraction
-
The water samples were concentrated following the method previously established by our group[26]. Viral RNA was extracted using the QIAamp® Viral RNA Mini Kit (Qiagen, Germany), followed by reverse transcription to synthesize complementary DNA (cDNA). DNA was extracted using the FastDNA SPIN Kit for Soil (MP Biomedicals, USA) according to the manufacturer's protocol.
Detection of pathogens by qPCR
-
qPCR assays were established, based on protocols previously developed by our research group[25,26], to detect P. aeruginosa, Salmonella, Shigella, Adenovirus, Norovirus, and Enterovirus. Specific primers and TaqMan probes were designed targeting conserved gene regions, as listed in Supplementary Table S1. Details of the reaction system are provided in Supplementary Table S2. The reaction was performed in a real-time quantitative PCR (qPCR) instrument (LightCycler 480 II, Roche, Switzerland) under the following conditions: 95 °C for 30 s, followed by 40 cycles of 95 °C for 30 s and 60 °C for 1 min[25]. All assays included positive and negative controls and were run in triplicate. Quantification was performed using standard curves generated from serial dilutions of target DNA or RNA, as shown in Supplementary Table S3.
Quantitative microbial risk assessment
Hazard identification
-
Hazard Identification is the process of determining whether exposure to a stressor can cause an increase in the incidence of specific adverse health effects[27]. Contaminated water containing enteric pathogens can cause gastroenteritis and respiratory infections[28].
Exposure assessment
-
In this study, drinking is the sole pathway to exposure. The exposure dose (D) is calculated as shown in Eq. (1):
$ D=C\times V $ (1) where C = C0 × Re, with C0 representing the initial concentration of the pathogen and the residual rate (Re) denoting the removal efficiency of the drinking water treatment plant, Re = 1.9 log10; V = V0 × 10.7%, where 10.7% represents the probability of direct consumption[29], and V0 is the volume of drinking water intake, ranging from 0.8 to 3 L/d, following a triangular distribution, based on the 'Exposure Factors Handbook of Chinese Population' issued by the Ministry of Ecology and Environment of China.
Dose-response assessment
-
The virus dose-response models were originally established using different dose units[30]. We followed the dose-coordination rules proposed by McBride et al.[31]. The conversion information is shown in Supplementary Table S4. The dose–response models for the various pathogens are shown in Eqs (2) and (3), and the corresponding parameters are summarized in Supplementary Table S5.
$ {P}_{\text{inf, daily}}=1-{\text{EXP}}(-kD) $ (2) $ {P}_{\text{inf, daily}}=1 +{\left(1 +\frac{D}{\beta }\right)}^{-\alpha} $ (3) Risk characterization
-
This study adopted the DALYs-based evaluation approach recommended by the WHO, with a benchmark limit of 10−6 DALYs per person per year (pppy), as shown in Eqs (4)–(6). The relevant parameter information is shown in Supplementary Table S5.
$ P_{\text{inf, annua}\mathrm{l}}=1-(1-P_{\text{inf, daily}})^{365} $ (4) $ {P}_{\text{ill,annual}}={P}_{i\text{nf,annual}}\times{P}_{\text{ill}|\text{inf}} $ (5) $ \text{DALY}=P\mathrm{_{ill,annual}}\times S\times\text{DALY/case} $ (6) ML model development
Data preprocessing
-
Thirteen feature variables were used to develop machine learning models for predicting concentrations of nine pathogens (fecal coliforms, E. coli, E. faecalis, P. aeruginosa, Salmonella spp., Shigella spp., Adenovirus, Norovirus, and Enterovirus). Parallel measurements were averaged. Non-detects (< LOD) were treated as left-censored data and handled by multiple imputation. To account for within-batch dependence (five sites per batch), data were split at the batch level into training (70%) and test (30%) sets[23,32]. Z-score standardization was fitted on the training set and applied to the test set, and predictions were inverse-transformed to the original scale.
ML model development
-
In this study, six representative machine learning models were selected to develop predictive models for pathogen concentrations: MLR, LSBoost, DT, RF, SVM, and MLP. These models cover a range of linear, ensemble, tree-based, kernel-based, and neural network approaches, providing a diverse framework for performance comparison. During model optimization, algorithm-specific strategies were adopted. For the MLP, hyperparameters were tuned mainly by adjusting the number of hidden neurons and network architecture. For the remaining models, L1-regularised embedded feature selection was performed within the training set, and performance was compared across different feature-set sizes to reduce overfitting and improve model stability. A grouped five-fold cross-validation scheme was used during optimization to ensure that samples from the same group were not split across folds, thereby avoiding optimistic performance estimates driven by within-group dependence.
Model evaluation
-
Model performance for microbial concentration prediction was evaluated using three common regression metrics: the coefficient of determination (R2), mean absolute error (MAE), and root mean squared error (RMSE). Final performance was assessed primarily based on R2, MAE, and RMSE on the independent test set, as defined in Eqs (7)–(9). These indicators were used to quantify the accuracy and goodness of fit between predicted and observed values.
After the optimal model for each microorganism was determined, data collected in January and February 2026, which were not used for model training, hyperparameter tuning, model selection, or test-set evaluation, were used for independent temporal validation.
$ {\text{MAE}}=\frac{1}{n}\sum\limits_{i=1}^{n}\left| {y}_{i}-{\hat{y}}_{i}\right| $ (7) $ {\text{RMSE}}=\sqrt{\frac{1}{n}\sum\limits_{i=1}^{n}{({{y}_{i}}-{{\hat{\text{y}}}_{i}})}^{2}} $ (8) $ {R}^{2}=1-\frac{\displaystyle\sum\limits_{i=1}^{n}{({{y}_{i}}-{{\hat{y}}_{i}})}^{2}}{\displaystyle\sum\limits_{i=1}^{n}{({{y}_{i}}-{{\overline{y}}_{i}})}^{2}} $ (9) ML model and quantitative microbial risk assessment
-
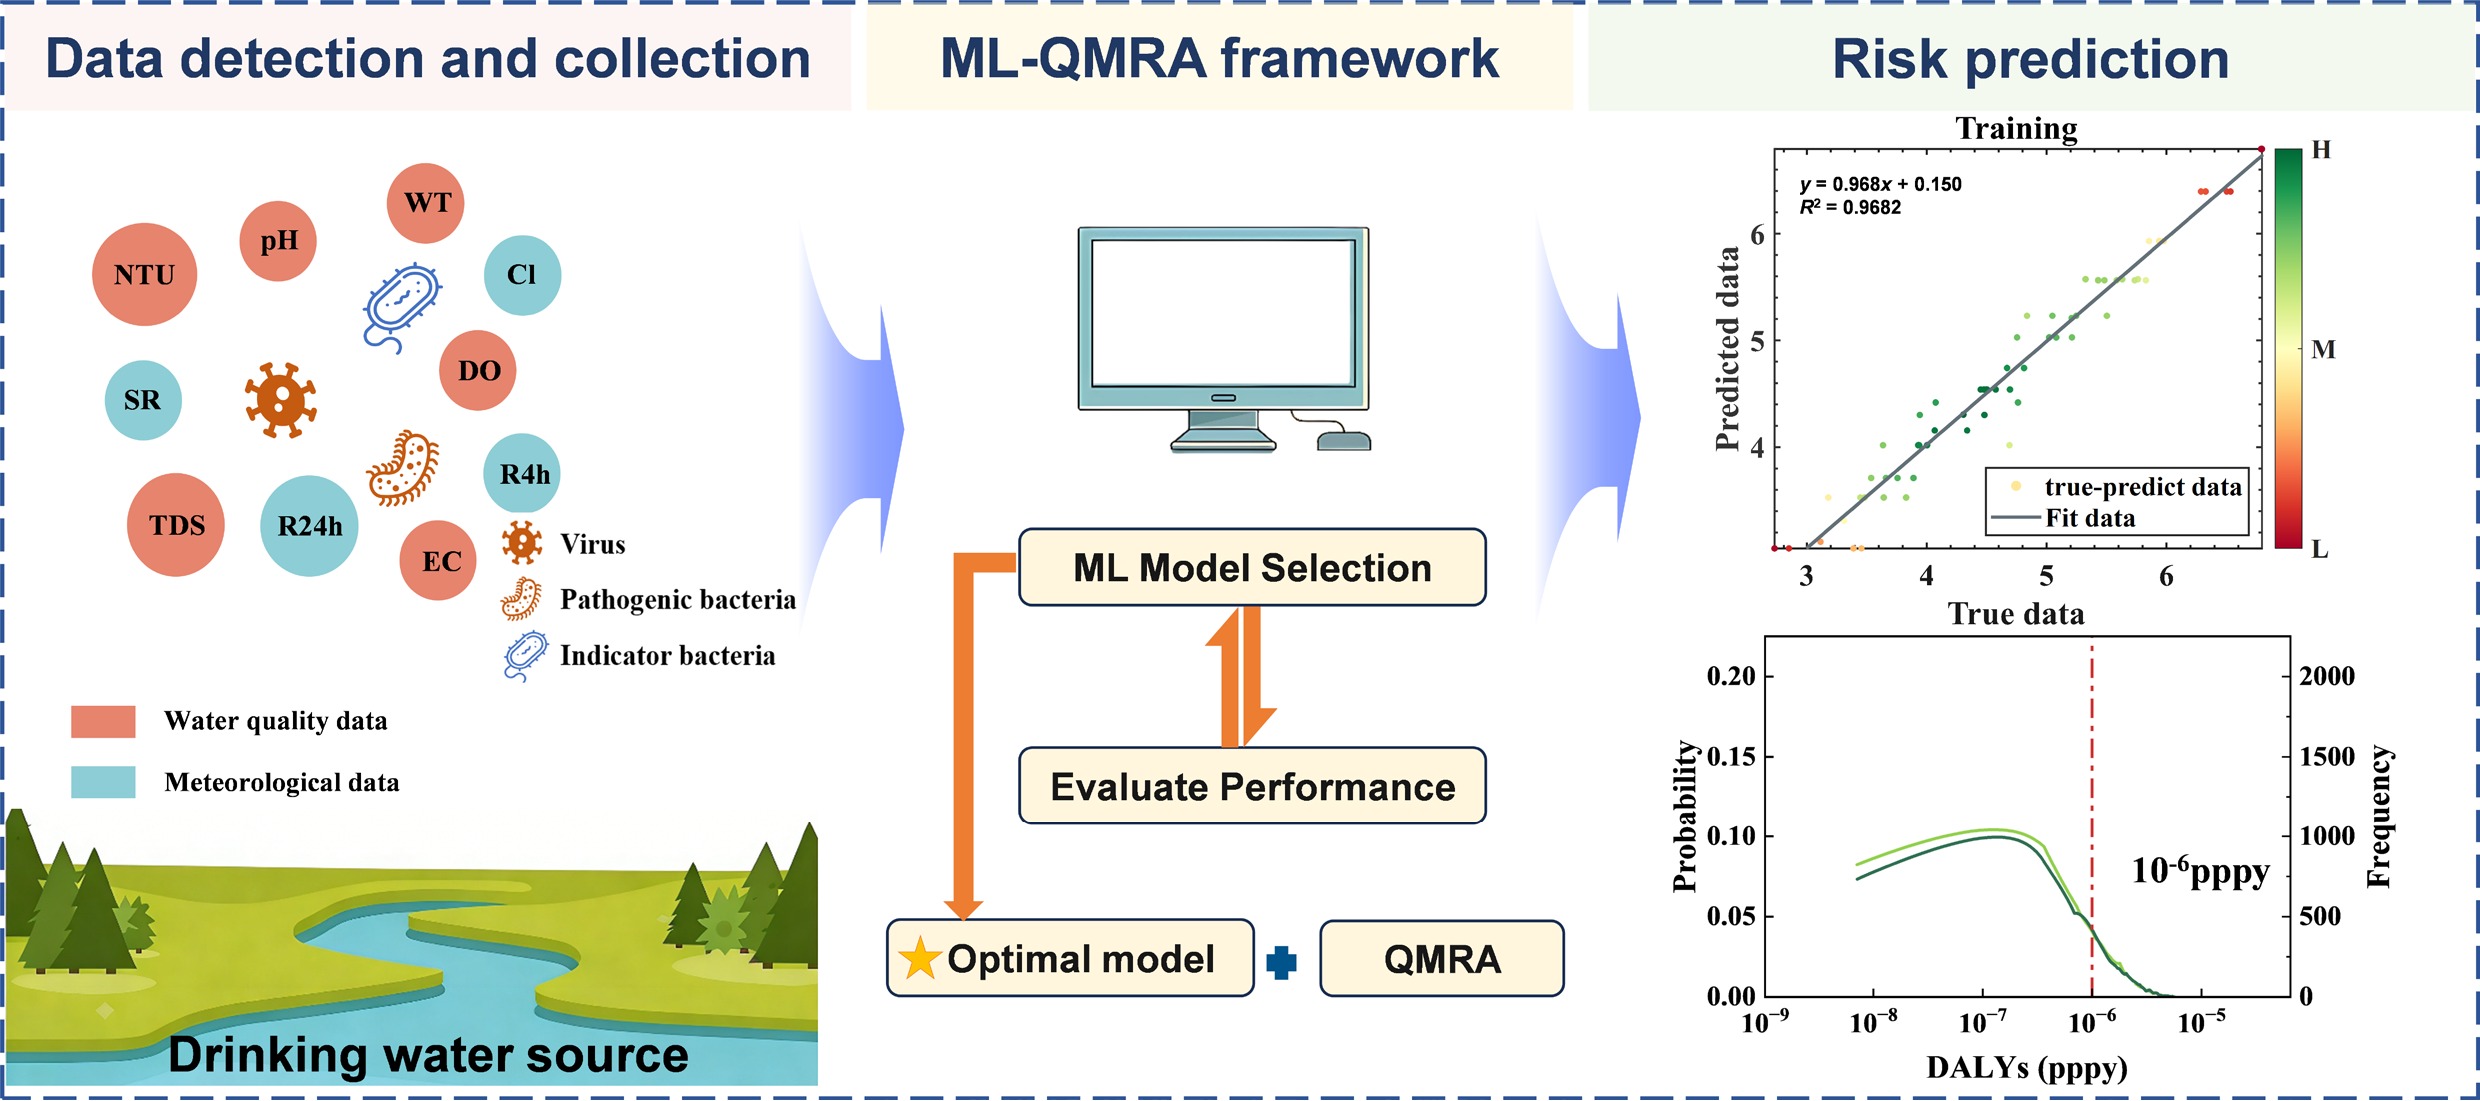
An integrated framework combining ML models and QMRA was developed in this study. The best-performing model, identified according to model evaluation metrics, was applied to predict the concentrations of pathogens under varying environmental and water-quality conditions. The predicted pathogen concentrations were then incorporated into the QMRA to estimate health risks in accordance with WHO guidelines. The model construction framework is shown in Fig. 1.
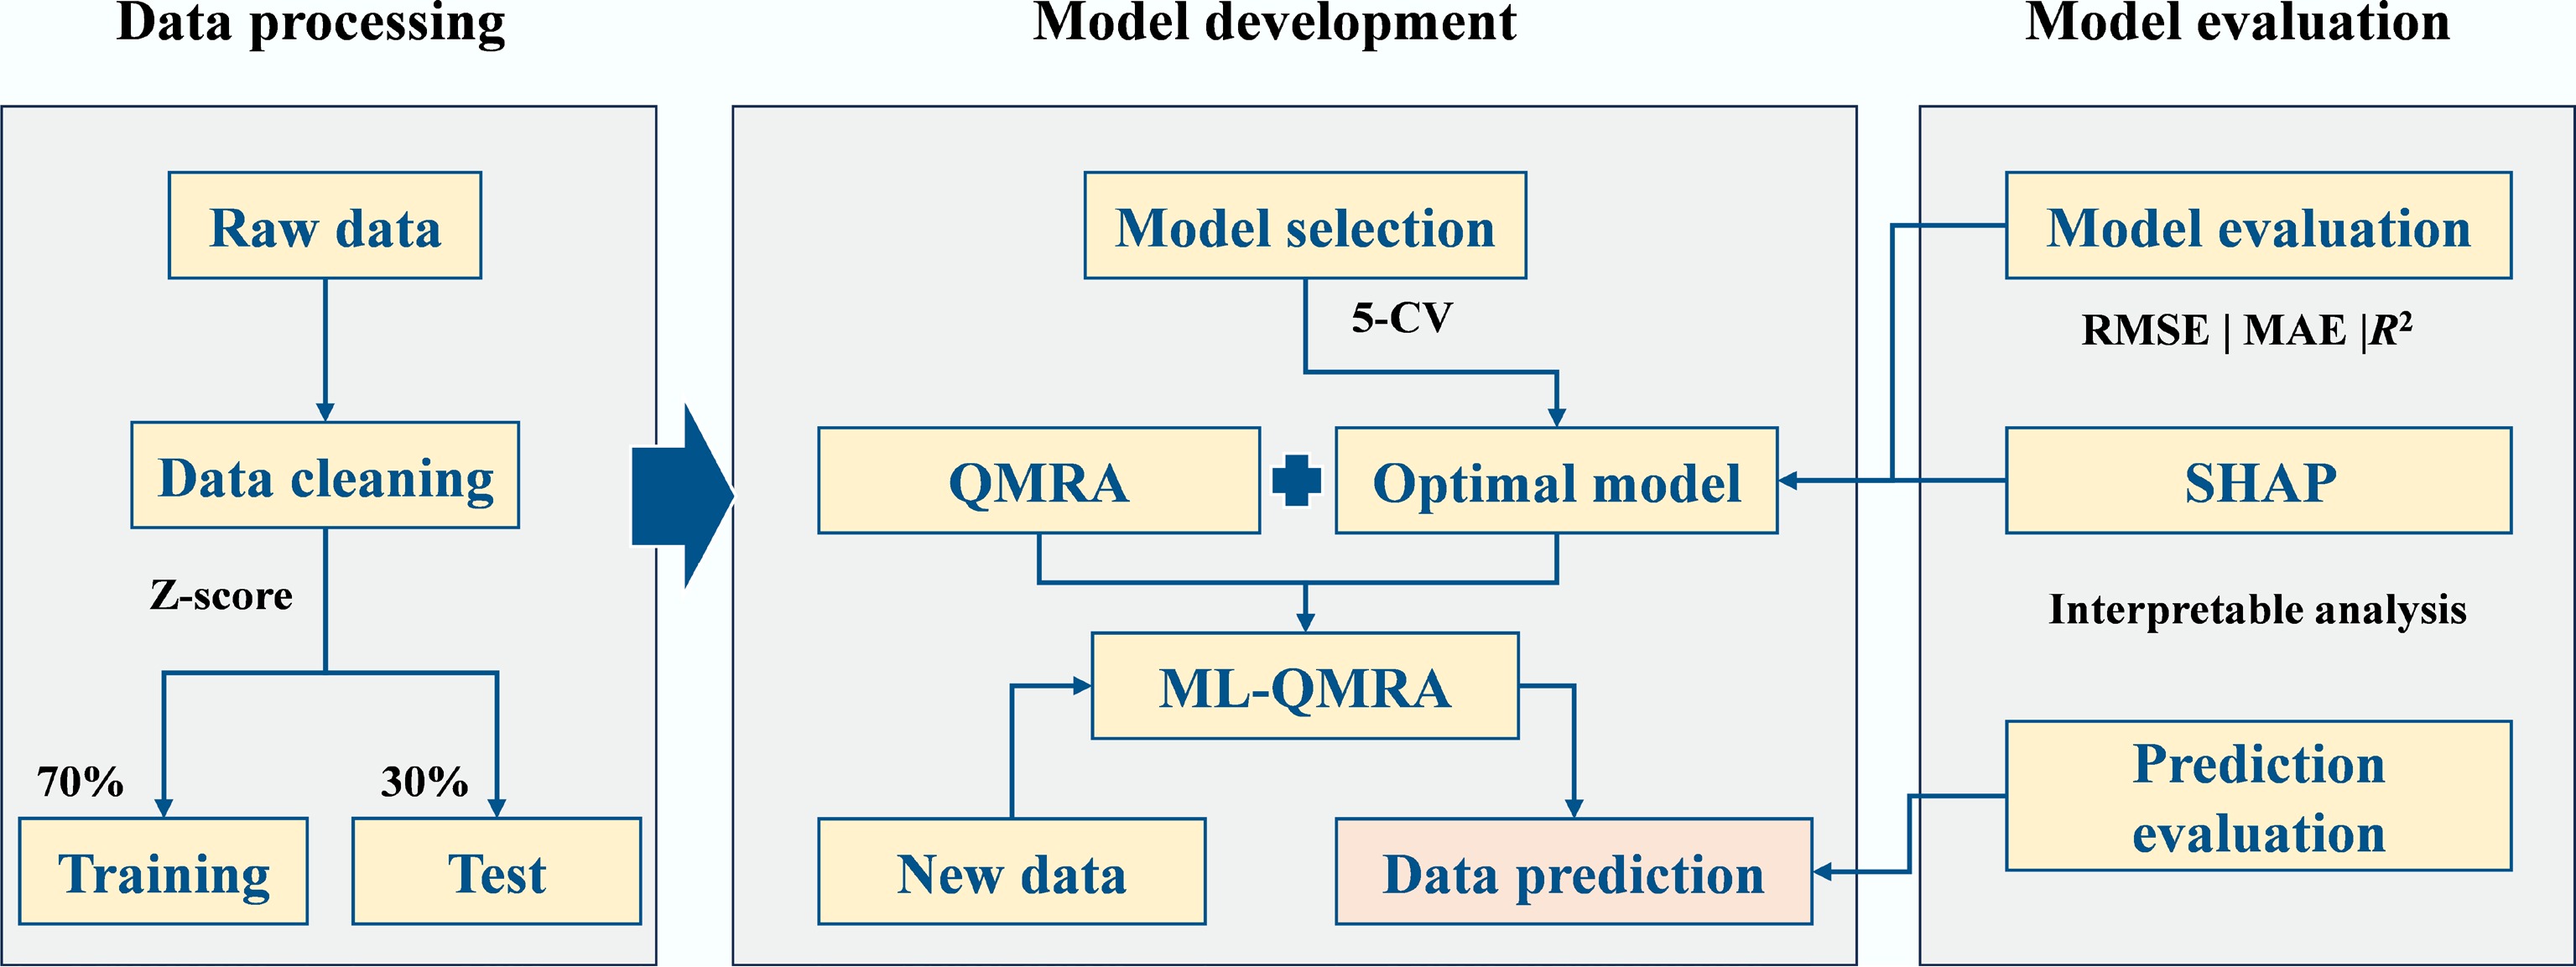
Figure 1.
Flowchart of data processing and model development.
Utilization of explainable artificial intelligence to interpret the model process
-
SHAP values were computed for the top-performing model to identify the most influential variables driving predicted pathogen concentrations[33]. For each explanatory variable, the SHAP value considers the difference in a ML model's predictions made by including and excluding the explanatory variable for all combinations of variables.
$ {\phi }_{\text{i}}=\sum \limits_{S\in F\backslash \left\{i\right\}}\frac{\left| S\right| !\left(F-\left| S\right| -1\right)!}{F!}\left[{f}_{S\cup \left\{i\right\}}\left({x}_{S\cup \left\{i\right\}}\right)-{f}_{S}\left({x}_{S}\right)\right] $ (10) Statistical analysis
-
All statistical analyses and model construction were carried out using MATLAB R2024a. Model interpretability was assessed through SHAP analysis implemented in Python within a Jupyter Notebook environment. Data visualization was conducted primarily with Origin 2024. Uncertainty analysis was conducted through a Monte Carlo simulation with 10,000 iterations, supported by probabilistic simulations, using Microsoft Excel in conjunction with Oracle Crystal Ball.
-
The contamination levels of indicator bacteria, pathogenic bacteria, and viruses in the water samples are illustrated in Fig. 2. Indicator bacteria concentrations varied markedly across samples (Fig. 2a). The concentration of fecal coliforms ranged from 4 × 101 to 8.90 × 10³ CFU/L. The concentration of E. coli was in the range of n.d.–2.43 × 10³ CFU/L, with a detection rate of 91.40%. The concentration of E. faecalis was in the range of n.d.–1.80 × 10³ CFU/L, with a detection rate of 93.55%. These values are comparable to those reported in a study of surface water sources in Turkey, where fecal coliforms and E. coli concentrations ranged from n.d. to 3.47 × 10⁴ CFU/L and from n.d. to 5.62 × 10³ CFU/L, respectively[34]. The similarity in magnitude suggests that bacterial contamination in the present study is within the range commonly observed in urbanized regions, implying comparable anthropogenic inputs and environmental conditions.
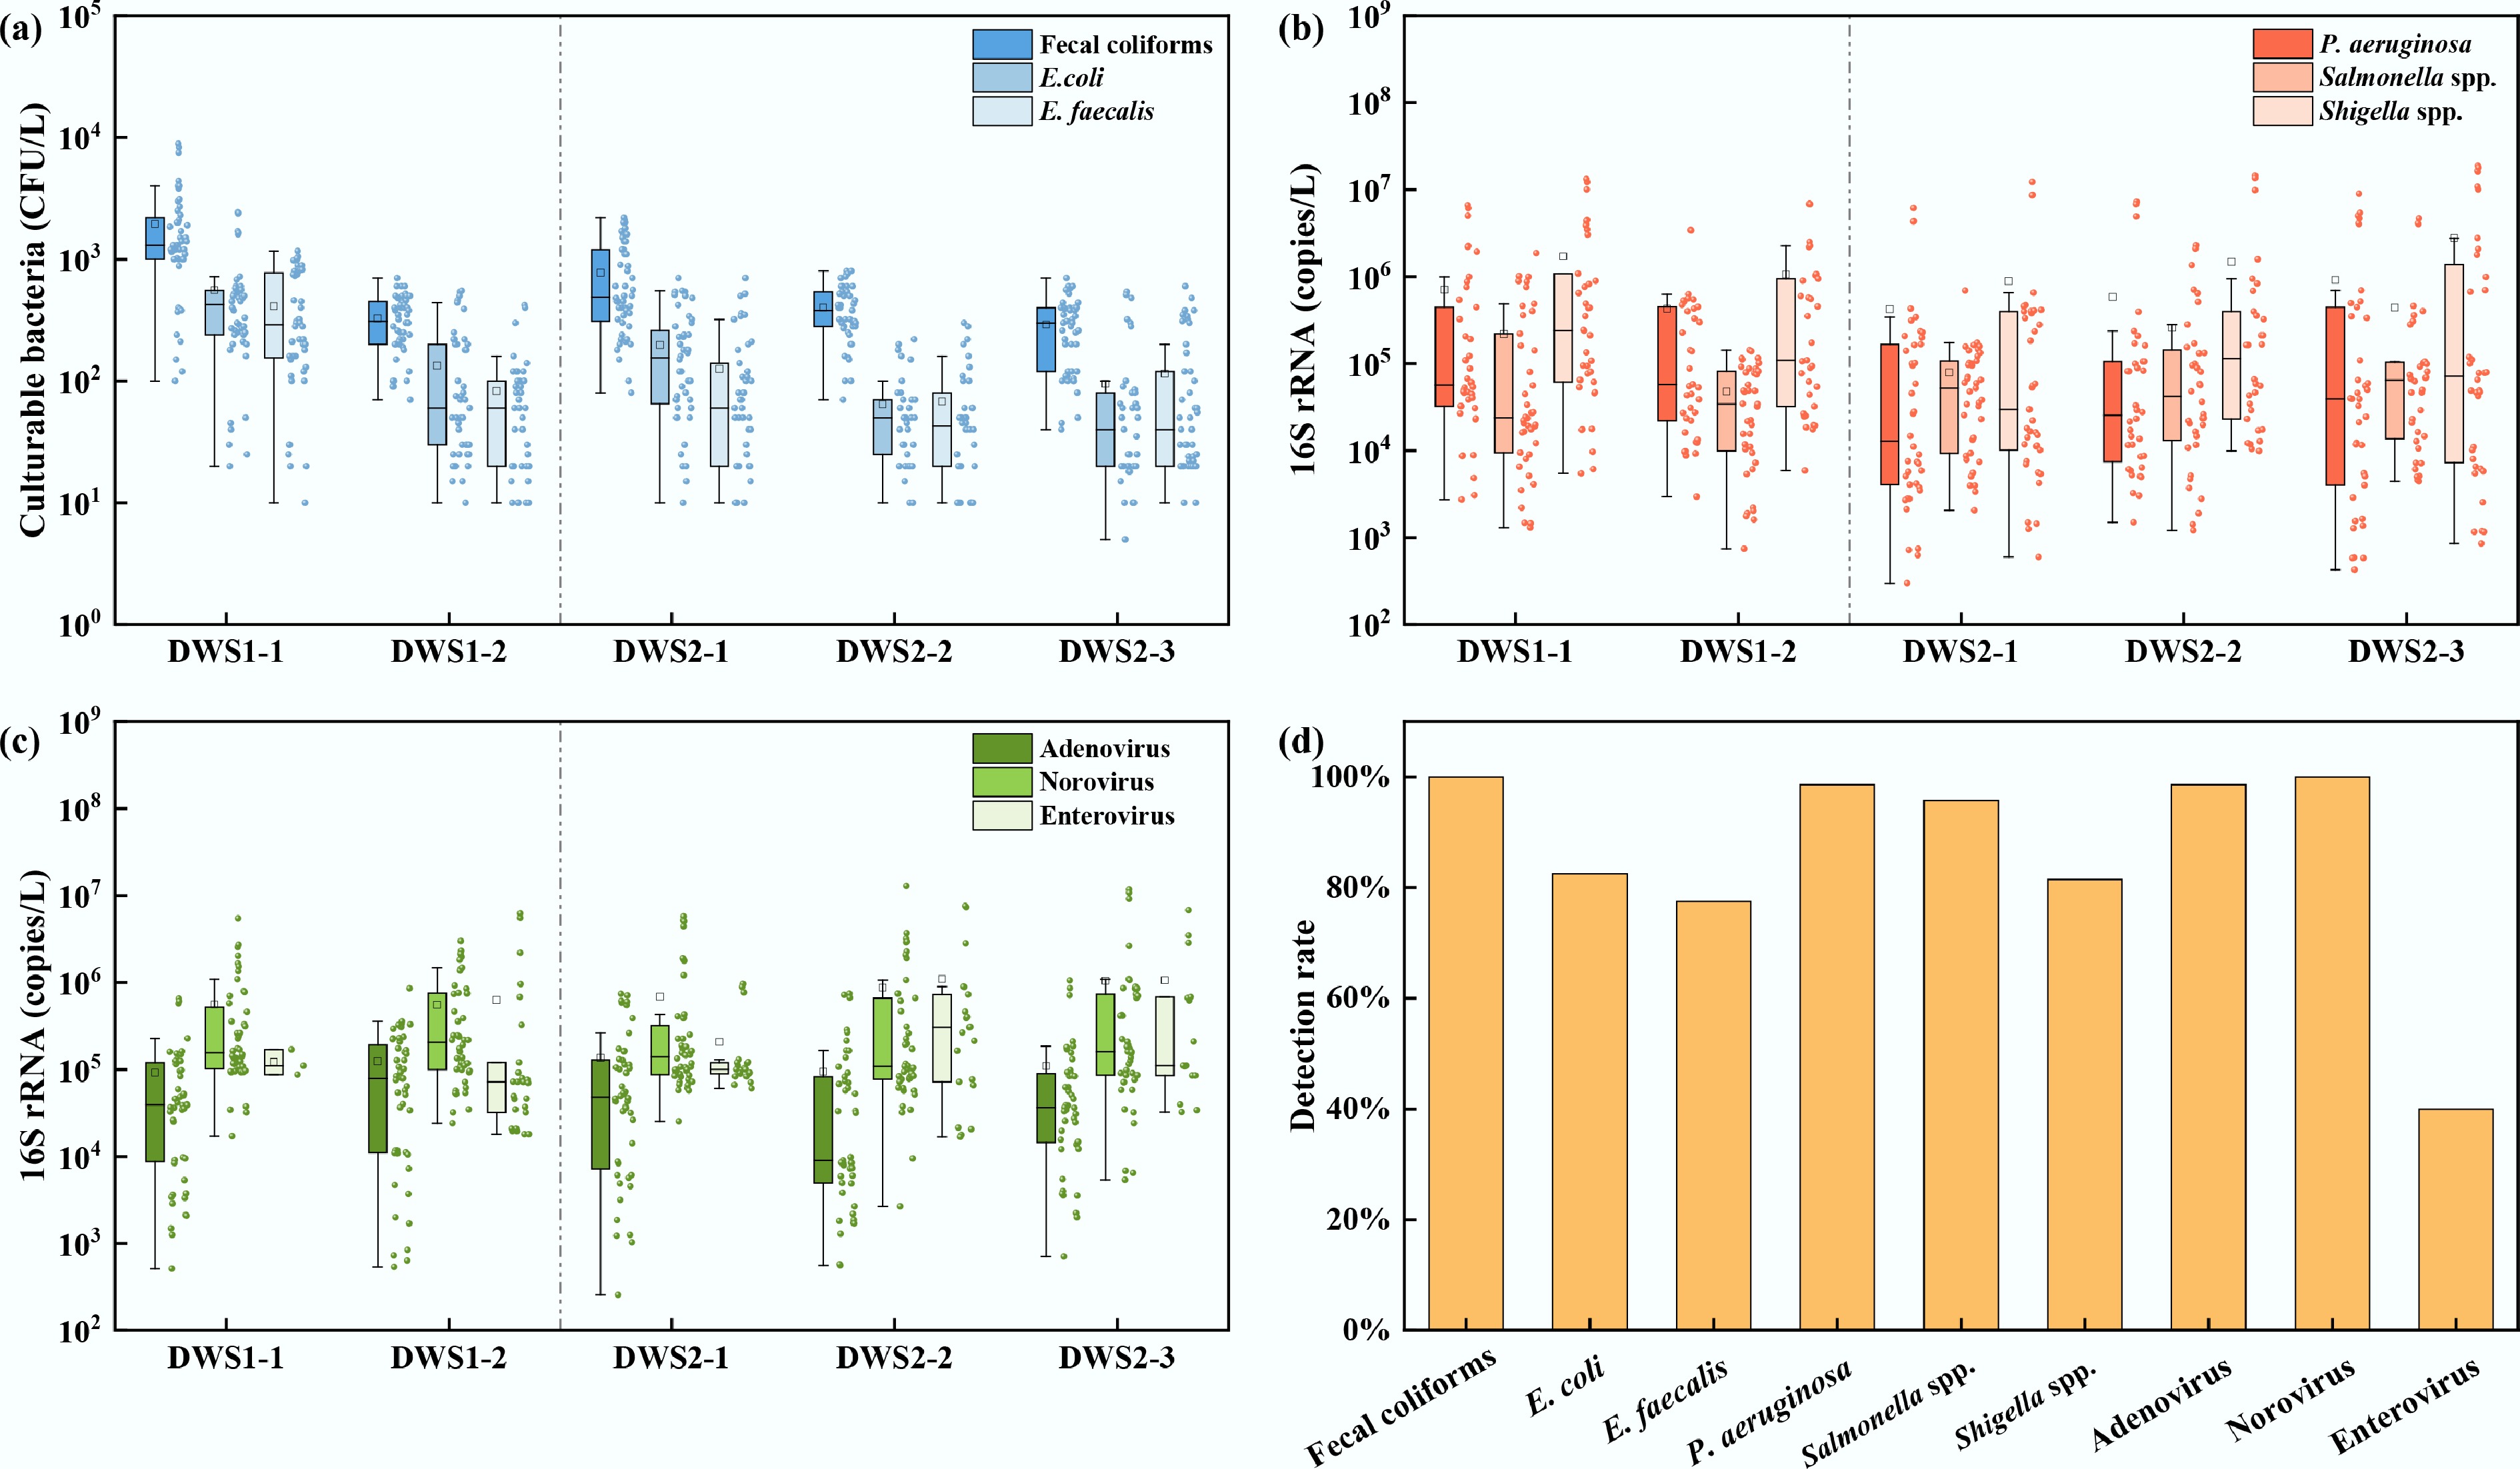
Figure 2.
Microbial distributions at DWS1 and DWS2. (a) Indicator bacteria: fecal coliforms, E. coli, and E. faecalis. (b) Pathogenic bacteria: P. aeruginosa, Salmonella spp., Shigella spp. (c) Viruses: Adenovirus, Norovirus, Enterovirus; and (d) detection frequency (%).
The contamination levels of pathogenic bacteria were shown in Fig. 2b. P. aeruginosa exhibited an 87.10% detection frequency, with concentrations ranging from n.d. to 8.97 × 10⁶ copies/L. Salmonella spp. was detected in 83.87% of samples, with concentrations from n.d. to 4.69 × 10⁶ copies/L, while Shigella spp. appeared in 73.12% of samples, ranging from n.d. to 1.88 × 10⁷ copies/L. In comparison, drinking water reservoirs in Singapore showed lower concentrations of P. aeruginosa (1.2 × 10²–8.5 × 10⁴ copies/L) and Salmonella spp. (1.2 × 10²–8.6 × 10² copies/L) than the present study[35]. These high detection frequencies indicate widespread inputs and persistence of multiple bacterial pathogens in raw source waters. In urbanized areas and catchments characterized by mixed land use, rainfall and stormwater runoff mobilize human and animal fecal wastes from sewer overflows, leaking septic systems, and agricultural manures into receiving waters, producing event-driven peaks in microbial loads.
The detection characteristics of viruses at DWS1 and DWS2 are shown in Fig. 2c. Adenovirus exhibited a 100% detection rate, with concentrations ranging from 2.56 × 10² to 1.06 × 10⁶ copies/L. Norovirus ranged from 2.68 × 10³ to 1.29 × 10⁷ copies/L. Enterovirus concentrations ranged from n.d. to 7.59 × 10⁶ copies/L, with a detection frequency of 39.78%. These results indicated a substantial viral load in the studied water sources. In comparison, Adenovirus was detected in 100% of samples from the Han and Yangtze Rivers, with concentrations ranging from 2.8 × 10³ to 1.1 × 10⁶ copies/L[36]. The detection frequencies of adenovirus, enterovirus, and norovirus in drinking water sources in Japan's Kanto region were 65.0%, 45.0%, and 45.0%, respectively, with concentrations ranging from 6.3 × 101 to 1.3 × 10⁶ copies/L, 4.0 × 10² to 2.0 × 10⁴ copies/L, and 6.3 × 10² to 6.3 × 10⁴ copies/L[37]. The frequent co-occurrence of bacterial and viral pathogens poses a notable threat to public health. Moreover, such co-occurrence suggests the potential for synergistic health consequences, thereby constituting a critical public health concern.
Correlation analysis of microbial concentrations
-
The correlation analysis among microbial concentrations is presented in Supplementary Fig. S1. There were significant correlations among fecal coliforms, E. coli, and E. faecalis (r = 0.45–0.67, p < 0.001), reflecting their common role as indicators of fecal contamination in water[38]. A notably strong correlation was also observed between P. aeruginosa and Salmonella spp. (r = 0.43, p < 0.01), suggesting potential co-occurrence or similar environmental origins. Goh et al.[35] reported a detectable correlation between Salmonella spp. and P. aeruginosa based on qPCR analysis (r = 0.313). In addition, significant correlations were observed between P. aeruginosa and adenovirus, norovirus, and enterovirus (r = 0.49, −0.36, and −0.67, respectively; all p < 0.01). Overall, the three FIB were mutually correlated, whereas their associations with viruses were generally weak or inconsistent, except for a few significant pairwise correlations. These results suggest that bacterial indicators may not serve as reliable universal surrogates for viral contamination. Previous studies have also shown that associations between pathogens, especially viruses, and FIB are often weak or inconsistent across watersheds and seasons[39,40]. Therefore, bacterial-only measurements may underestimate or mischaracterize viral contamination and the associated health risk.
P. aeruginosa is widespread in soils and freshwaters, where it can persistently colonize aquatic biofilms, sediments, and protozoan hosts[41−43]. However, under elevated organic and particulate loads, it may be released intermittently into the bulk water[44]. Consequently, concurrent increases with FIB during periods of heightened pollution are ecologically plausible. Importantly, P. aeruginosa is not strictly fecal in origin, but its environmental resilience and public-health relevance in water systems warrant consideration in risk discussions[45]. In contrast, viruses differ markedly from bacteria in environmental persistence, transport, and removal, resulting in asynchrony between viral and bacterial contamination indicators[46]. Therefore, monitoring and assessment should incorporate viral indicators or direct viral assays alongside bacterial measures to provide a more comprehensive and actionable appraisal of drinking-water health risks.
Machine learning model training, comparison, and selection
-
The study first established six baseline machine learning models for each microorganism using the monitoring data. Their predictive performance was compared using R2, MAE, and RMSE, as summarized in Supplementary Tables S6–S14. The comparison of R2, MAE, and RMSE values for six predictive models of different indicator bacteria and pathogens on the test sets is shown in Fig. 3. RF achieved the best performance for fecal coliforms, E. coli, E. faecalis, norovirus, and enterovirus, whereas DT performed best for P. aeruginosa and Salmonella spp., and MLP yielded the best results for Shigella spp. The best-performing model for each target was then selected and further optimised, with optimisation results reported in Supplementary Tables S15–S23. Tree-based models (DT and RF) achieved the best or near-best results for most targets, as indicated by higher R2 and lower RMSE and MAE. Elahi et al.[47] developed RF, gradient boosting regression, and other models to predict fecal indicator bacteria levels in water, and indicated that the RF model was the most promising solution for predicting fecal indicator bacteria levels. Kadoya et al.[48] developed a predictive model for viral removal efficiency in an anaerobic membrane bioreactor, and the results showed that the RF model outperformed the artificial neural network model, with better fitting performance and model stability.
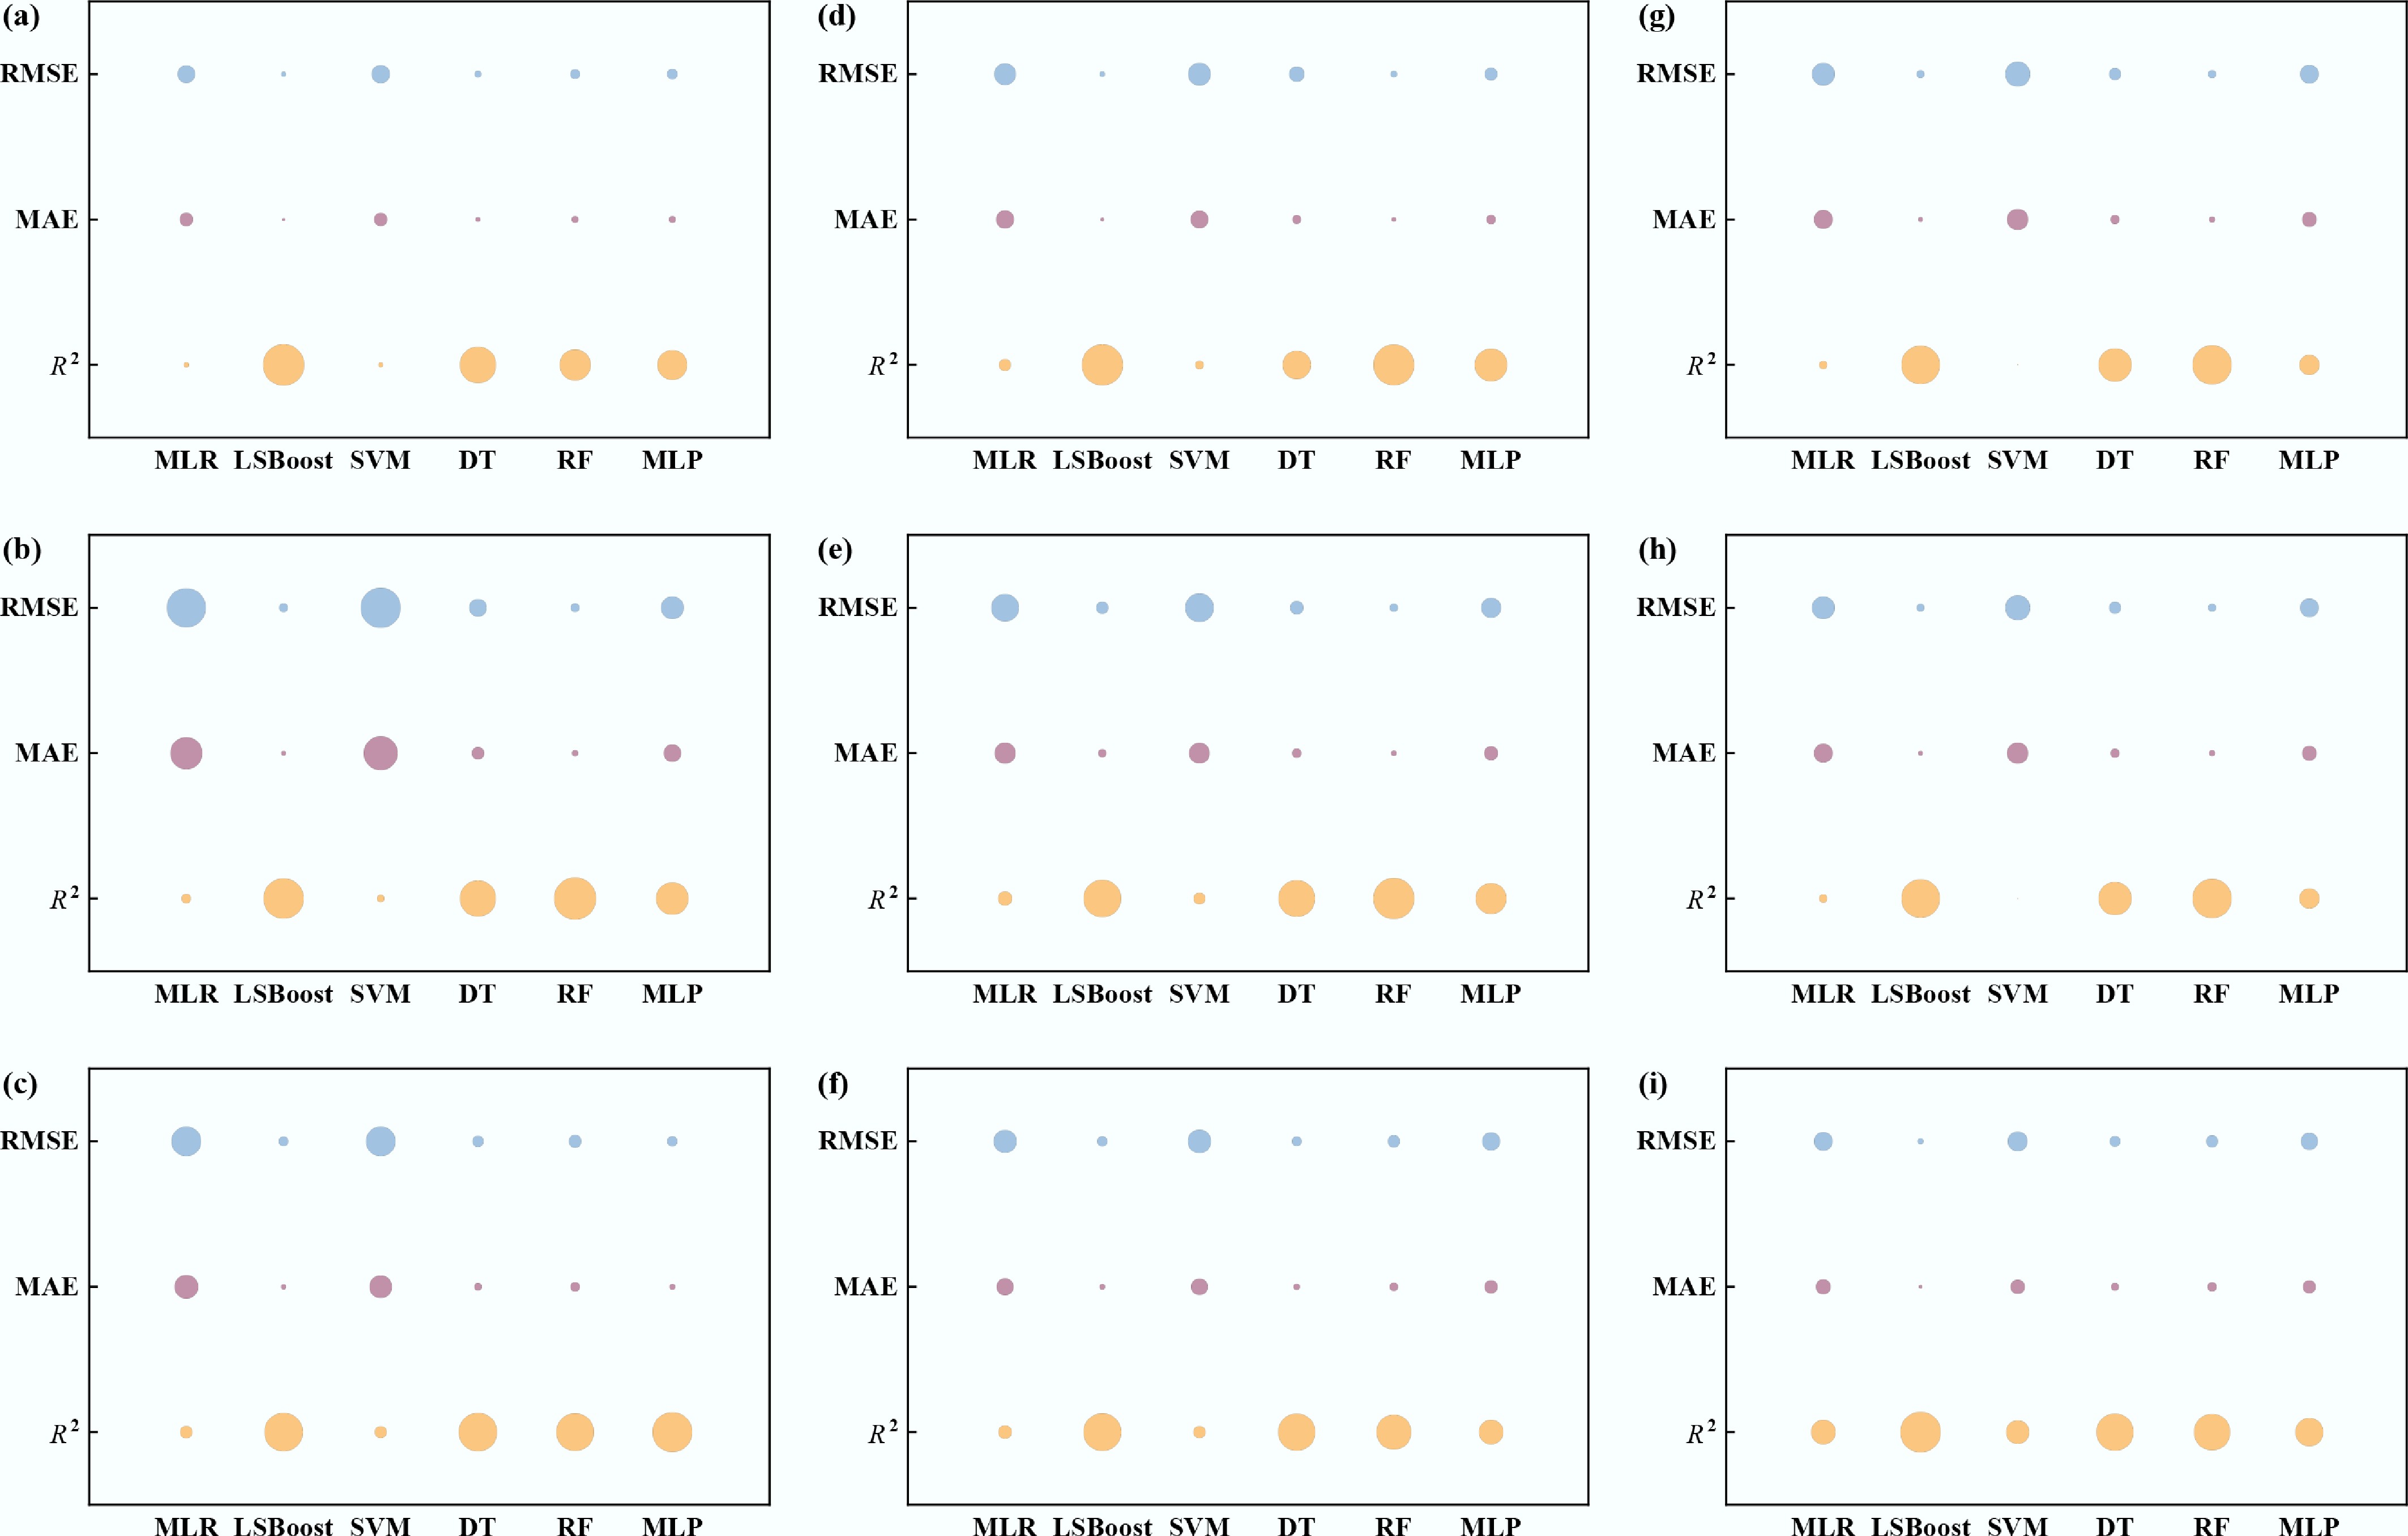
Figure 3.
Performance comparison of six machine learning models on test sets using bubble charts. (a) Fecal coliforms, (b) E. coli, (c) E. faecalis, (d) P. aeruginosa, (e) Salmonella spp., (f) Shigella spp., (g) Adenovirus, (h) Norovirus, and (i) Enterovirus. (Higher R2 and lower MAE/RMSE indicate better performance).
The cross-validation outcomes, as well as the training and testing results for each optimal model, are presented in Supplementary Figs S2–S19. The performance of the best-performing models for each microbial target across the training, validation, and test sets was summarized in Fig. 4 to provide a clearer comparison. According to Shayanfar & Shayanfar[49], a model with an R2 value greater than 0.6 is considered to have acceptable predictive ability, while models with R2 less than 0.6 are classified as 'bad models'. All models achieved R2 values above 0.75, and the scatter plots aligned closely with the 1:1 line, indicating that the models effectively capture variability in microbial concentrations and exhibit good model fit and strong generalization performance. DT demonstrated excellent predictive performance for P. aeruginosa (R2 > 0.90). Viral endpoints yielded slightly lower accuracy, particularly for enterovirus, likely due to lower ambient concentrations, more complex environmental fate, and greater measurement noise[20]. Despite the exclusion of socioeconomic and pollution emission indicators from the input feature set, the machine learning models applied in this study achieved reasonable accuracy in predicting microbial levels at DWS1 and DWS2 over short time scales, suggesting that water quality parameters alone can provide substantial predictive value.
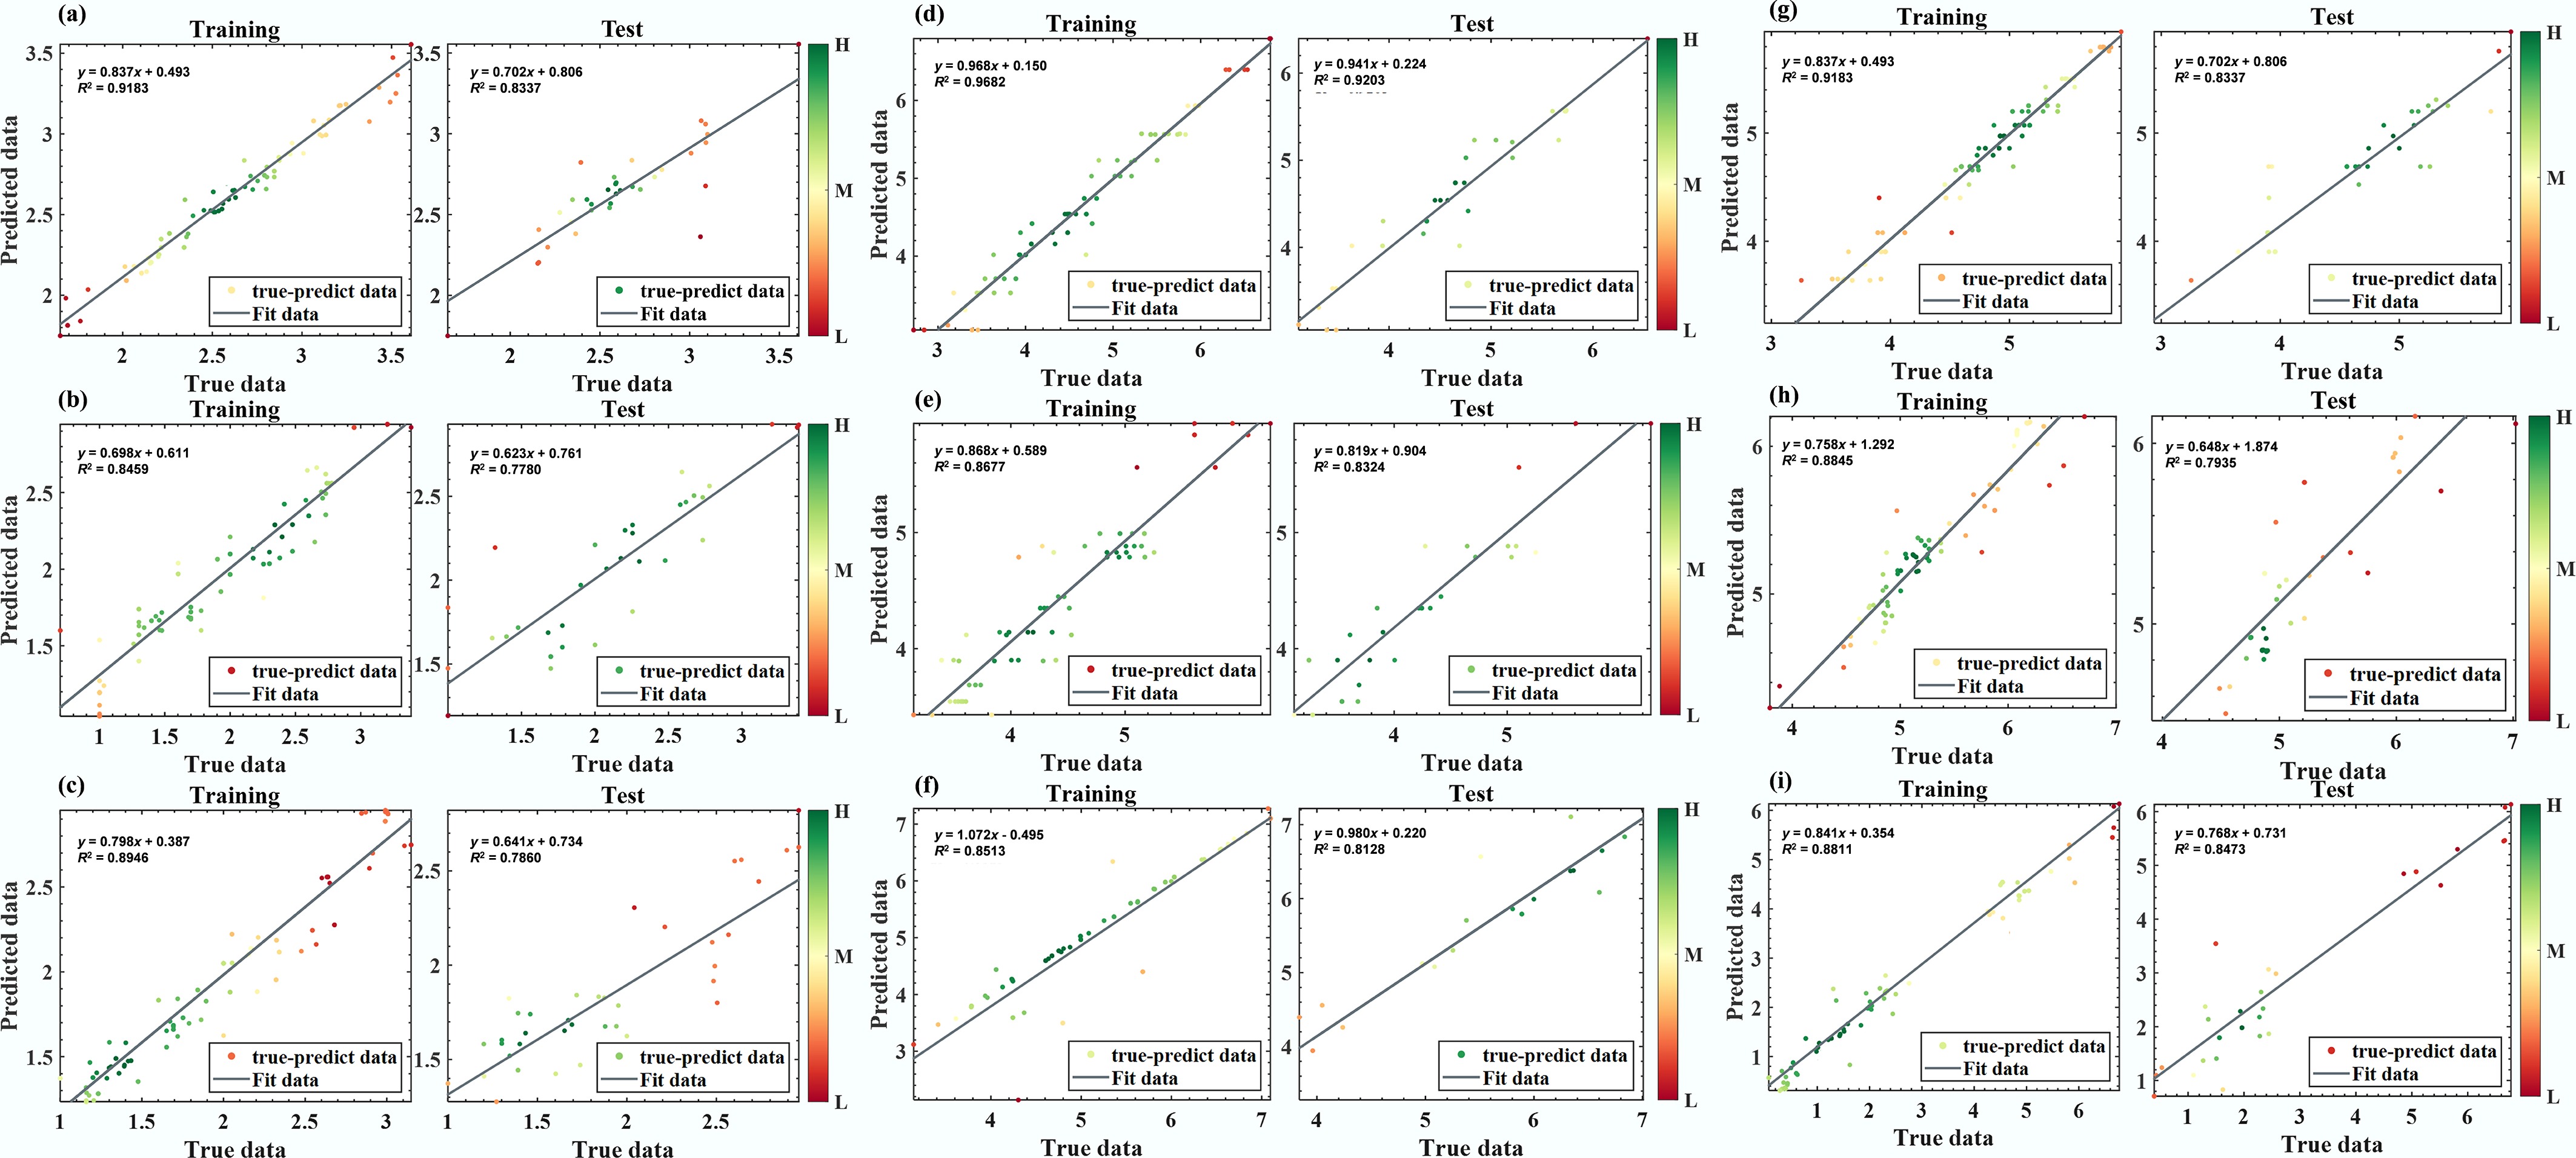
Figure 4.
Performance of optimal predictive models for each pathogen on the training and test sets. (a) RF-Fecal coliforms. (b) RF-E. coli. (c) RF-E. faecalis. (d) DT-P. aeruginosa. (e) DT-Salmonella spp. (f) MLP-Shigella spp. (g) DT-Adenovirus. (h) RF-Norovirus. (i) RF-Enterovirus.
Tree-based models (DT and RF) offer superior robustness and generalization for microbial concentration prediction on small-to-moderate datasets. Their advantage likely derives from aggregating weak learners to reduce variance and bias while capturing nonlinear relationships, thereby improving generalization. By contrast, the traditional MLR performed markedly worse across all targets, underscoring that relationships between microbial concentrations and environmental covariates are not well represented by simple linear forms[50]. Despite strong overall performance, several methodological considerations warrant discussion. Microbial–environment relationships likely involve threshold effects and interactions (e.g., rainfall-turbidity coupling), which are better captured by nonlinear ensembles[24,51]. This indicates that the models captured relatively stable relationships between routine water-quality covariates and microbial levels rather than site-specific noise, which is valuable for extending predictions to locations with limited monitoring. Because the models were developed and tested within the same monitoring framework, the present results should be interpreted as preliminary evidence of cross-site applicability rather than established transferability. Independent external validation using datasets from different watersheds, seasons, treatment contexts, and land-use settings is still required.
To further evaluate model generalizability, an independent temporal validation was conducted using data collected from January to February 2026, which were not used for model training, hyperparameter tuning, or test-set evaluation. As shown in Supplementary Fig. S20, most predicted values were close to the x = y reference line and fell within the ±1 log accuracy range, indicating good agreement on the independent dataset. The indicator bacteria models showed the most stable performance, with ±1 log accuracy values of 100%, 100%, and 90% for fecal coliforms, E. coli, and E. faecalis, respectively. Model performance varied among pathogens and viruses, with better prediction for Salmonella spp., P. aeruginosa, and enterovirus, but greater uncertainty for Shigella spp., adenovirus, and norovirus. Overall, the independent validation supports the cross-period generalizability of the models for most microorganisms, while further optimization is needed for pathogens with low detection rates or strong spatiotemporal variability.
Model-based framework for microbial risk assessment
-
The directly calculated DALYs and sensitivity analysis for the six pathogens are summarized in Fig. 5. The potential health risks associated with different pathogens were shown in Fig. 5a. In the QMRA, exposure was assumed to occur exclusively via drinking-water ingestion, and the DALYs attributable to P. aeruginosa, Salmonella spp., and Shigella spp. ranged from 3.39 × 10⁻¹² to 1.42 × 10⁻¹⁰, 9.27 × 10⁻⁸ to 2.73 × 10⁻⁶, and 2.50 × 10⁻⁷ to 7.82 × 10⁻⁶ DALYs pppy, respectively. For adenovirus, norovirus, and enterovirus, the estimated DALYs ranged from 5.51 × 10⁻⁹ to 1.77 × 10⁻⁷, 7.19 × 10⁻⁹ to 2.29 × 10⁻⁷, and 5.80 × 10⁻⁸ to 2.21 × 10⁻⁶ DALYs pppy, respectively. Overall, DALYs for most pathogens were below the WHO tolerable risk benchmark (≤ 10−6 DALYs pppy). However, Salmonella spp., Shigella spp., and enterovirus showed probabilities of 31.68%, 59.70%, and 20.86% of exceeding the WHO benchmark, indicating that non-negligible health risks may still occur under unfavorable exposure conditions. Among the assessed pathogens, P. aeruginosa posed the lowest potential health risk (10−10 DALYs pppy). This may be because P. aeruginosa is an opportunistic pathogen, and its health risk tends to increase substantially only under specific conditions in certain settings (e.g., drinking-water distribution systems), such as biofilm development and insufficient disinfectant residual[52,53]. The pronounced dispersion in boxplots for Salmonella spp., Shigella spp., and norovirus highlights uncertainties driven by environmental variability and model parameters. To improve assessment robustness, future research should employ high-frequency monitoring and scenario-specific modeling to account for spatiotemporal heterogeneity.
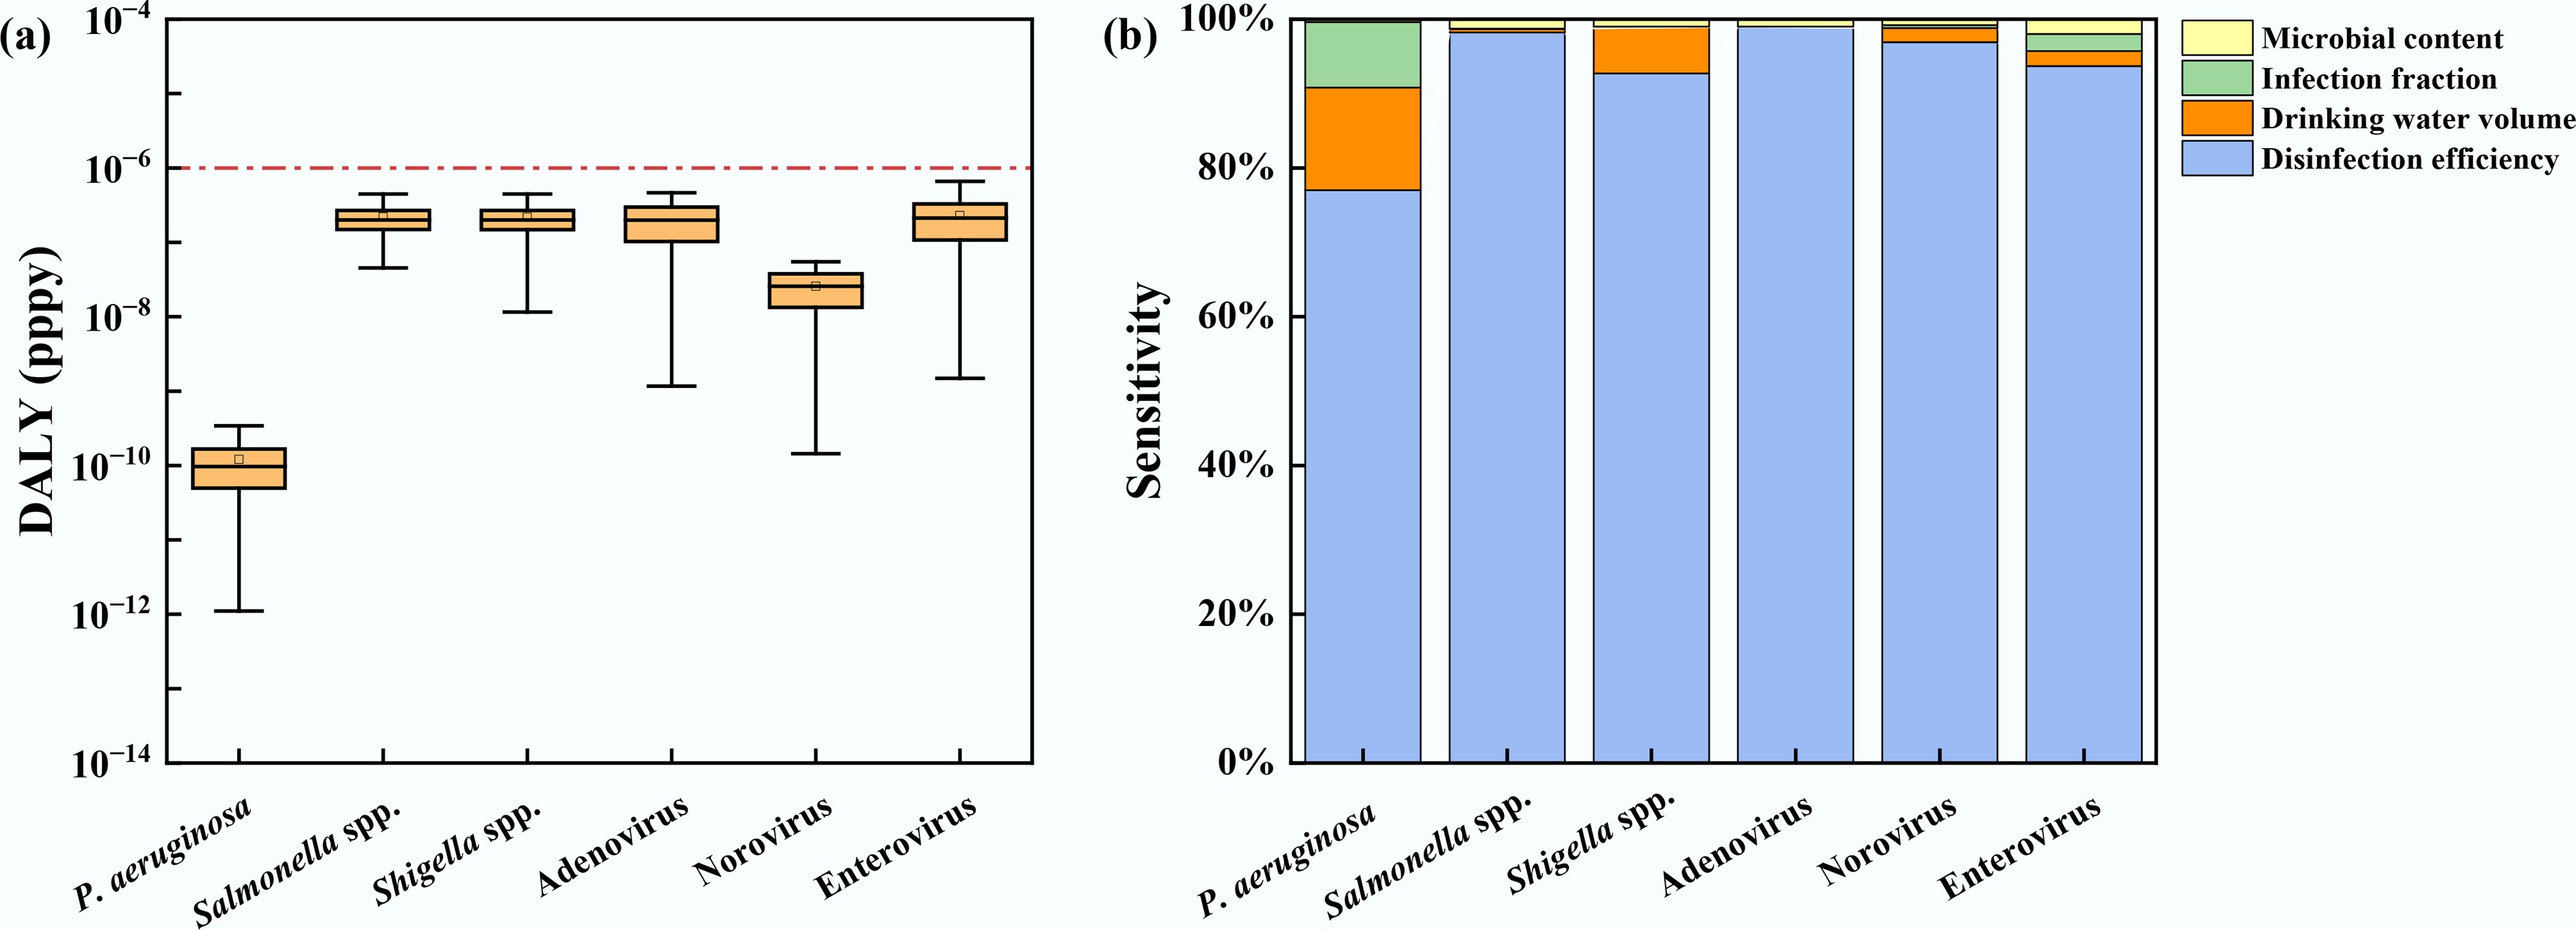
Figure 5.
(a) Risk assessment, and (b) sensitivity analysis of pathogens in drinking water sources.
The sensitivity contributions of key QMRA input parameters are presented in Fig. 5b. Disinfection efficiency was the predominant driver of risk for all pathogens, indicating that treatment performance dictates the variance in health risk. This underscores that maintaining disinfection stability is critical for risk control[54,55]. Key factors include optimizing contact time and managing operational fluctuations. While drinking water volume also influences risk levels due to individual behavior, the contributions of infection fraction and microbial content remain minimal. The latter's limited impact likely results from the dominance of the disinfection factor within the current data range. However, its importance may rise significantly if extreme events, such as runoff-induced pollution spikes, are integrated into the analysis.
The directly calculated and ML-QMRA-predicted DALY distributions were further compared (Fig. 6). Overall, the predicted distributions showed good agreement with the directly calculated distributions, indicating that the proposed framework can translate predicted pathogen concentrations into risk estimates with reasonable consistency. For P. aeruginosa, both curves almost completely overlapped and remained far below the WHO benchmark (10−6 DALYs pppy), confirming consistently low risk under the ingestion-only scenario. In contrast, Salmonella spp., Shigella spp., and enterovirus showed distributions closer to the benchmark, where small deviations between fitted and true curves around the steep transition region may translate into uncertainty in exceedance probabilities. Viral endpoints generally exhibited good agreement but with slightly more sensitivity around the inflection region, consistent with multi-factor control of viral variability. This pattern suggests that viral risk estimates may be more sensitive to combined environmental and model-related variability. The ML-QMRA framework provided a feasible data-driven approach for translating predicted pathogen concentrations into potential health risk estimates using routine water quality indicators. However, the increased uncertainty near the WHO benchmark, particularly for Salmonella spp., Shigella spp., and norovirus under high-risk scenarios, indicates that broader data coverage and targeted model refinement are needed to better constrain tail-risk estimates.
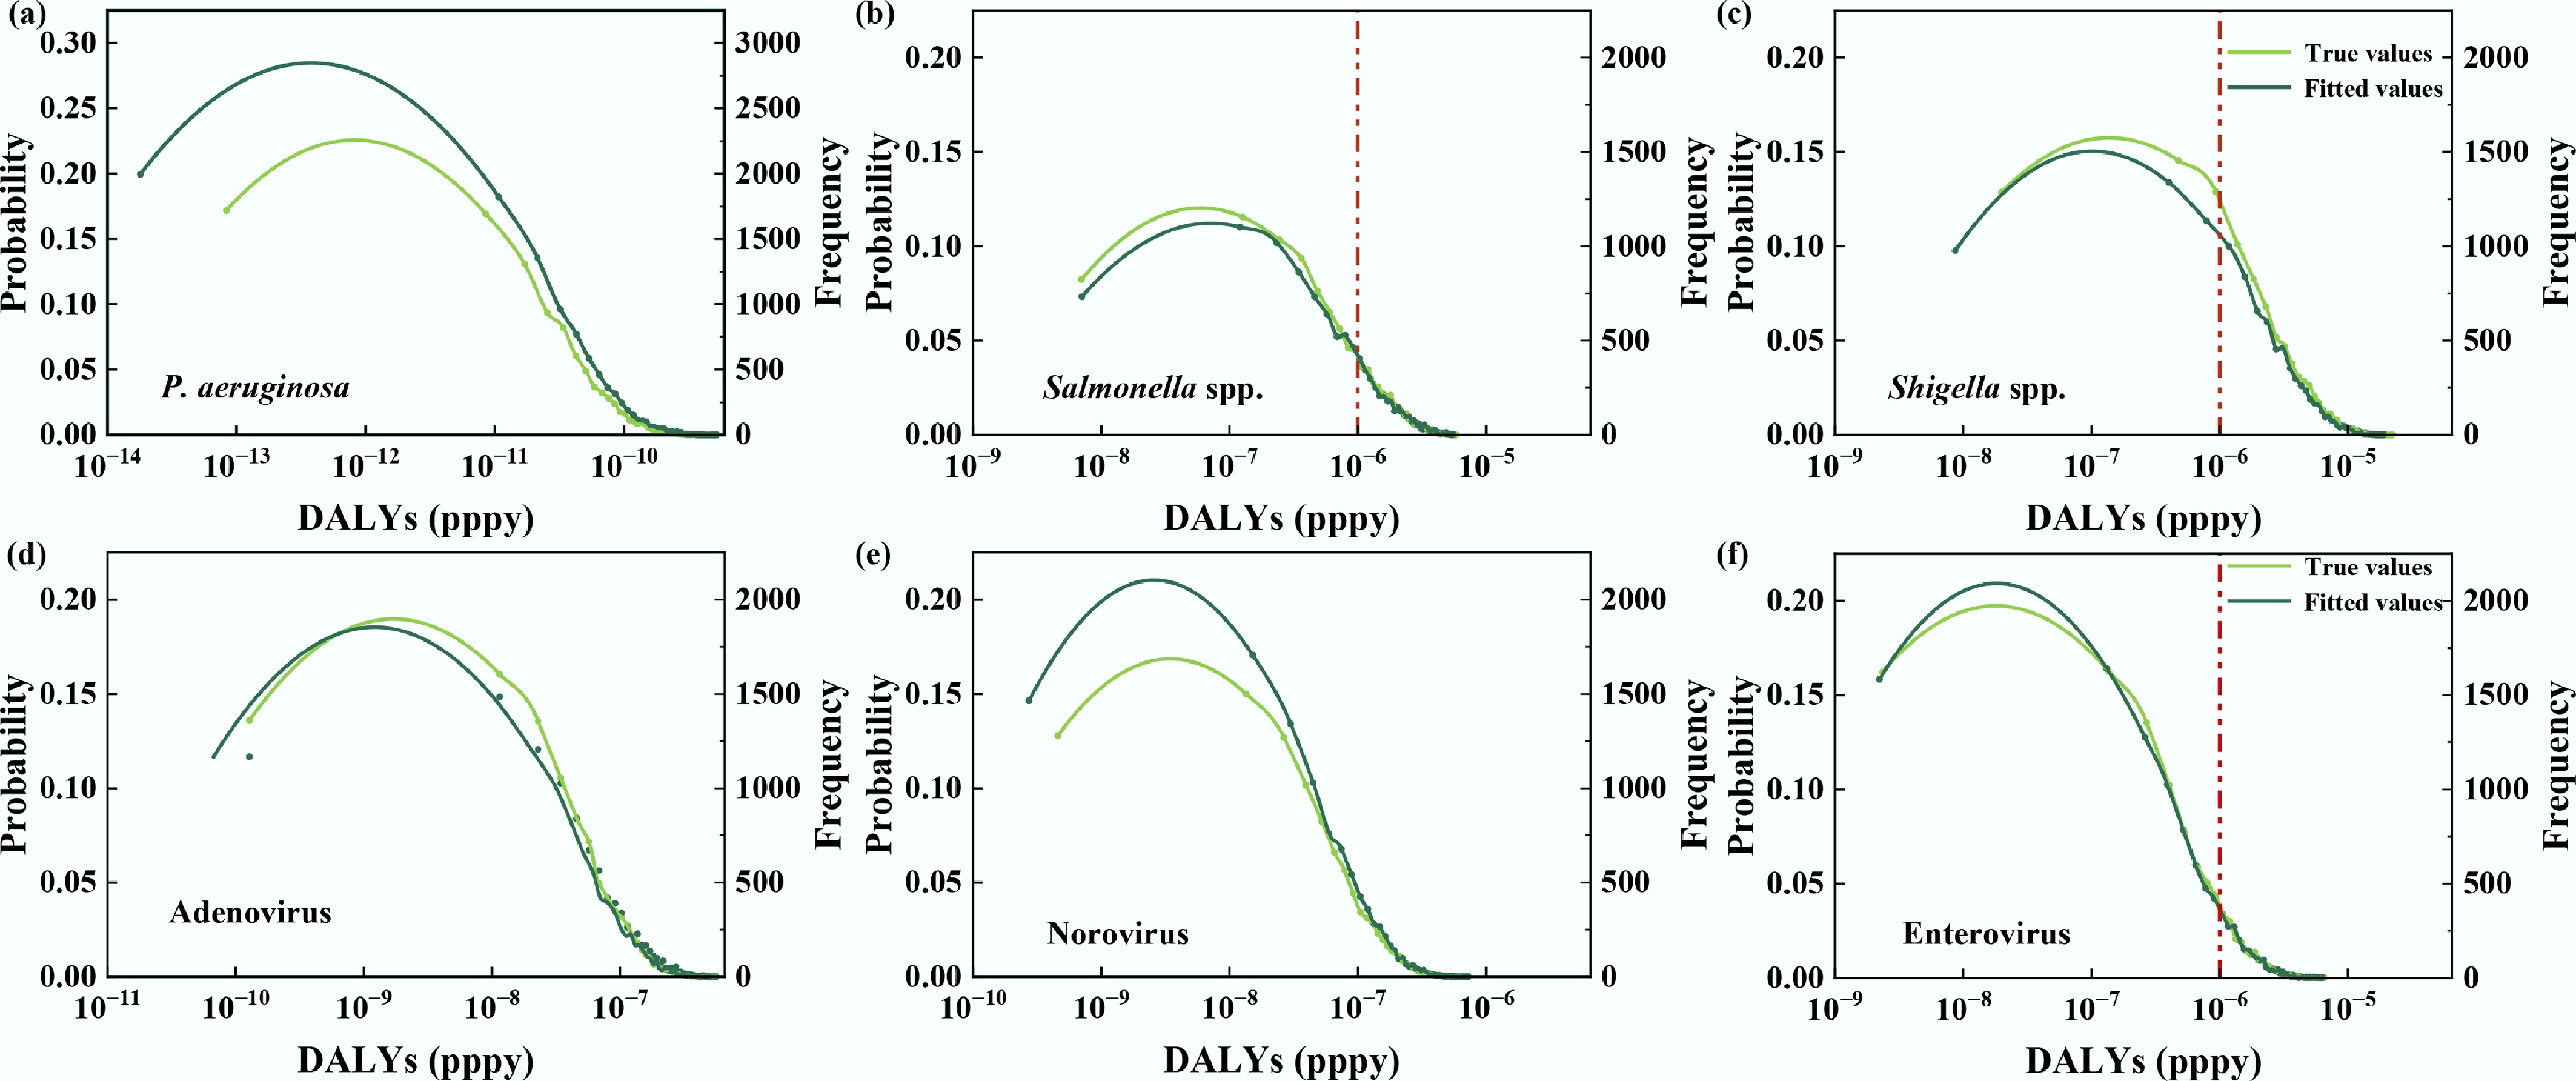
Figure 6.
Comparison of directly calculated and predicted disability-adjusted life years (DALYs) for six pathogens via drinking water exposure using Monte Carlo simulation. (a) P. aeruginosa, (b) Salmonella spp., (c) Shigella spp., (d) Adenovirus, (e) Norovirus, and (f) Enterovirus.
It should be noted that the QMRA results were based on pathogen concentration data derived from nucleic-acid-based detection and simplified exposure assumptions. In the dose-response assessment, the conversion relationships between genome copies and the dose units used in clinical dose-response models were considered, as summarized in Supplementary Table S4. Nevertheless, nucleic acid-based detection quantifies genetic signals and may not fully distinguish infectious organisms from non-infectious or inactivated ones. In addition, drinking-water ingestion was considered as the sole exposure pathway to provide a simplified and comparable assessment scenario, while other potential exposure routes were not included. Therefore, future studies should incorporate infectivity-based measurements and more comprehensive exposure scenarios to further improve the accuracy of microbial risk estimation.
Interpretation of SHAP analysis of water quality variables
-
The ranking of feature contributions in microbial prediction models based on SHAP analysis is displayed in Fig. 7. In the models for fecal coliforms, E. coli, and E. faecalis, turbidity consistently ranked among the most important predictors (41.6%–62.1%), with a particularly pronounced contribution in the E. coli and E. faecalis models, indicating that turbidity was an influential predictor for indicator-bacteria prediction. Li et al.[56] developed E. coli prediction models based on LightGBM and XGBoost, and both models indicated that lake turbidity was the most important predictor. In contrast, the predictor structures of the pathogenic bacterial models differed more markedly. For P. aeruginosa, temperature showed the highest predictive contribution, consistent with previous studies suggesting that warm water conditions may favor its survival and proliferation[57]. Whereas the Salmonella spp. model showed combined contributions from dissolved oxygen, relative humidity, rainfall, and water-chemistry variables. The Shigella spp. model showed a more complex nonlinear contribution pattern, consistent with the selection of MLP as its best-performing model. For viruses, adenovirus predictions were mainly associated with water temperature, while norovirus and enterovirus predictions were mainly associated with turbidity, temperature, and other water-quality-related variables. Feature contributions in the viral models were more dispersed, suggesting that viral predictions were influenced by multiple predictors and that the explanatory contribution of any single variable was relatively limited.
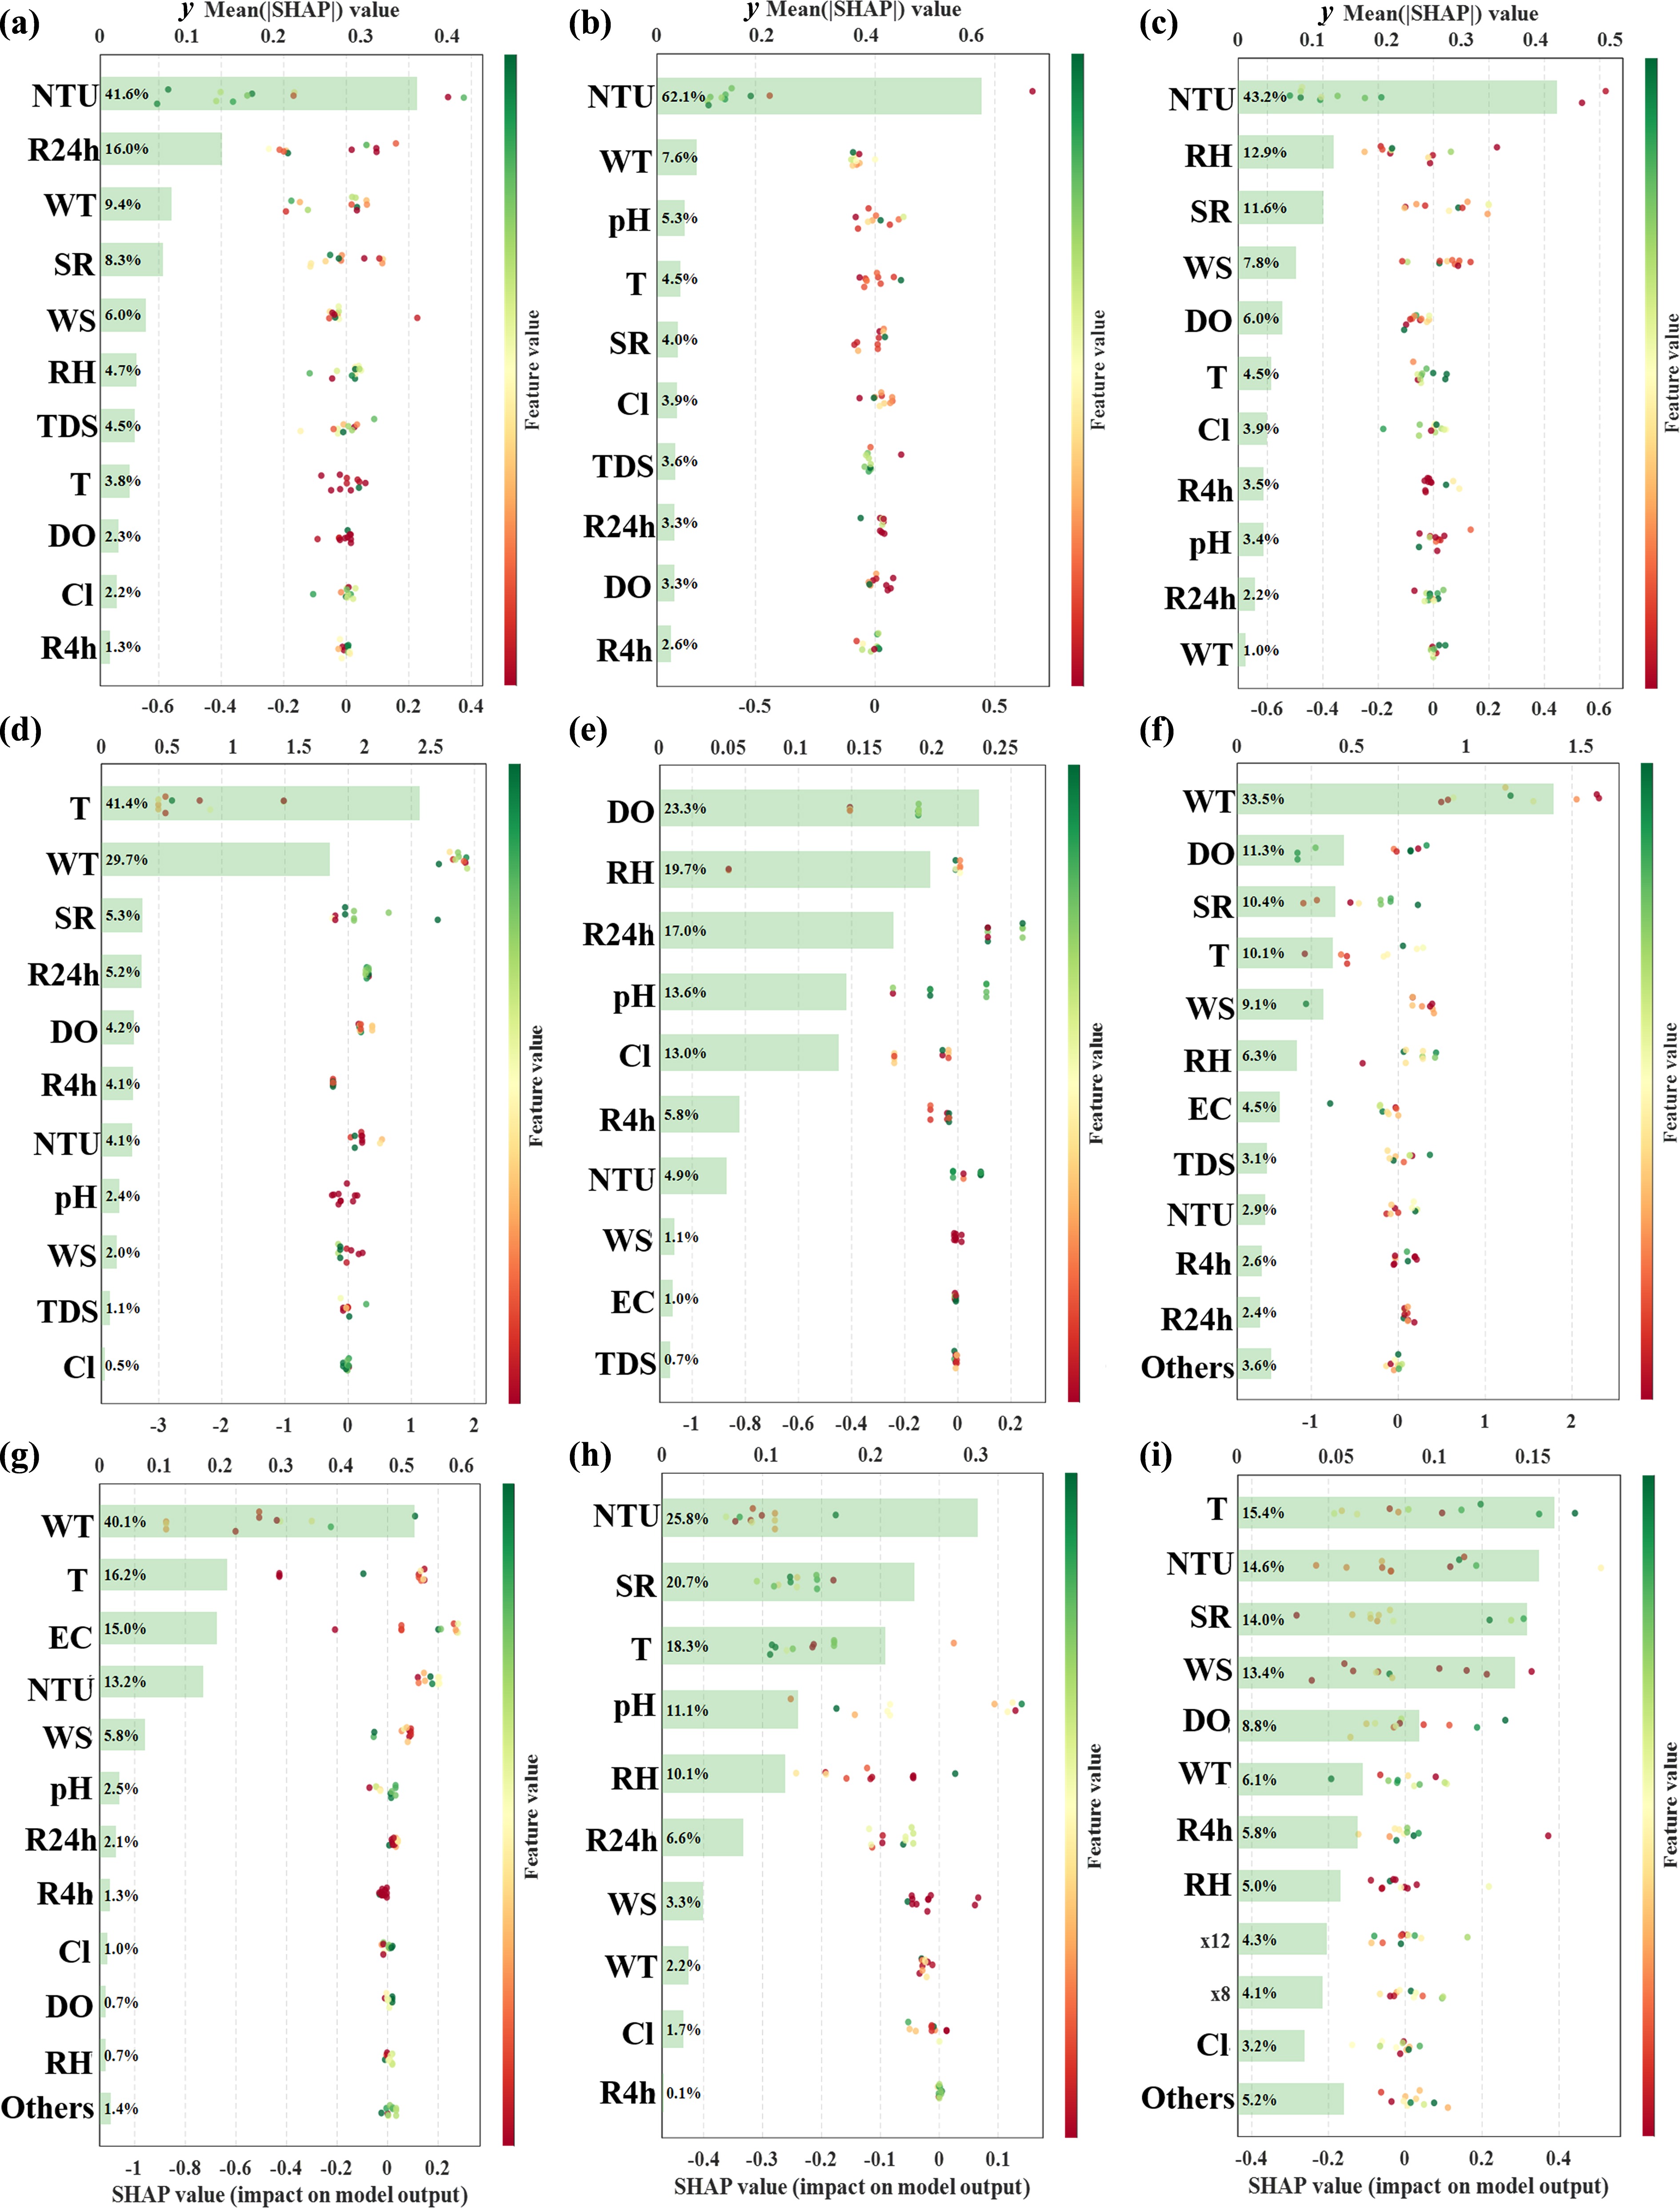
Figure 7.
SHAP value ranking of optimal predictive models for different pathogens. (a) Fecal coliforms, (b) E. coli, (c) E. faecalis, (d) P. aeruginosa, (e) Salmonella spp., (f) Shigella spp., (g) Adenovirus, (h) Norovirus, and (i) Enterovirus.
Although the salient features vary among models, water-quality variables generally dominate in predictive importance[57,58]. This pattern likely reflects the direct role of physicochemical parameters such as pH, turbidity, and dissolved oxygen in shaping the aquatic environment. For example, temperature is a primary regulator of microbial metabolism and enzyme activity[59]. Water temperature also influences the biodegradation of organic matter, which supplies substrates for FIB and modulates their growth rates[60]. Suspended solids may leach nutrient constituents that promote bacterial proliferation[61]. Increases in particulate matter can then stimulate bacterial growth[62,63]. By contrast, meteorological variables such as air temperature, precipitation, wind speed, and solar radiation tend to affect microbes more indirectly and at broader scales. Although higher air temperatures can accelerate microbial metabolism and reproduction[64] and precipitation can alter influent composition by changing loads of suspended solids and particle-associated nutrients[65], these effects typically manifest through modifications of in situ water conditions rather than acting directly on microorganisms.
It should be noted that SHAP quantifies feature contributions within the learned predictive mapping and does not imply causality. Correlated covariates (e.g., EC and TDS) may share or shift importance across models[66]. Moreover, several 'water-quality' predictors likely act as proxies for source inputs and transport processes (e.g., runoff-driven loading or sediment resuspension) rather than directly regulating microbial physiology[67,68]. Future work could examine SHAP dependence/interaction patterns and test the stability of feature rankings via resampling or site-grouped validation to strengthen the mechanistic interpretation and generalizability.
-
This study collected systematic monitoring data on indicator bacteria and pathogens, based on which a framework integrating machine learning with QMRA was successfully developed. This framework offered a scalable and interpretable predictive approach for assessing the potential health risks in drinking water sources, allowing predicted microbial concentrations to be translated into understandable health risk outcomes. The study found that among the six machine learning models tested, DT and RF models were more suitable for predicting microbial contamination levels, highlighting the advantages of ensemble learning algorithms in handling complex, non-linear environmental data. Further SHAP interpretability analysis showed that predictions for indicator bacteria were predominantly driven by turbidity, while pathogen predictions were primarily influenced by factors such as temperature and dissolved oxygen. In future research, the models still require external validation across broader spatiotemporal scales and on independent datasets. Embedding this framework into real-time monitoring platforms, combining scenario-based QMRA with threshold-driven intervention strategies, will support refined water safety management.
-
It accompanies this paper at: https://doi.org/10.48130/biocontam-0026-0009.
-
Not applicable.
-
The authors confirm their contributions to the paper as follows: Bingbing Guo: writing − original draft, data curation, methodology, visualization; Jing Wang: methodology, visualization; Chicheng Yan: methodology, visualization; Chao Tang: methodology; Kun Yin: visualization; Lei Jiang: resources; Changzheng Cui: resources, writing − review and editing. All authors reviewed the results and approved the final version of the manuscript.
-
The datasets used or analyzed during the current study are available from the corresponding author on reasonable requests.
-
This study was funded by the National Key Research and Development Program of China (Grant No. 2023YFC3205800) and the Fundamental Research Funds for the Central Universities.
-
The authors declare that they have no known competing financial interests or personal relationships that could have appeared to influence the work reported in this paper.
-
Full list of author information is available at the end of the article.
- The supplementary files can be downloaded from here.
- Copyright: © 2026 by the author(s). Published by Maximum Academic Press, Fayetteville, GA. This article is an open access article distributed under Creative Commons Attribution License (CC BY 4.0), visit https://creativecommons.org/licenses/by/4.0/.
-
About this article
Cite this article
Guo B, Wang J, Yan C, Tang C, Yin K, et al. 2026. A machine learning-quantitative microbial risk assessment (ML-QMRA) framework for predicting potential health risks from pathogens in drinking water sources. Biocontaminant 2: e012 doi: 10.48130/biocontam-0026-0009 

A machine learning-quantitative microbial risk assessment (ML-QMRA) framework for predicting potential health risks from pathogens in drinking water sources
- Received: 12 April 2026
- Revised: 20 May 2026
- Accepted: 11 June 2026
- Published online: 10 July 2026
Abstract: Pathogens in drinking water sources are diverse and pose potential health risks, yet rapid monitoring and risk assessment remain challenging. This study established detection methods for three indicator bacteria and six pathogens, and compared six machine learning models to develop a machine learning-quantitative microbial risk assessment (ML-QMRA) framework for assessing the potential health risks of microbial contamination. The framework provided a feasible data-driven approach for predicting the potential health risks posed by pathogens using routine water quality indicators. Water samples were collected monthly from May 2024 to December 2025, with pathogen concentrations typically ranging from 103 to 106 copies/L. Correlation analysis revealed weak associations between pathogens and indicator bacteria (p > 0.05). Among the six machine learning models, Random Forest and Decision Tree showed better performance. Overall, the predictive models achieved good agreement with the observed data for all pathogens (R2 > 0.75). Notably, the Decision Tree model demonstrated excellent predictive performance for Pseudomonas aeruginosa (P. aeruginosa, R2 > 0.90). SHapley Additive exPlanations (SHAP) analysis was applied to interpret the influence of variables on model predictions, revealing that models for indicator bacteria were primarily influenced by water temperature and turbidity, while TDS and electrical conductivity were the most influential predictors of adenovirus. The findings indicate that conventional water quality parameters show useful predictive potential for estimating pathogen levels and associated potential health risks.
-
Key words:
- Pathogen /
- Drinking water source /
- Machine learning /
- QMRA /
- SHapley Additive exPlanation