-
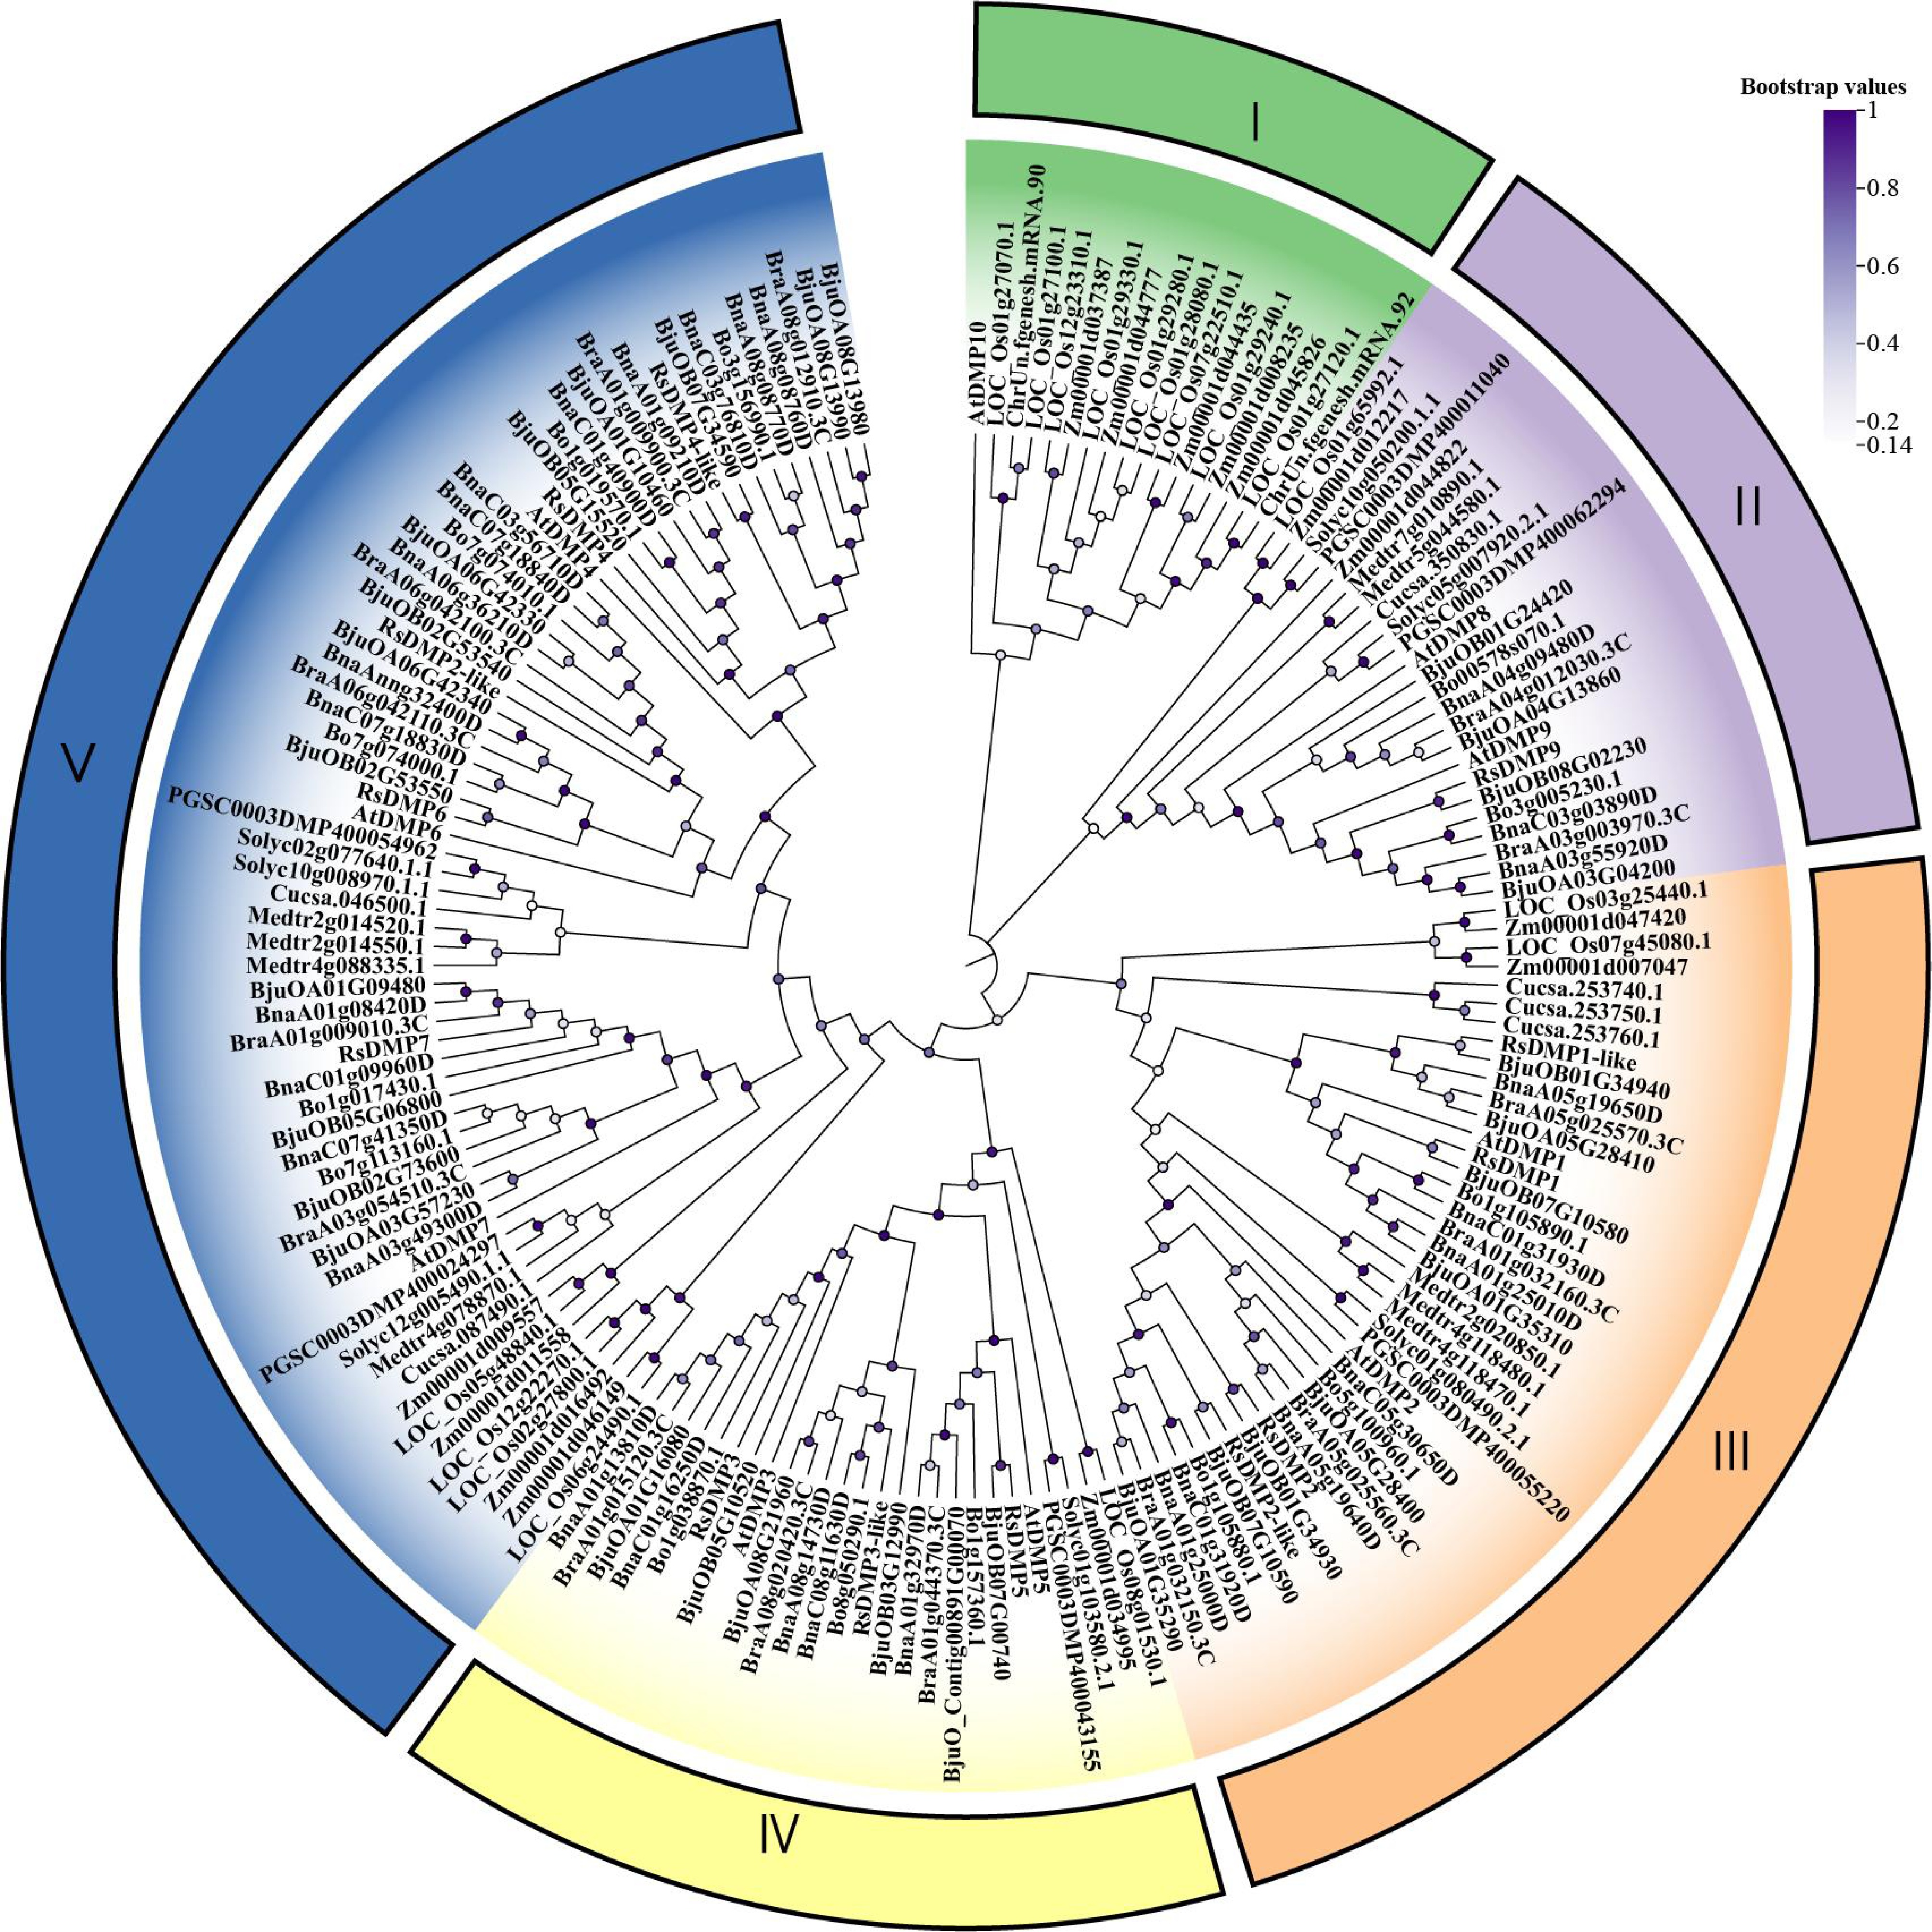
Figure 1.
Phylogenetic relationships of DMP among 12 plant species. The DMP protein were divided into five clades, represented by colors. Bootstrap values are shown on the nodes. For accession ID details of the genes, refer to Supplementary Table S10.
-
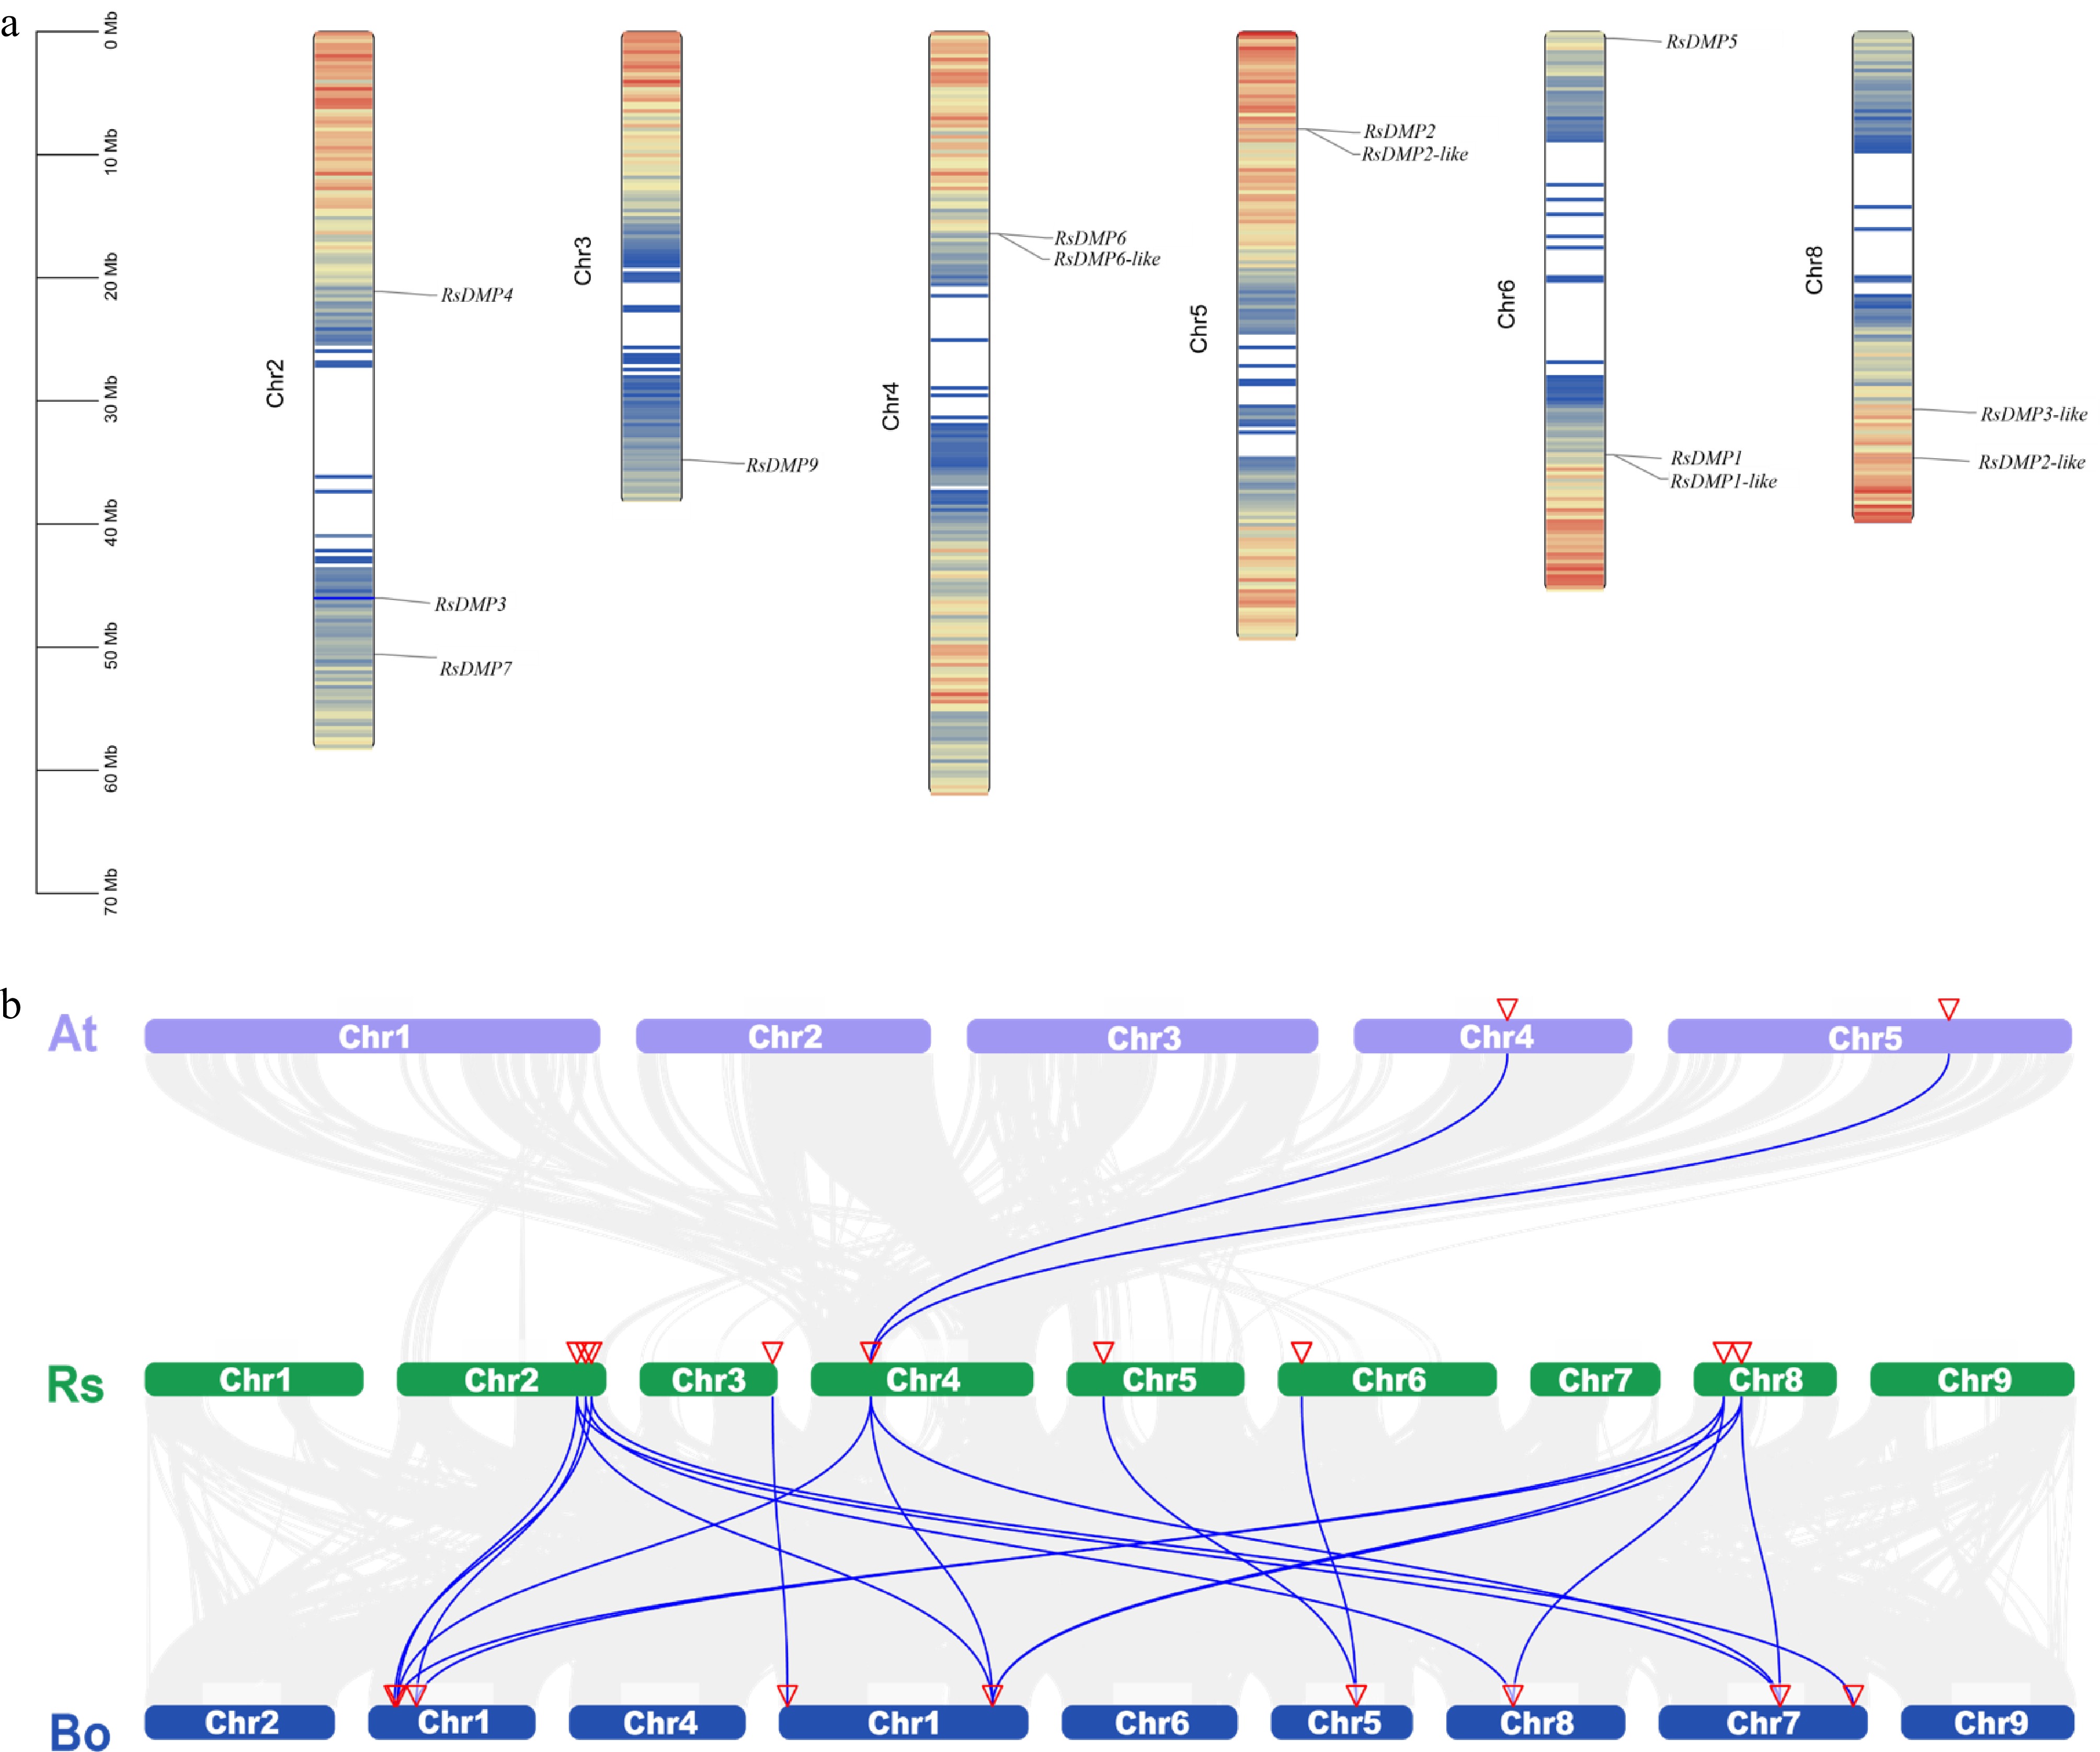
Figure 2.
Chromosomal locations and collinearity of DMP genes. (a) DMP chromosome mapping. The DMP genes of radish were distributed on six chromosomes. Mb, megabase. (b) Collinearity analysis among Raphanus sativus (Rs), Arabidopsis thaliana (At), and Brassica oleracea (Bo). Blue lines indicate collinear gene pairs.
-
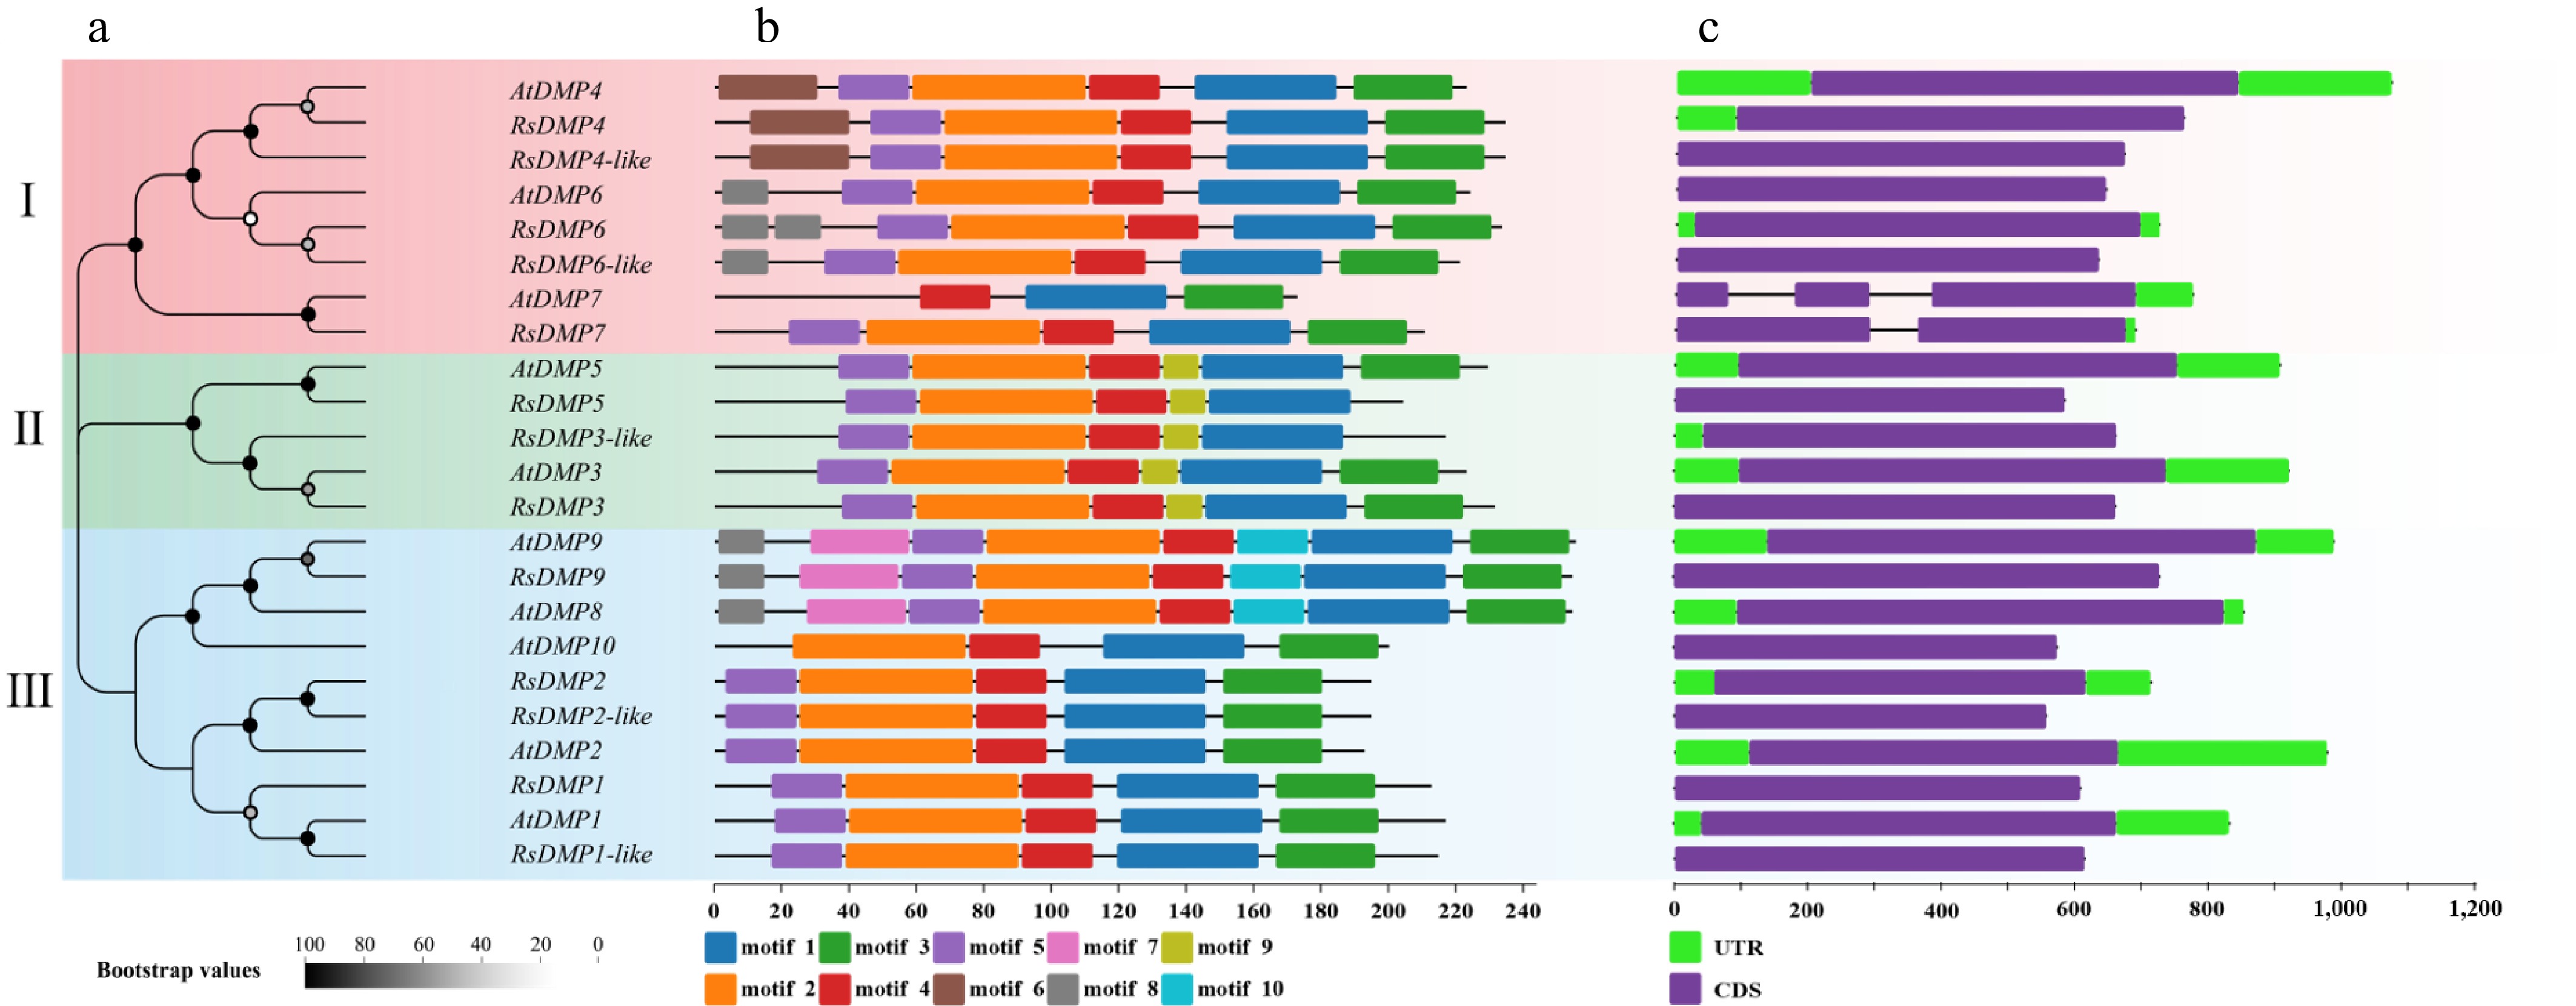
Figure 3.
Gene structure and motif distribution of RsDMP and AtDMP genes. (a) Constructing phylogenetic trees of RsDMP genes and AtDMP genes using MEGA 11 based on the NJ method. (b) Schematic diagram of the conserved motifs of RsDMP and AtDMP proteins. The motifs 1 to 10 are highlighted with different colored boxes. For the details of each motif, refer to Supplementary Table S2. (c) Distribution of structure for each RsDMP and AtDMP gene. The purple boxes represent CDS, the green boxes indicate an untranslated region, and the black line represents introns.
-
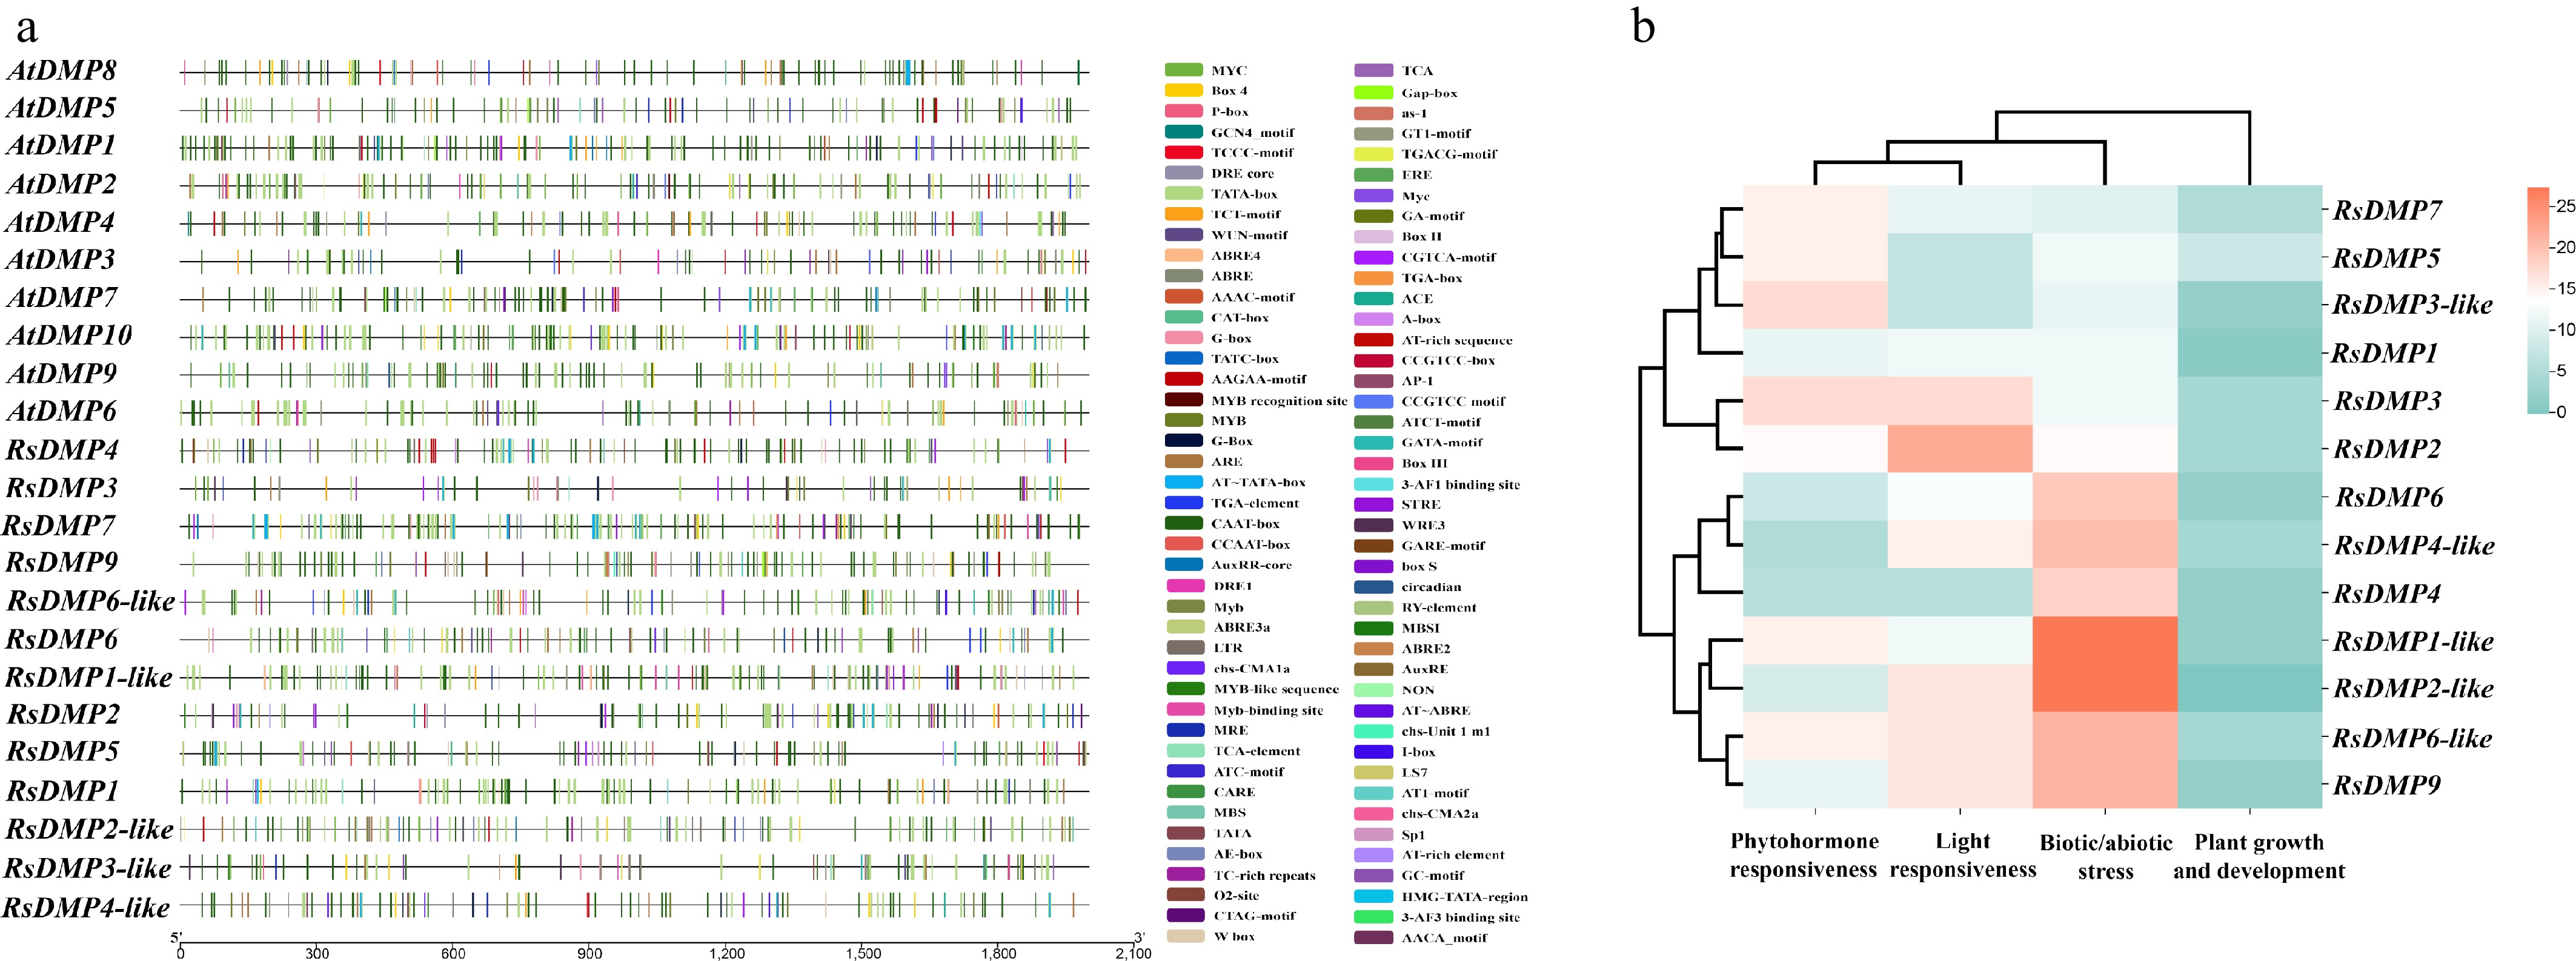
Figure 4.
Characterization of cis-regulatory elements (CAREs) in the promoter regions of RsDMP genes. (a) Distribution of CAREs in different colored rectangles. (b) Variation in different types of cis-acting regulatory elements (CAREs, refer to Supplementary Table S3).
-
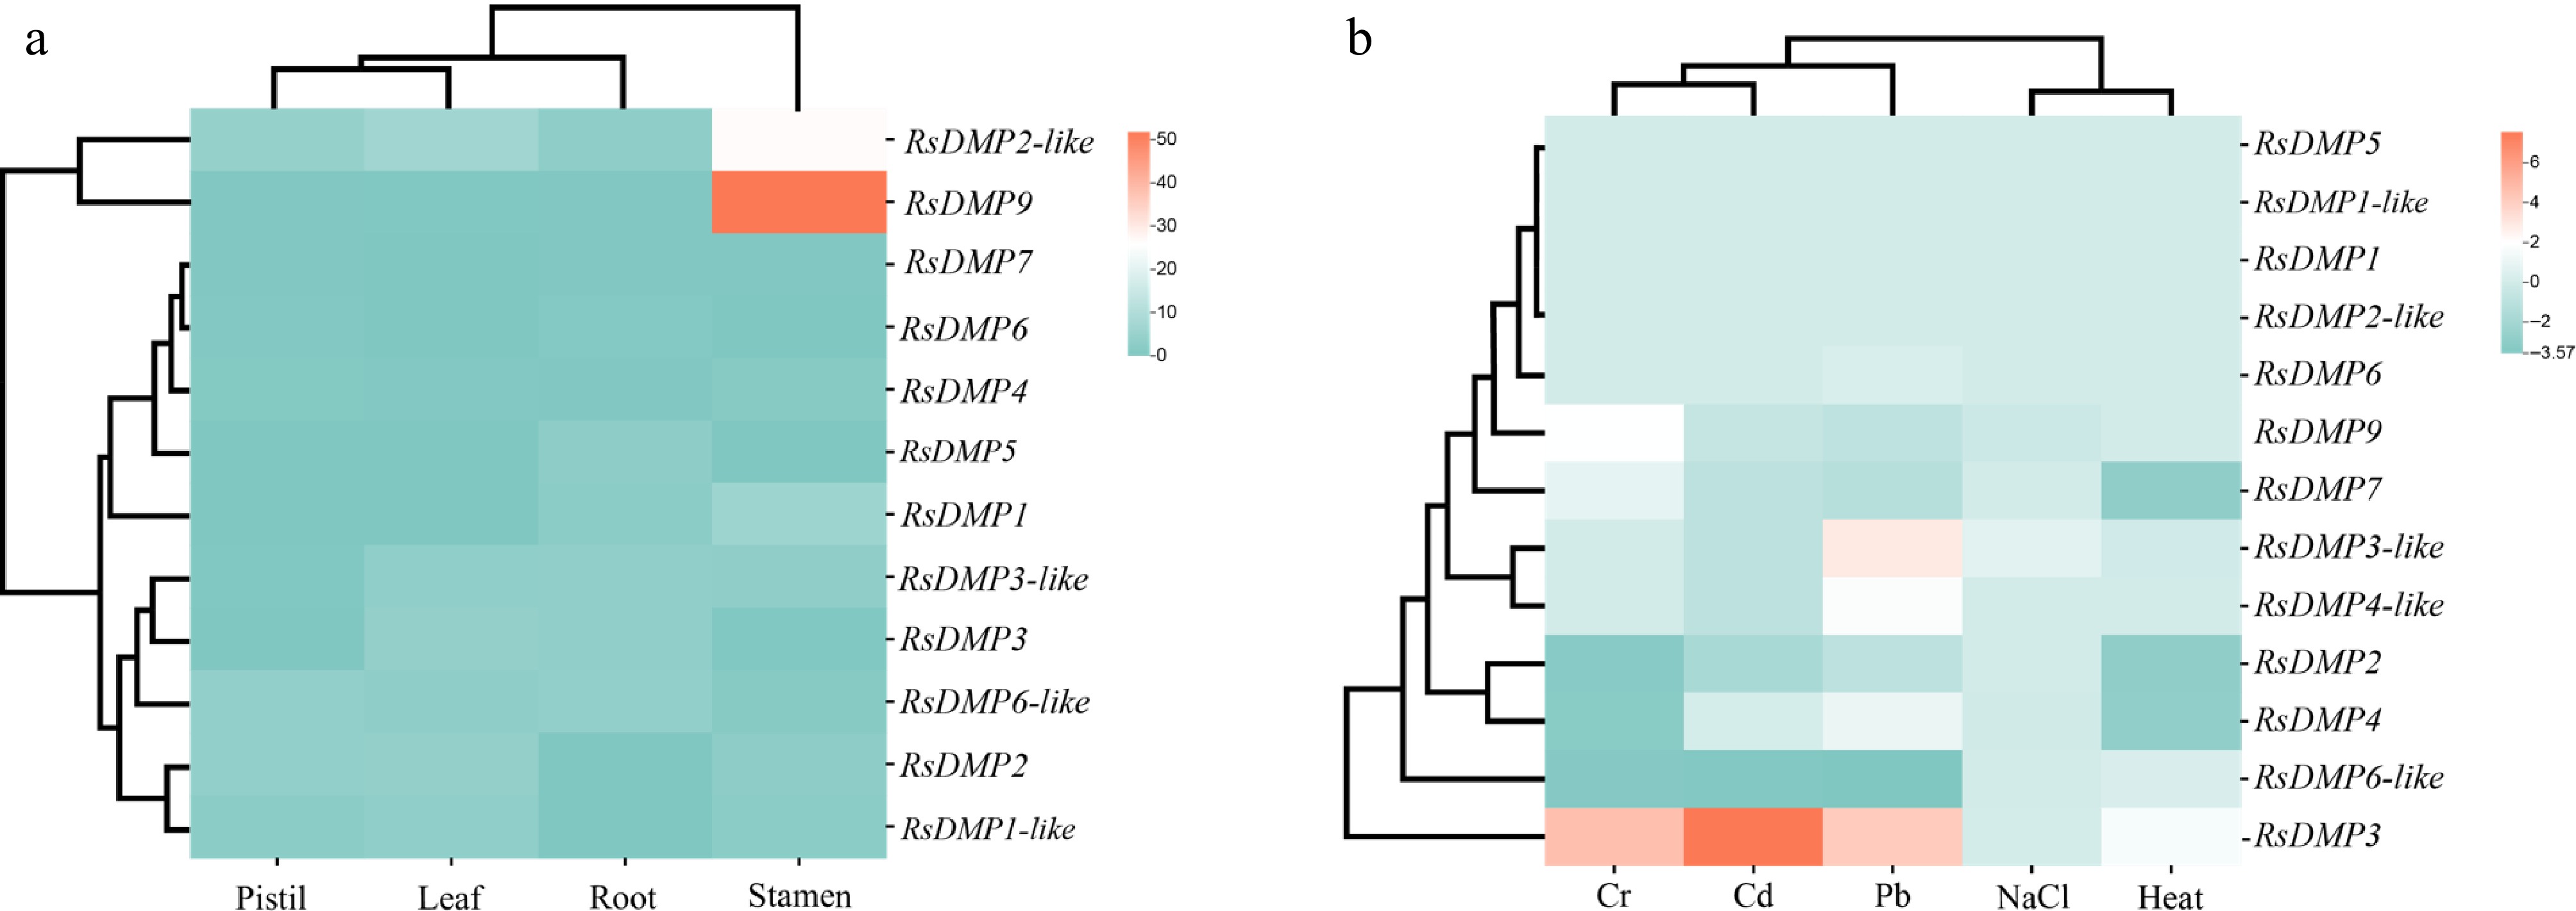
Figure 5.
Expression pattern of radish DMP genes. (a) Transcriptome-based expression profiling of RsDMP genes from four radish tissues consisted of leaf, root, pistil, and stamen. (b) The relative expression of RsDMP genes under Cd stress (200 μM/24 h), Cr stress (200 μM/24 h), heat stress (42 °C/24 h), Pb stress(200 μM/24 h), and NaCl stress (200 mM/24 h). Cd, cadmium; Cr, chromium; and Pb, lead. The plant material is sourced from NAU-LB. For details of each gene expression, refer to Supplementary Table S4.
-
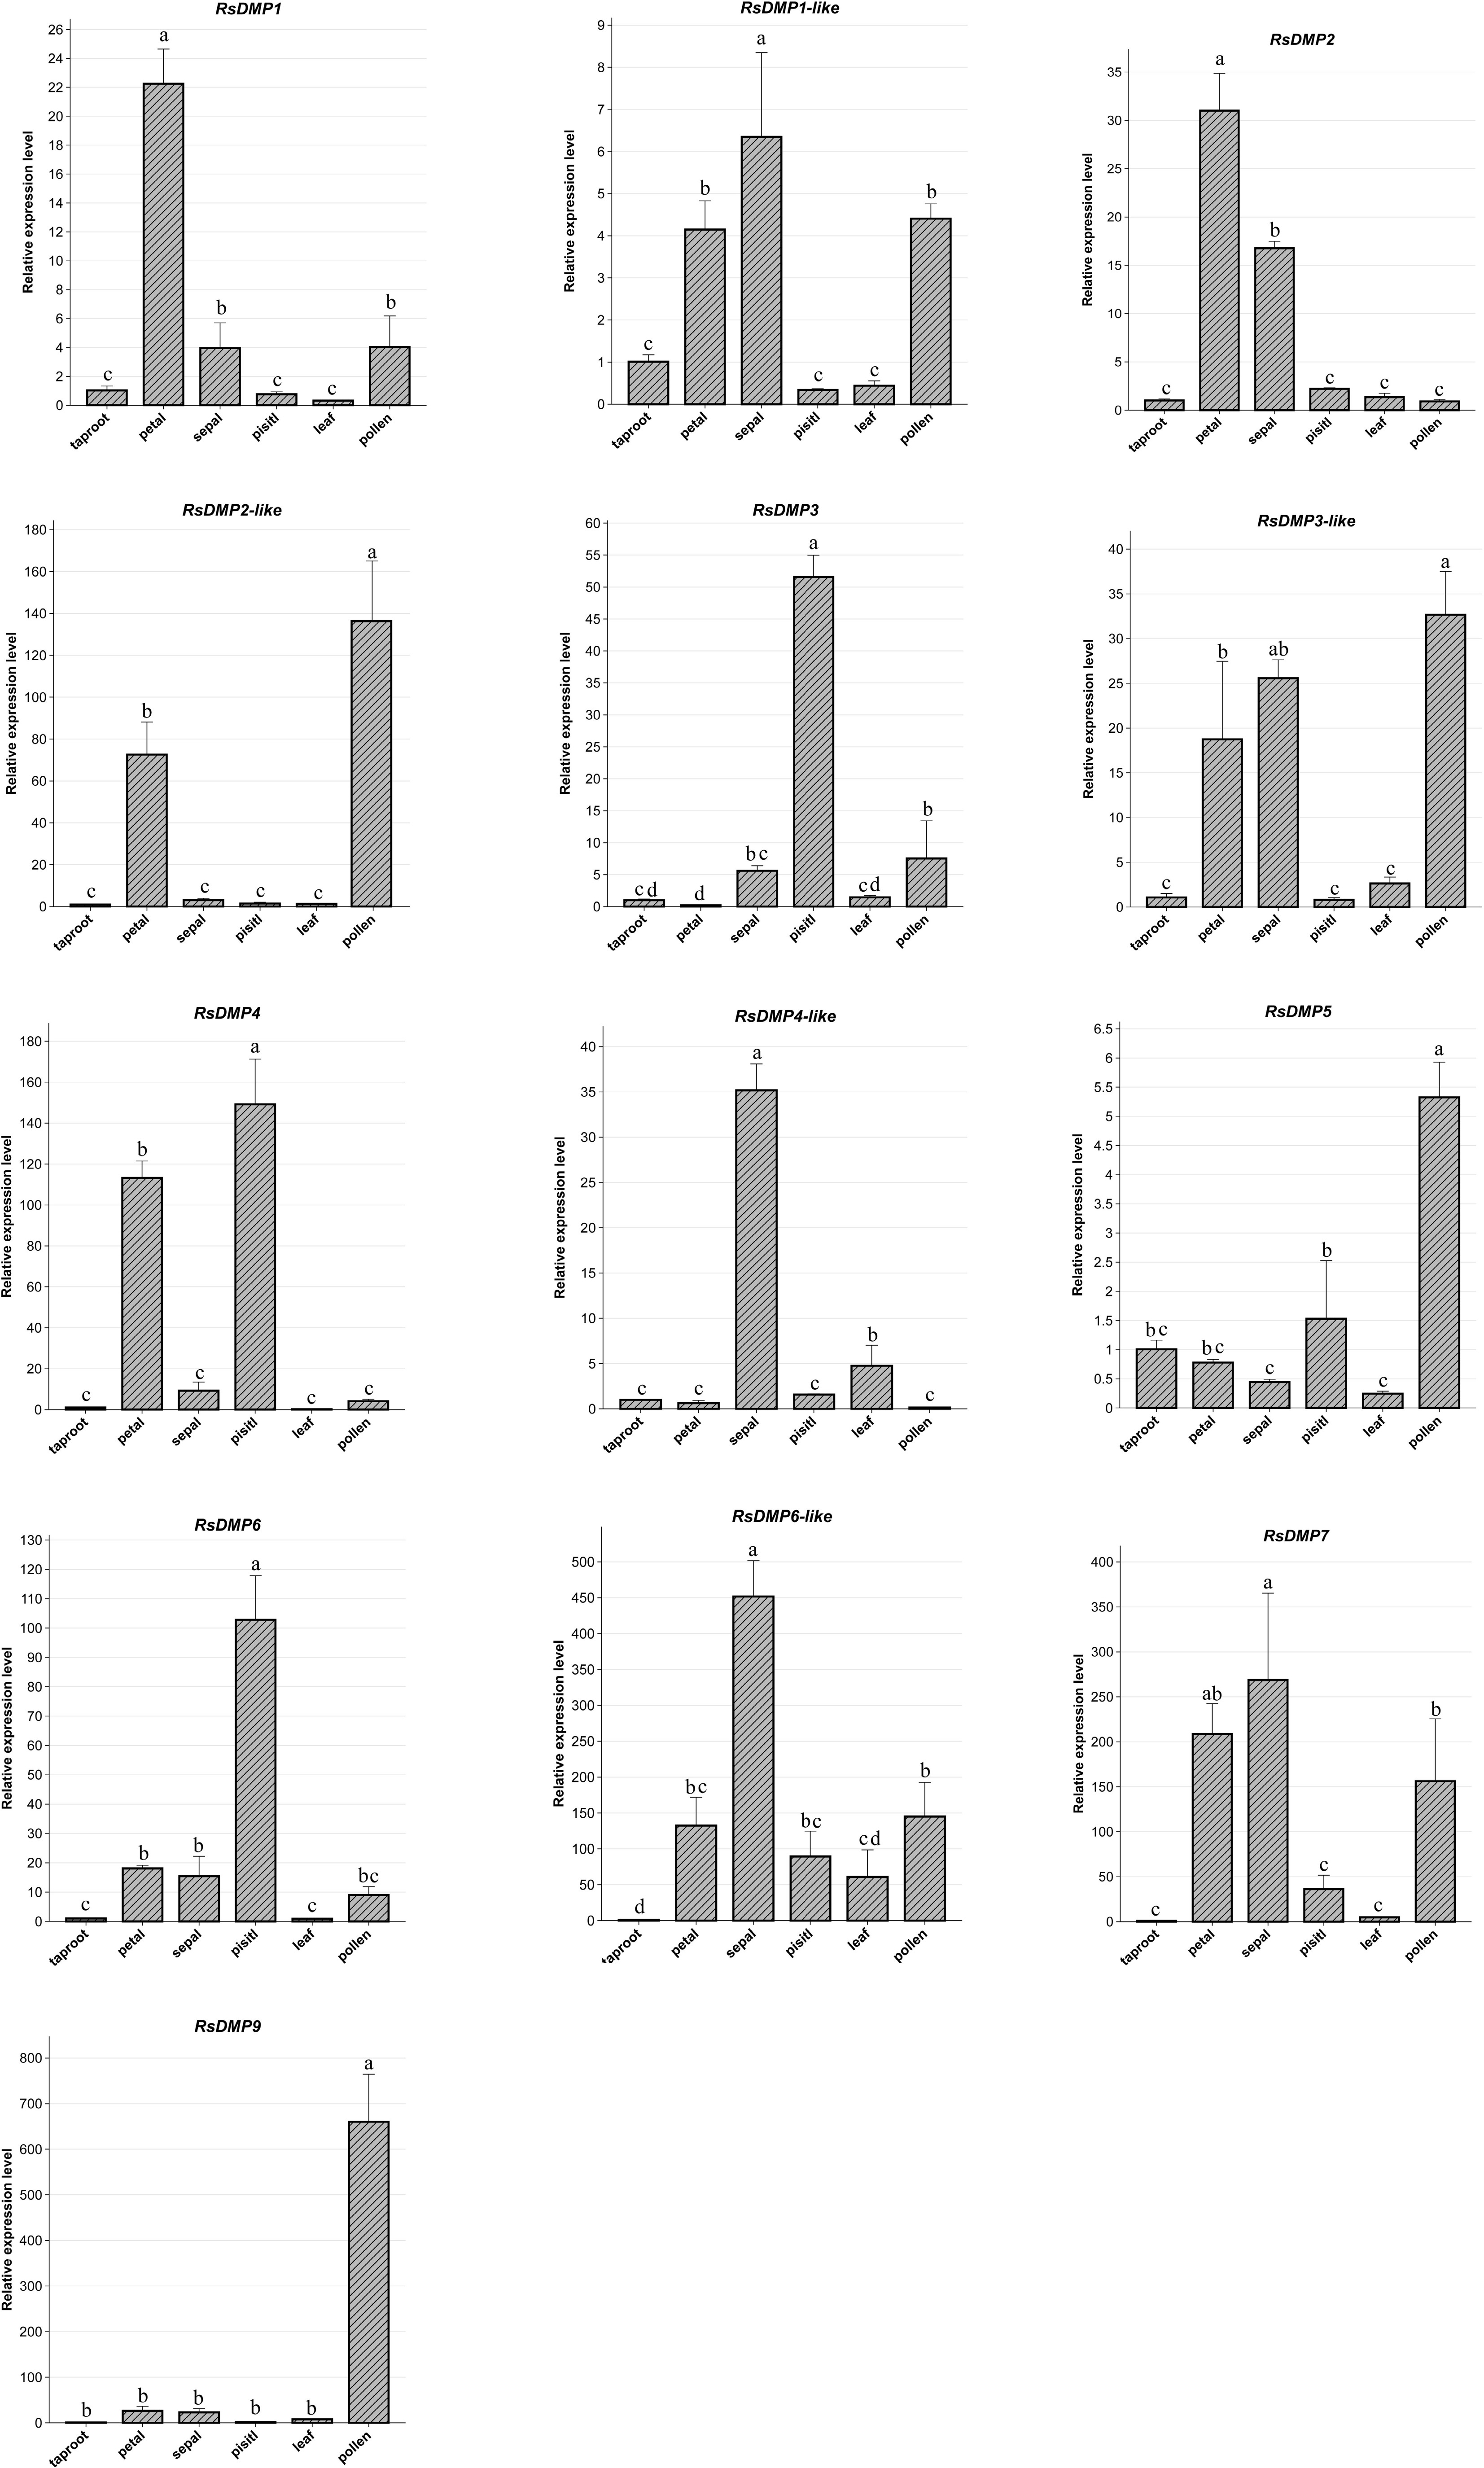
Figure 6.
The relative expression levels of RsDMP genes in different tissues by qPCR analysis. Data are shown as the means ± SD from three biological replicates. Different letters above the bar indicate a significant differences among columns by Duncan's multiple comparison test (p < 0.05).
-
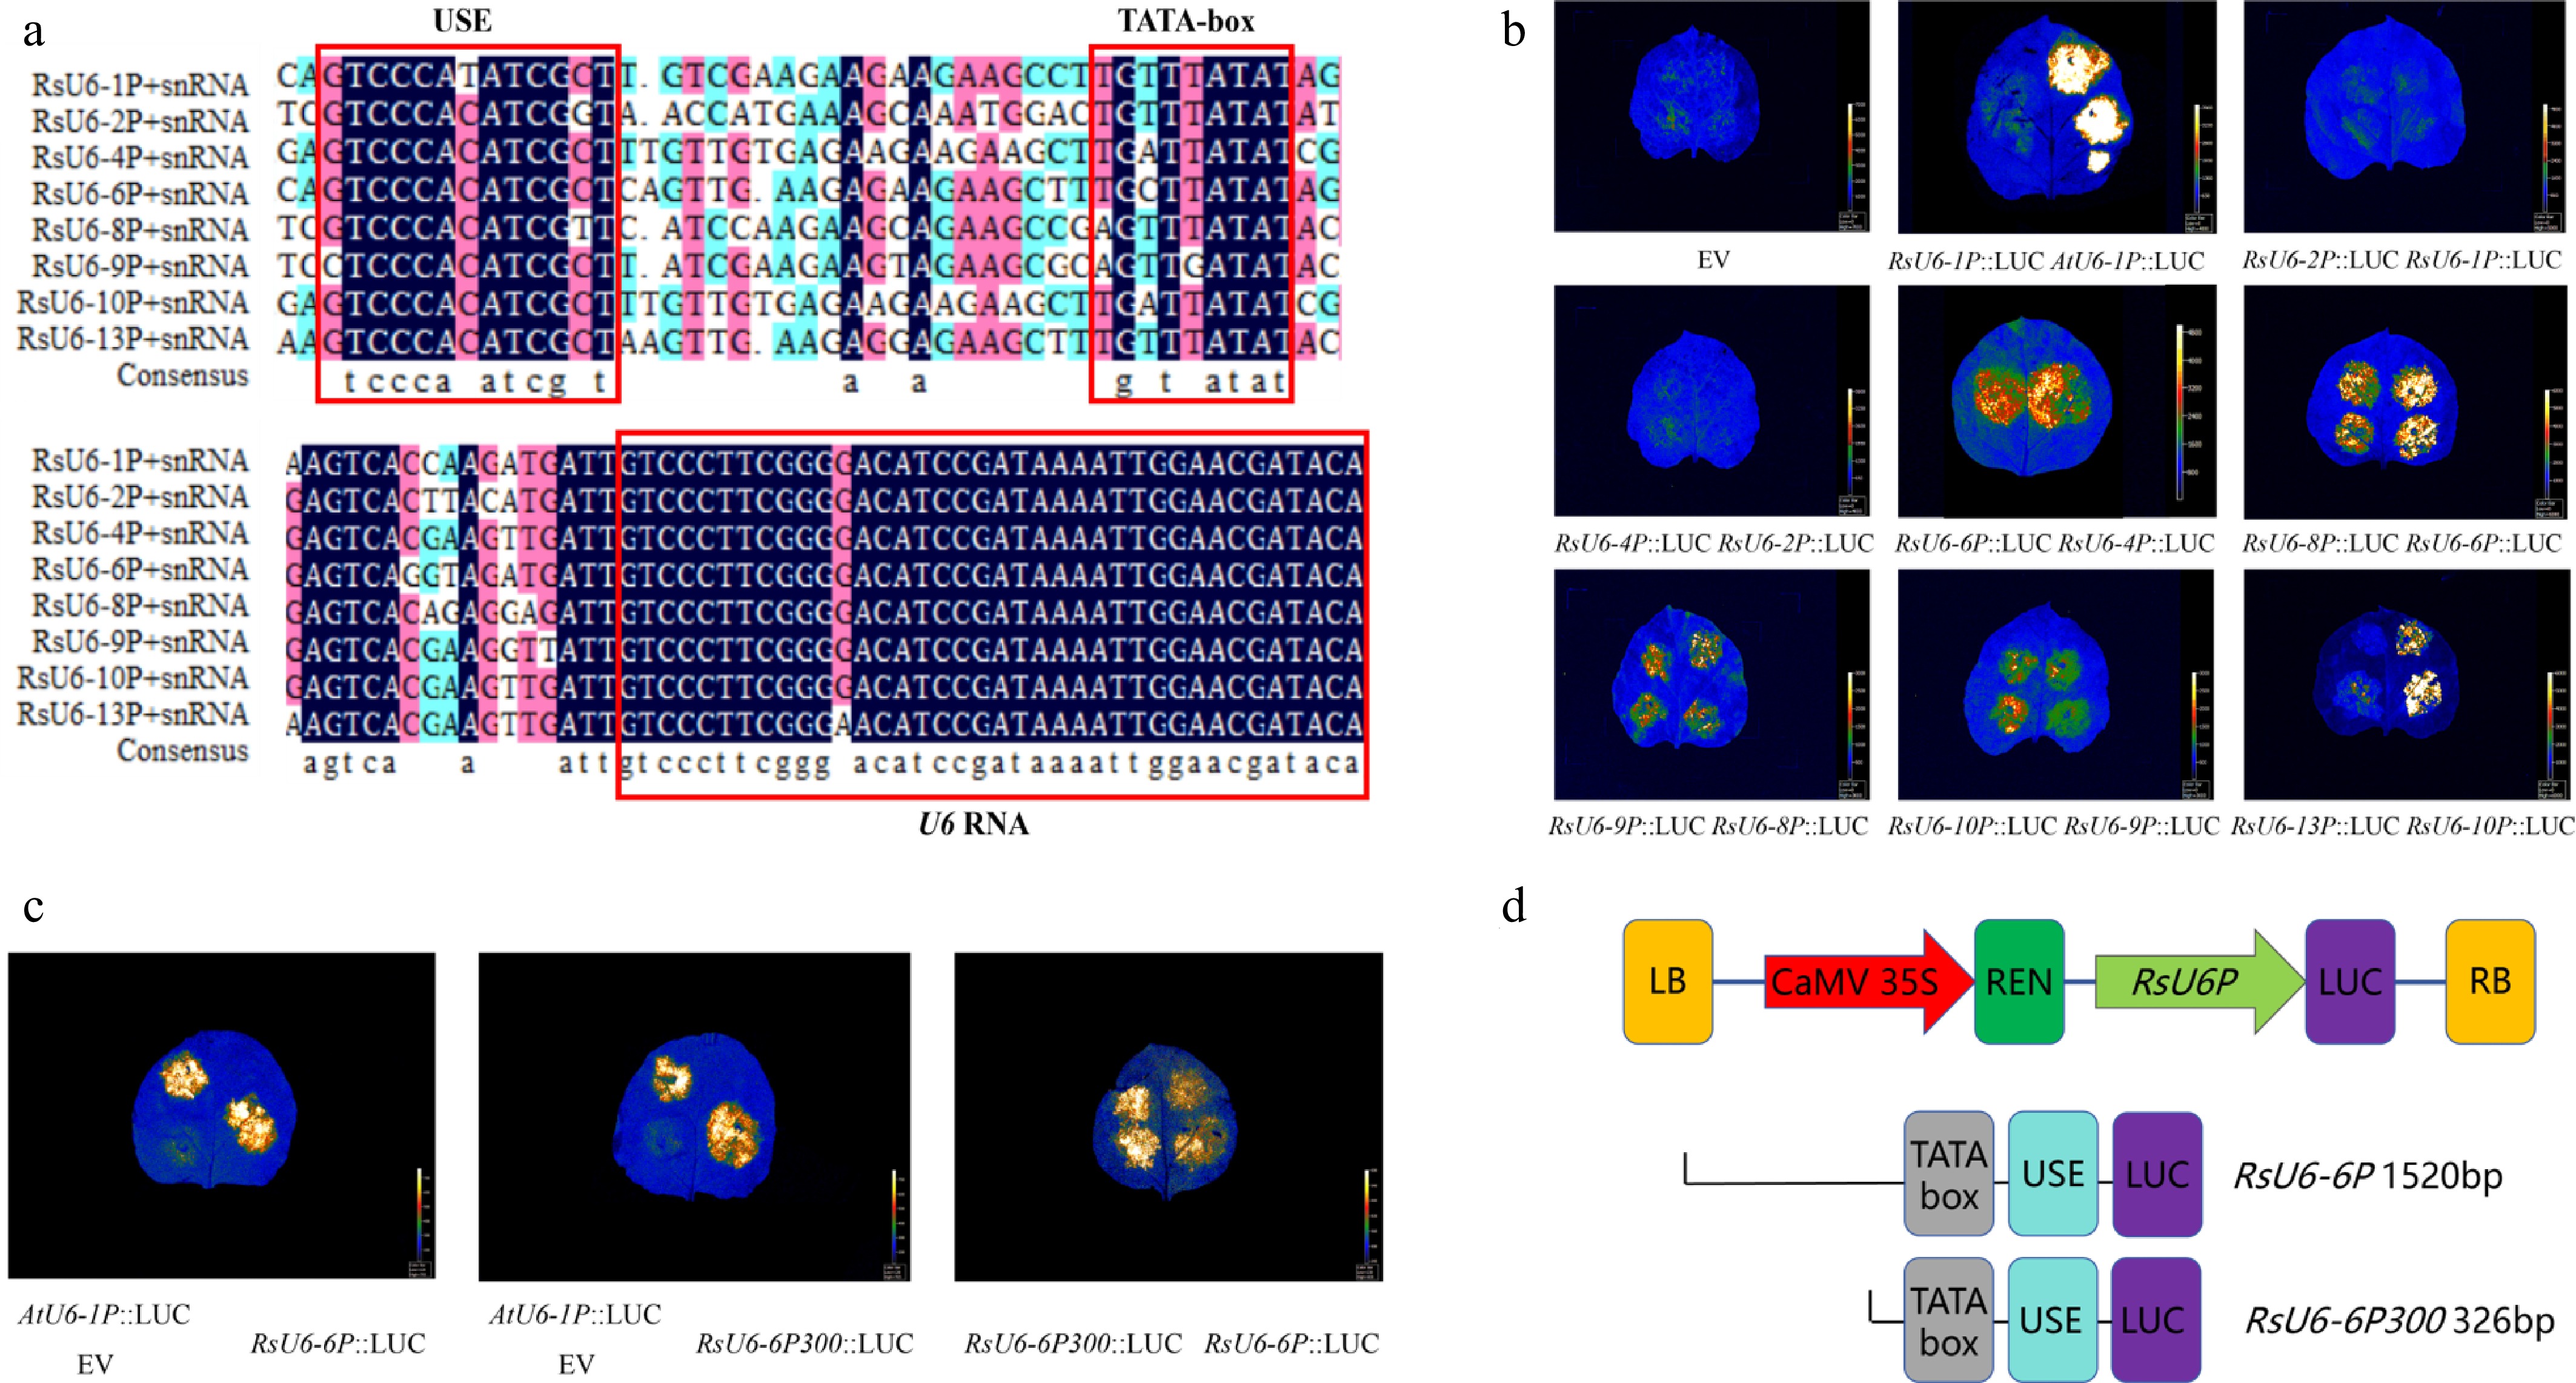
Figure 7.
Functional analysis and expression vector validation of the RsU6 promoter. (a) Conservation element analysis of the RsU6 promoter region (including sequence alignment of TATA box, USE, and U6 RNA-related conserved sequences). (b) RsU6P::LUC and AtU6-1P::LUC are transiently expressed in N. benthamiana leaves. (c) RsU6P-6P300::LUC, RsU6P-6P::LUC, and AtU6-1P::LUC are transiently expressed in N. benthamiana leaves. (d) Schematic diagram of the RsU6P-6P300::LUC and RsU6P-6P::LUC constructs, along with a comparative diagram of the functional segments between the truncated variant and the full-length sequence.
-
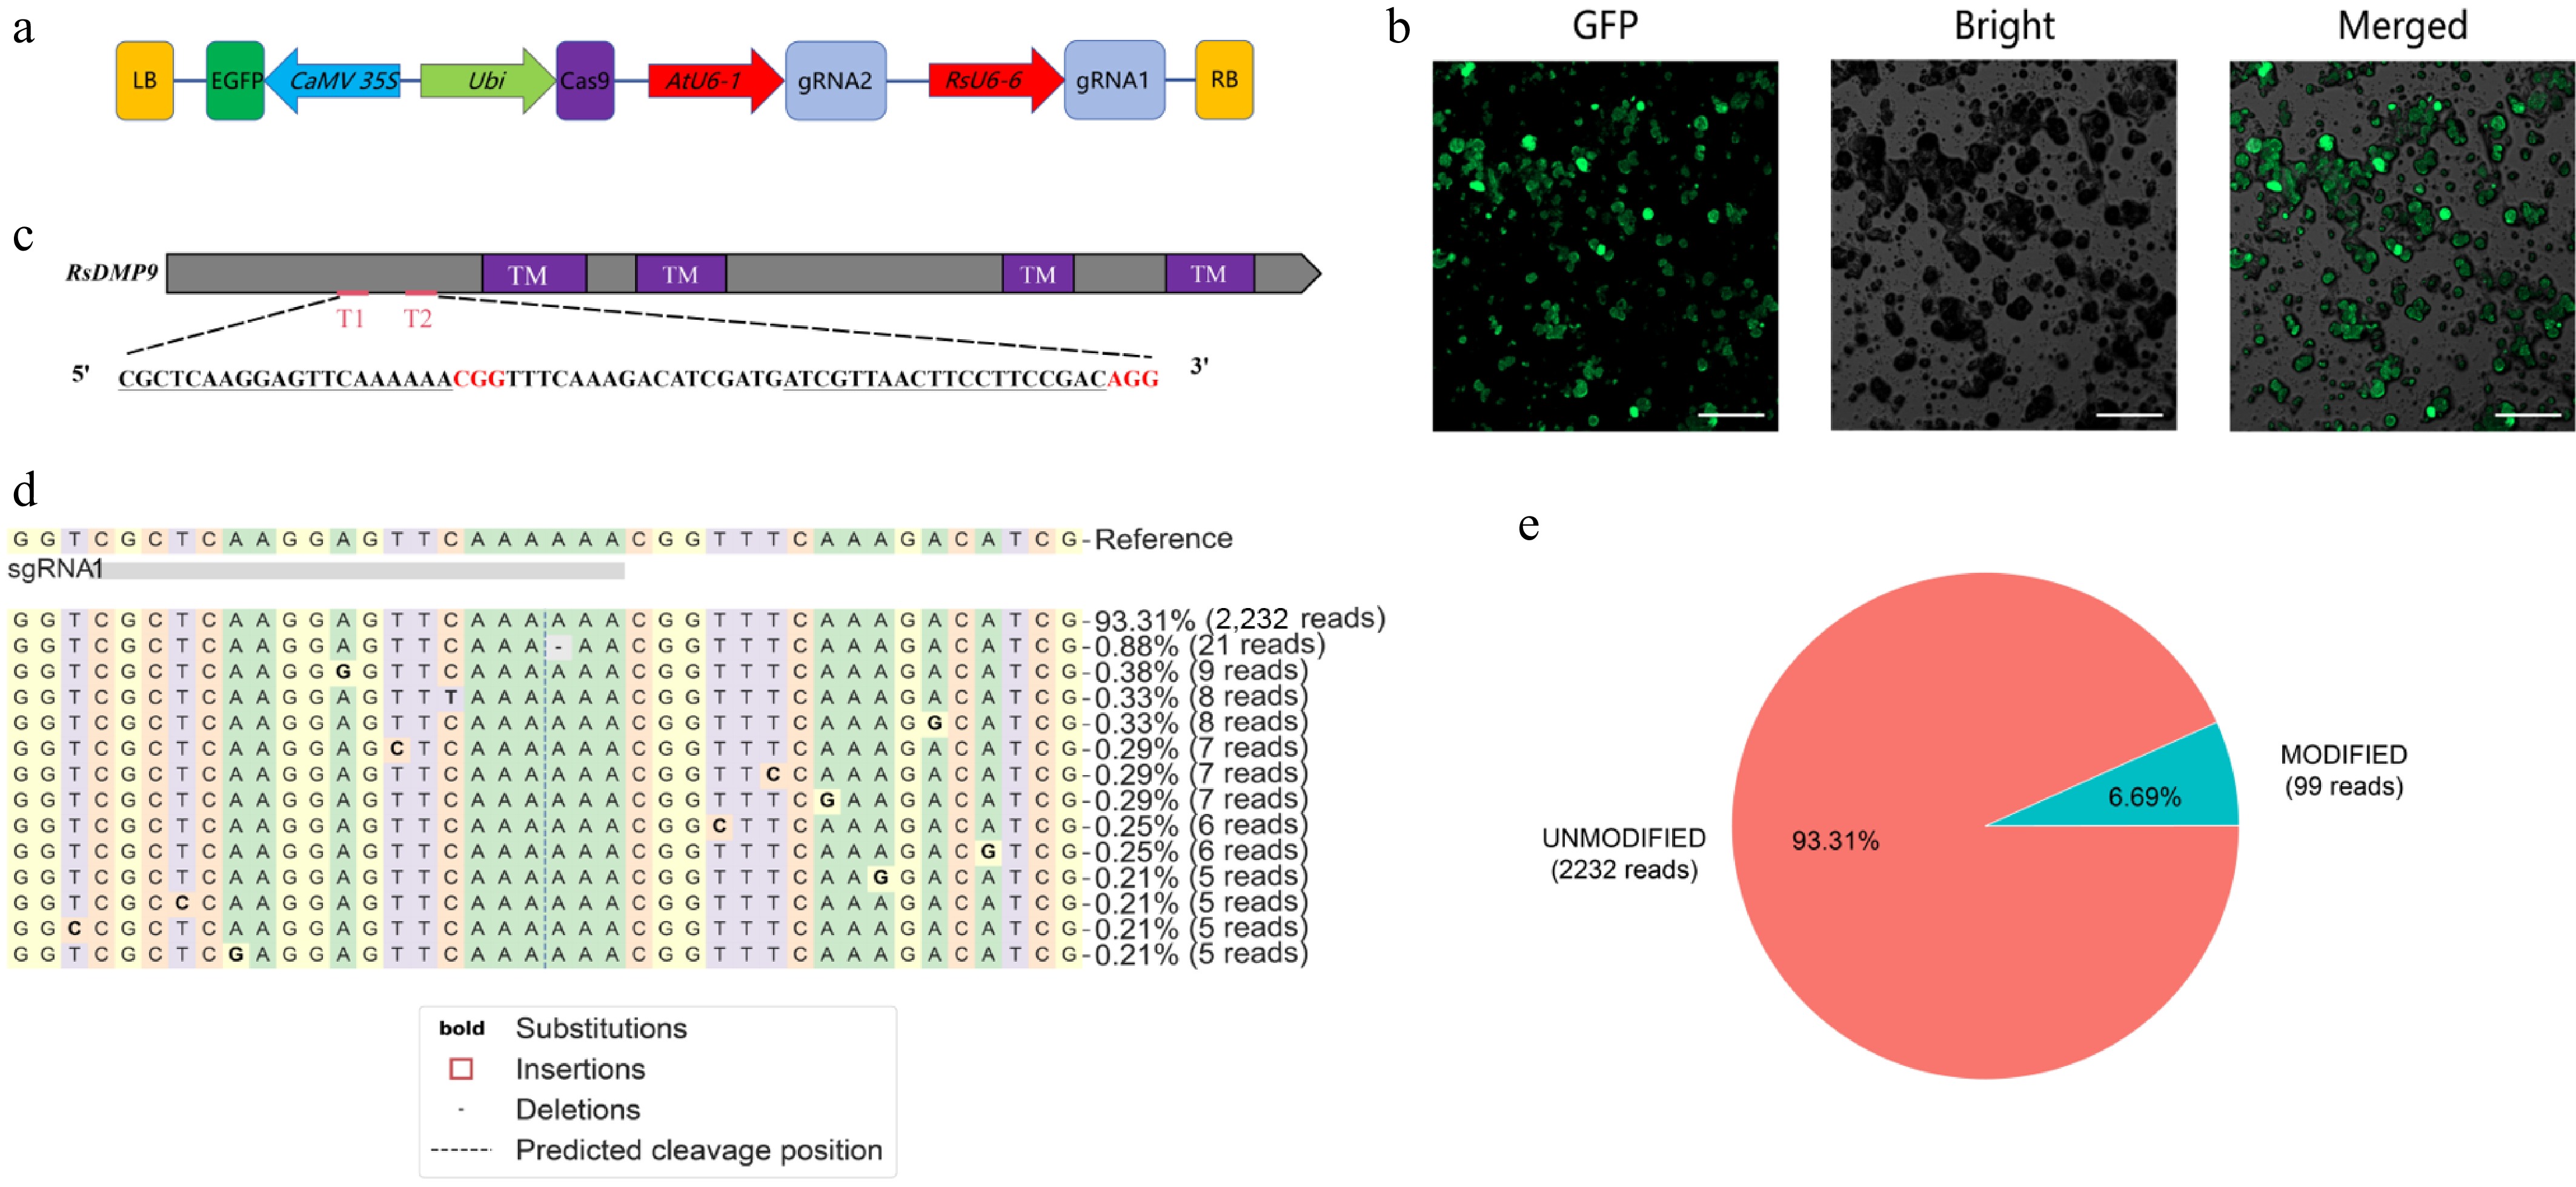
Figure 8.
The radish protoplast transient transfection system was employed to validate the activity of CRISPR/Cas9 vectors. (a) Schematic diagram of the CRISPR/Cas9 construct targeting RsDMP9. EGFP, enhanced green fluorescent protein. (b) Radish protoplasts were imaged under GFP, bright field, and merged channel. Green fluorescent signals reflected the transformed cells. Scale bar = 100 μm. (c) Schematic of RsDMP9. Grey blocks, gene coding region; purple blocks, predicted transmembrane domains (TMs); black lines, the region (T1 and T2) targeted by sgRNAs. (d) The types of mutations detected in the sgRNA1 target site. (e) Pie chart showing the mutation as a percentage of total reads.
Figures
(8)
Tables
(0)