-
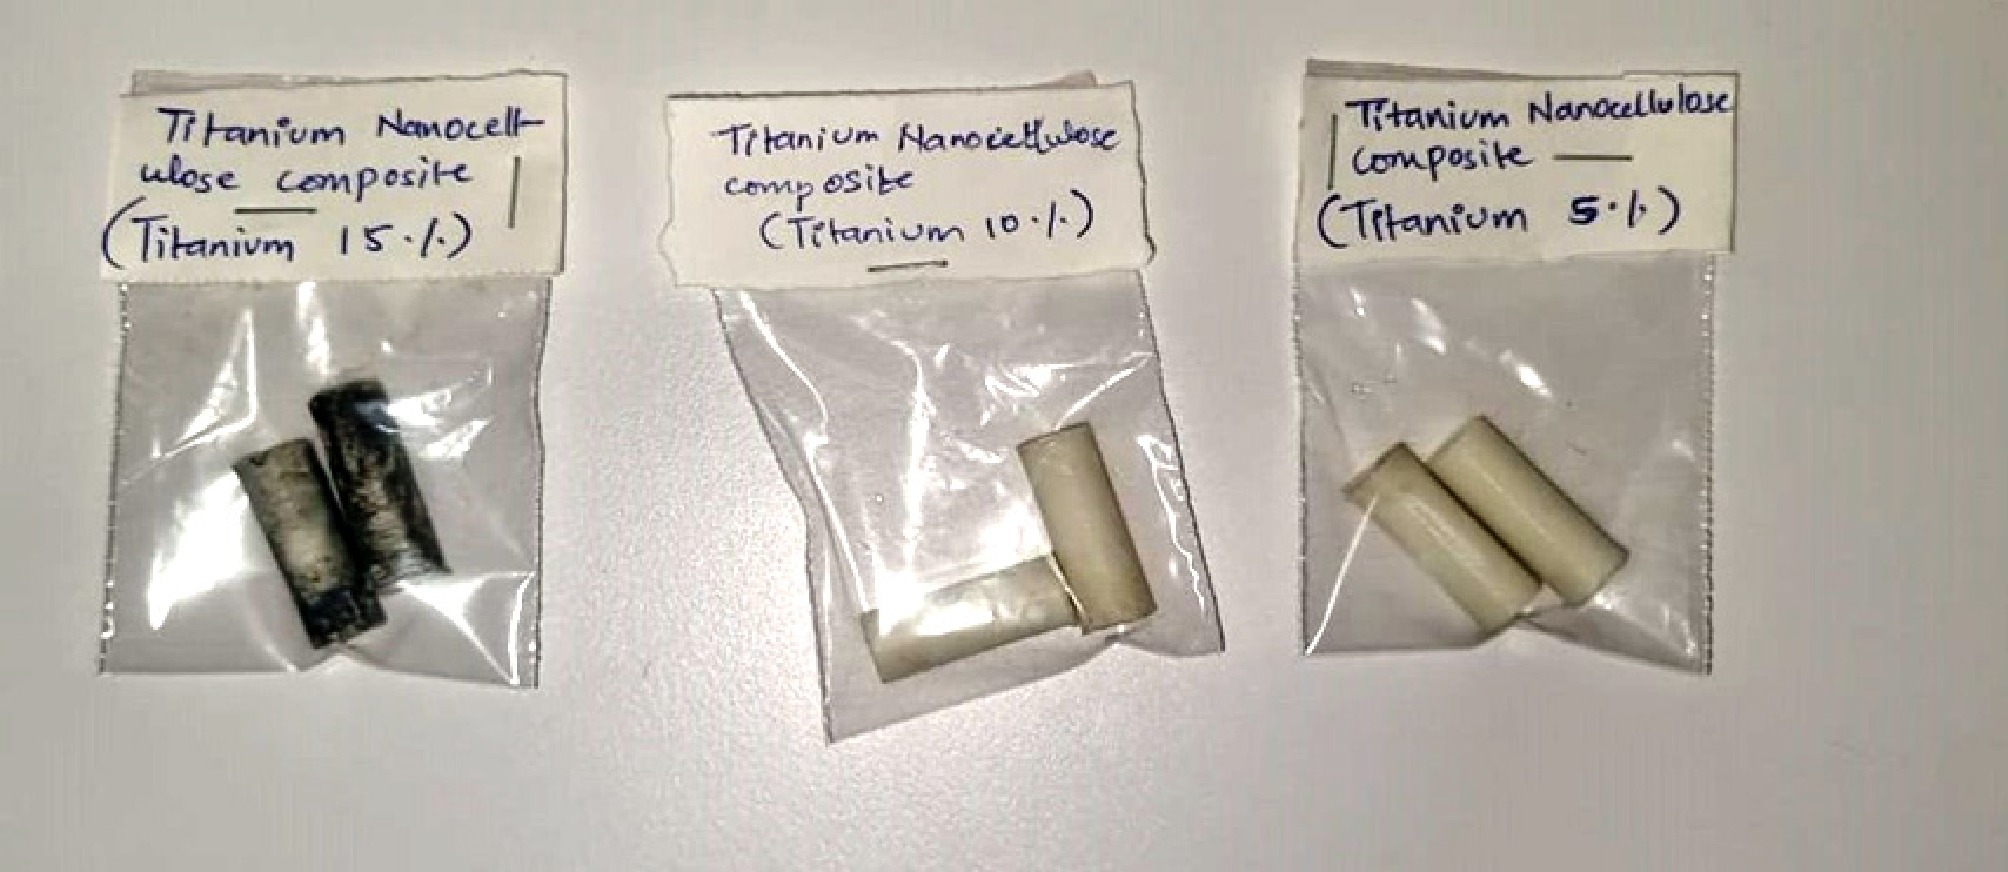
Figure 1.
Samples of nanocellulose-TiO2 composites.
-
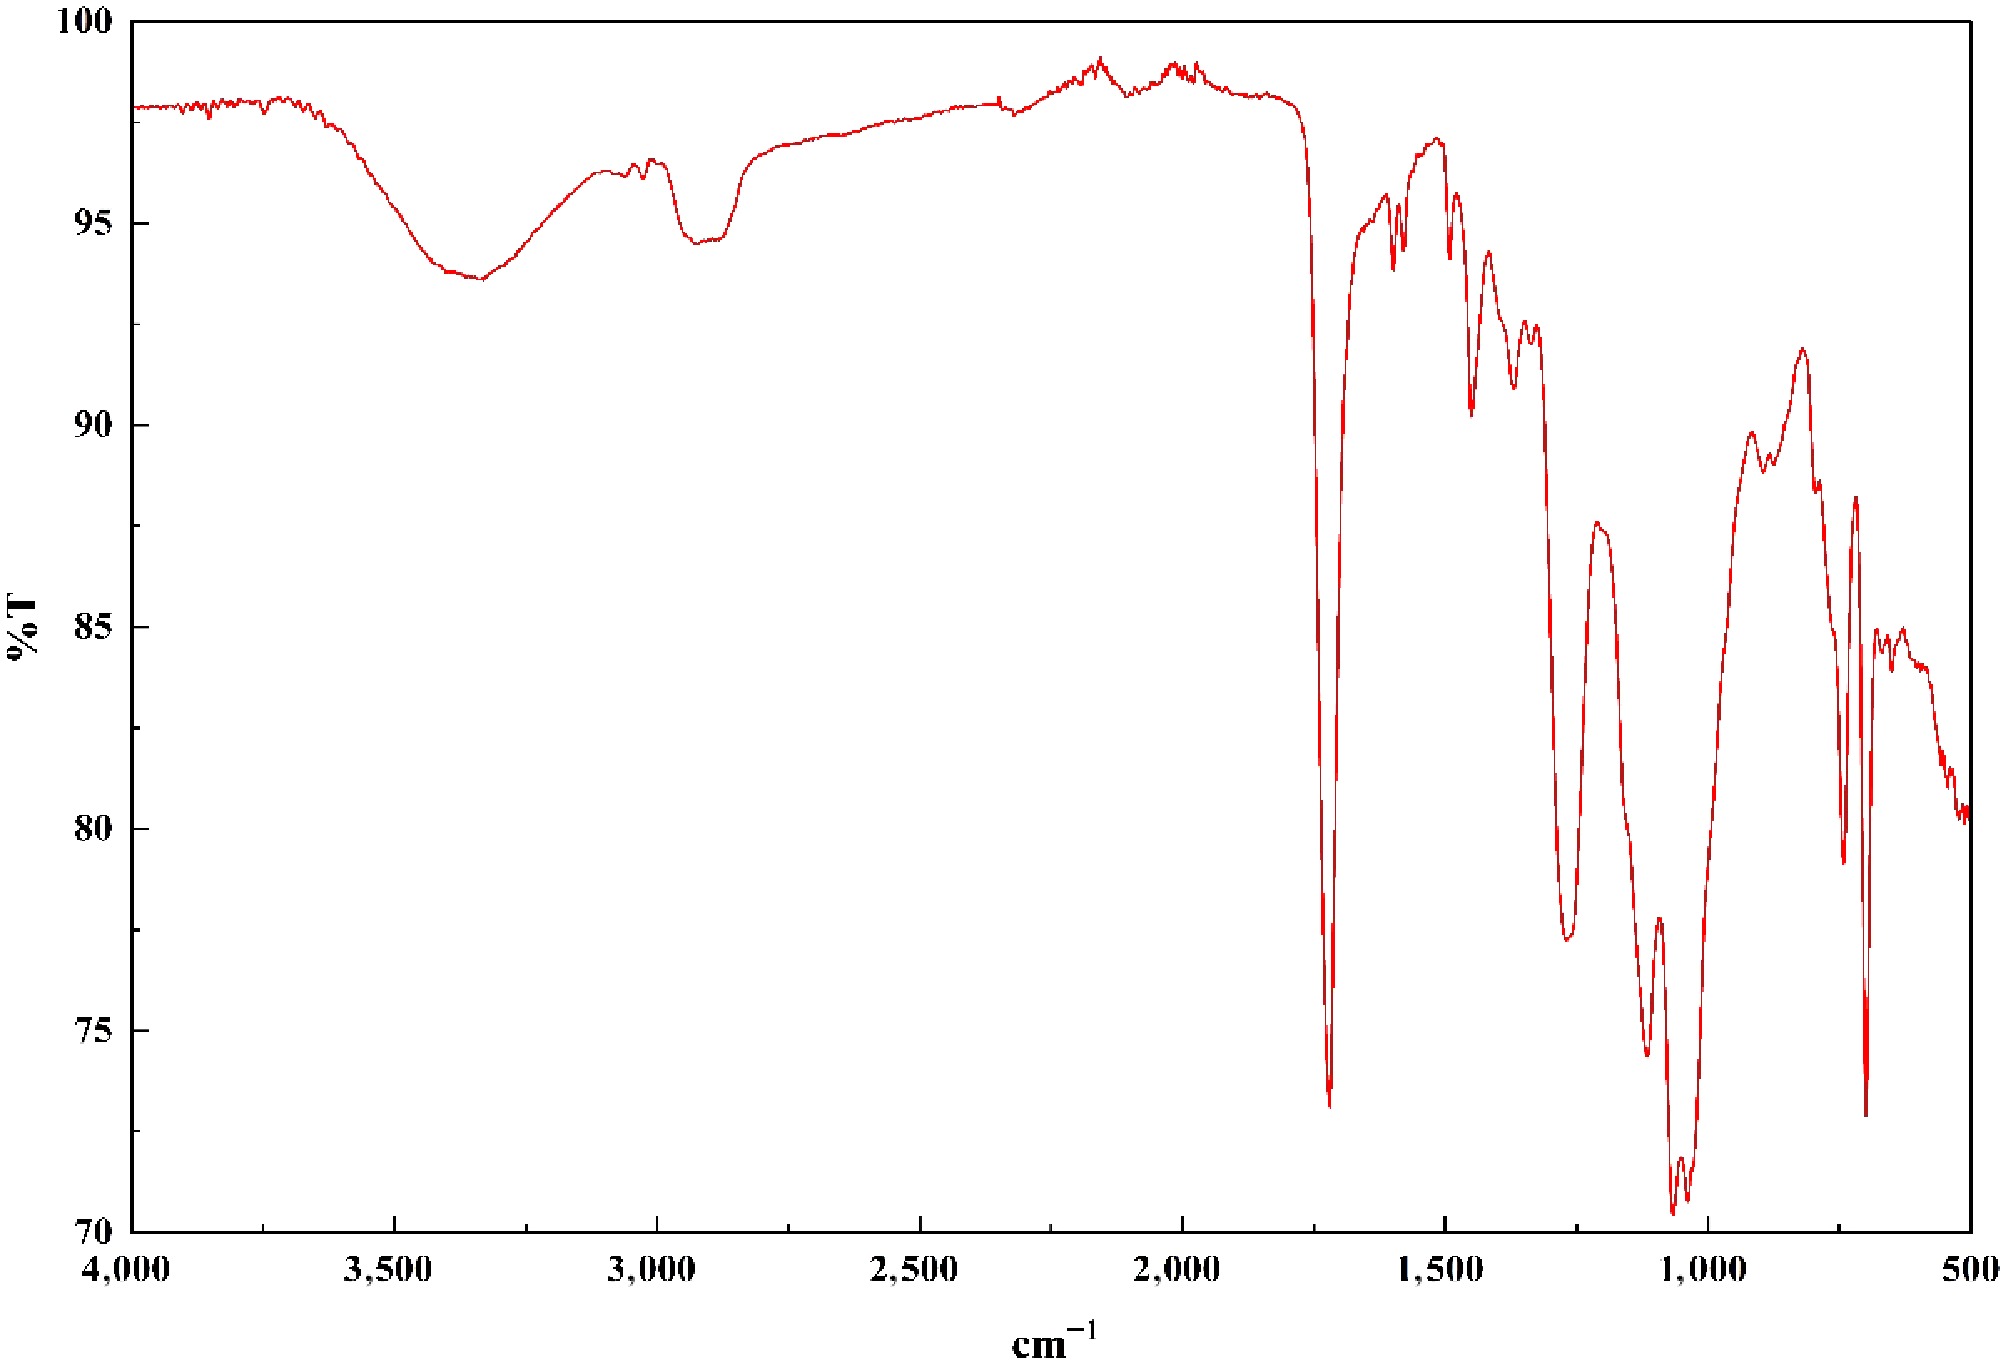
Figure 2.
FTIR of NC-TiO2-5%.
-
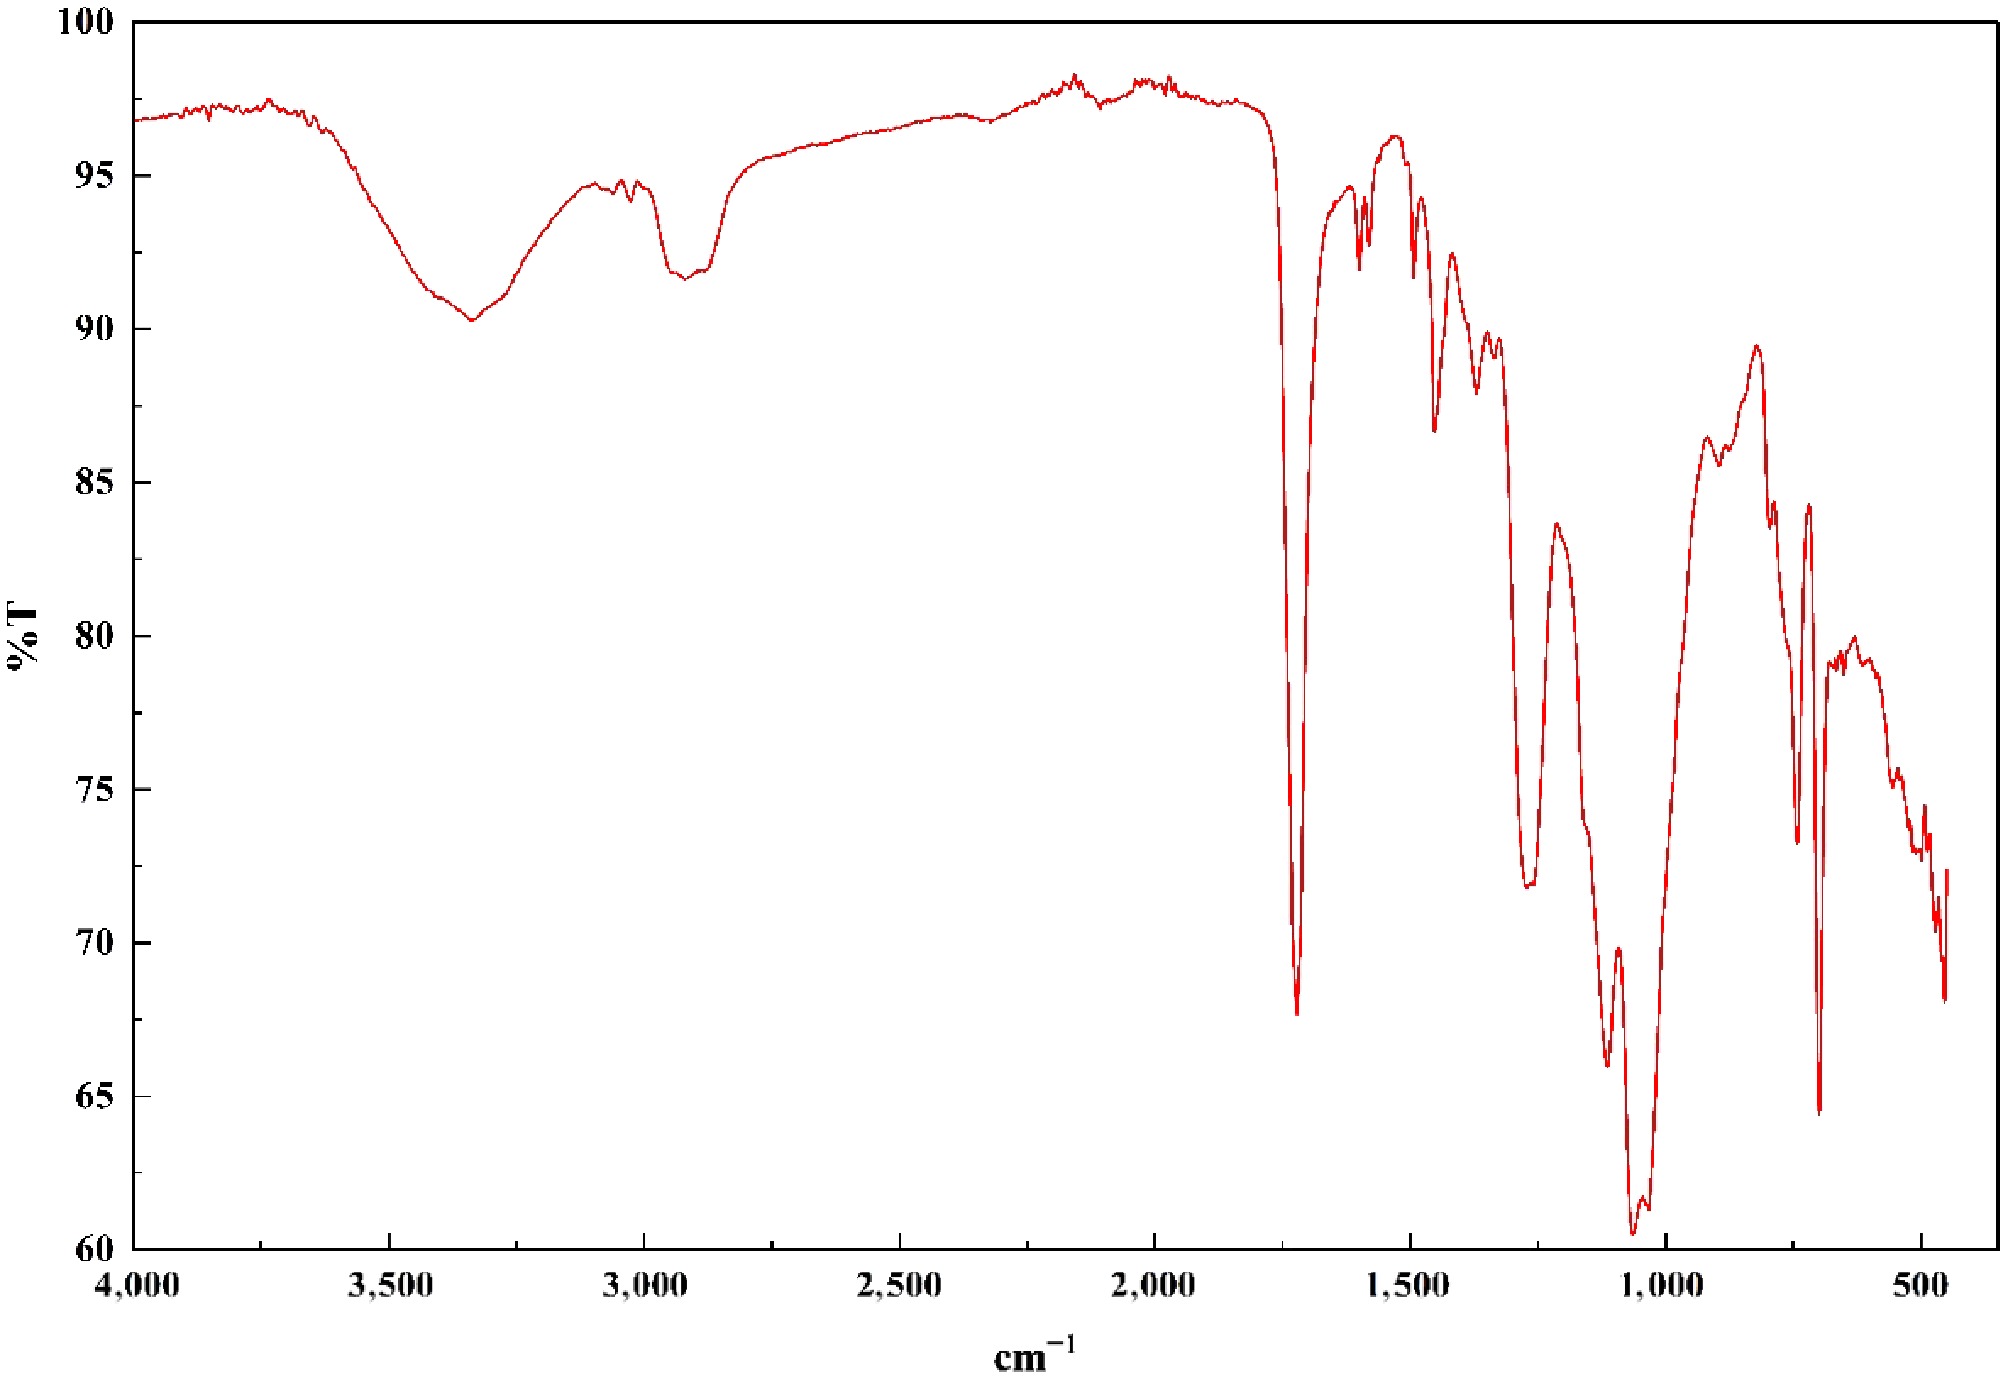
Figure 3.
FTIR of NC-TiO2-10%.
-
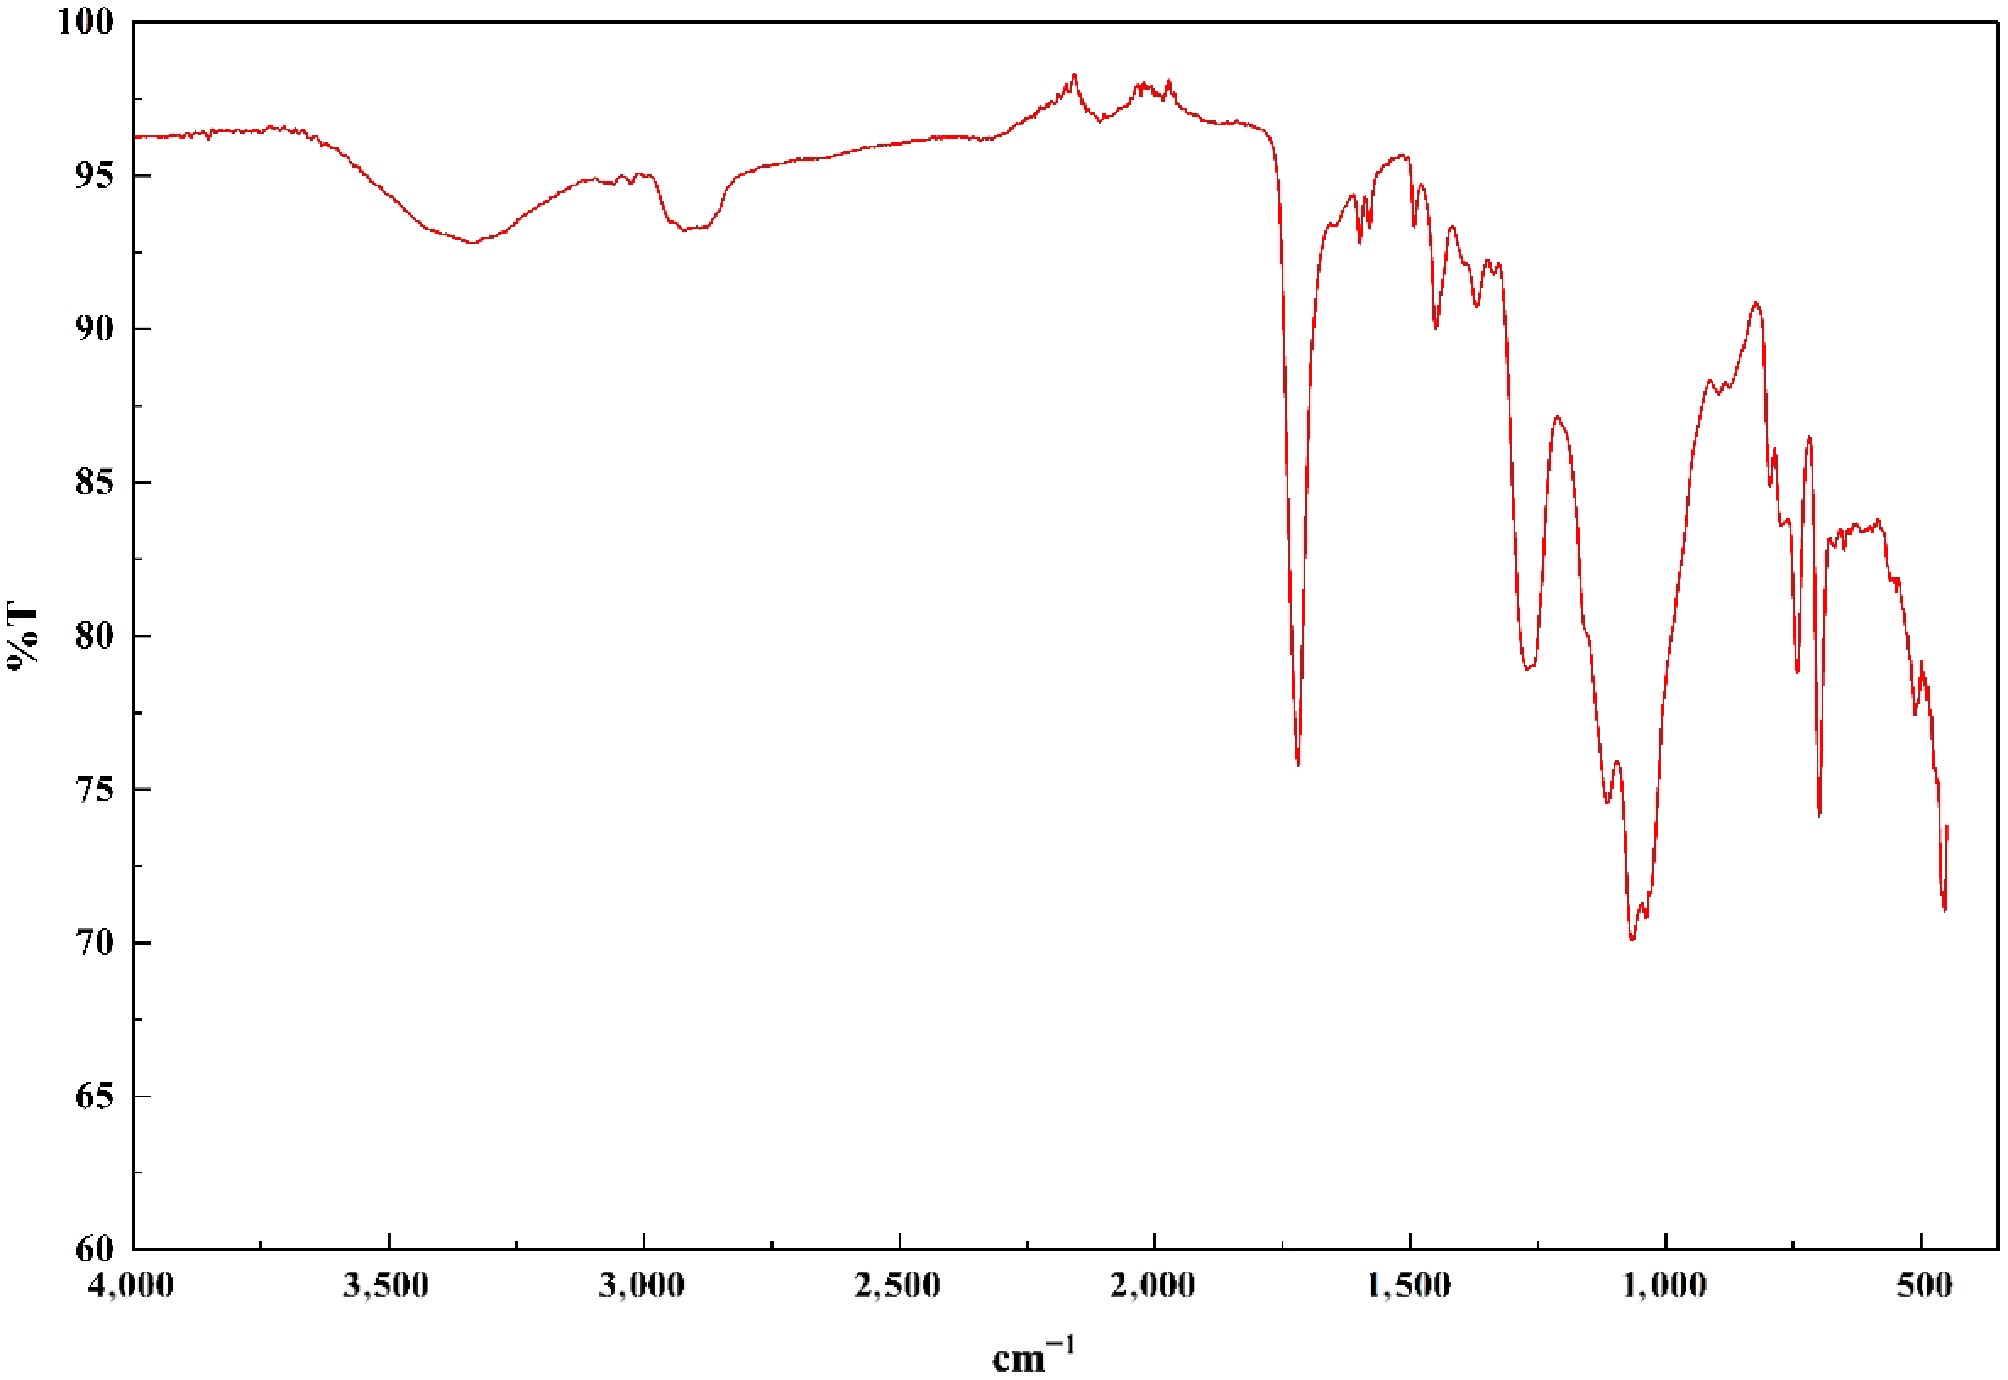
Figure 4.
FTIR of NC-TiO2-15%.
-
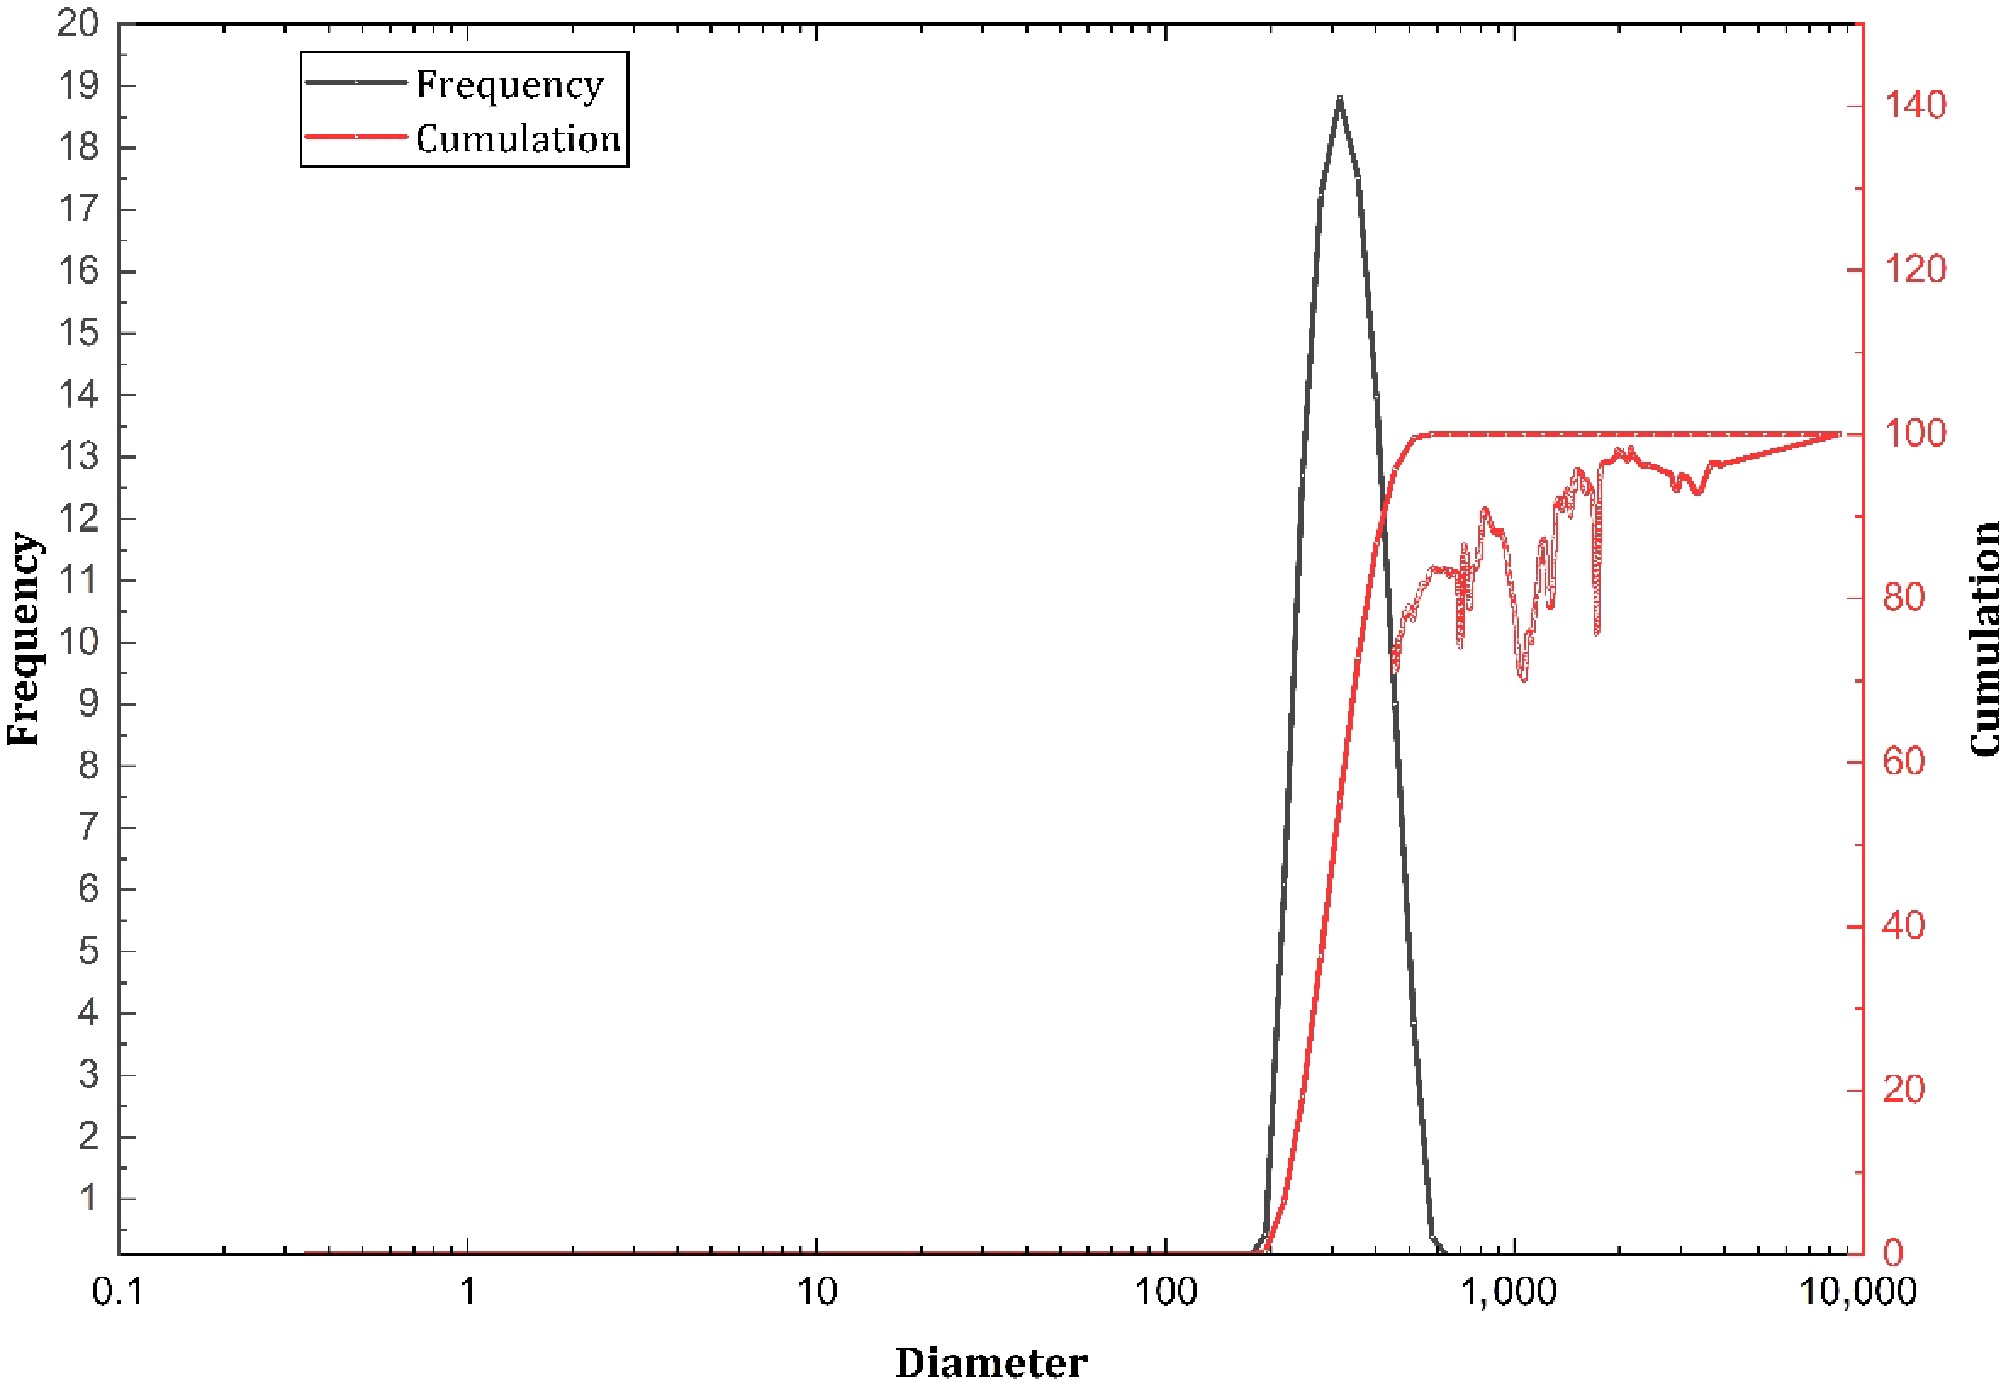
Figure 5.
PSA of NC-TiO2-5%.
-
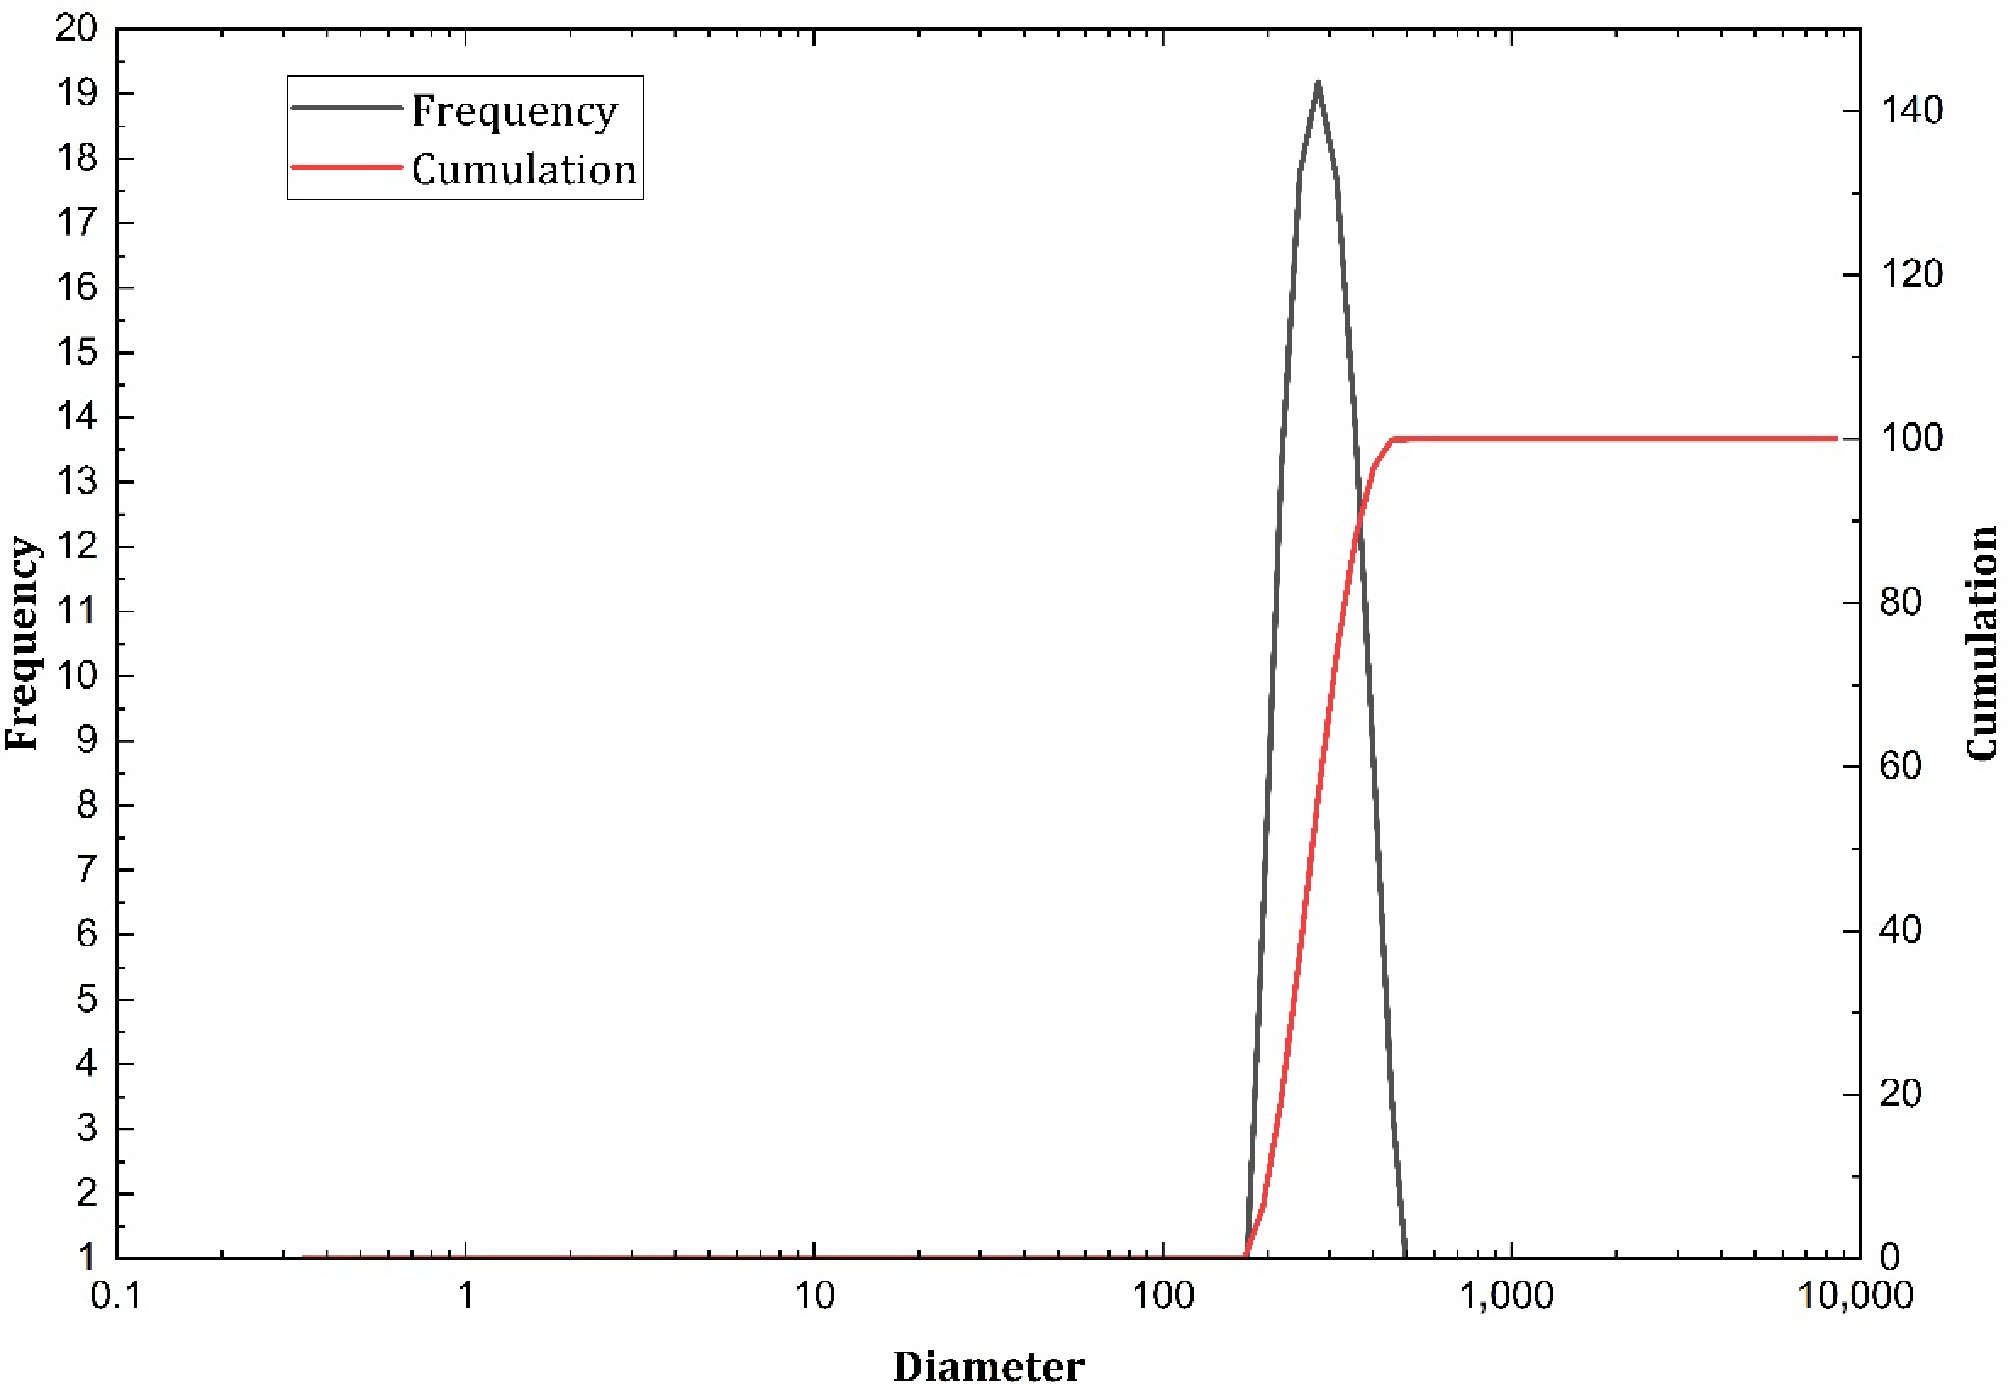
Figure 6.
PSA of NC-TiO2-10%.
-
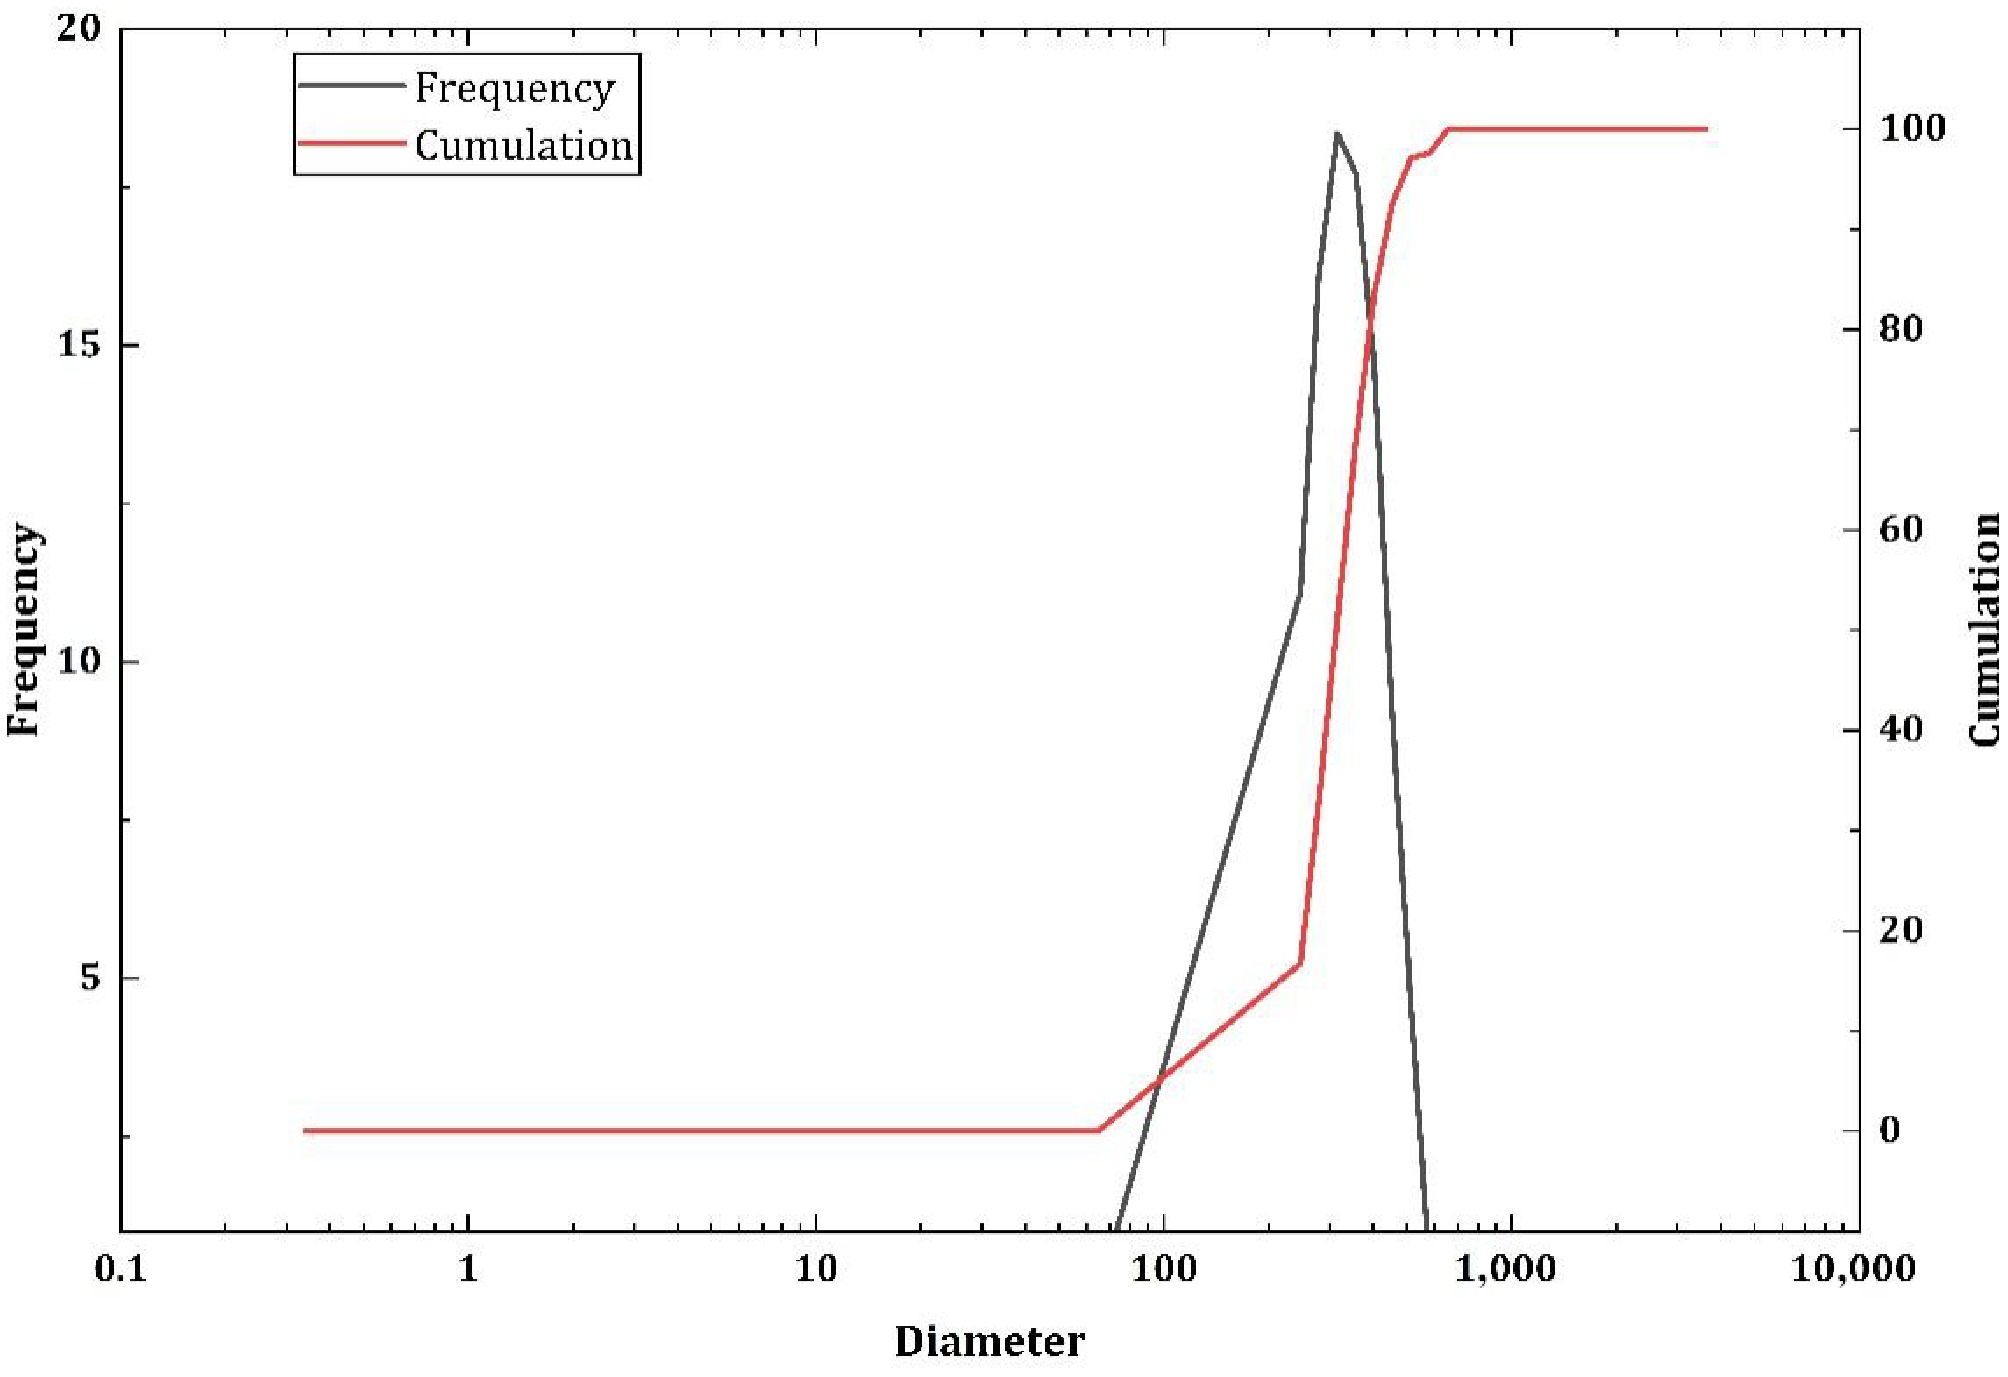
Figure 7.
PSA of NC-TiO2-15%.
-
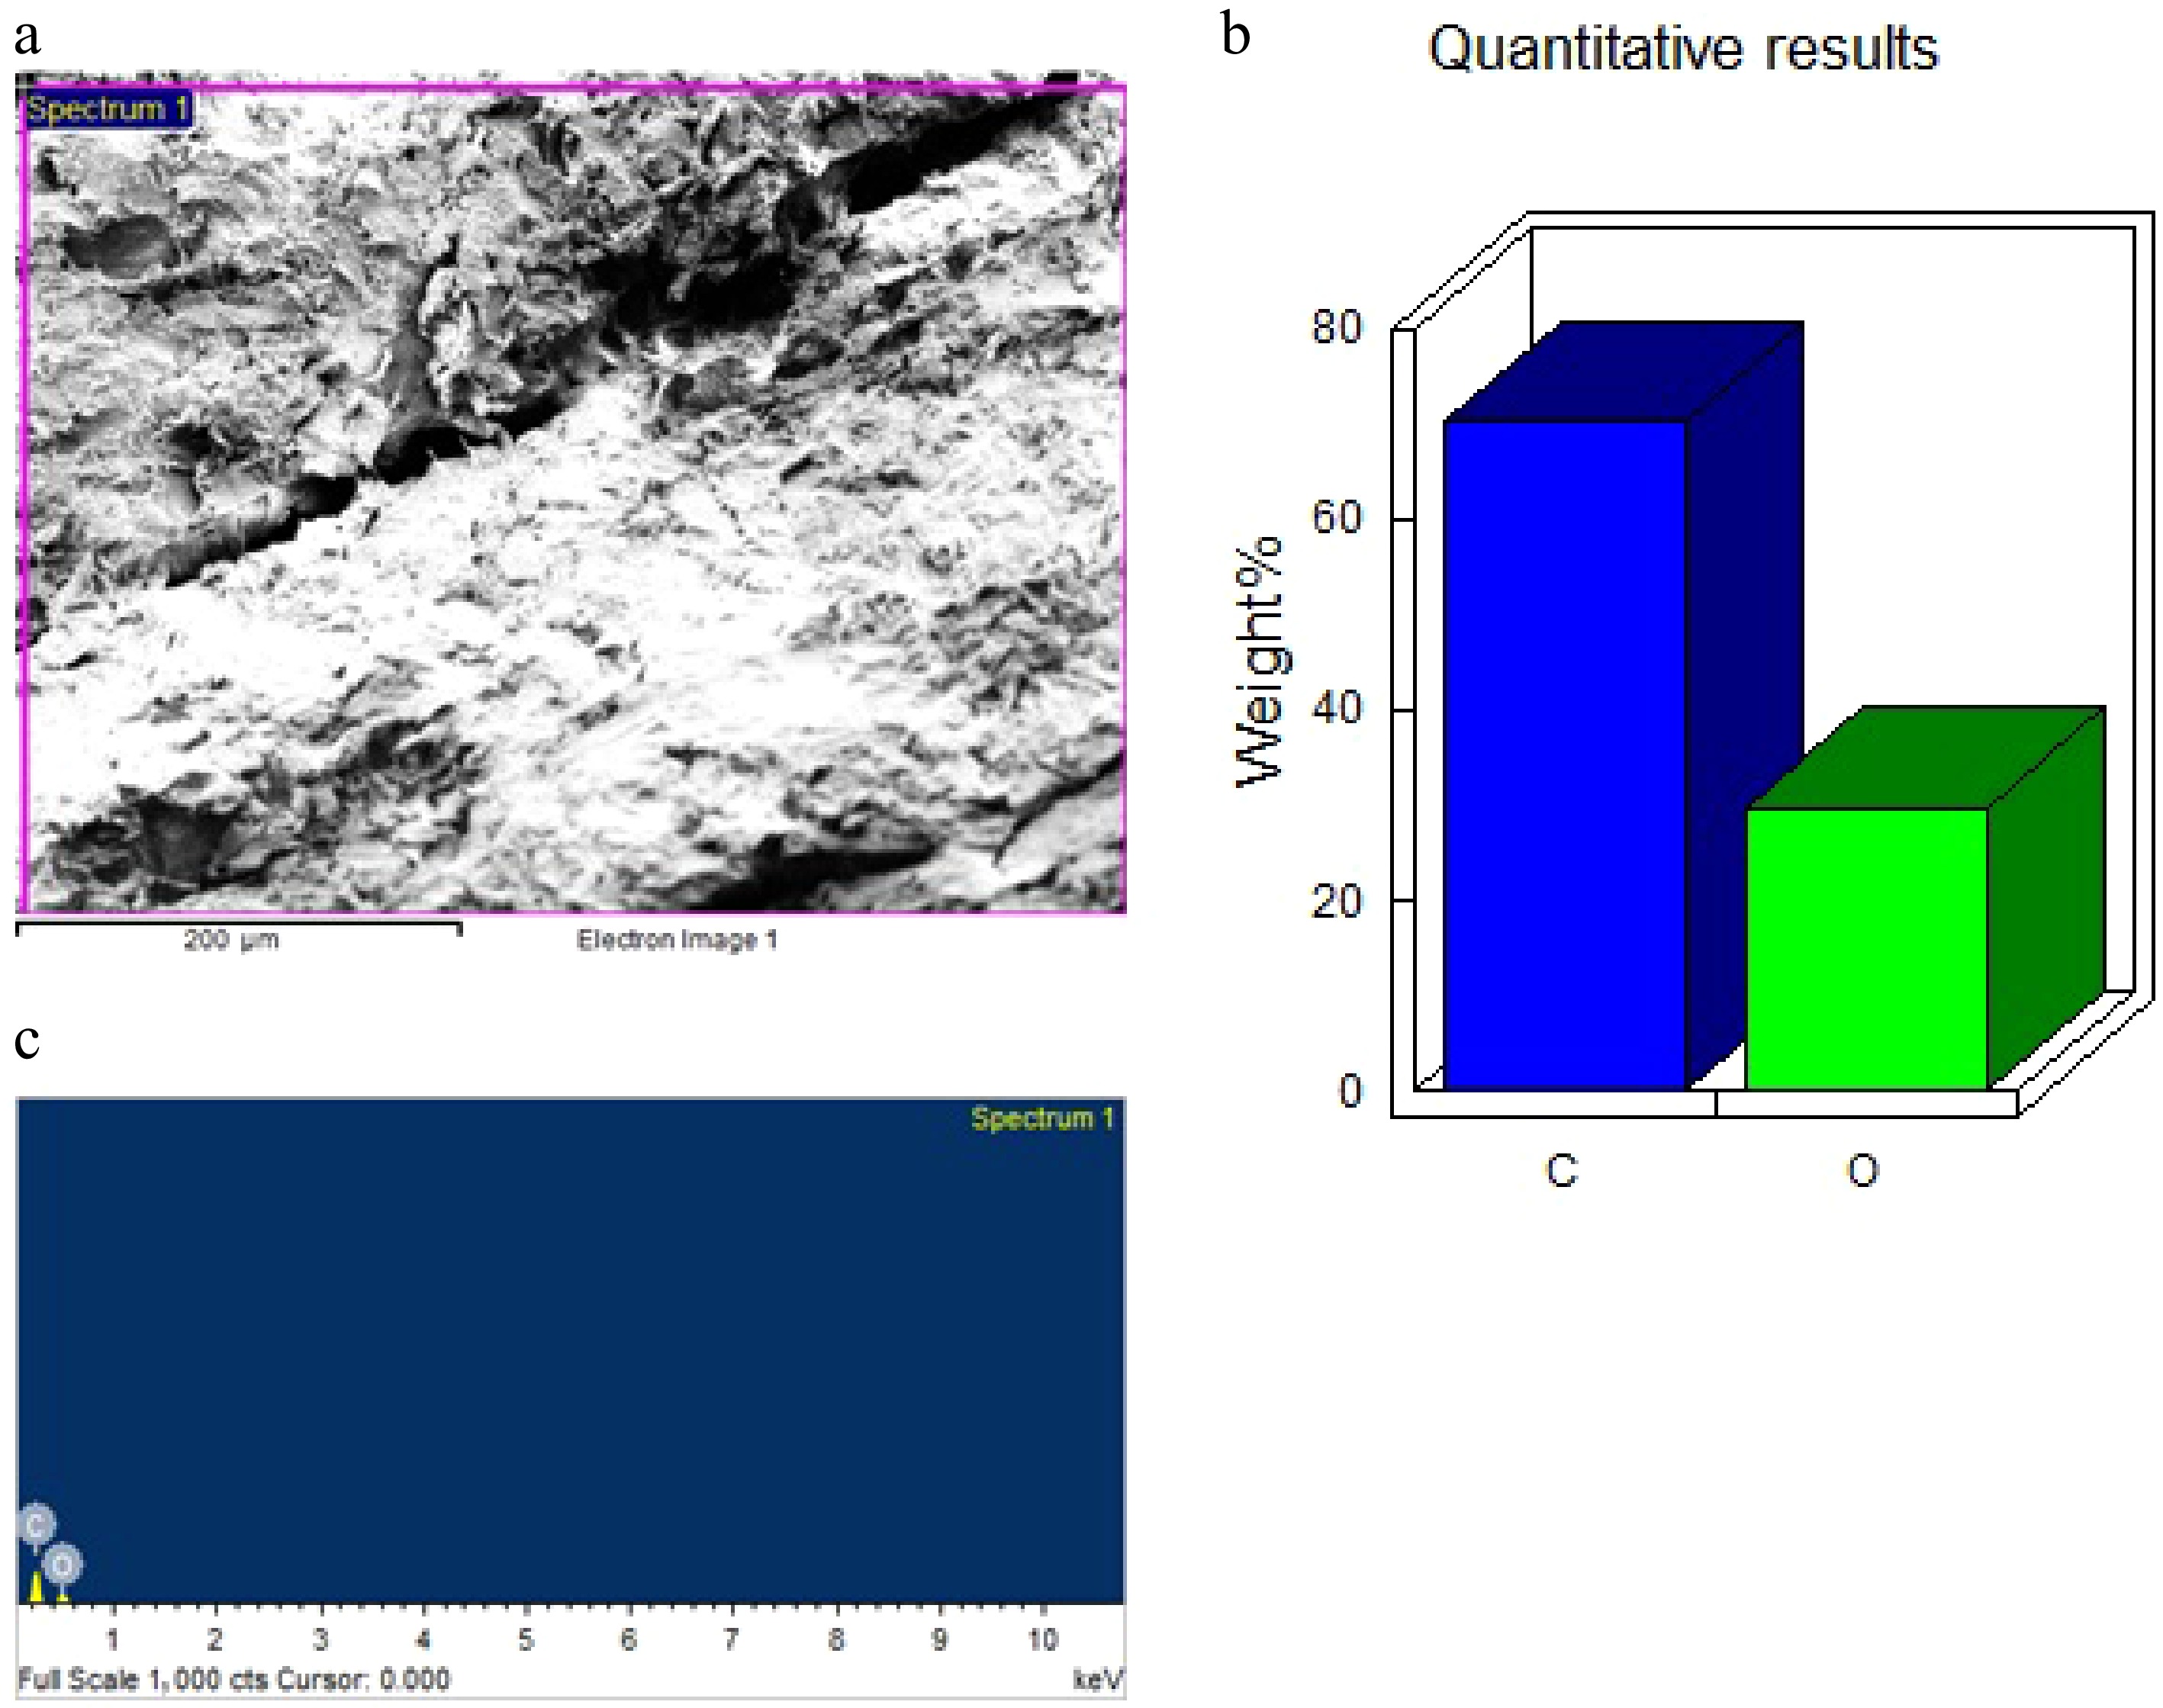
Figure 8.
EDX spectra of the NC-TiO2-5% composite. (a) SEM image of surface morphology. (b) EDS quantitative elemental composition (wt%). (c) Corresponding EDS spectrum.
-
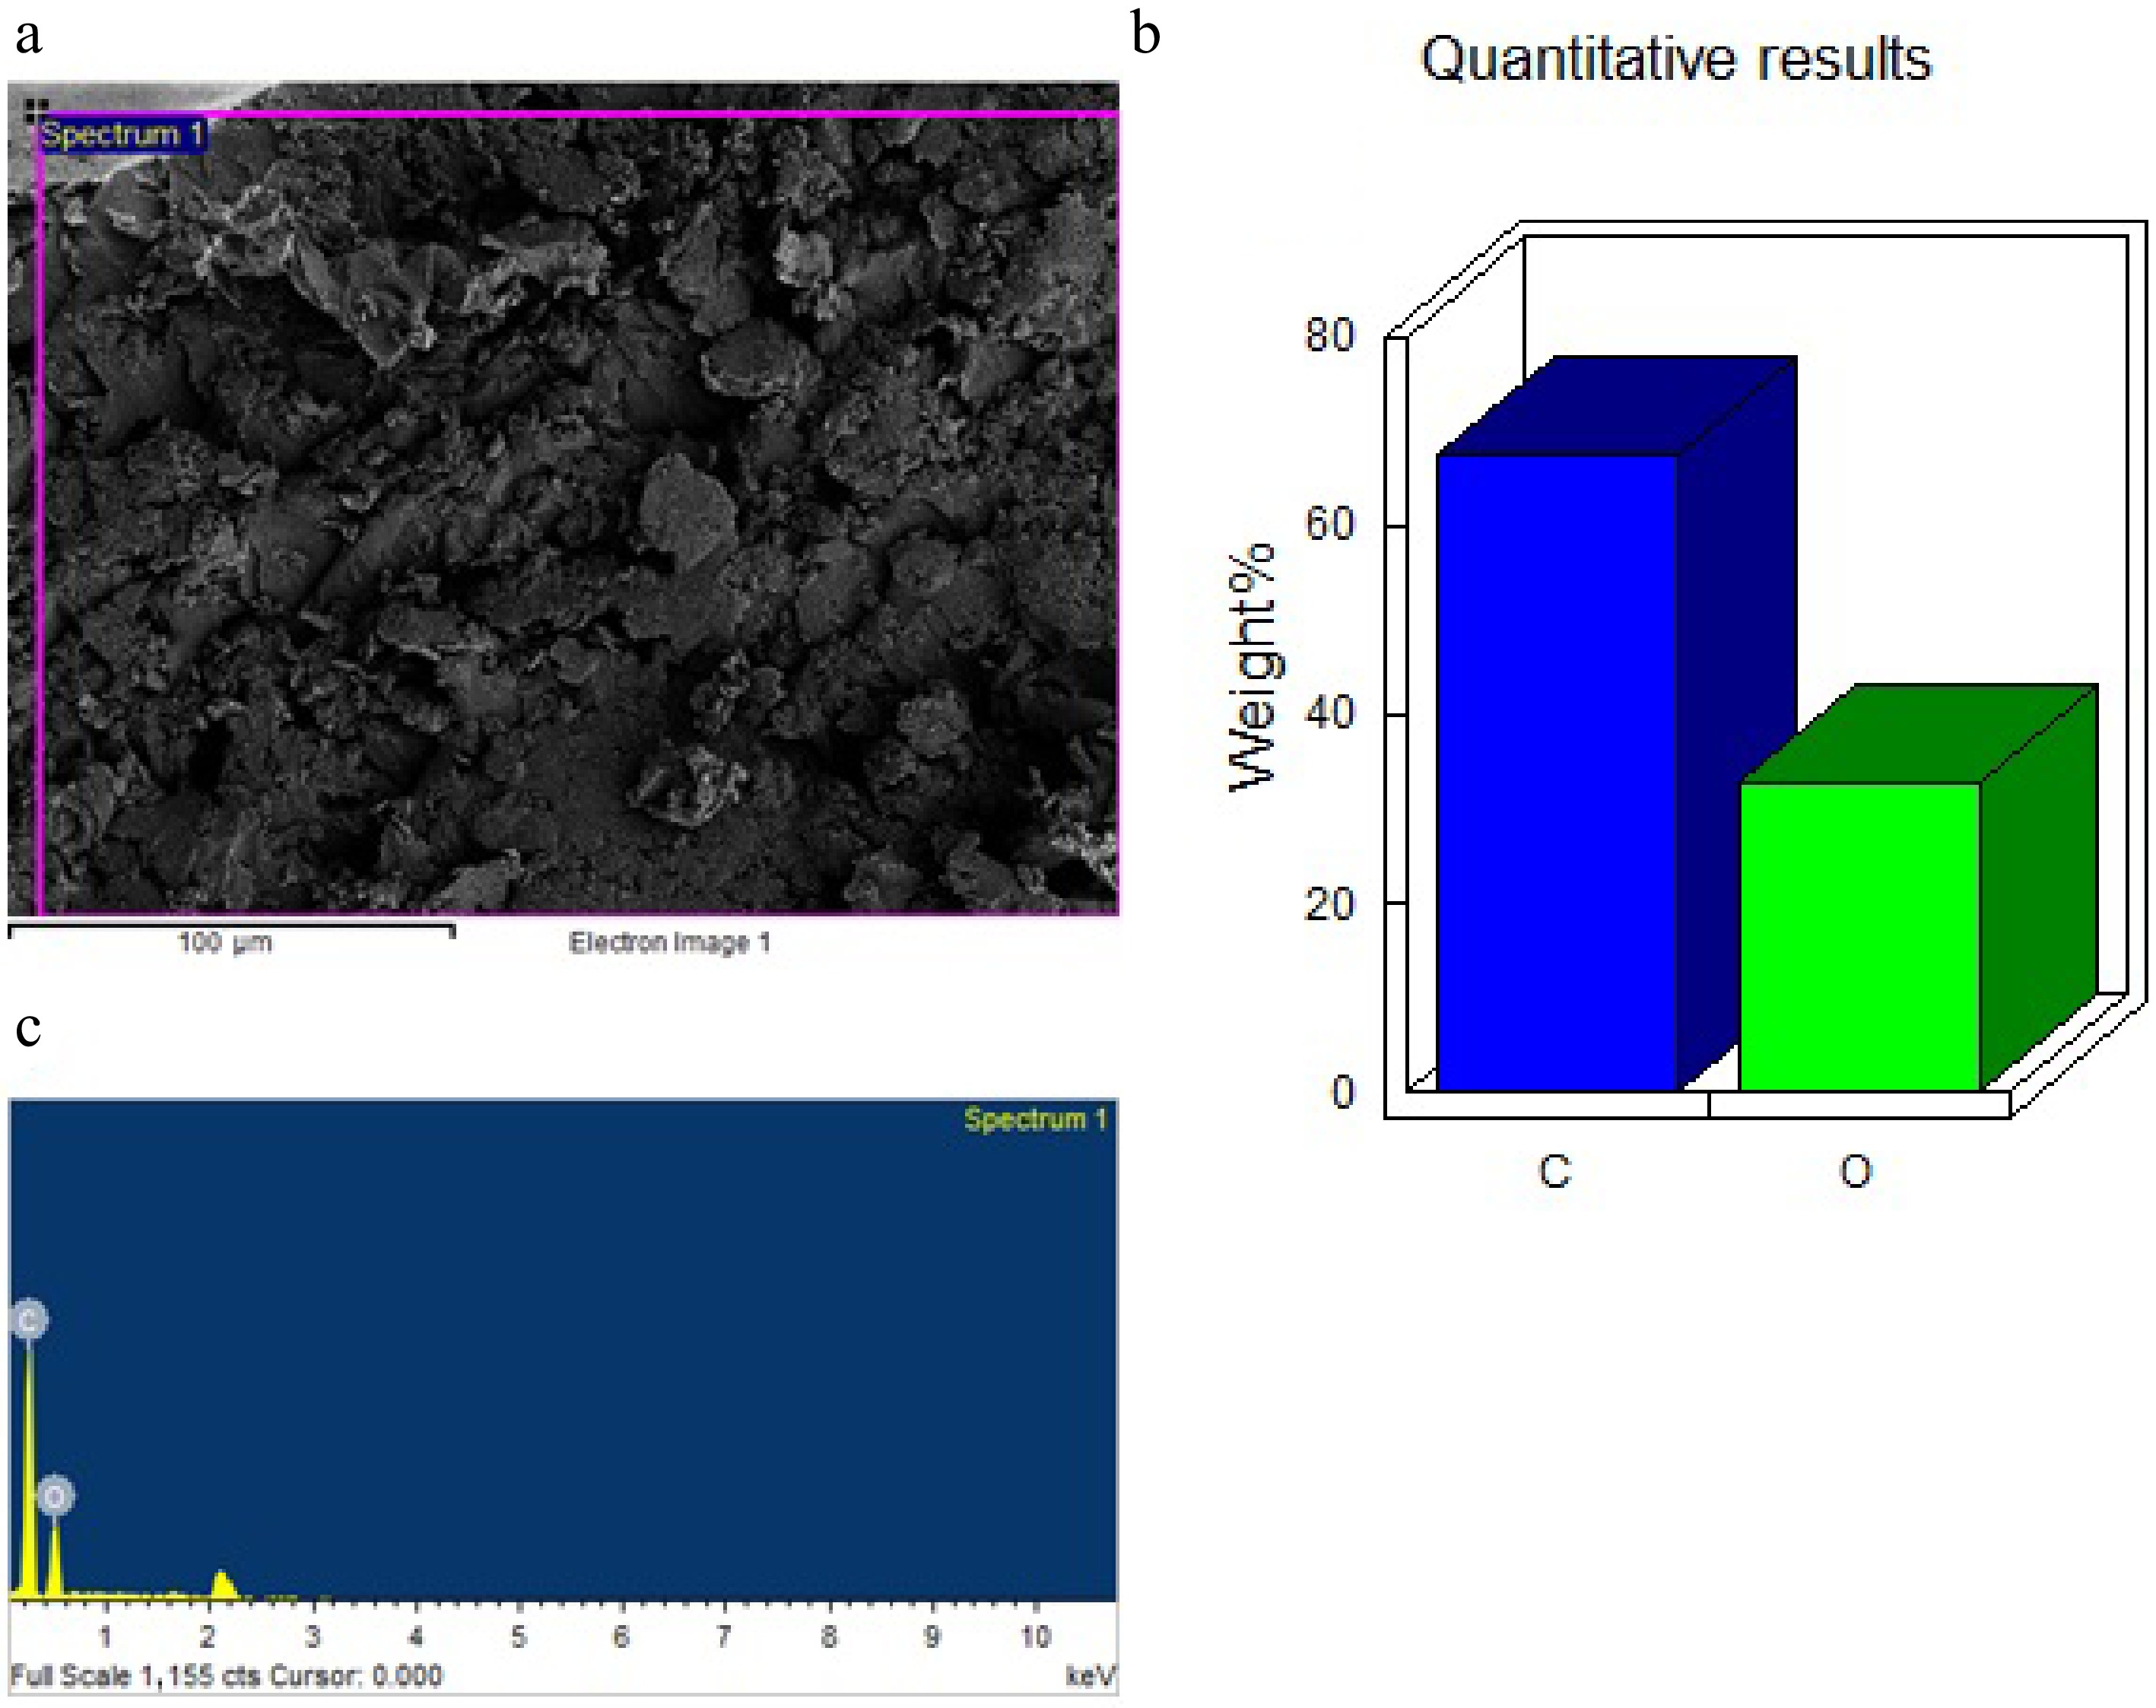
Figure 9.
EDX spectra of the NC-TiO2-10% composite. (a) SEM image of surface morphology. (b) EDS quantitative elemental composition (wt%). (c) Corresponding EDS spectrum.
-
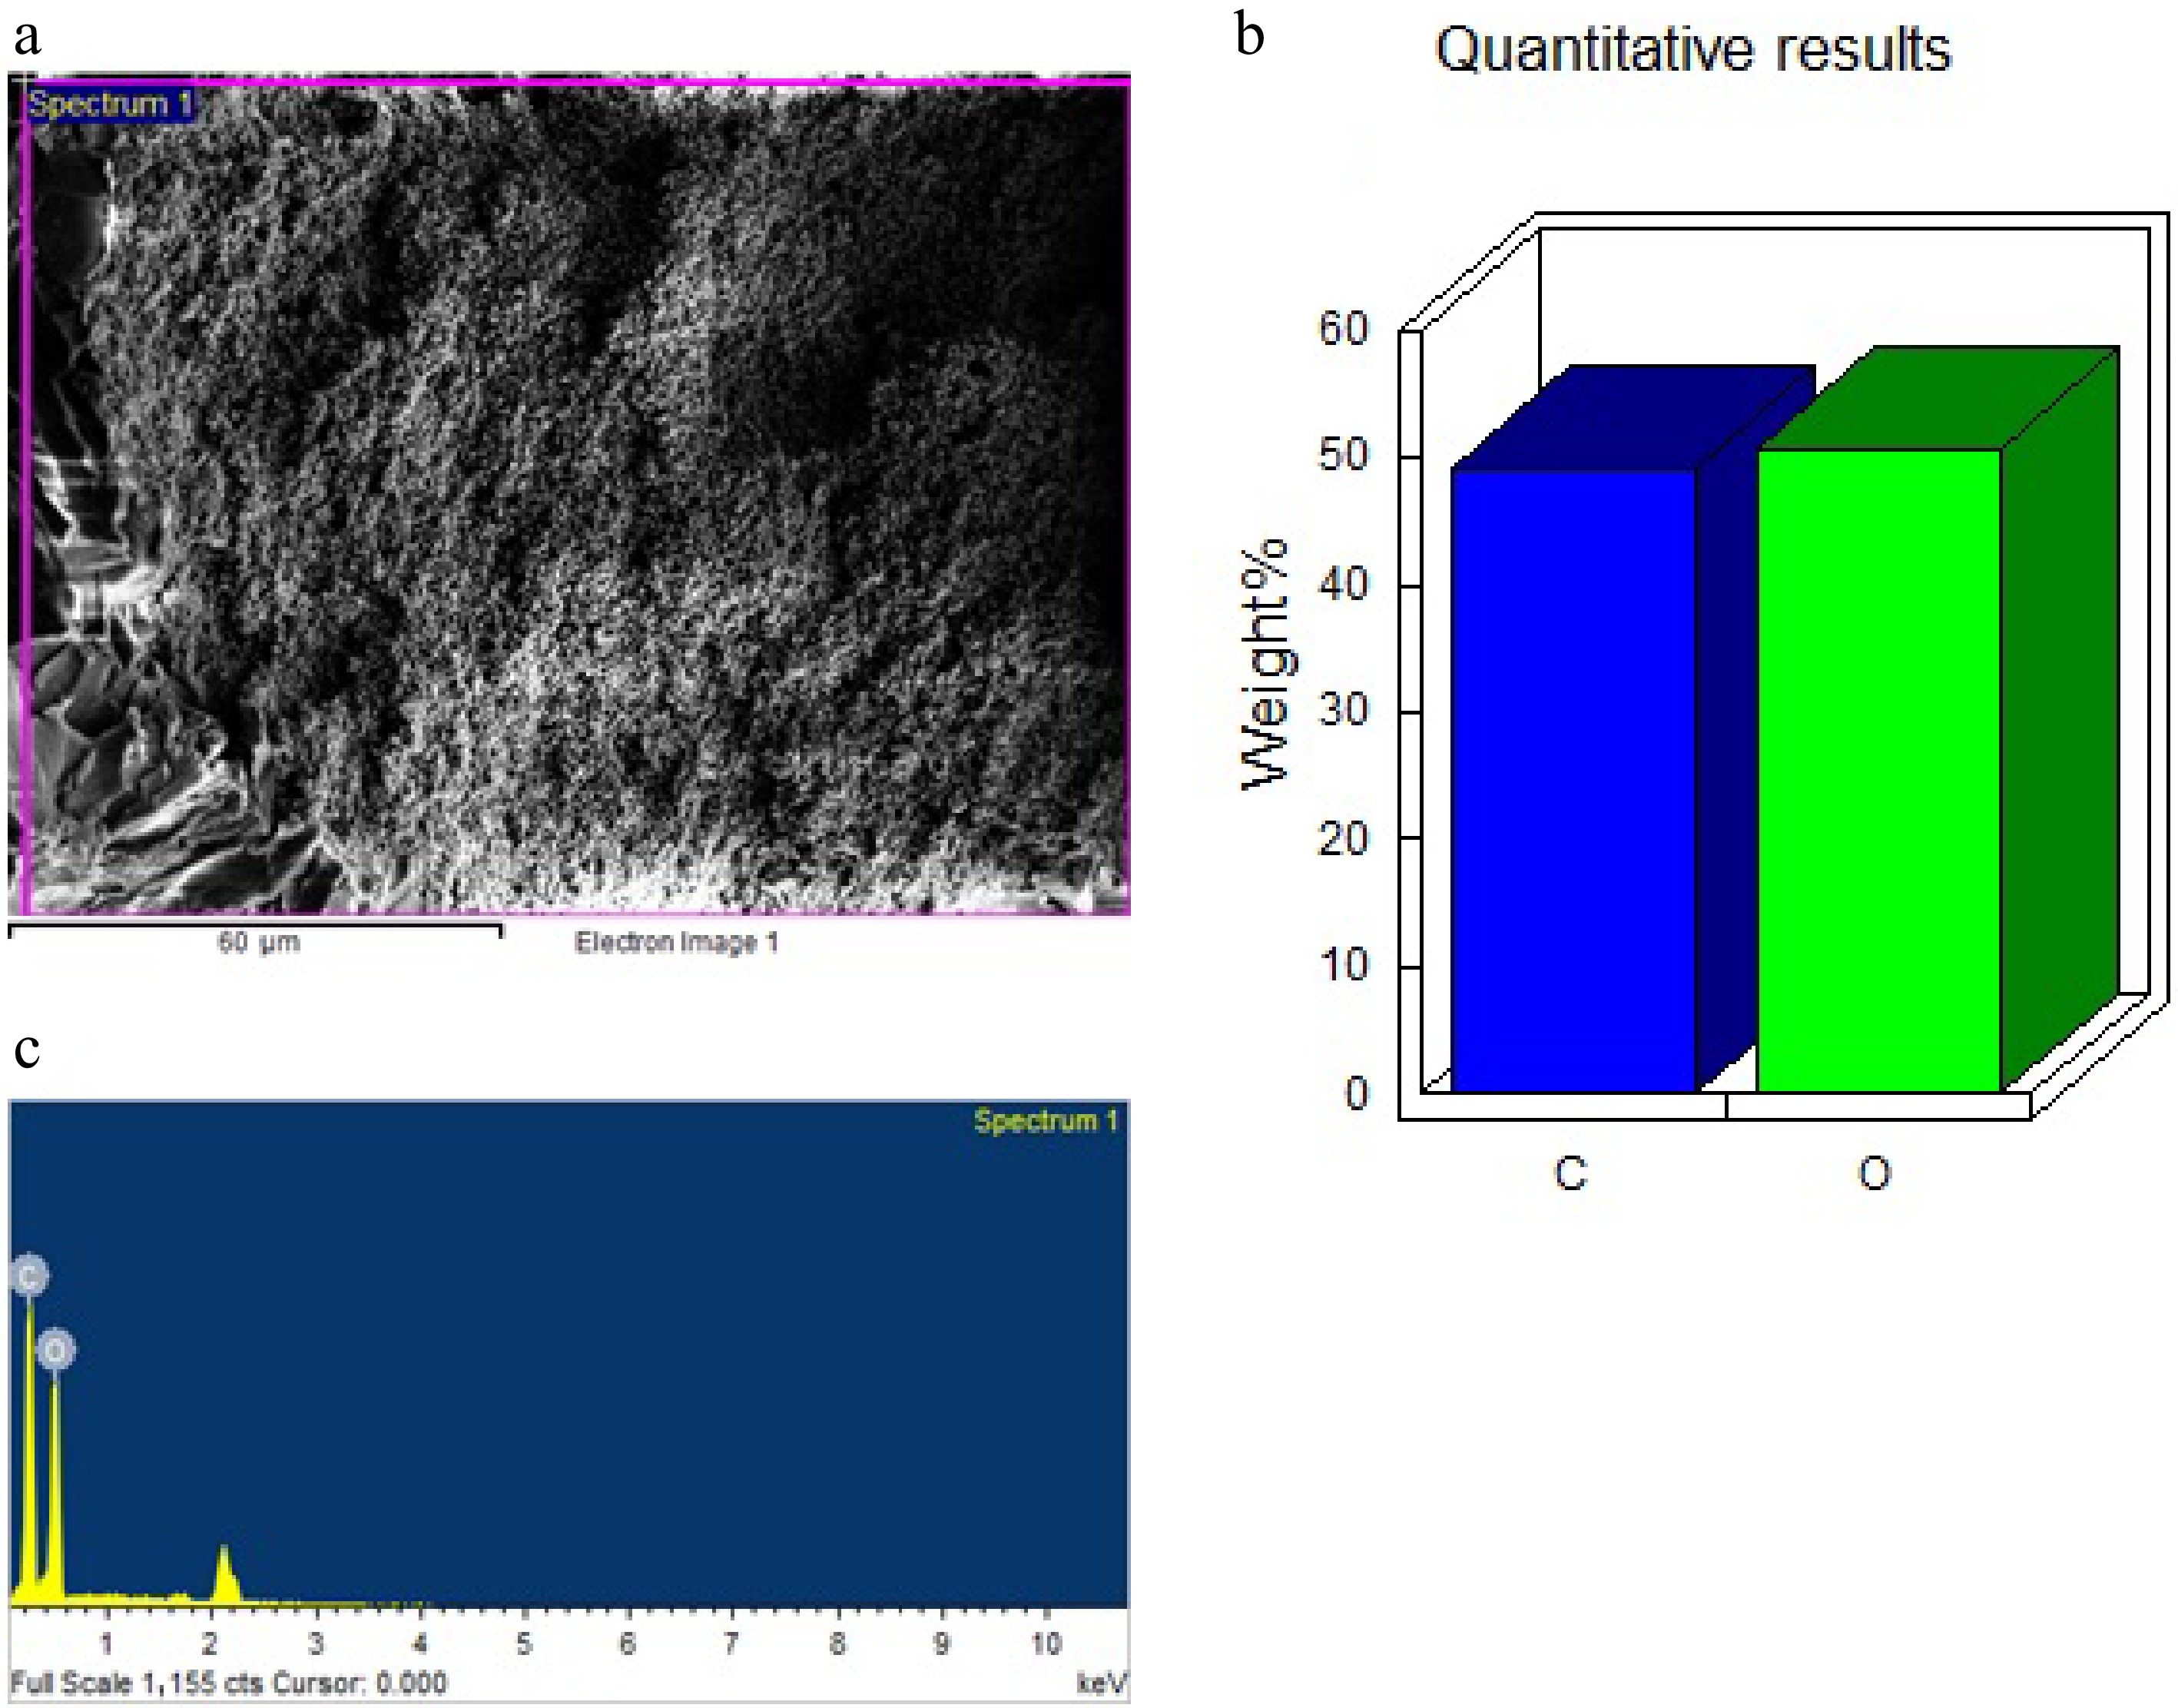
Figure 10.
EDX spectra of the NC-TiO2-15% composite. (a) SEM image of surface morphology. (b) EDS quantitative elemental composition (wt%). (c) Corresponding EDS spectrum.
-
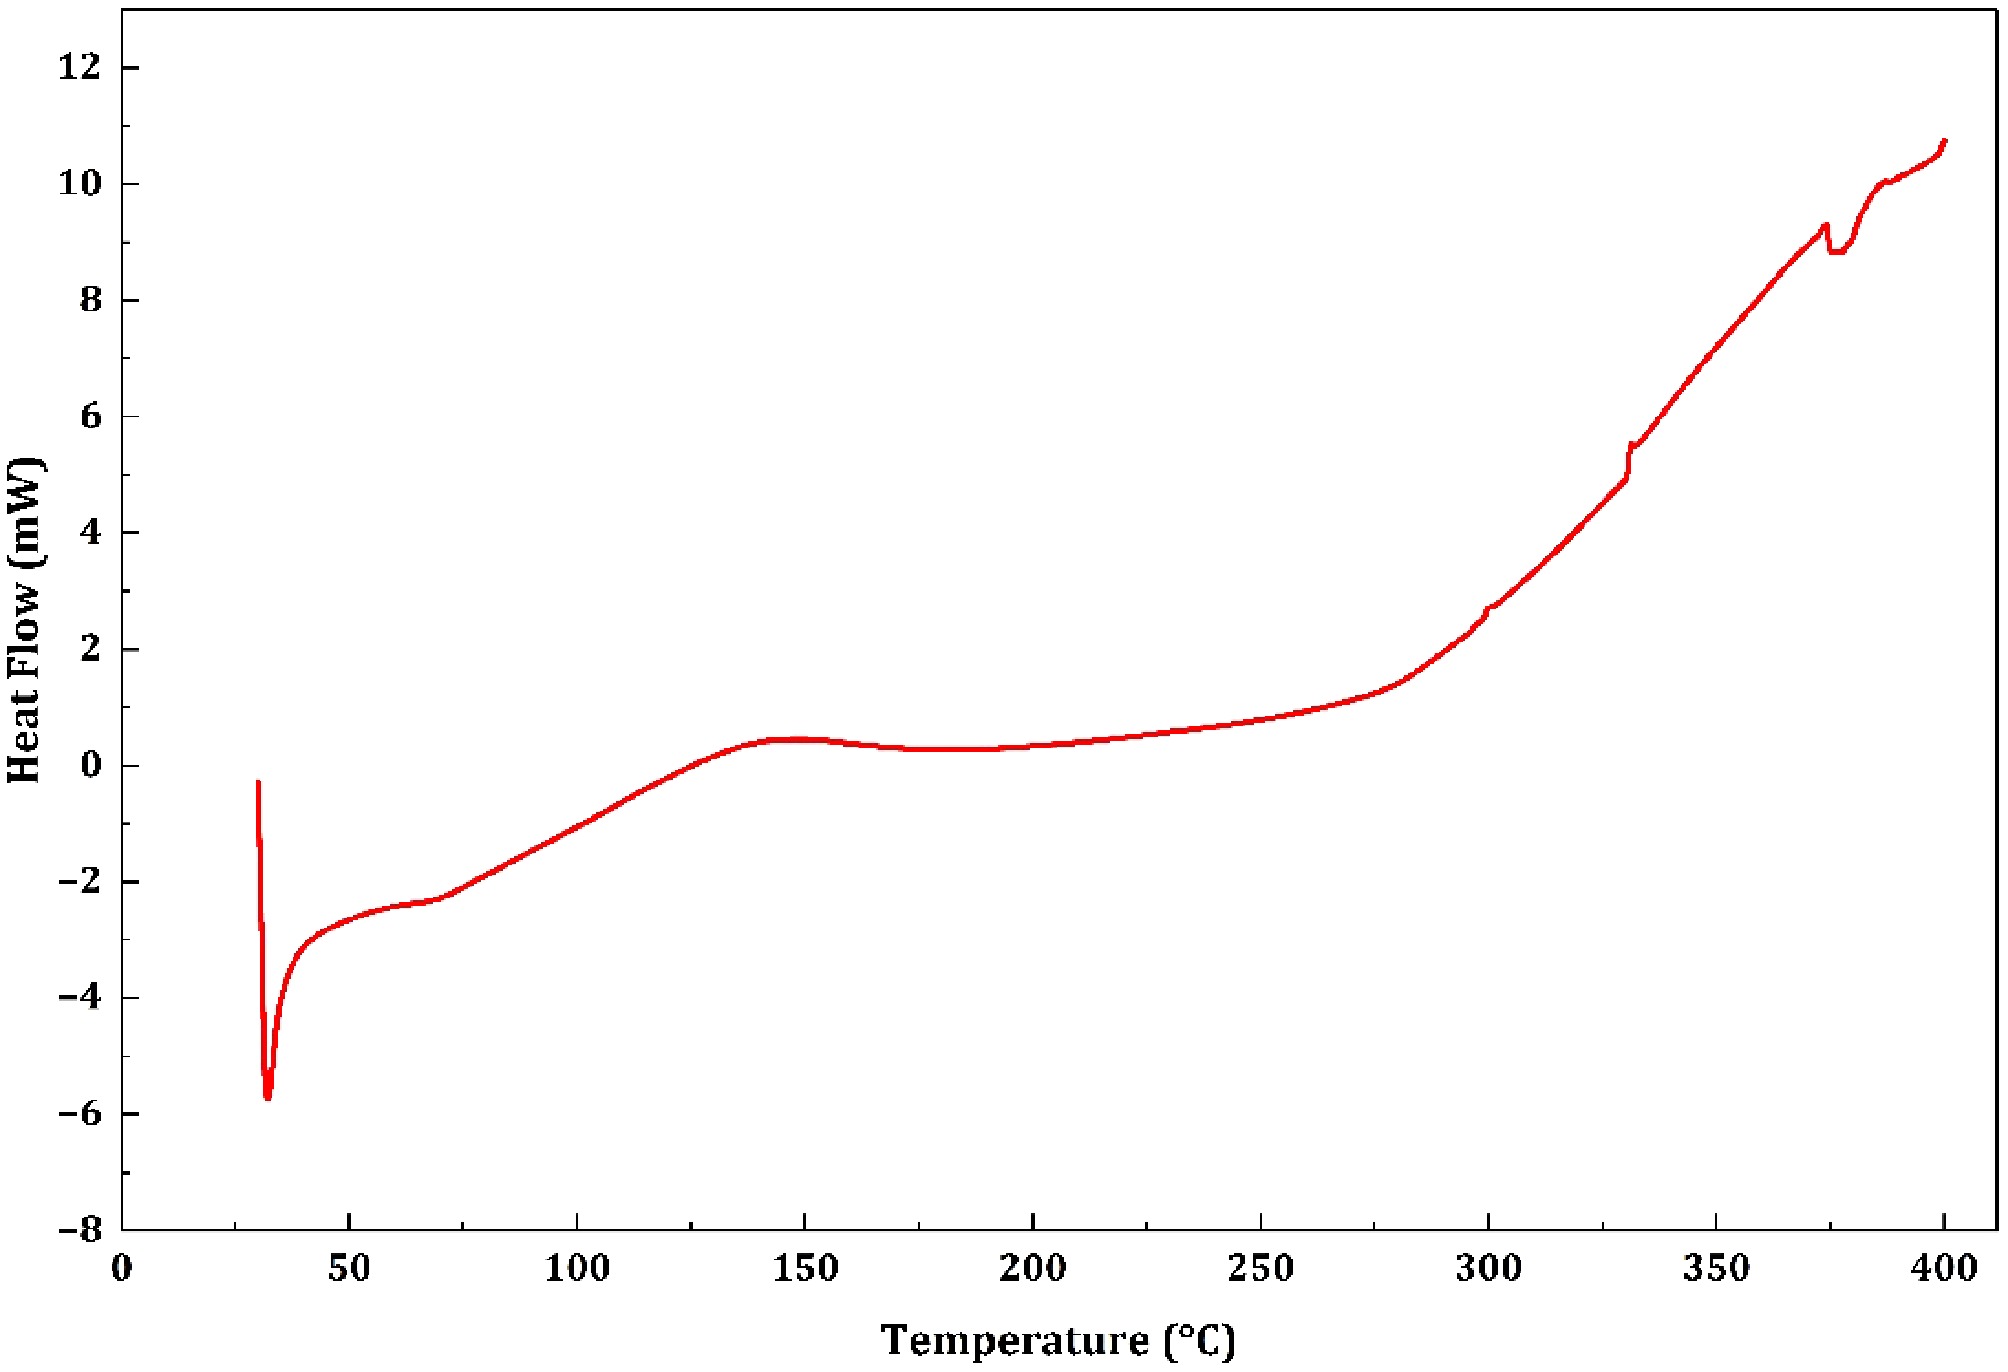
Figure 11.
DSC of NC-TiO2-5%.
-
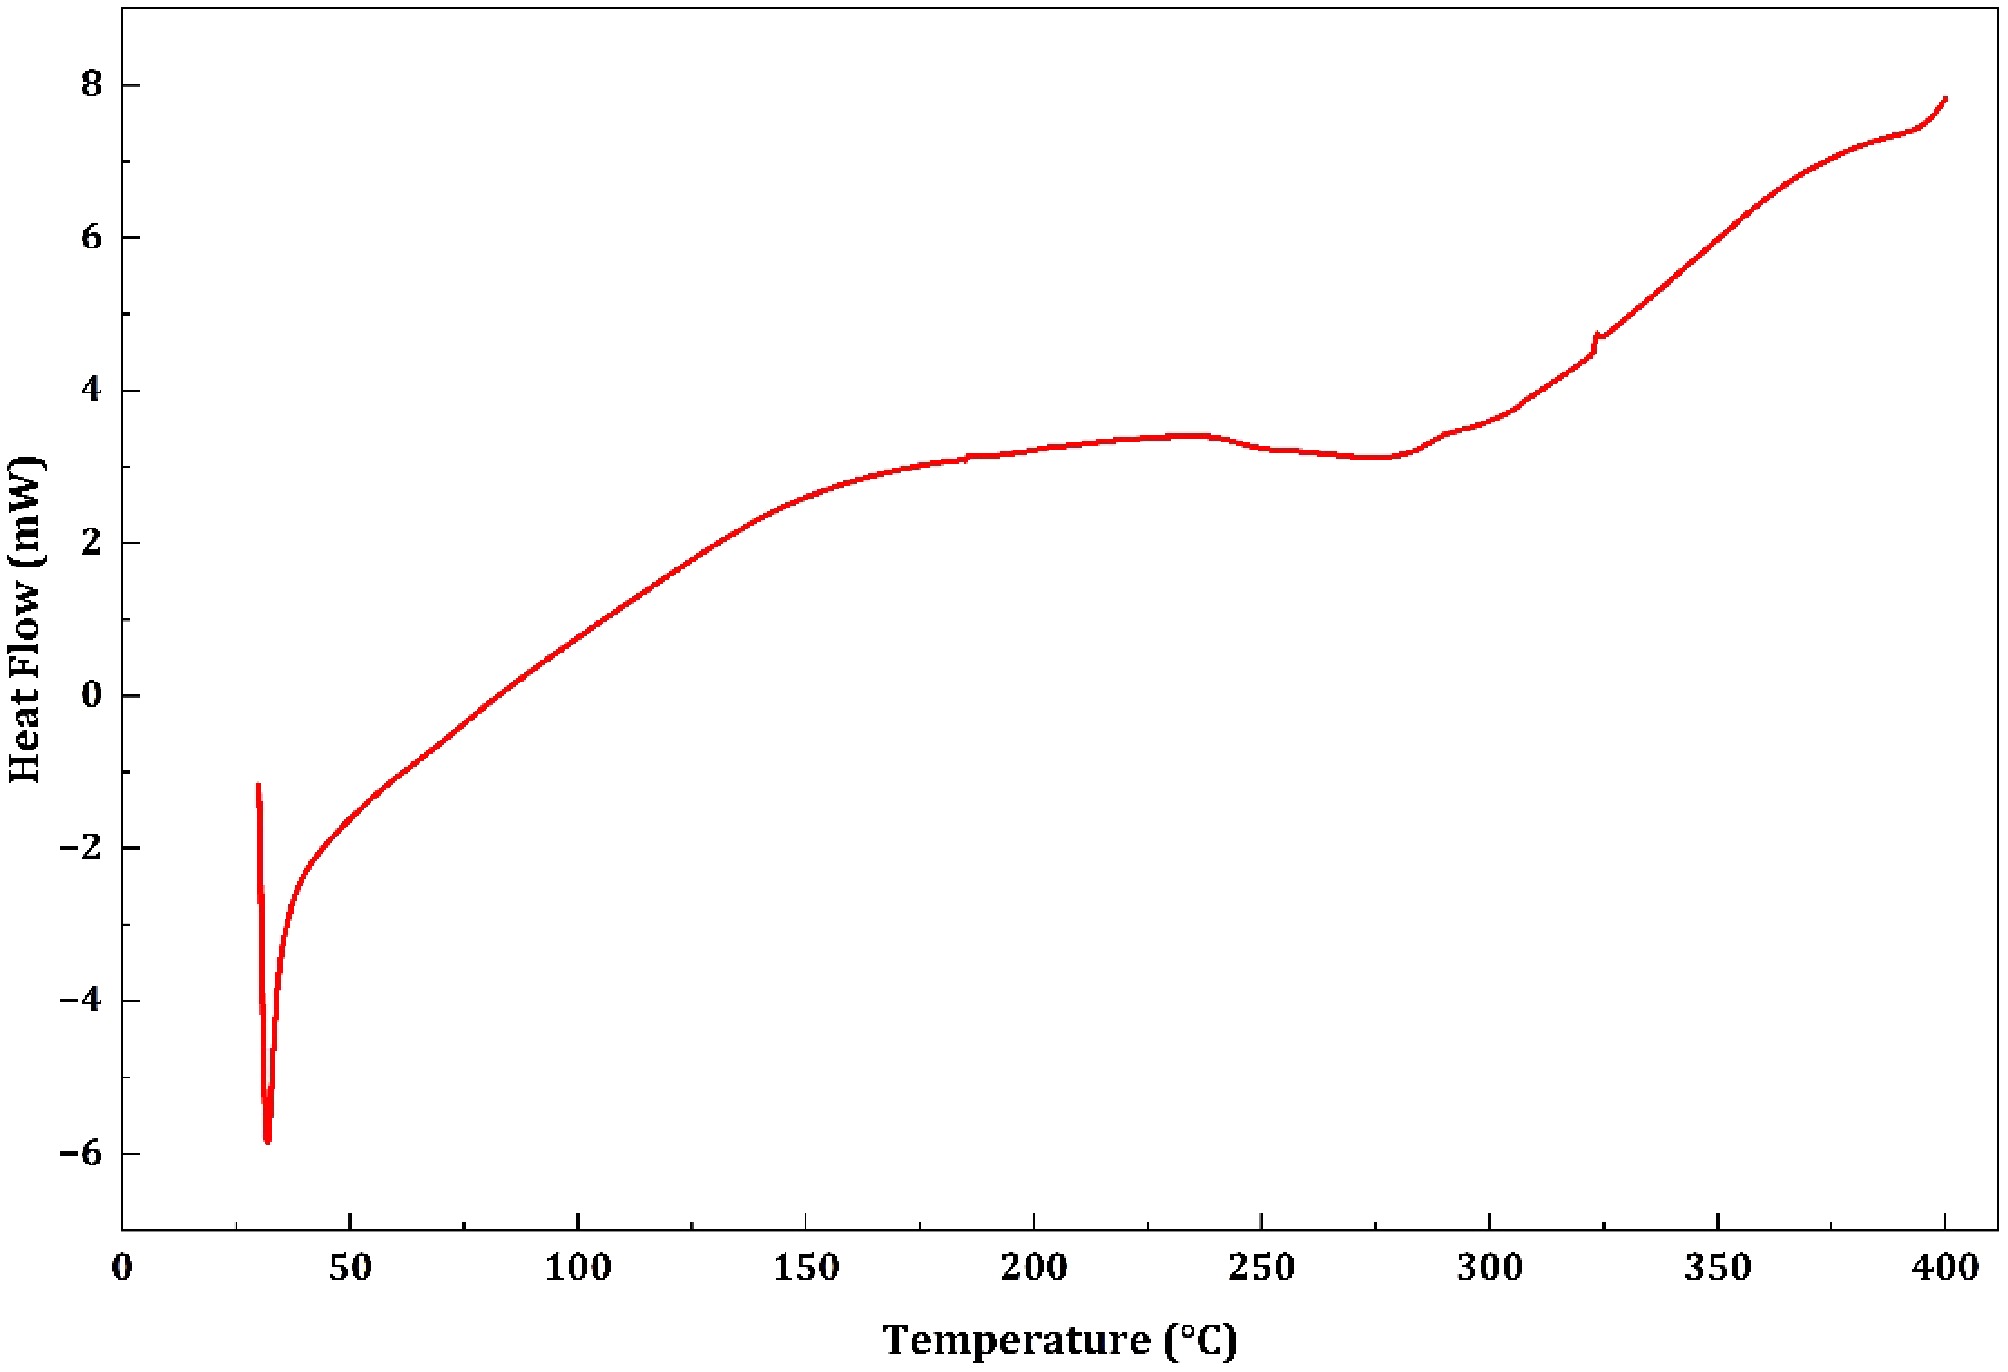
Figure 12.
DSC of NC-TiO2-10%.
-
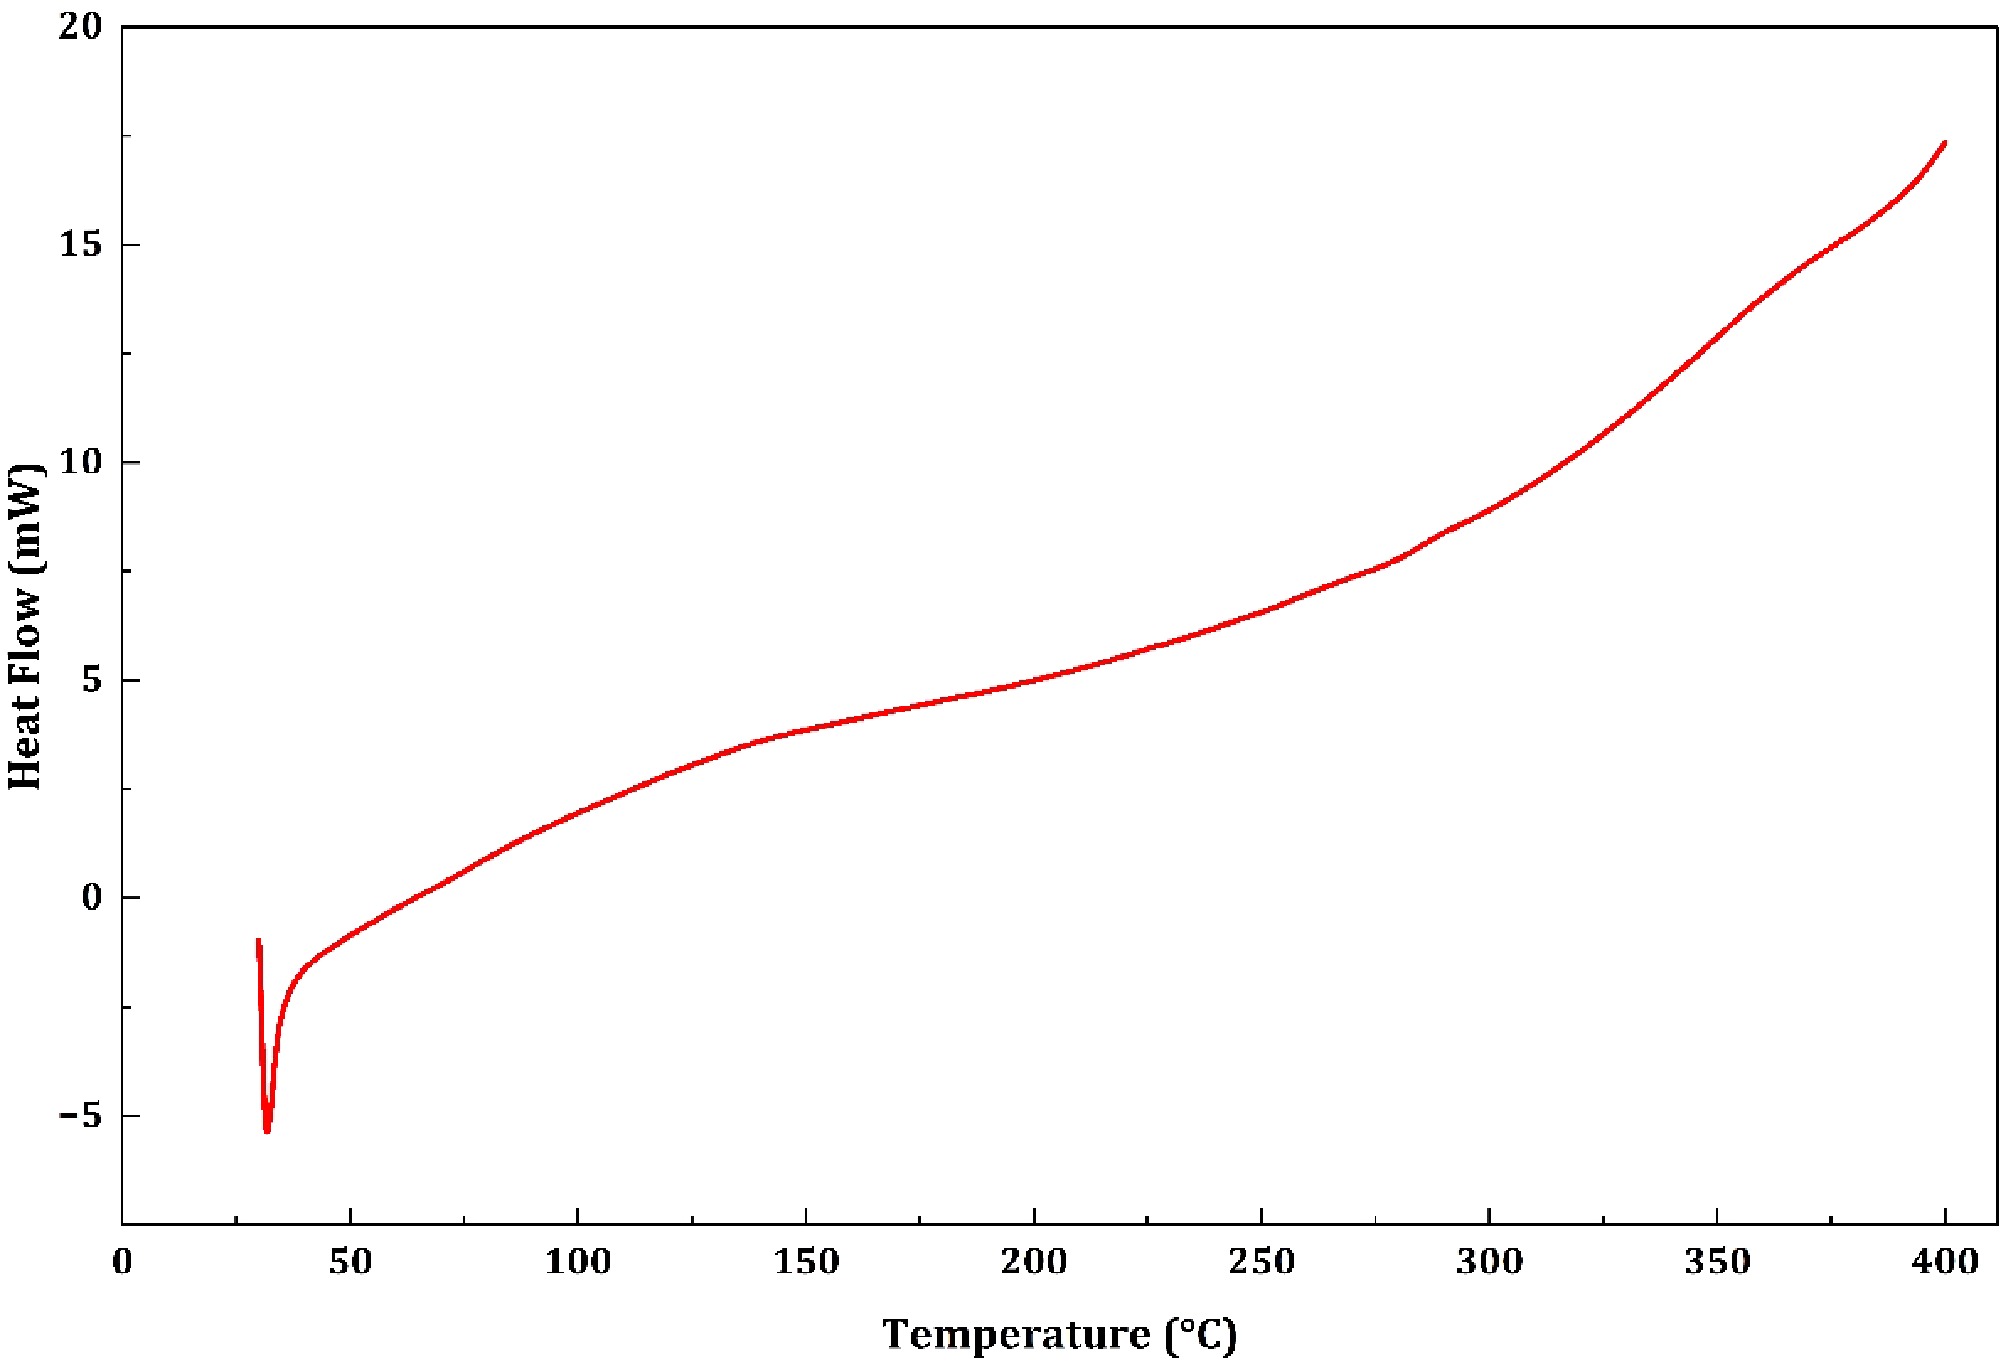
Figure 13.
DSC of NC-TiO2-15%.
-
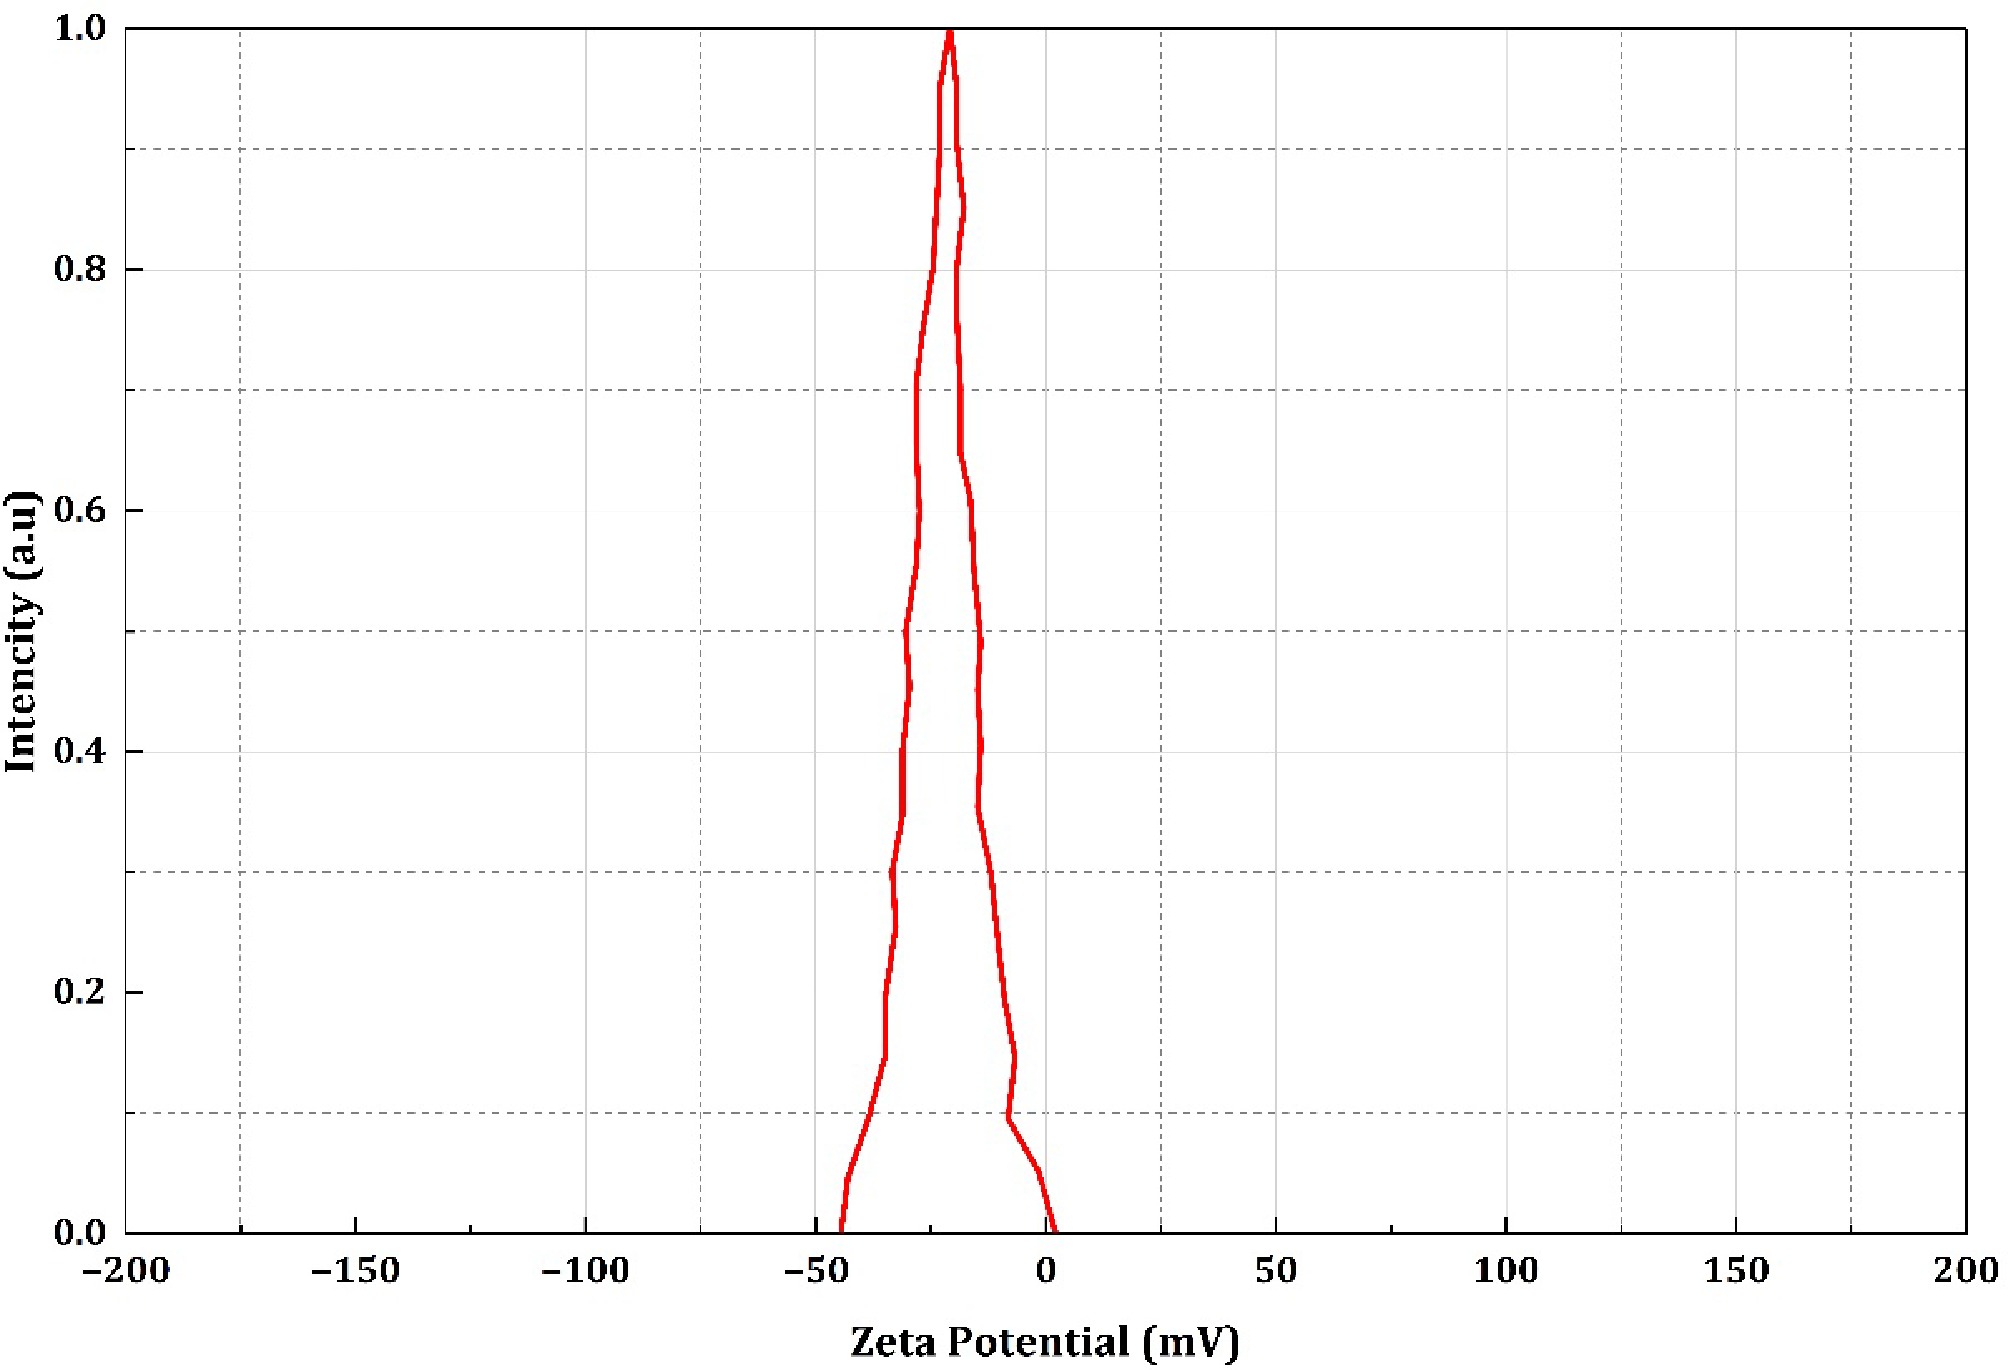
Figure 14.
ZPA of NC-TiO2-5%.
-
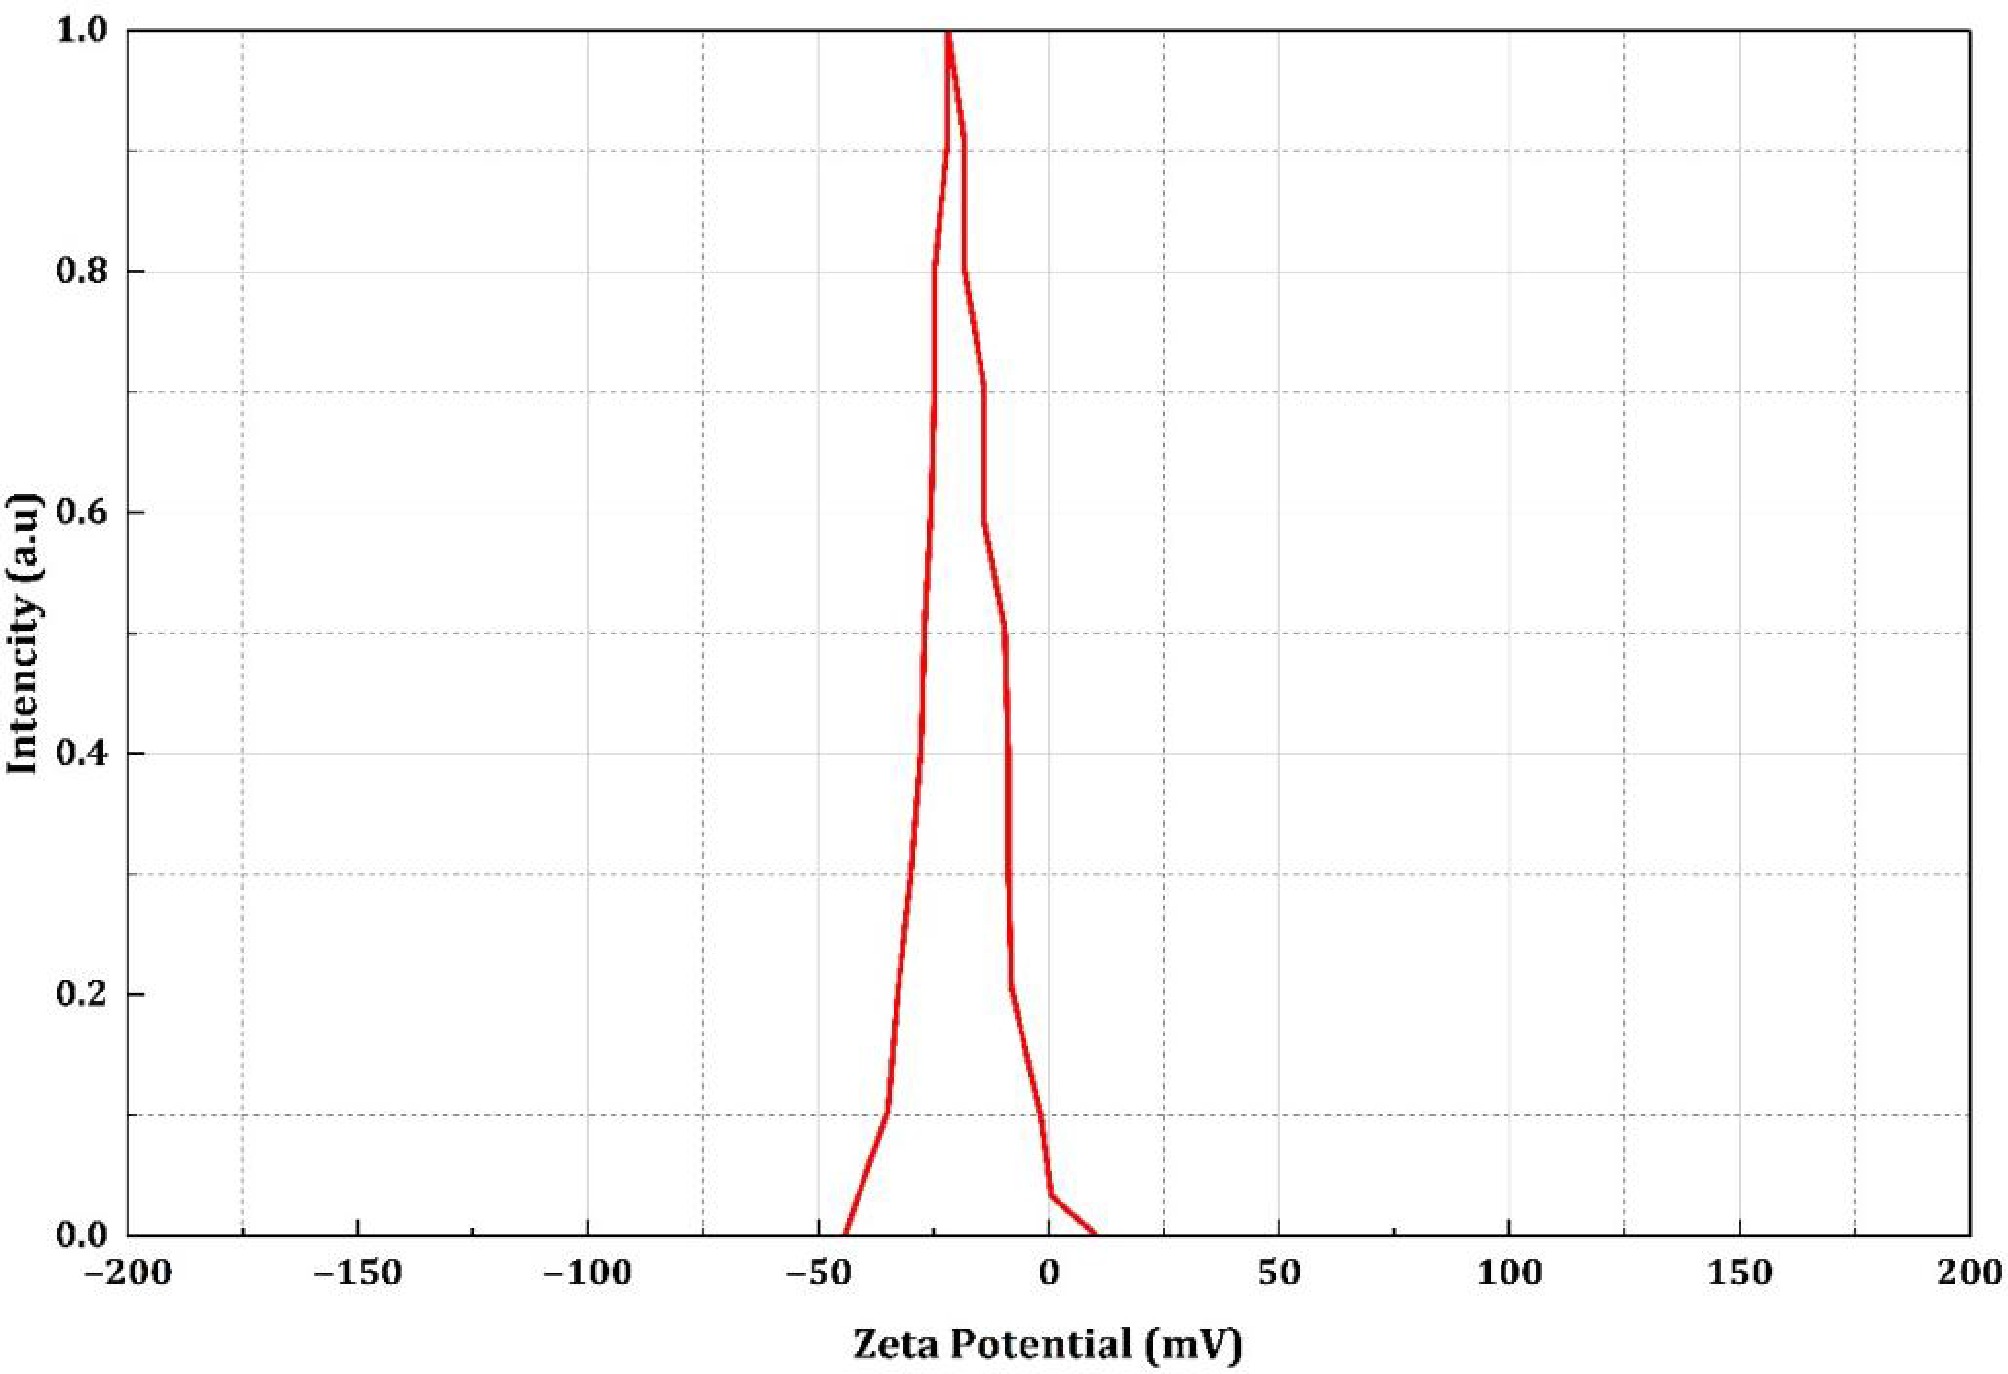
Figure 15.
ZPA of NC-TiO2-10%.
-
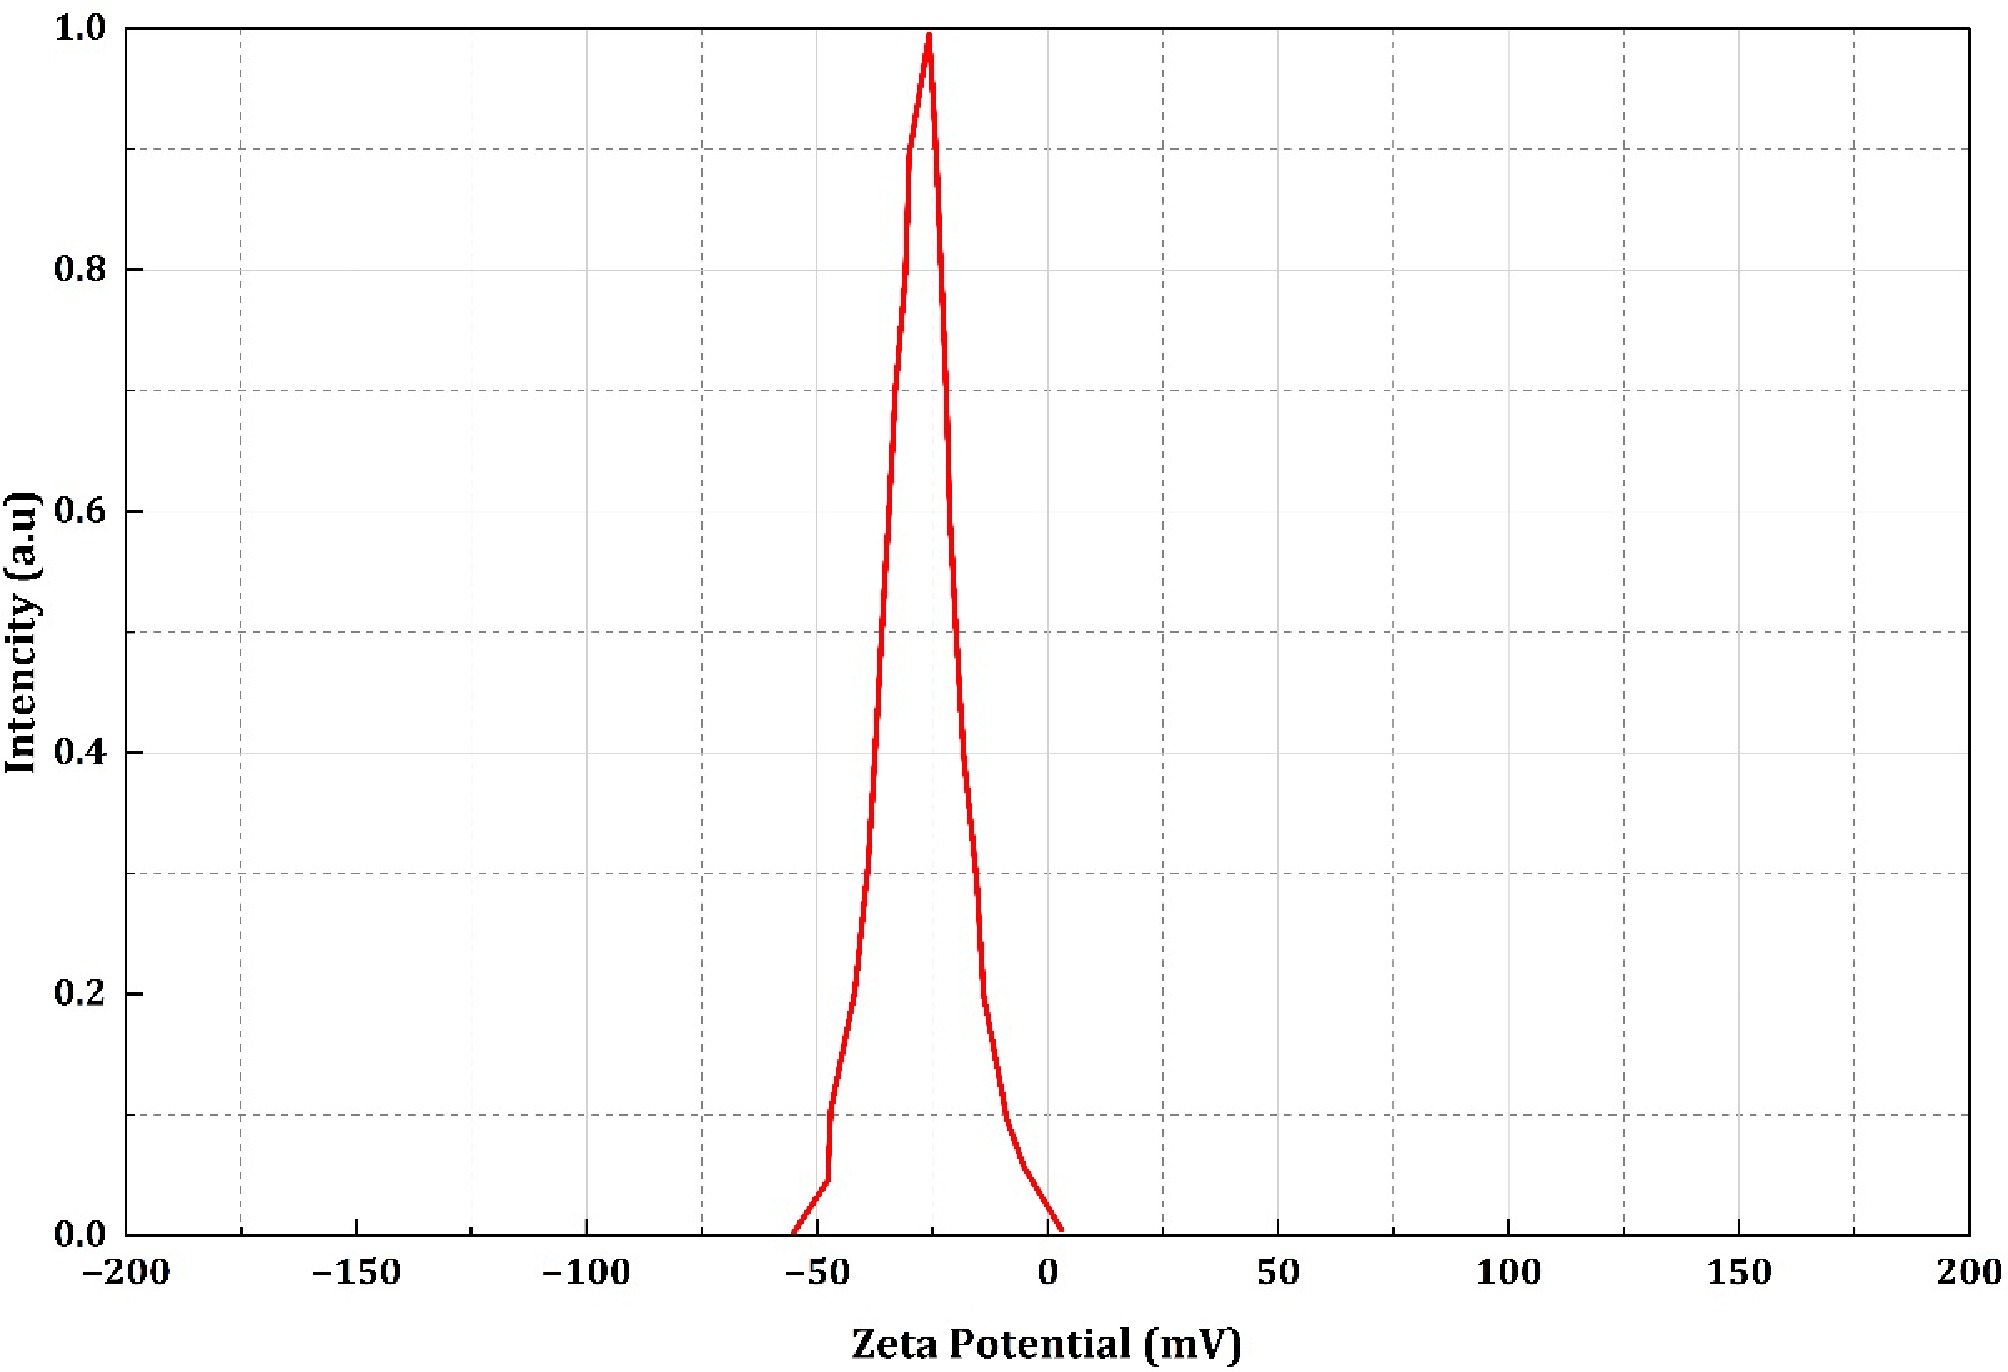
Figure 16.
ZPA of NC-TiO2-15%.
-
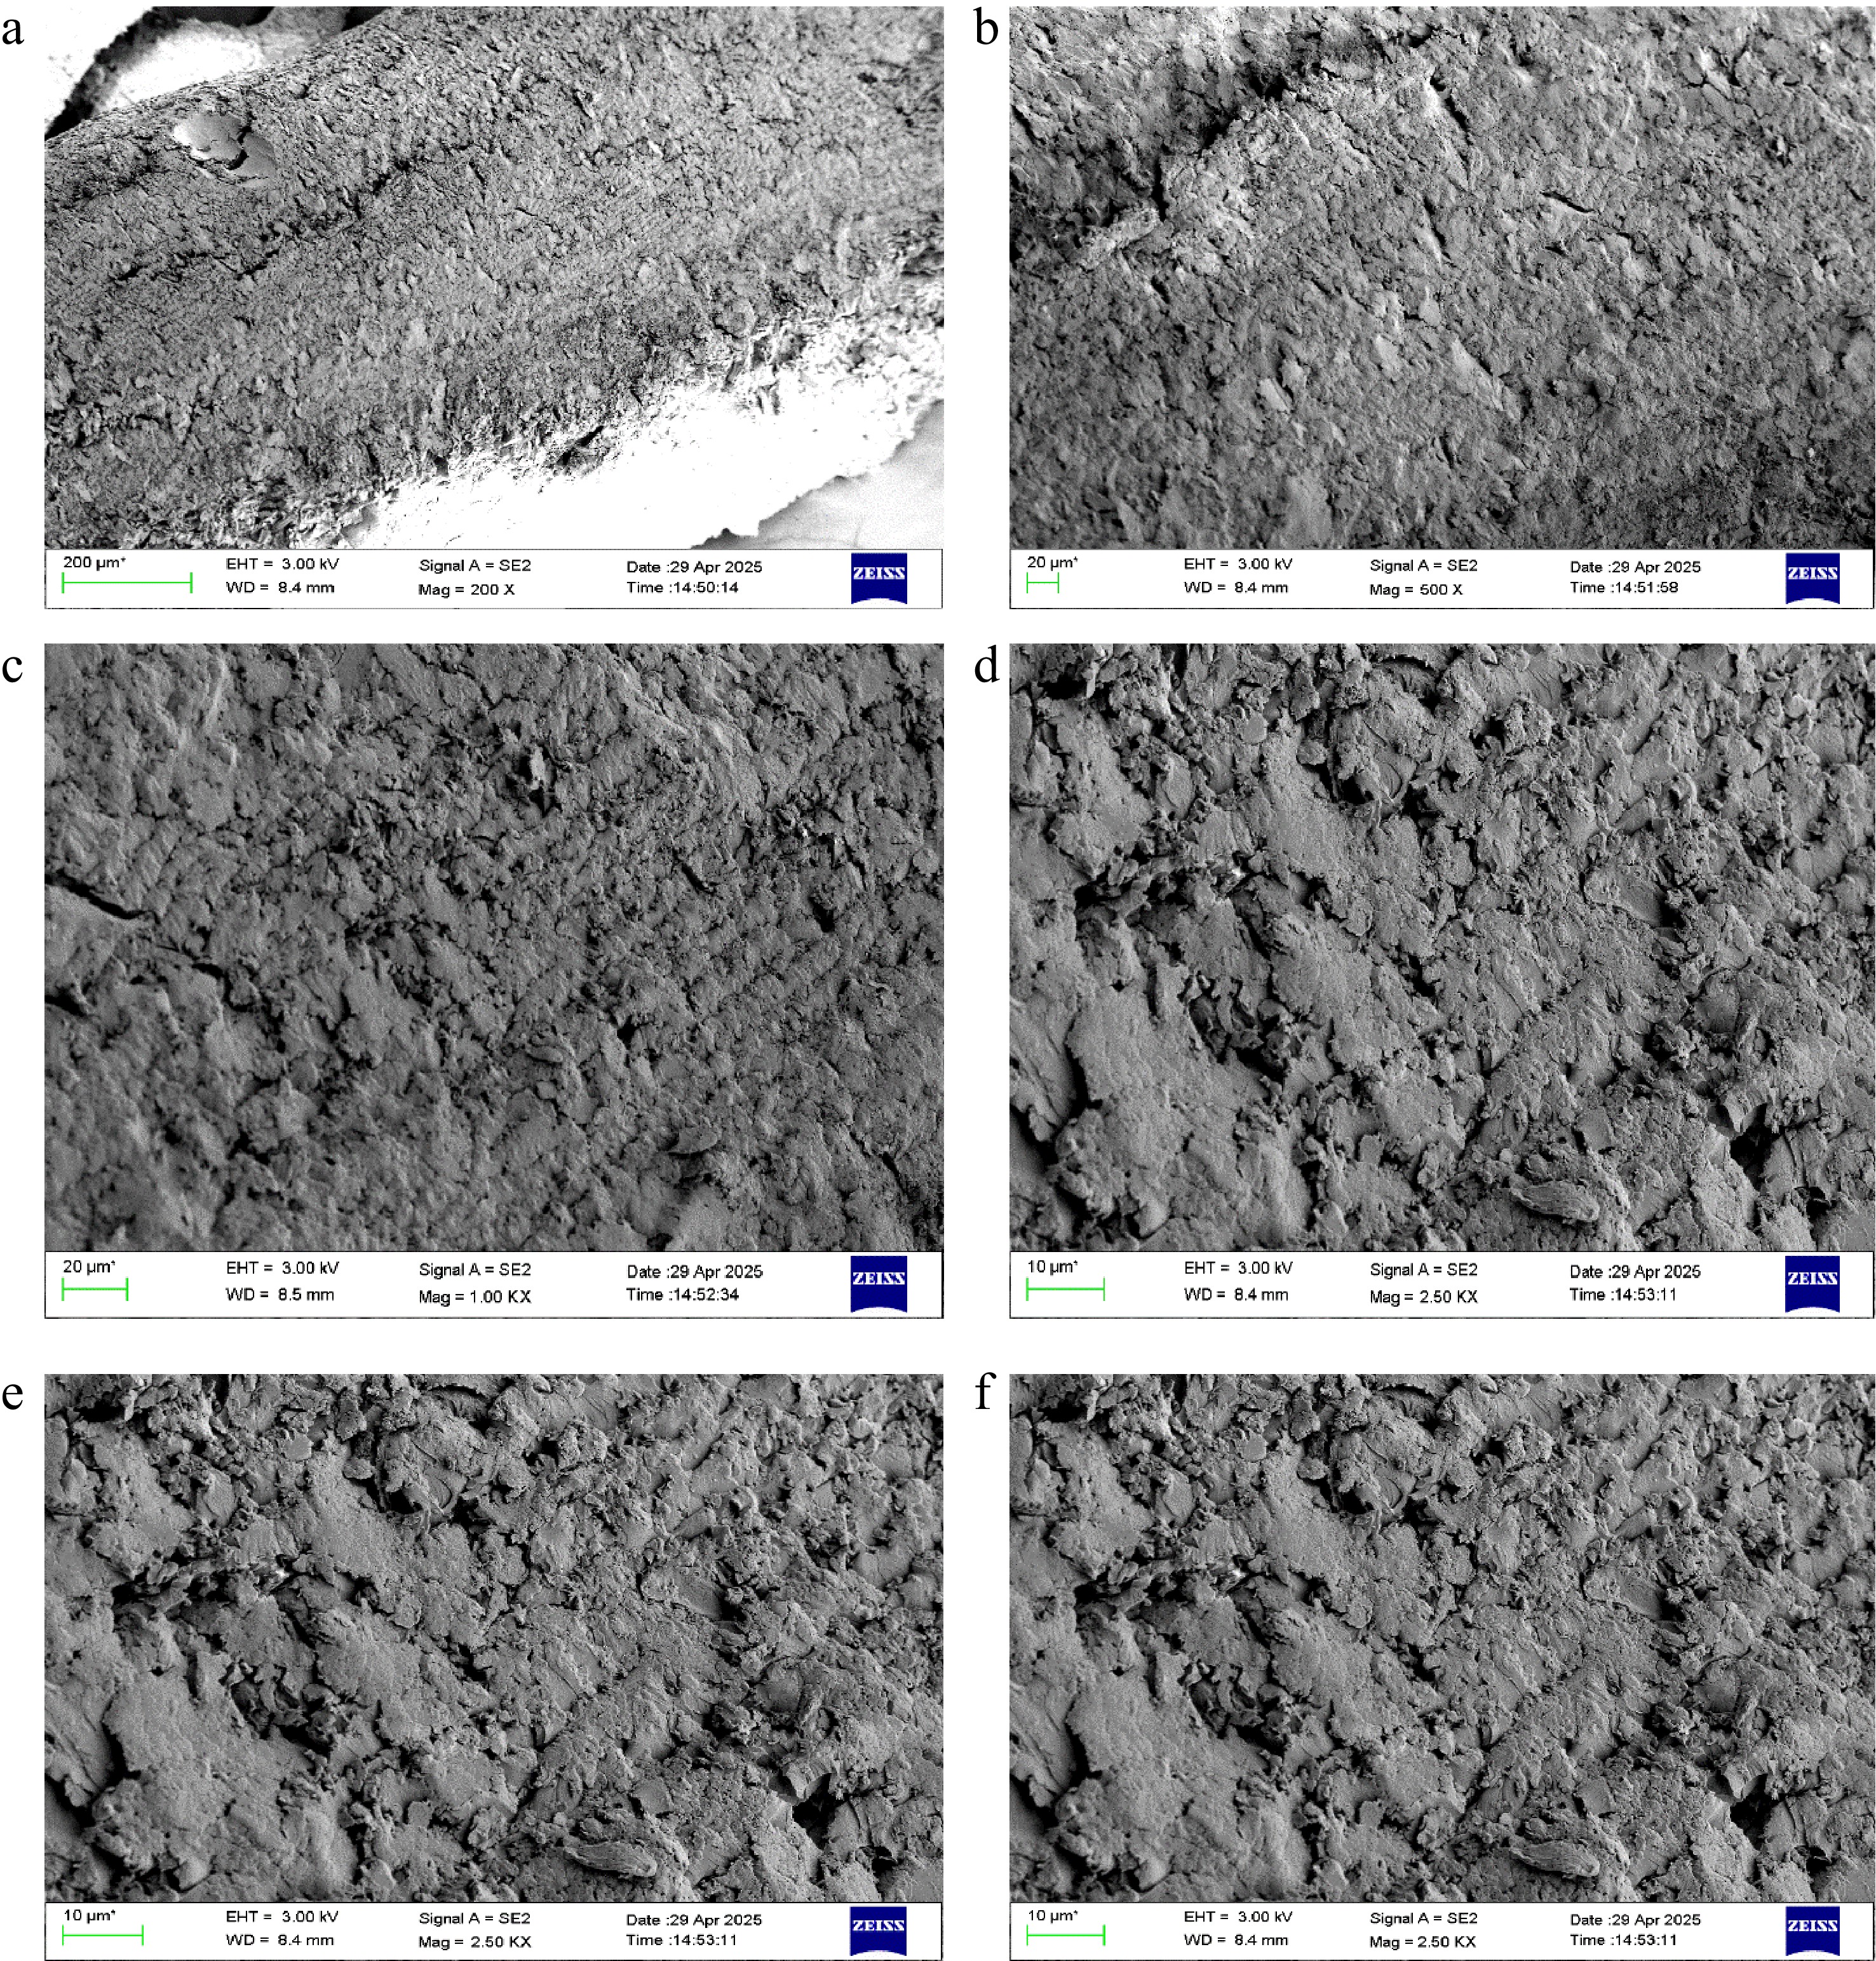
Figure 17.
SEM micrographs of NC-TiO2-5% composites showing surface morphology at different magnifications and regions, highlighting particle dispersion and matrix interaction.
-
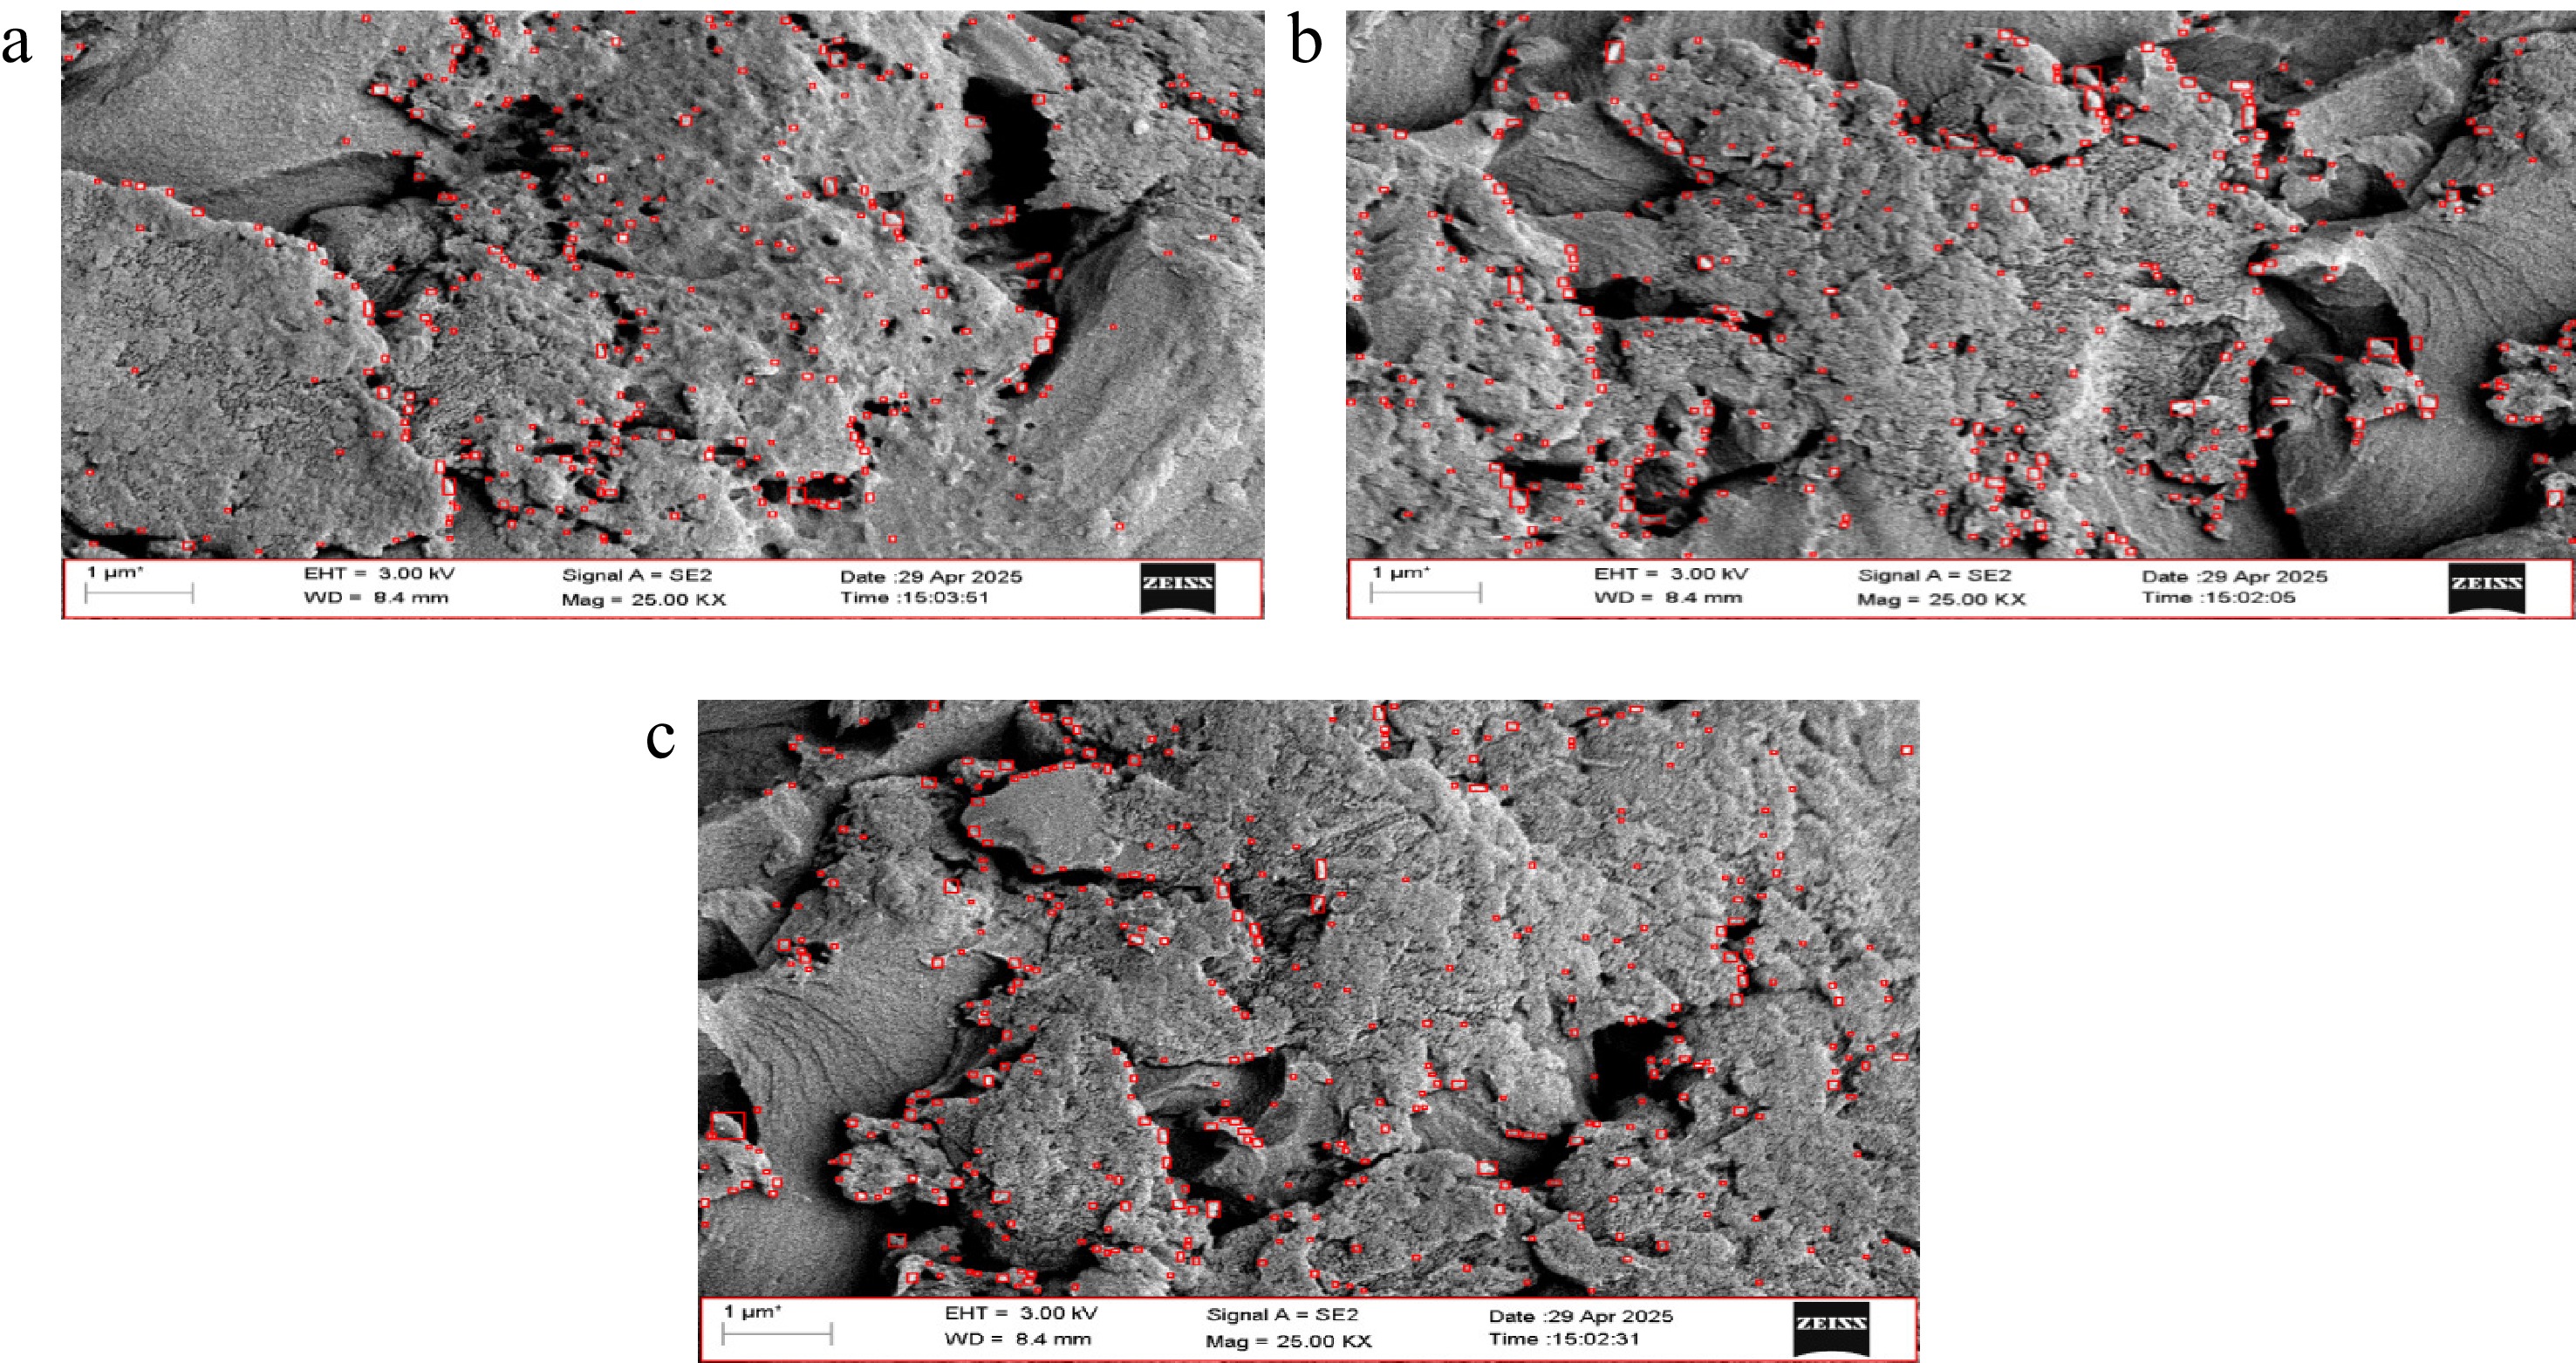
Figure 18.
SEM micrographs of NC-TiO2-5% composites showing surface morphology at 20 KX magnifications. Dispersed TiO2 particles are highlighted by the red color.
-
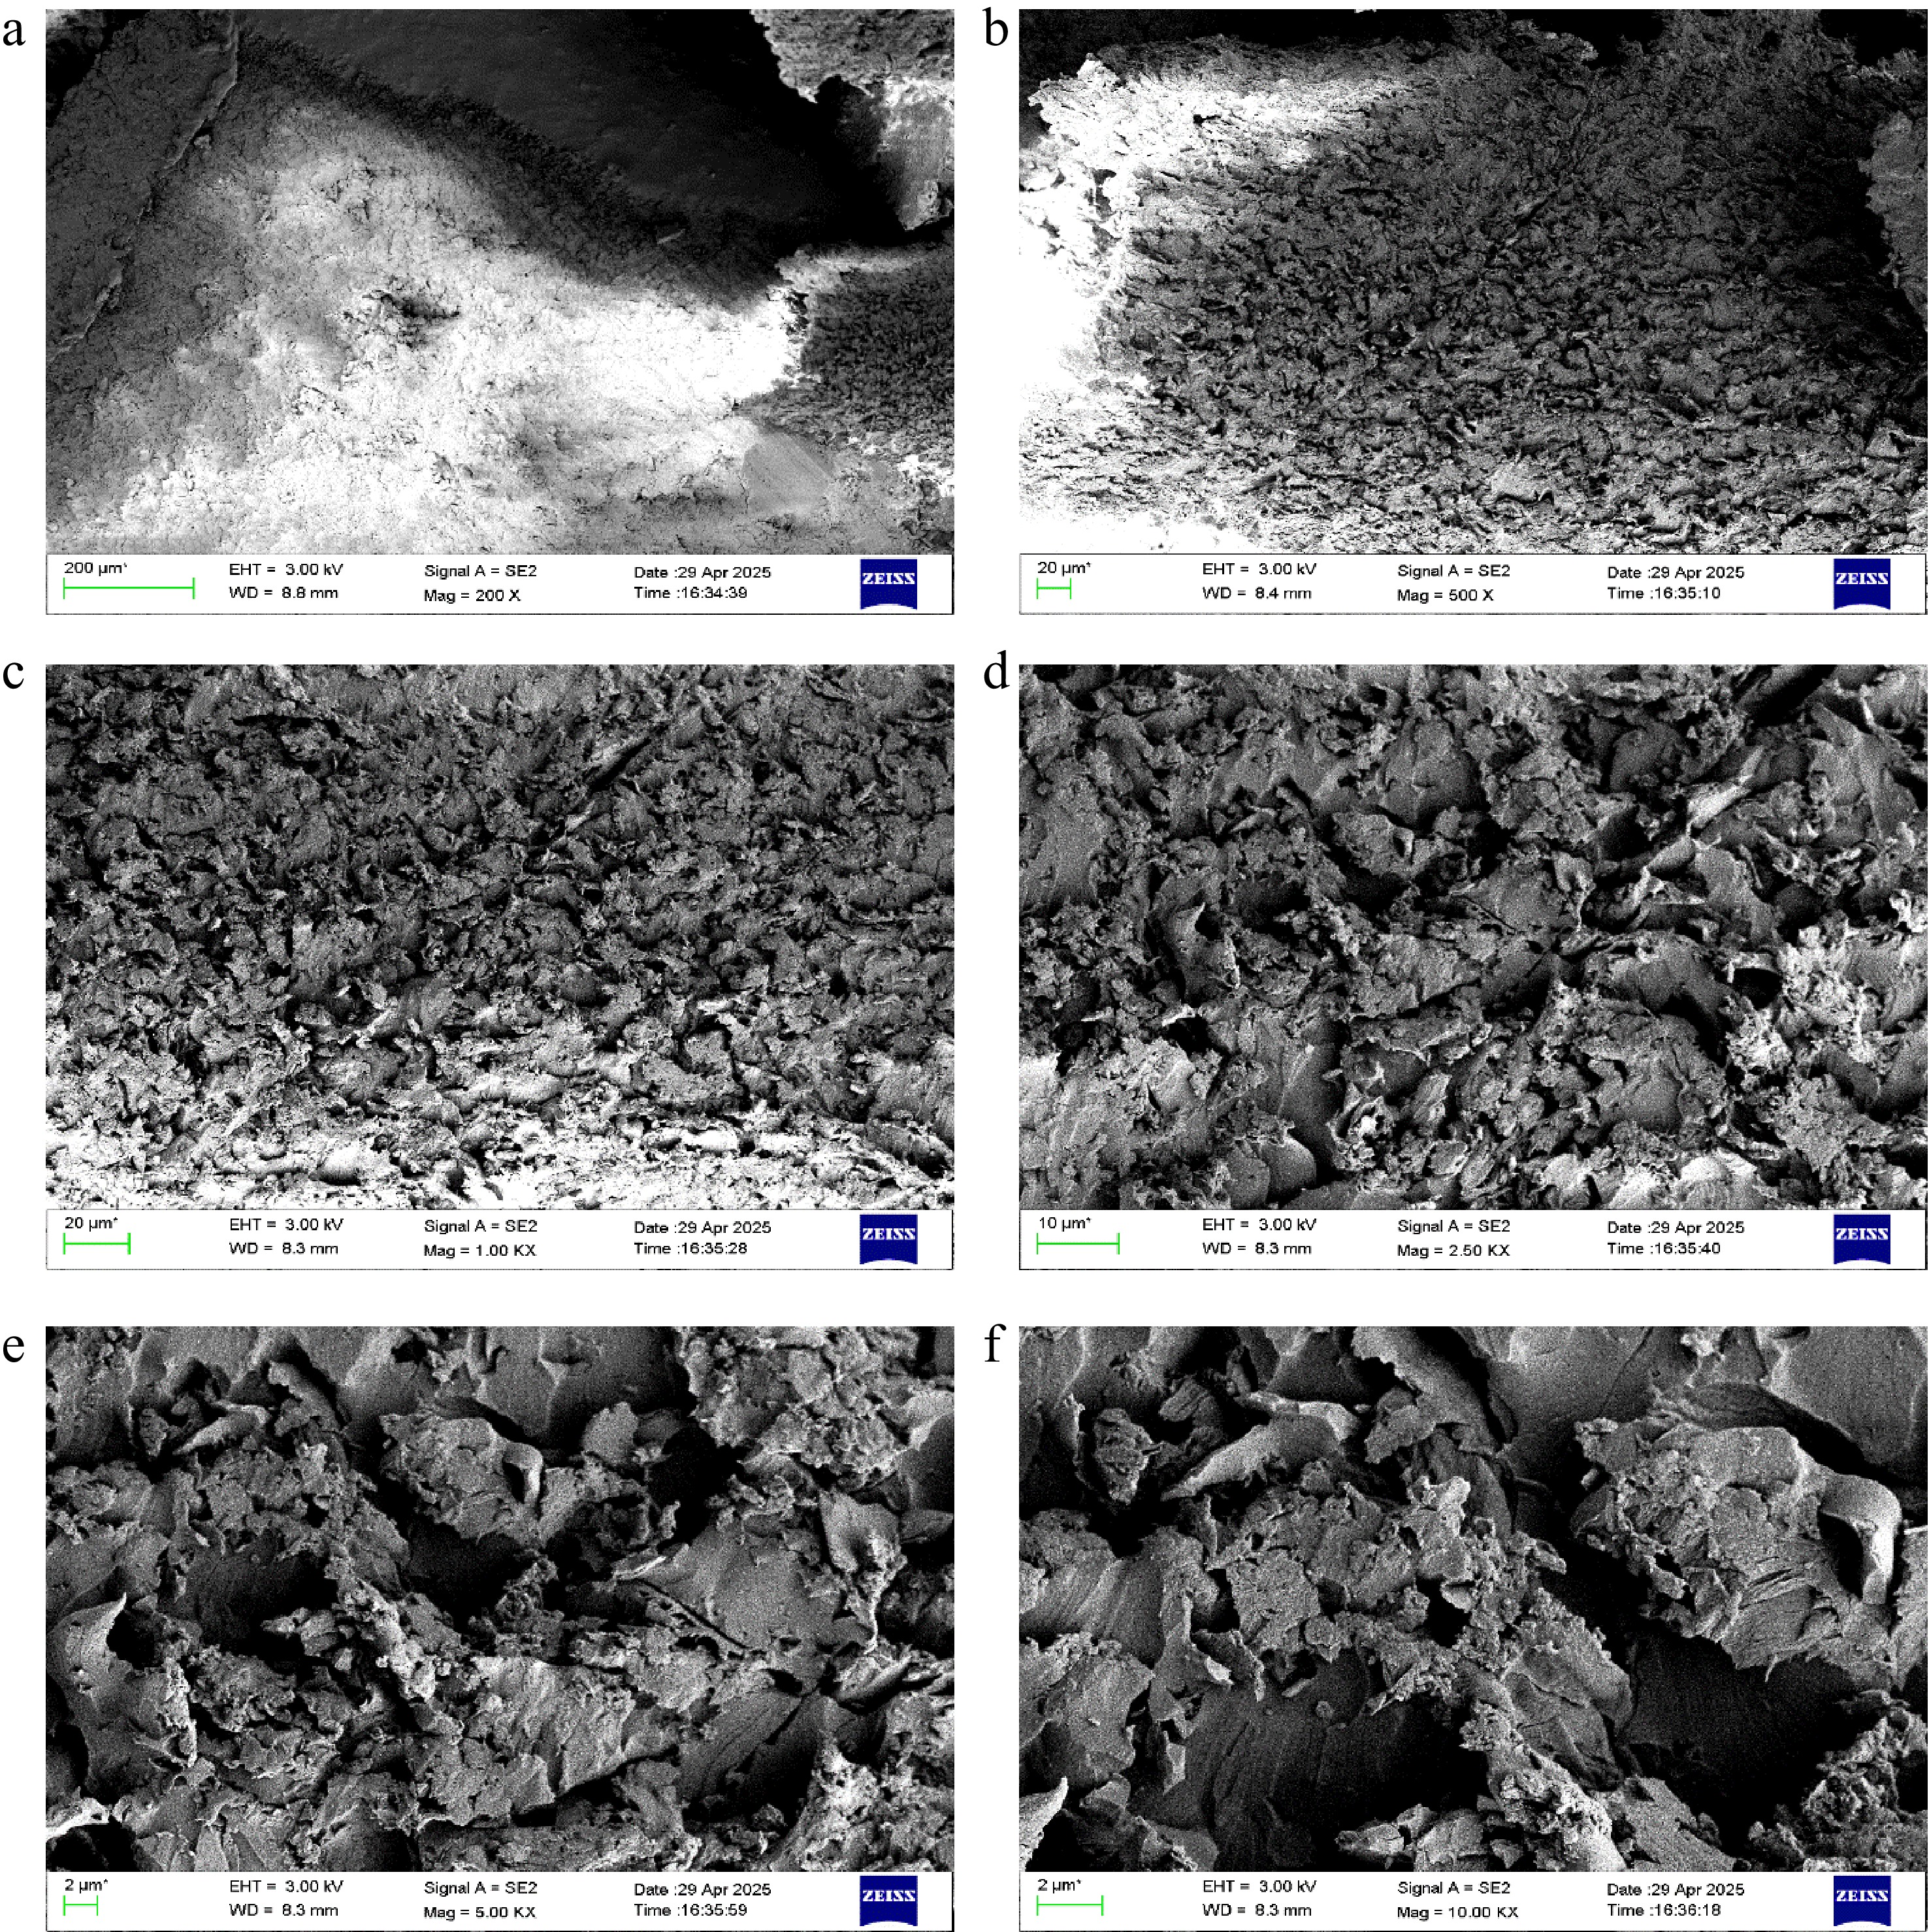
Figure 19.
SEM micrographs of NC-TiO2-10% composites showing surface morphology at different magnifications and regions, highlighting particle dispersion, matrix interaction, and microstructural uniformity.
-
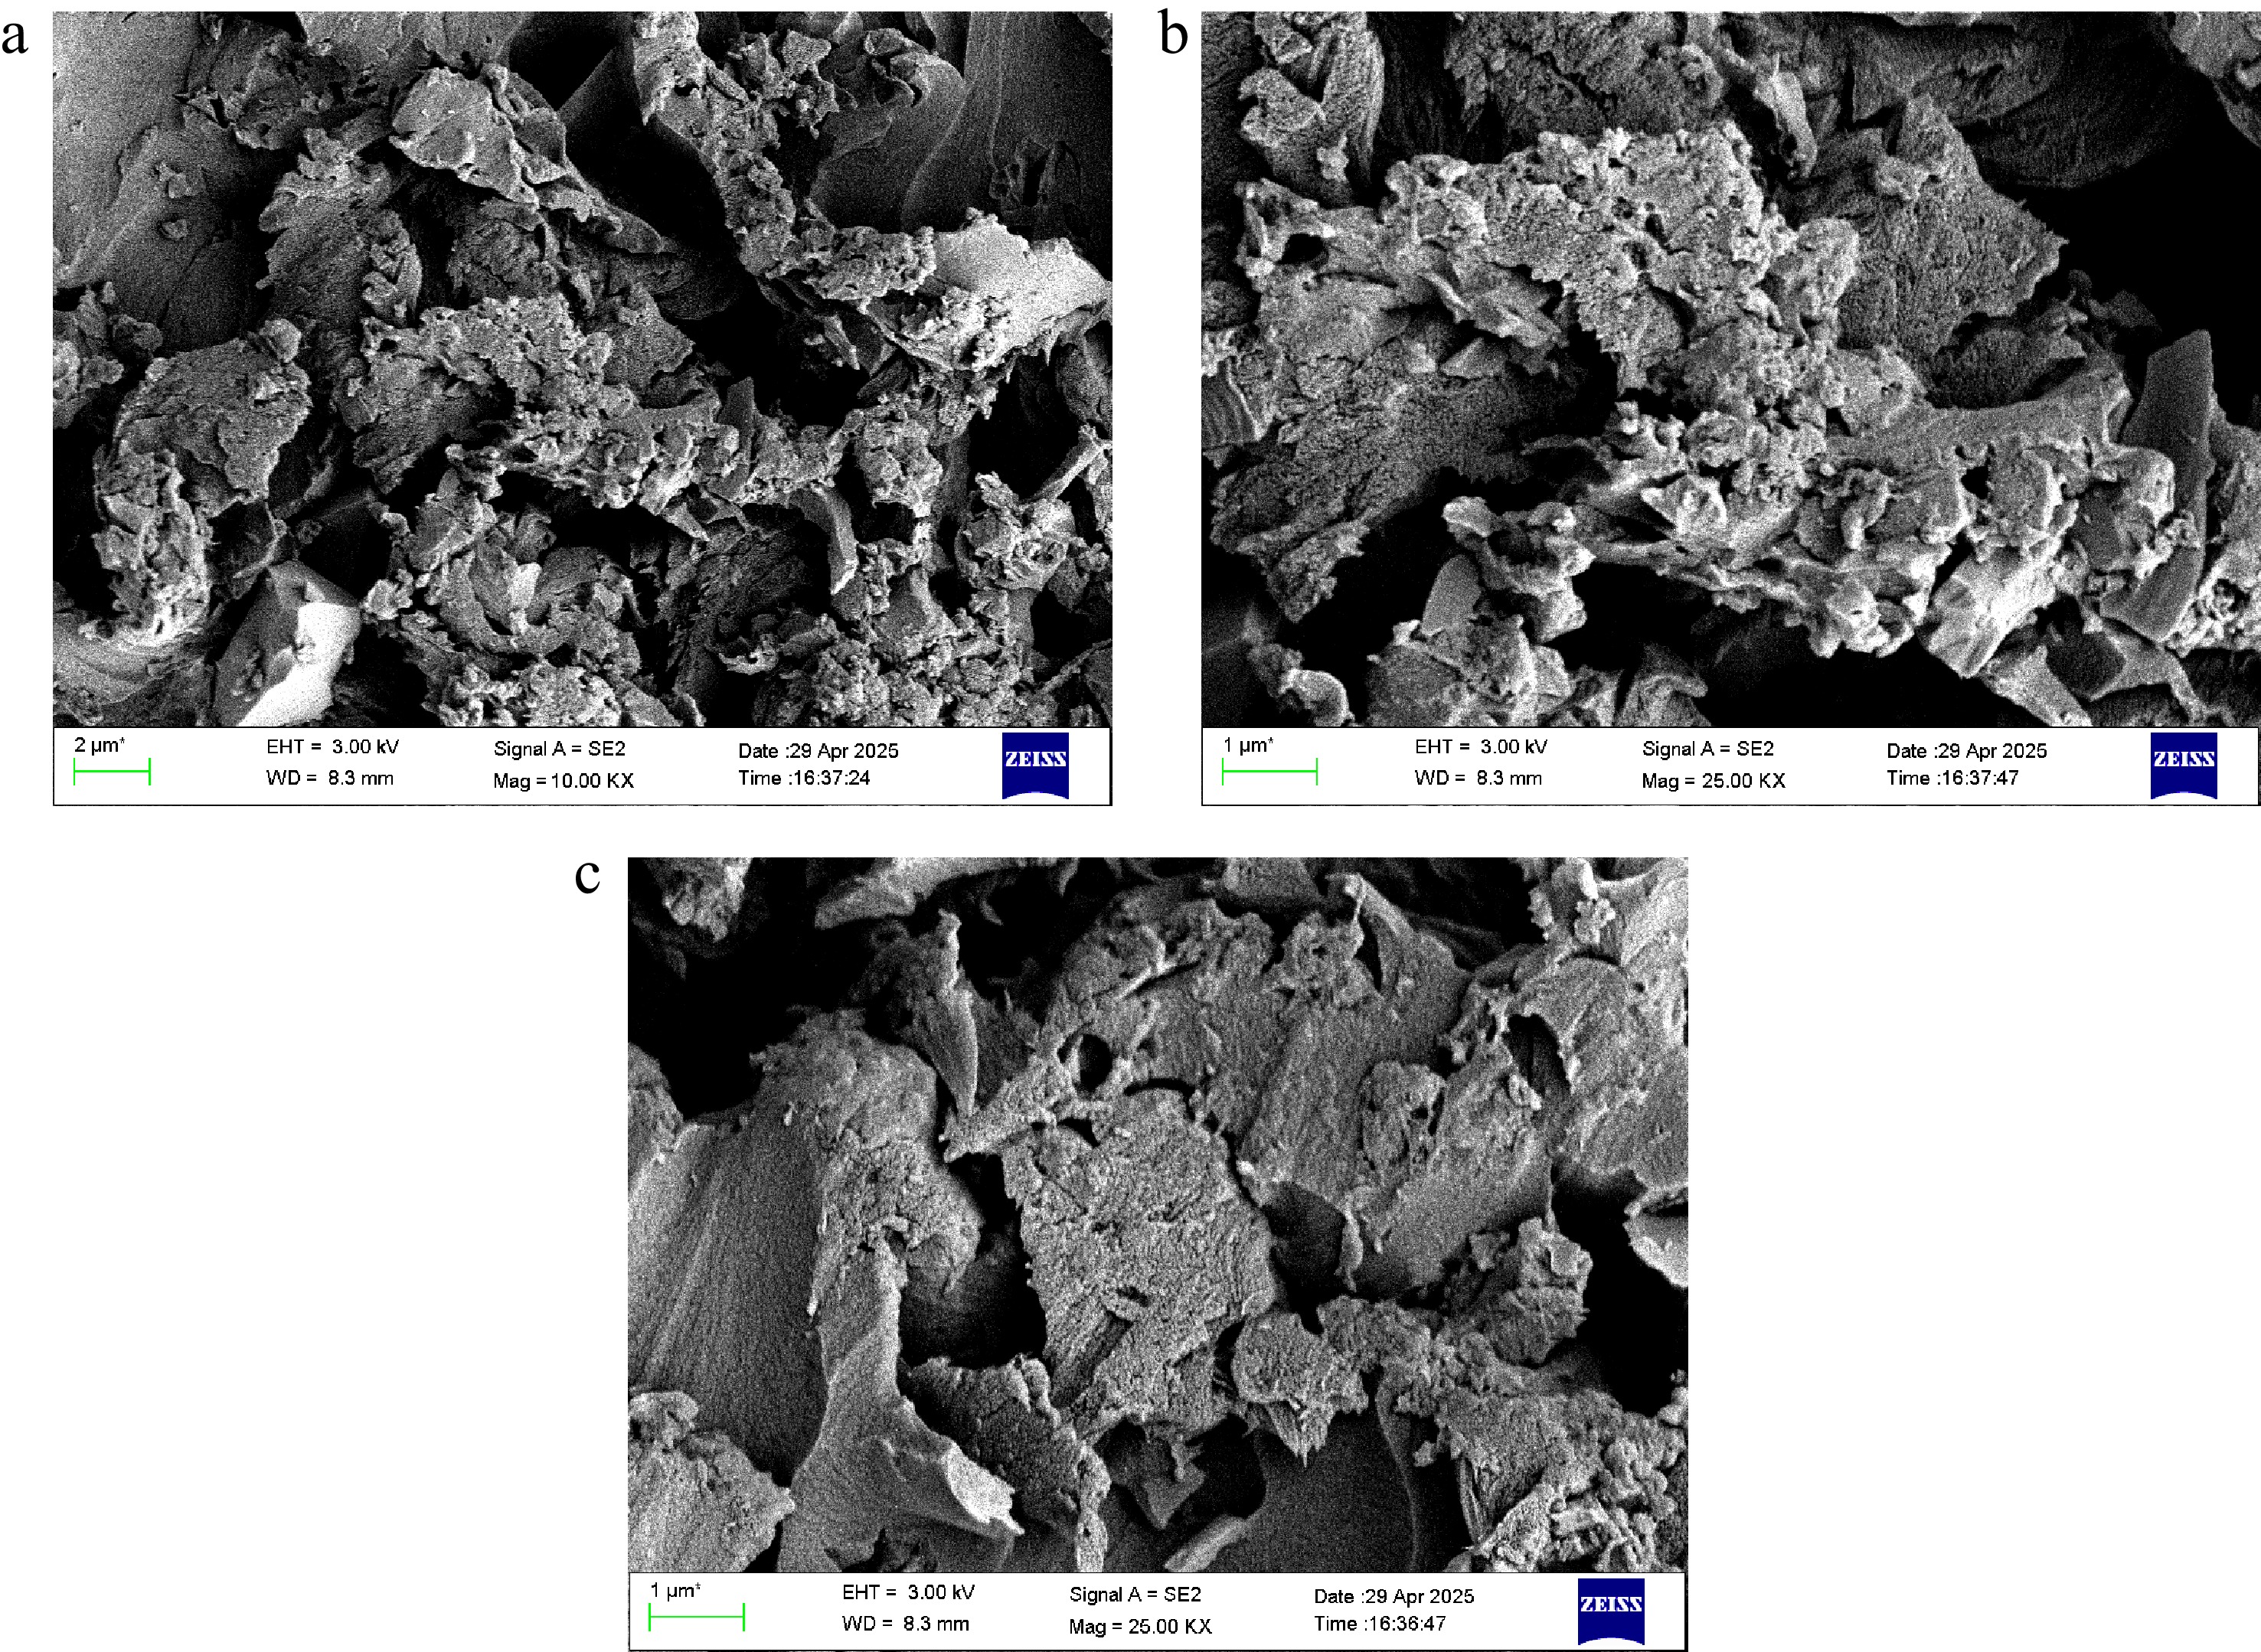
Figure 20.
SEM micrographs of NC-TiO2-10% composites showing surface morphology at different magnifications and regions, highlighting particle dispersion, matrix interaction, and microstructural uniformity.
-
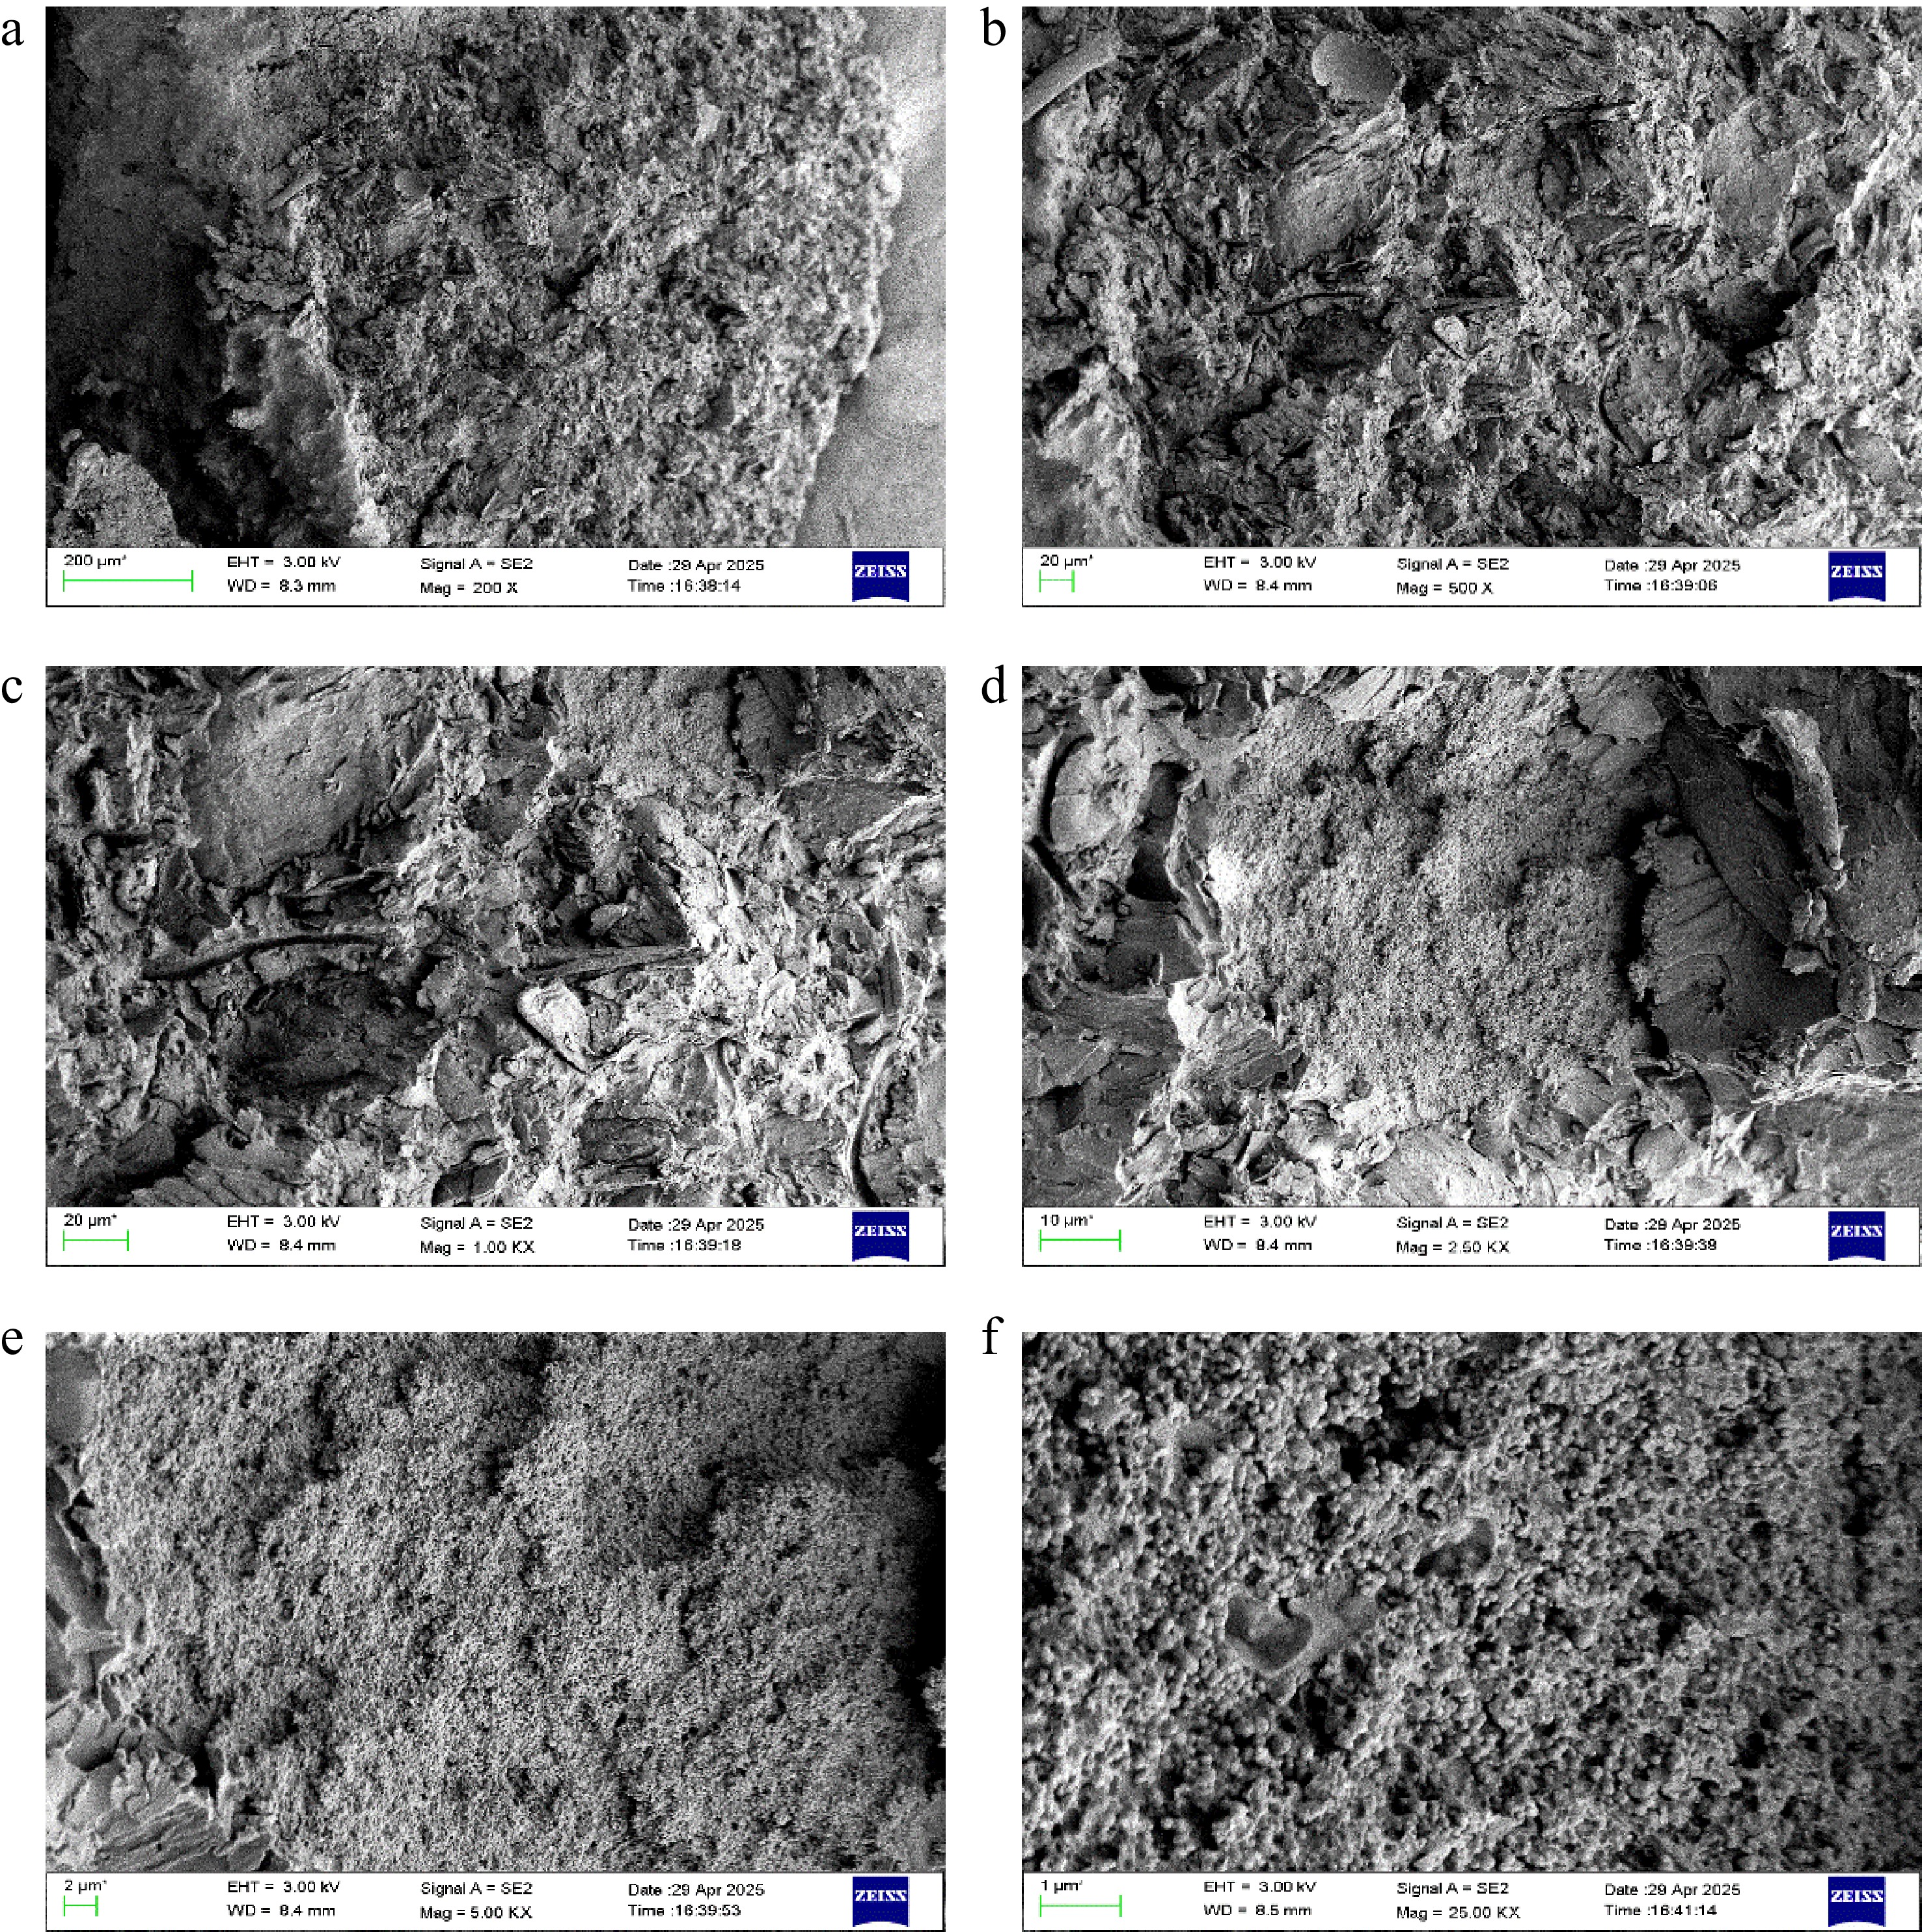
Figure 21.
SEM micrographs of NC-TiO2-15% composites showing surface morphology at different magnifications and regions, highlighting particle dispersion, matrix interaction, and microstructural uniformity.
-
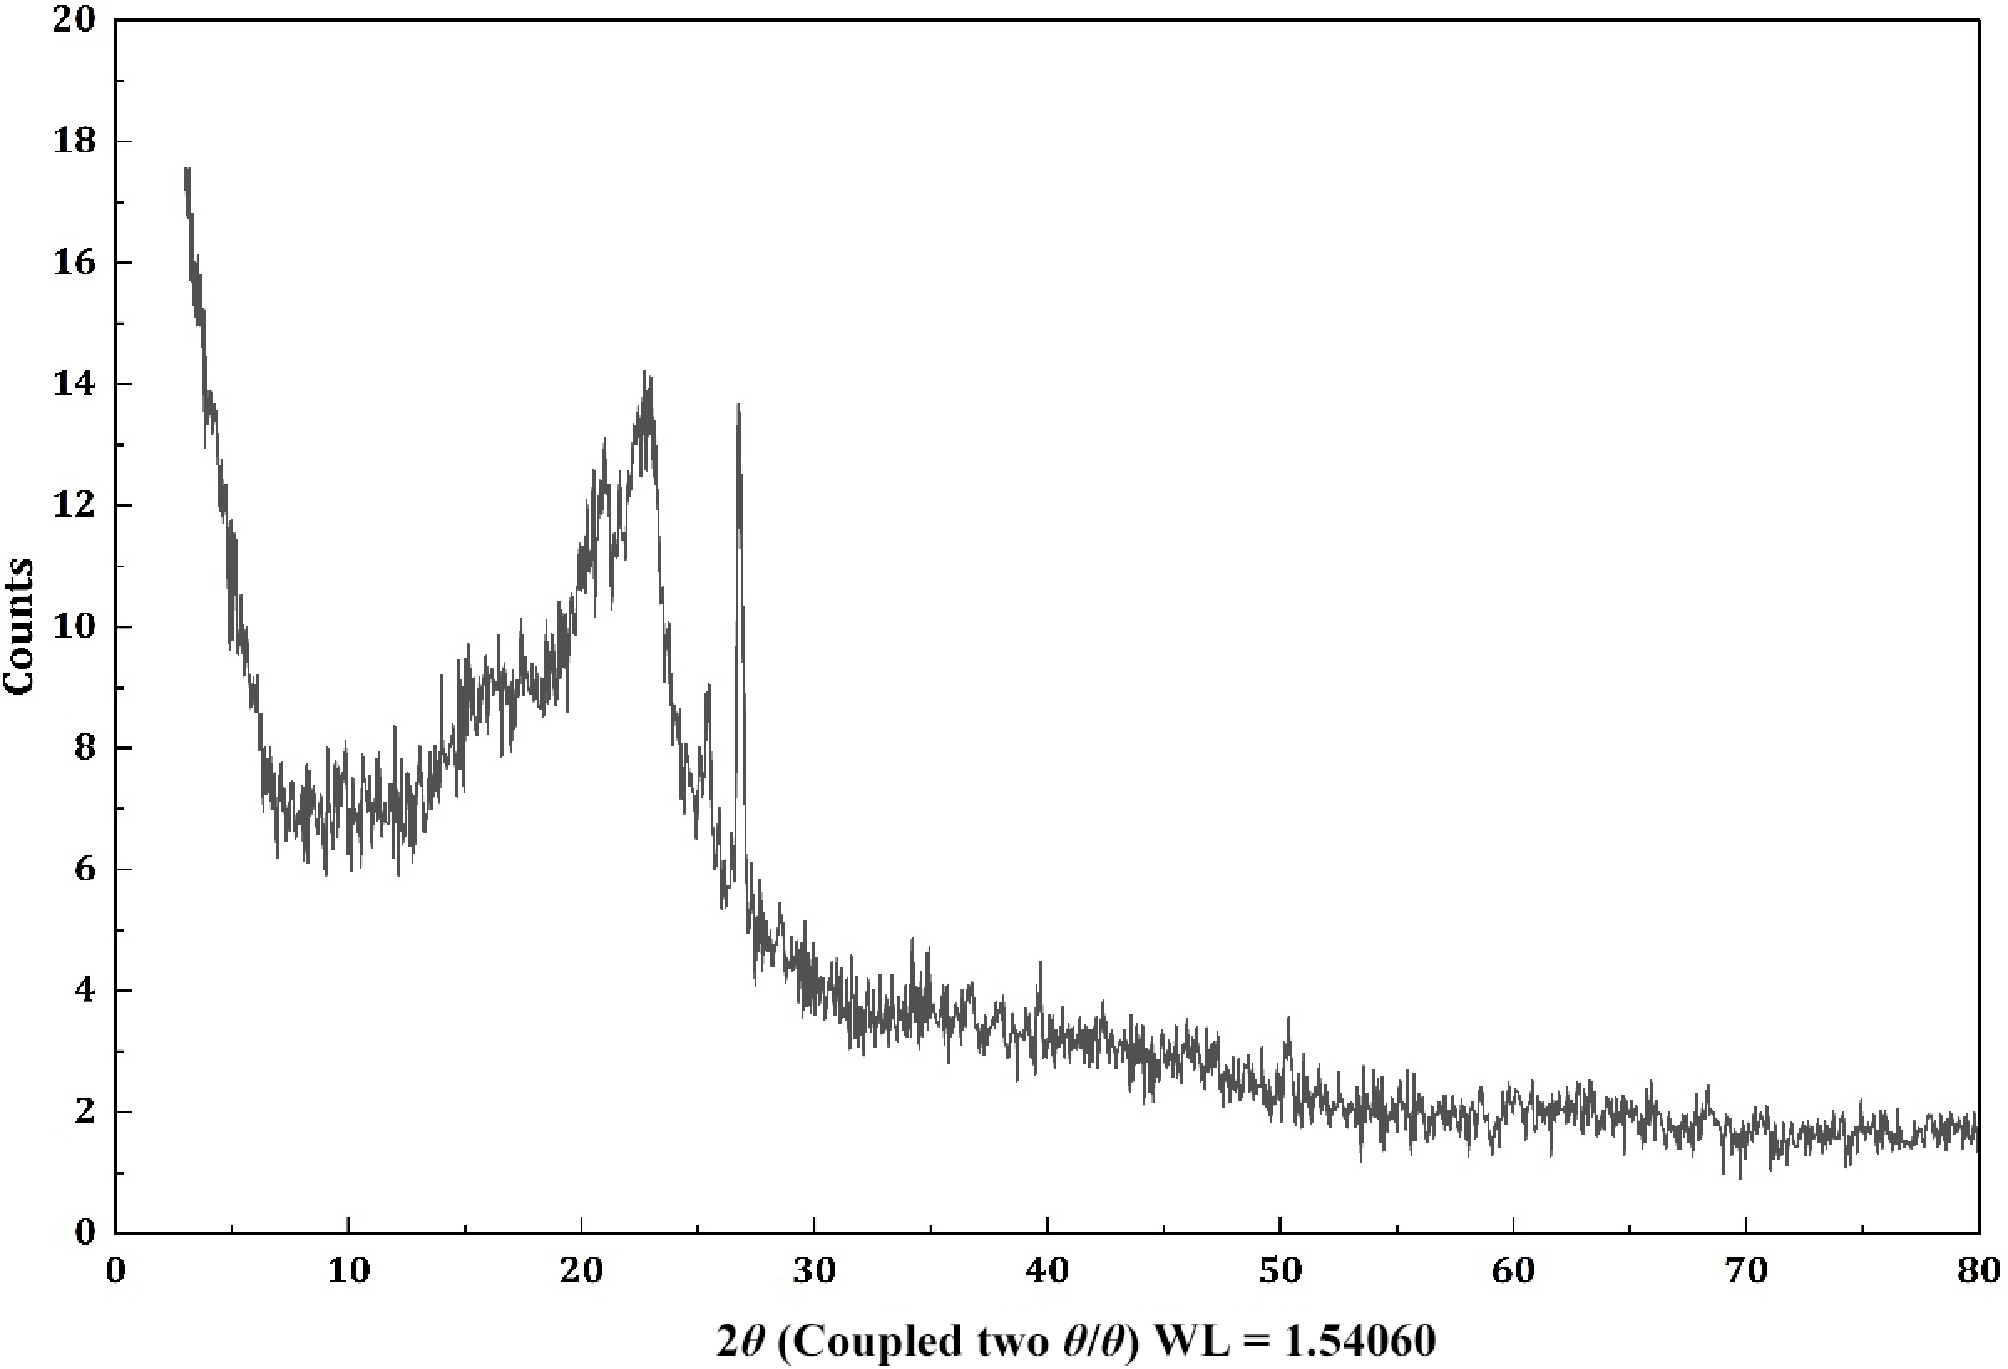
Figure 22.
NC-TiO2-5%.
-
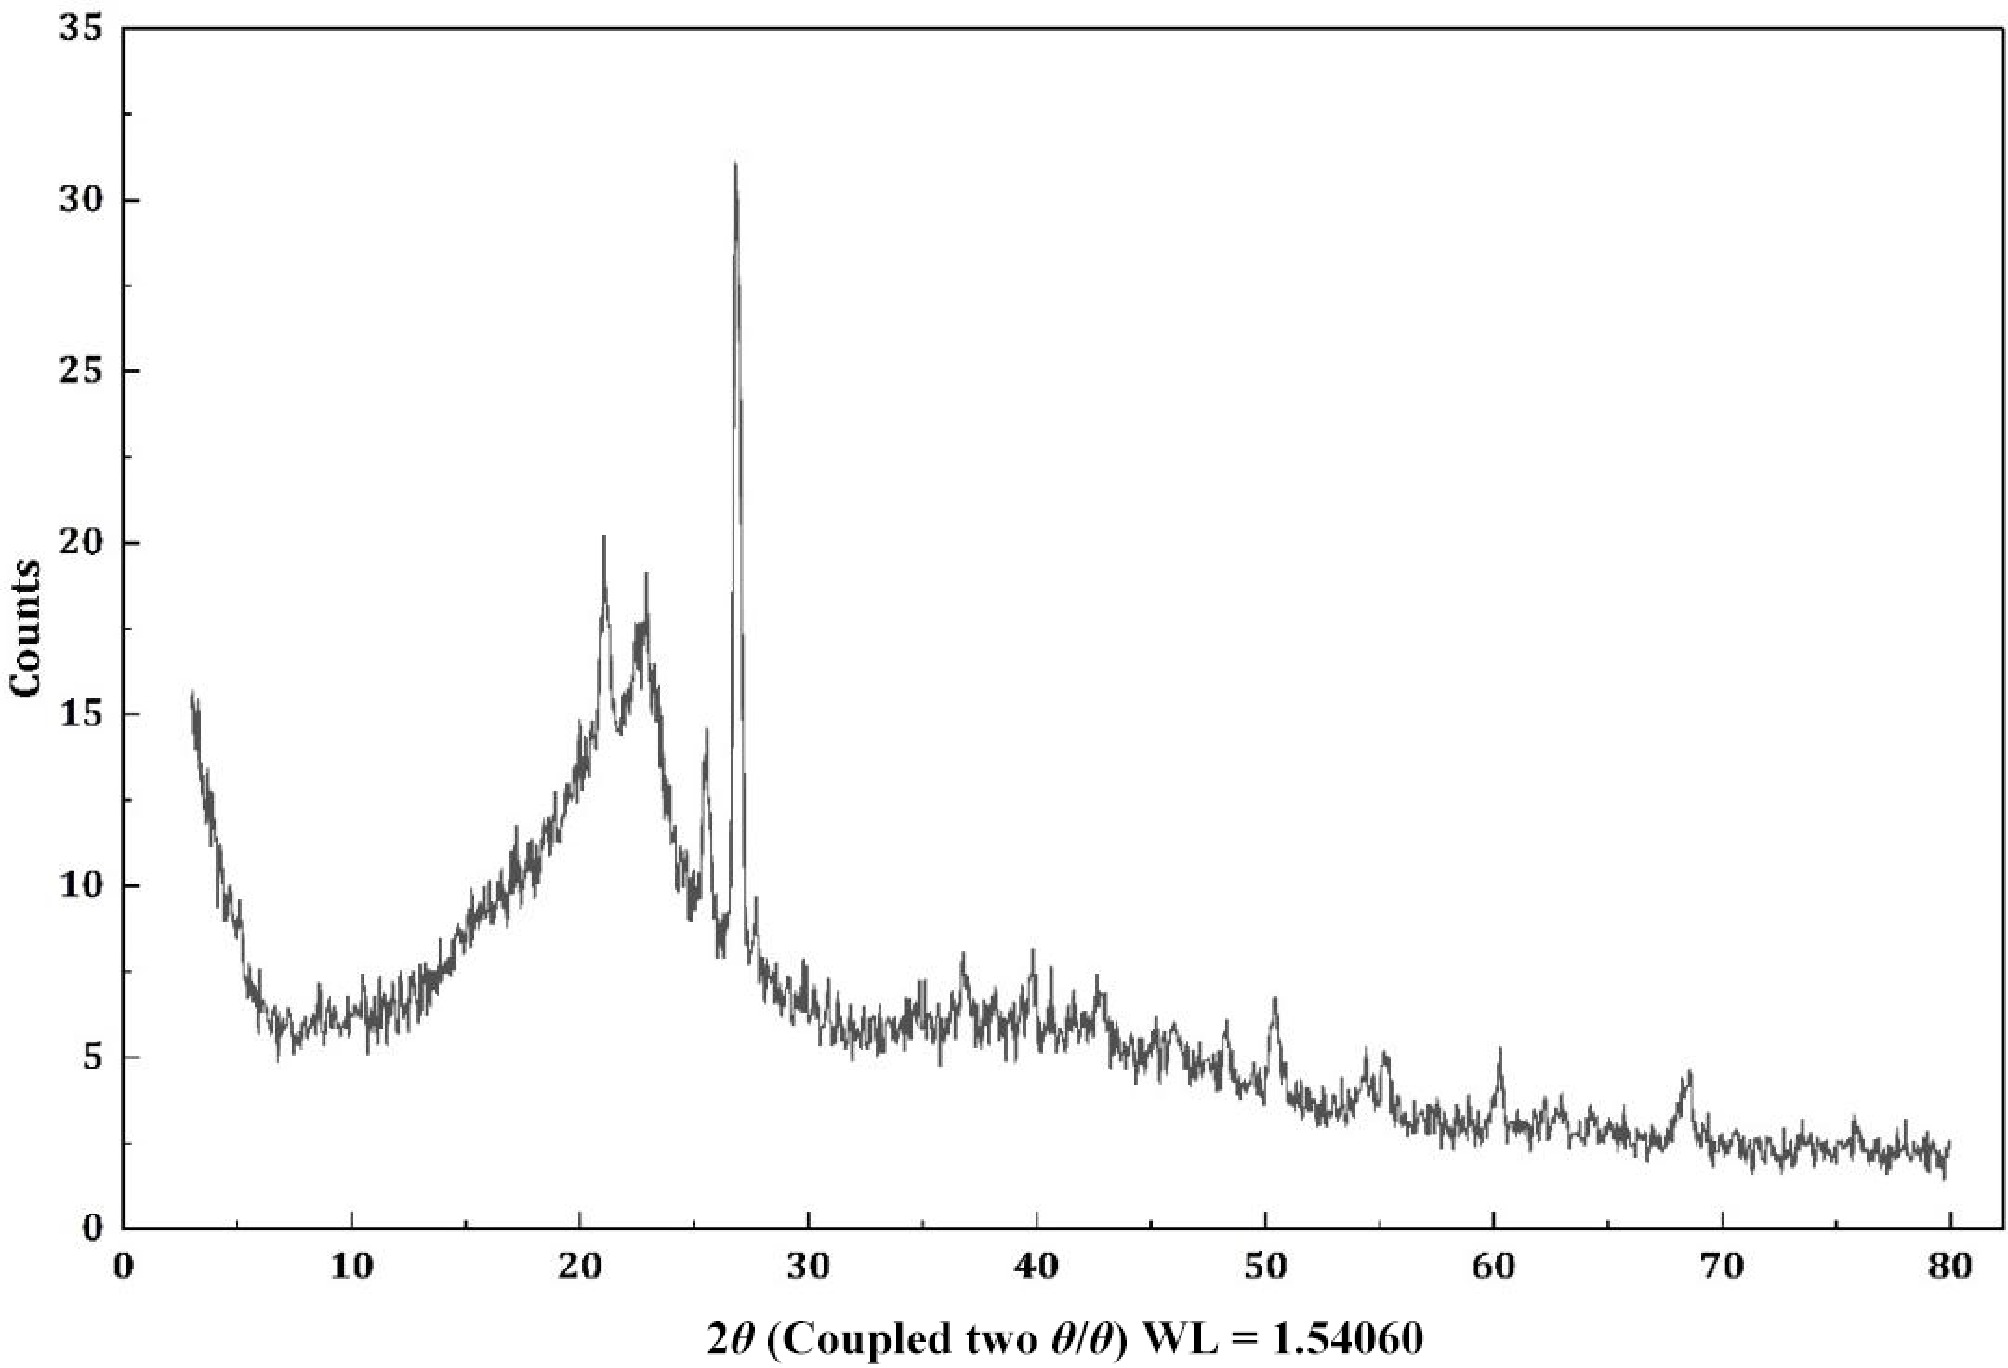
Figure 23.
NC-TiO2-10%.
-
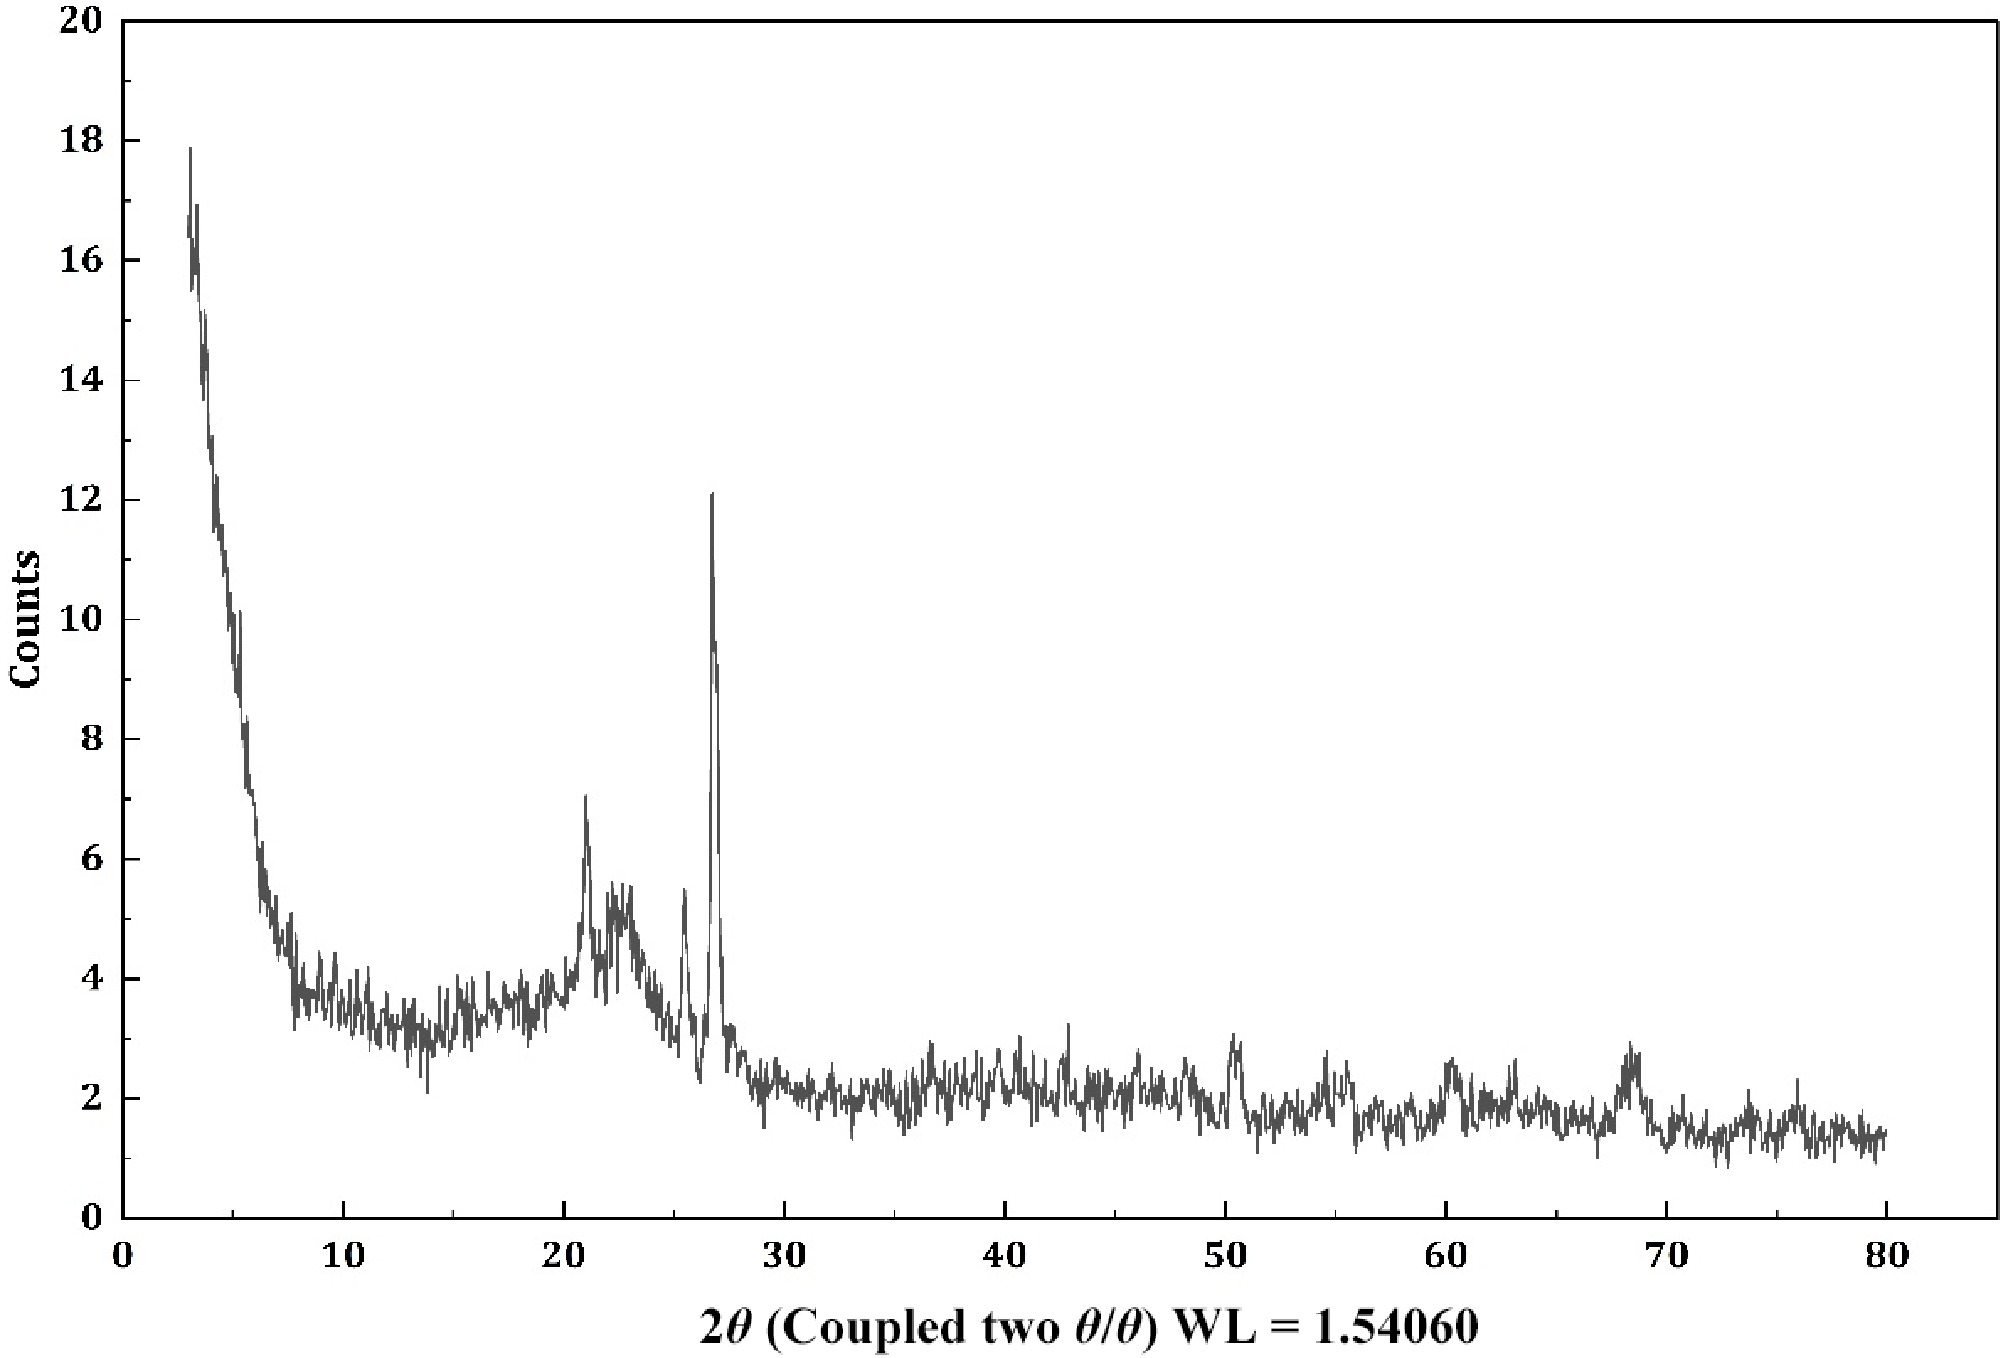
Figure 24.
NC-TiO2-15%.
-
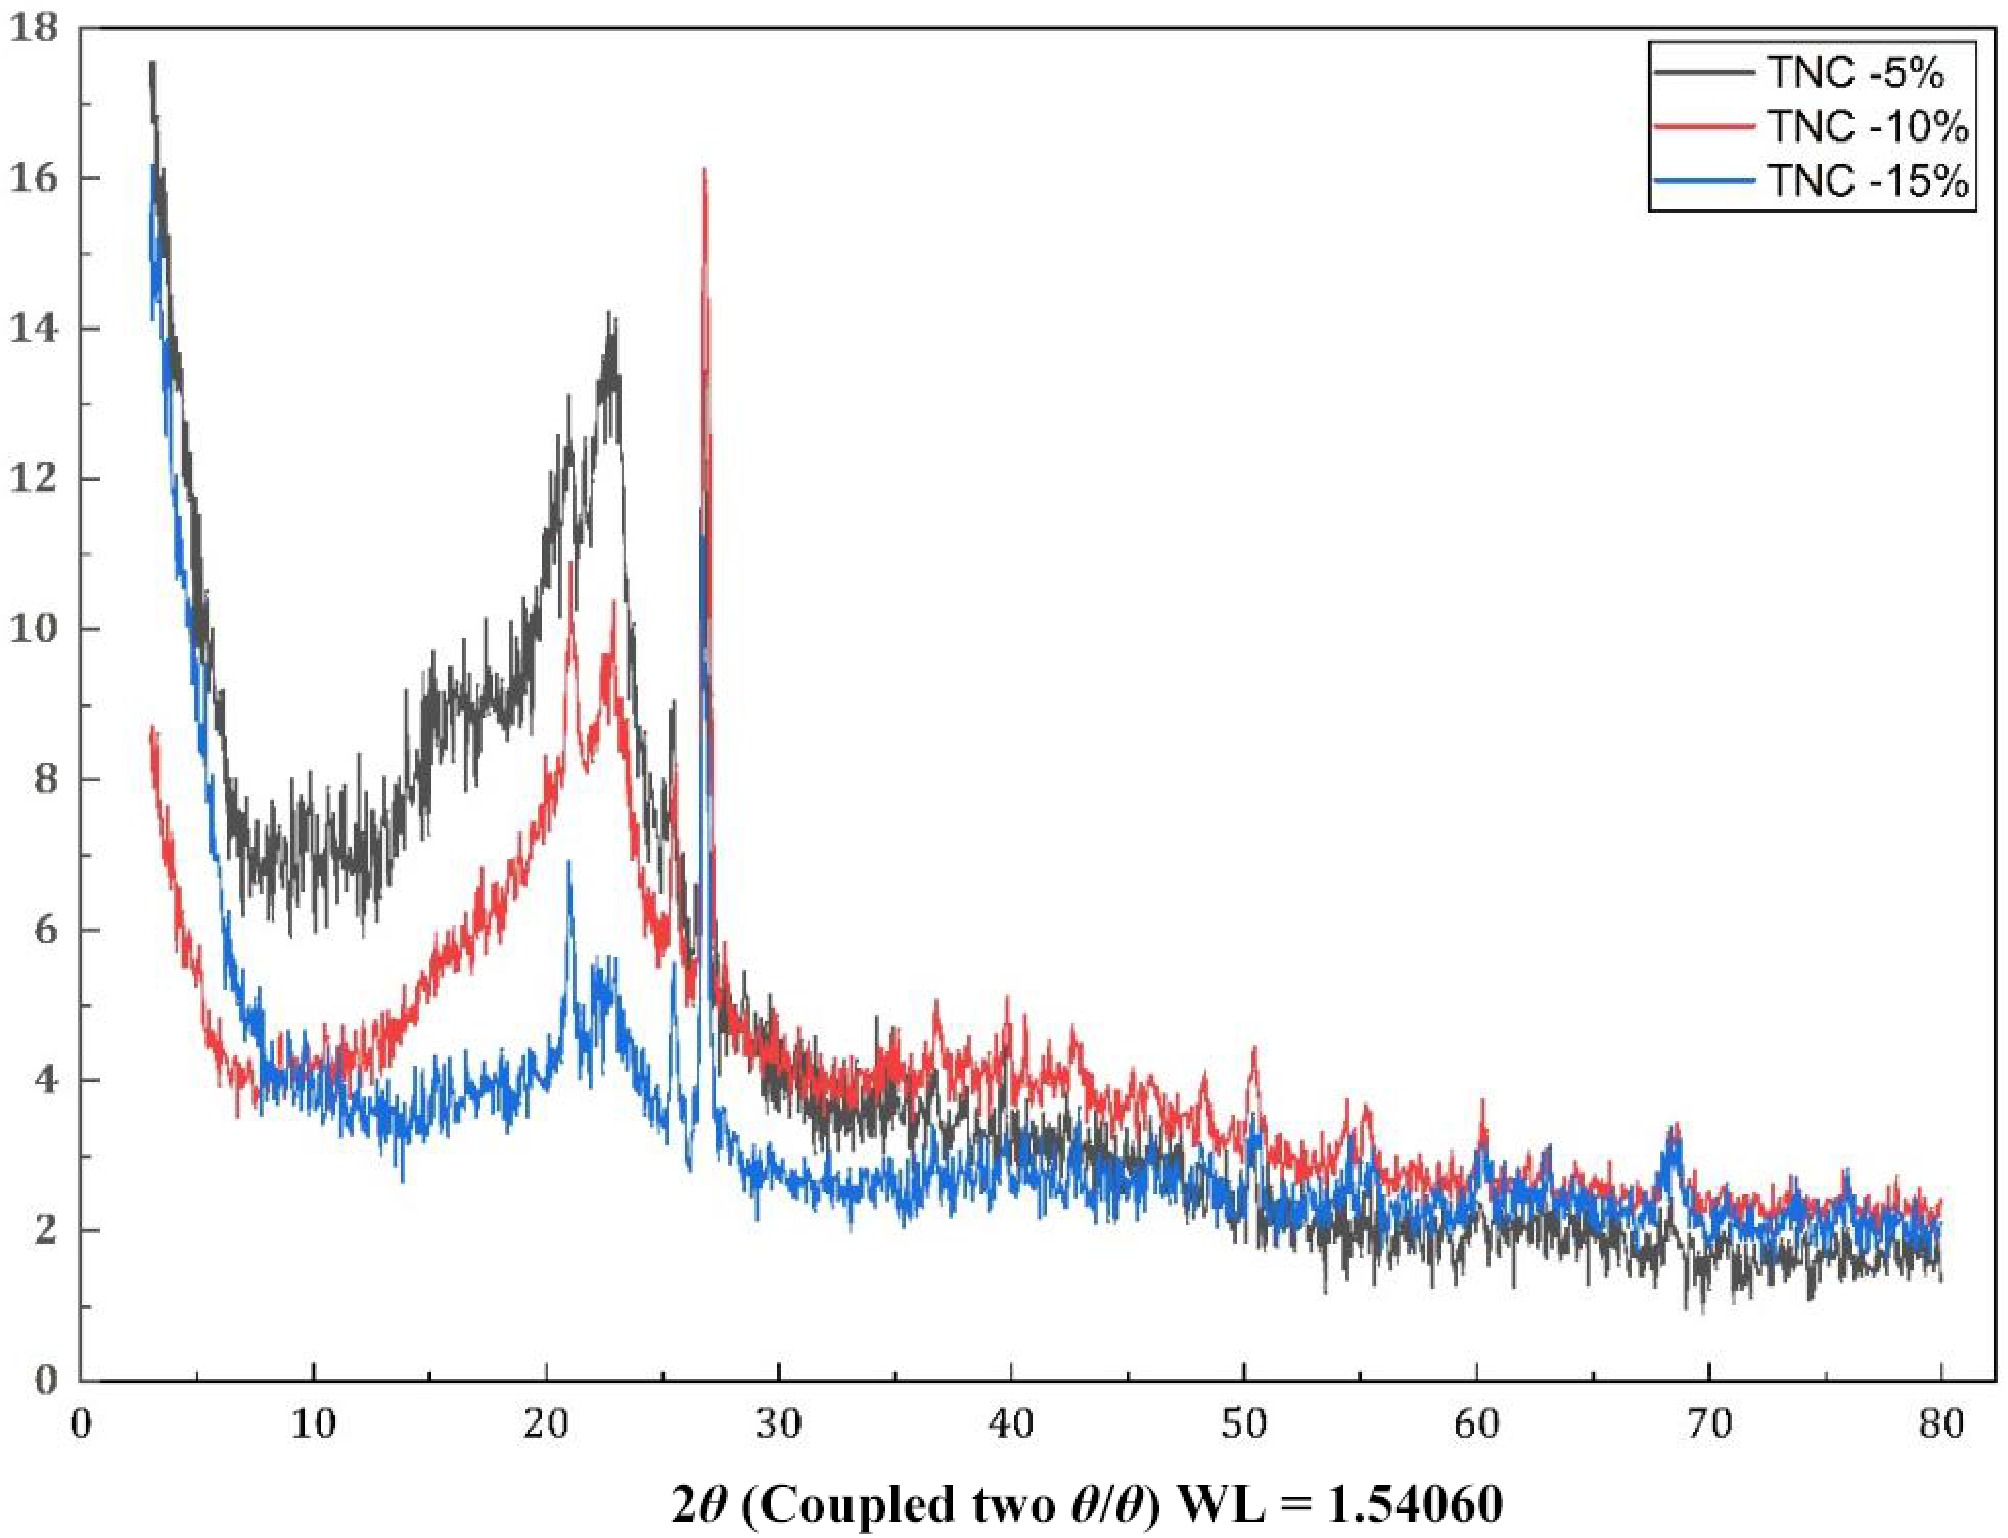
Figure 25.
Comparison of NC-TiO2-5%, NC-TiO2-10%, and NC-TiO2-15%.
-
Sample Tensile
strength (MPa)Young's
modulus (GPa)Elongation at
break (%)NC-TiO2-5% 43.16 ± 0.76 2.56 ± 0.11 3.40 ± 0.16 NC-TiO2-10% 52.32 ± 0.43 3.32 ± 0.08 2.60 ± 0.16 NC-TiO2-15% 47.56 ± 0.34 3.32 ± 0.08 2.38 ± 0.08 Table 1.
Tensile properties of nanocellulose-TiO2 composites, (mean ± SD).
-
Peak No. SP area ratio Mean (nm) SD (nm) Mode (nm) 1 1.00 314.7 72.7 296.9 2 − − − − 3 − − − − Total 1.00 314.7 72.7 296.9 Table 2.
PSA for NC-TiO2-5%.
-
Peak No. SP area ratio Mean (nm) SD (nm) Mode (nm) 1 1.00 276.4 62.1 262.4 2 − − − − 3 − − − − Total 1.00 276.4 62.1 262.4 Table 3.
PSA for NC-TiO2-10%.
-
Peak No. SP area ratio Mean (nm) SD (nm) Mode (nm) 1 1.00 323.4 77.3 298.2 2 − − − − 3 − − − − Total 1.00 323.4 77.3 298.2 Table 4.
PSA for NC-TiO2-15%.
-
Index Angle d Value Net intensity Gross intensity Rel. intensity 1 15.16552 5.837457 38.81906 272.7384 0.175764 2 21.00928 4.225101 110.0904 369.28 0.498464 3 22.36011 3.972813 125.9336 372.8137 0.570198 4 22.96867 3.868909 165.1325 403.7965 0.747681 5 25.41477 3.50181 53.43039 242.3235 0.24192 6 26.80056 3.323802 220.8594 381.1461 1 7 34.18415 2.620887 31.05041 136.5401 0.140589 8 39.7973 2.263209 34.74278 127.3479 0.157307 9 50.32634 1.811628 30.65143 93.43885 0.138783 10 58.6054 1.573892 18.59901 68.86196 0.084212 Table 5.
NC-TiO2-5%.
-
Index Angle d Value Net intensity Gross intensity Rel. intensity 1 8.566103 10.31416 40.0016 204.9024 0.06412 2 10.50442 8.414897 35.61958 205.2714 0.057095 3 18.90682 4.689929 45.35736 361.7636 0.072704 4 21.0722 4.212627 233.1585 563.2905 0.373736 5 22.49033 3.950103 173.0937 497.0656 0.277456 6 22.85945 3.887147 195.7285 516.1317 0.313738 7 25.5242 3.487045 133.2367 405.6501 0.213568 8 26.87125 3.315218 623.8598 865.0862 1 9 27.67361 3.220893 47.01355 267.9055 0.075359 10 29.79416 2.996303 36.44493 217.367 0.058418 11 36.81153 2.439631 50.30884 221.5918 0.080641 12 39.80103 2.263006 56.89635 222.6027 0.091201 13 40.60581 2.219992 56.13306 218.3333 0.089977 14 42.73048 2.114397 35.75131 191.7733 0.057307 15 45.99042 1.971821 35.96887 171.8511 0.057655 16 48.2773 1.883622 37.69532 163.5 0.060423 17 50.40472 1.808995 71.61617 190.9094 0.114795 18 53.33605 1.716277 26.86469 123.2841 0.043062 19 54.35394 1.686516 27.81275 126.7474 0.044582 20 55.26603 1.660821 40.15096 138.3462 0.064359 21 60.26182 1.534531 62.61021 146.5174 0.100359 22 62.9405 1.475513 24.66622 105.8649 0.039538 23 68.41094 1.370245 41.8497 117.1034 0.067082 24 68.53806 1.368013 46.26498 121.4927 0.074159 Table 6.
NC-TiO2-10%.
-
Index Angle d Value Net intensity Gross intensity Rel. intensity 1 21.04192 4.218621 73.44926 190.5117 0.360974 2 22.35821 3.973146 37.3143 152.4734 0.183385 3 25.48732 3.492007 70.15038 154.1491 0.344761 4 26.83473 3.319647 203.4755 277.7565 1 5 48.18738 1.886927 21.32602 75.40805 0.104809 6 50.3915 1.809438 29.20418 78.74663 0.143527 7 50.57415 1.803331 27.97095 77.13333 0.137466 8 60.25434 1.534704 26.38271 76.25182 0.12966 9 63.12379 1.471669 18.67752 70.67654 0.091792 10 67.951 1.378395 17.38403 60.18227 0.085436 11 68.04842 1.376659 26.13263 69.04674 0.128431 Table 7.
NC-TiO2-15%.
-
Biomedical applications Suitability Rationale based on test data Bone implants Moderate The 10%-TiO2 composite offers strong mechanical properties (FTIR: Ti–O absorption at 699.44 cm−1, 64.35% T; SEM: balanced TiO2 dispersion) and thermal stability (DSC: decomposition onset ~200 °C), potentially suitable for load-bearing implants. EDX shows no Ti at 4.508 keV, indicating uneven TiO2 dispersion, which may limit bioactivity. Nanocellulose's composition (75% C, 25% O in EDX) suggests biocompatibility for bone integration, but 15% TiO2's aggregation (SEM: 100–500 nm clusters) reduces porosity for osseointegration. Lack of in vitro or in vivo validation limits confidence[4]. Tissue scaffolds Moderate The 10%-TiO2 composite's fibrous, porous matrix (SEM) and colloidal stability (ZPA: –19.0 mV) may promote cell adhesion and growth. PSA indicates a 267.8 nm median particle size, potentially ideal for scaffold porosity. Composition (EDX: high C, O) and moderate polydispersity (PI: 0.468) suggest suitability for tissue engineering. Thermal stability up to 200 °C (DSC) supports sterilization. The 15%-TiO2 aggregation reduces porosity, lowering suitability. Lack of in vitro or in vivo validation limits confidence[ 1]. Wound dressings Moderate The 10% and 15%-TiO2 composites show potential antimicrobial activity (FTIR: Ti–O peaks at 699–742 cm−1), but EDX's lack of Ti detection suggests inconsistent dispersion, limiting pathogen resistance (e.g., E. coli). The flexible nanocellulose matrix (SEM) and composition (EDX) suggest biocompatibility, but moisture loss at 71–148 °C (DSC) requires drying to prevent degradation. The 5%-TiO2 lacks sufficient TiO2 for antimicrobial effects. Lack of in vitro or in vivo validation limits confidence[ 21]. Antibacterial coatings Moderate TiO2's antimicrobial potential (FTIR: Ti–O bonds) is promising, with 15% TiO2 offering high stability (ZPA: –27.0 mV) for uniform coatings. However, SEM shows aggregation at 15%, reducing photocatalytic efficiency. The 10% TiO2 balances dispersion (PSA: 267.8 nm) and functionality, but EDX's no-Ti result indicates uneven coverage. Nanocellulose's composition ensures potential safety, needing optimization. Lack of in vitro or in vivo validation limits confidence[22]. Drug delivery systems Moderate The 10%-TiO2 composite's particle size (PSA: 267.8 nm median, PI: 0.468) and colloidal stability (ZPA: –19.0 mV) may be suitable for targeted drug delivery, potentially leveraging the enhanced permeability and retention effect. Nanocellulose's composition (EDX: 75% C, 25% O) suggests biocompatibility for systemic use. SEM confirms a porous matrix for drug loading, but EDX's uneven TiO2 dispersion may limit controlled release. The 5%-TiO2 is less effective due to lower functionality. Lack of in vitro or in vivo validation limits confidence[1]. Dental restorations Moderate The 10%-TiO2 composite's mechanical strength (FTIR: strong Ti–O and matrix bonds) and thermal stability (DSC: ~200 °C) may suit dental fillings or crowns. SEM shows a fibrous matrix for bonding, but 15% TiO2's aggregation reduces uniformity, impacting aesthetics. EDX's lack of Ti detection suggests limited antimicrobial benefits from TiO2. Nanocellulose's composition supports potential oral use, but dispersion needs improvement. Lack of in vitro or in vivo validation limits confidence[21]. Table 8.
Suitability of nanocellulose-TiO2 composites for biomedical applications.
-
Automotive emergency use applications Suitability Rationale based on test data Lightweight interior body panels High Tensile testing shows improved strength and stiffness at optimized filler loading, while nanocellulose reinforcement reduces overall composite density. Impact protection panels Moderate Enhanced mechanical performance at 5%−10% loading indicates improved stress transfer; controlled dispersion minimizes crack initiation compared to 15% loading. Emergency vehicle structural trims High Thermal stability analysis demonstrates improved resistance to degradation, supporting use in elevated-temperature operating environments. Thermal shielding layers (engine bay zones) High TGA results indicate enhanced thermal resistance due to TiO2 incorporation, delaying thermal decomposition compared to neat epoxy. Fire-exposed interior modules Moderate Improved thermal stability supports short-term exposure; however, performance depends on optimized filler dispersion to avoid agglomeration-related weaknesses. Battery enclosure protective casings (EV safety) High Combined mechanical strength and thermal stability at 5%−10% loading provide structural reinforcement and heat tolerance for emergency scenarios. Temporary emergency repair panels High Good tensile performance and structural integrity at moderate filler loading enable lightweight, moldable repair solutions. Table 9.
Suitability of nanocellulose-TiO2 composites for automotive emergency use applications.
-
Material used in emergency sector Typical tensile
strength (MPa)Comparison with developed
composite (~52 MPa)Specific advantage of present composite Conventional epoxy resin 30−45 MPa ~15%−20% higher strength Improved load-bearing capacity with better thermal stability due to TiO2 reinforcement ABS (Acrylonitrile Butadiene Styrene)–used in interior panels 35−45 MPa ~15%−30% higher strength Higher structural rigidity while maintaining lightweight characteristics Polypropylene (PP)–automotive trims and emergency covers 25−35 MPa ~50%−100% higher strength Significantly improved tensile performance with enhanced stiffness Glass Fiber Reinforced Polymer (low-grade, 15%−20% GF) 50−70 MPa Comparable (within lower bound range) Similar strength with potentially lower density and improved surface functionality Aluminum (AA 3003–lightweight panels) 90−130 MPa Lower tensile strength but lighter and corrosion-resistant Reduced weight, easier moldability, no corrosion issues HDPE–protective covers 20−30 MPa Nearly double the strength Superior mechanical integrity and better thermal resistance Fire-retardant polymer composites (basic grade) 40−55 MPa Comparable to upper range Added multifunctionality (thermal stability + potential photocatalytic surface activity) Table 10.
Comparison with existing materials.
Figures
(25)
Tables
(10)