













-
Global industrial sectors are experiencing increasing pressure to transition toward sustainable, lightweight, and multifunctional materials in response to resource depletion and rising environmental concerns. These global challenges have accelerated interest in bio-based and renewable alternatives capable of replacing petroleum-derived polymers and metals in high-performance applications. Nanocellulose, a renewable, biodegradable, and high surface-area biopolymer, has emerged as a particularly promising material due to its low density, exceptional mechanical strength, tunable surface chemistry, and compatibility with polymeric and inorganic filler systems. Its use directly supports sustainability frameworks such as the UN SDG 12 (Responsible Consumption and Production) by lowering environmental impact and reducing dependence on non-renewable engineering materials.
Titanium dioxide (TiO2) is a multifunctional inorganic nanomaterial widely recognized for its photocatalytic efficiency, UV-blocking characteristics, thermal stability, antimicrobial properties, and mechanical reinforcement potential. When embedded into nanocellulose matrices, TiO2 has been shown to improve mechanical integrity, enhance durability, and overcome inherent weaknesses of nanocellulose such as moisture sensitivity and limited thermal stability. As a result, nanocellulose-TiO2 composites have gained growing attention as next-generation materials for high-performance, lightweight, and environmentally friendly applications.
Need for multifunctional materials in emergency response sectors
-
Emergency-driven technologies such as rapid-deployment biomedical supports, antimicrobial systems, protective barrier materials, filtration devices, and lightweight structures for automotive or aerospace applications require materials that simultaneously deliver high strength-to-weight ratios, reliable thermal and chemical stability, biocompatibility, antimicrobial activity, and structural integrity under extreme conditions. Although nanocellulose TiO2 composites inherently possess these multifunctional attributes, previous studies have primarily emphasized general improvements in mechanical properties or photocatalytic performance rather than targeted evaluations for emergency-response scenarios. Moreover, existing work seldom combines comprehensive chemical, structural, thermal, dispersion, and mechanical analyses to determine the optimal TiO2 loading that maximizes overall performance in such demanding environments.
Thus, a significant research gap remains in determining how TiO2 concentration influences nanocellulose composite behavior in contexts relevant to emergency-response materials. Addressing this gap requires a comprehensive, multi-metric assessment of composite performance parameters, an area where current literature is fragmented or insufficiently targeted.
Related work on nanocellulose and TiO2-based composites
-
Nanocellulose and TiO2 are widely studied for their complementary strengths: nanocellulose offers renewability and mechanical reinforcement, while TiO2 provides photocatalytic, UV-shielding, and antimicrobial functionality. Recent efforts increasingly focus on their hybrid composites for protective coatings, self-cleaning surfaces, and biomedical applications. The following subsections review their individual properties, composite performance, and key synthesis and interfacial aspects.
(1) Properties, structure, and potential of nanocellulose
Nanocellulose has been extensively studied for its biodegradability, renewability, and versatile surface chemistry. Abitbol et al. provide a detailed discussion of its broad applicability in biotechnology, drug delivery, tissue engineering, and sustainable materials[1]. Similarly, Klemm et al. describe nanocellulose as a new family of high-performance natural materials, emphasizing its high crystallinity, mechanical strength, and biocompatibility qualities that make it highly suitable for polymer composite matrices[2]. Wang et al. developed a flexible cellulose nanopaper from tobacco stalk using a sustainable fabrication method, demonstrating high wet tensile strength and toughness. The material also exhibited tunable ultraviolet-blocking capability, highlighting its potential for eco-friendly packaging and protective applications[3].
In biomedical engineering, Moniri et al. explored bacterial cellulose reinforced with nanocellulose, demonstrating improved mechanical performance for wound care materials[4]. Peng et al. studied epoxy composites reinforced with surface-treated nanocellulose, reporting improved tensile strength and structural performance[5].
Comprehensive reviews by Lee et al. highlight the ability of nanocellulose to enhance mechanical, thermal, and barrier properties in a wide range of polymer systems[6]. The review by Bee et al. discusses the development of polymer nanocomposites reinforced with silylated montmorillonite, emphasizing improved dispersion and interfacial bonding. It highlights significant enhancements in mechanical, thermal, and barrier properties due to surface modification of nanoclays. The study also outlines processing techniques and compatibility challenges in polymer matrices. These findings demonstrate the importance of surface functionalization in achieving high-performance nanocomposite systems[7]. Further discussions by Kargarzadeh et al. and Habibi explore chemical modifications, functionalization approaches, and composite applications across packaging, environmental engineering, and biomedical fields[8,9]. Surface modification remains crucial for improving compatibility with inorganic fillers.
Zhang et al. reported enhanced photocatalytic activity when modifying nanocellulose coatings with TiO2[10]. The study by Richard Moon et al. reviews the structure and key properties of cellulose nanomaterials, including high strength and large surface area. It emphasizes their effectiveness as reinforcement in polymer nanocomposites to enhance mechanical and barrier performance. The paper also highlights challenges in processing and dispersion of nanocellulose. These findings support its application in advanced nanocellulose-TiO2 composite systems for sustainable engineering uses[11].
Tang et al. demonstrated that ultrasonication-assisted esterification enhances nanocellulose dispersion in composite systems[12]. In addition, nanocellulose's chemical composition, primarily carbon (C) and oxygen (O), has been thoroughly analyzed, providing essential context for interpreting EDAX spectra in composite evaluations[13]. These modification techniques also affect EDAX outputs by altering elemental adsorption on nanocellulose surfaces.
(2) Titanium dioxide: structure, surface chemistry, and composite reinforcement
TiO2 is widely recognized for its dual anatase and rutile crystalline phases, both of which contribute to its UV shielding and photocatalytic properties. Chen & Mao provide an extensive overview of TiO2 synthesis, structure, and stoichiometry (Ti : O = 1:2)[14]. Diebold's foundational work in TiO2 surface science further explains the presence of surface hydroxylation, adsorbed oxygen, and carbon signals, which directly influence EDAX elemental mapping and ratio analysis[15]. Nostrati et al. studied TiO2/polyaniline coatings, confirming that uniform TiO2 dispersion improves self-cleaning functionality[16].
Syed et al. investigated epoxy/TiO2 composites for photocatalytic degradation of organic pollutants, confirming anatase TiO2 as a strong photoactive reinforcement[17]. Fujishima et al. further discuss TiO2's ability to generate reactive oxygen species (ROS), crucial for antimicrobial and environmental remediation applications[18]. Particle size also contributes to composite effectiveness. Al-Turaif demonstrated that smaller TiO2 nanoparticles significantly improve both mechanical reinforcement and photocatalytic performance in epoxy coatings[19].
(3) Nanocellulose TiO2 composites: functional, protective, and antimicrobial performance
Nanocellulose-TiO2 composites have been explored for protective coatings, self-cleaning surfaces, antimicrobial systems, and structural applications. For example, Yang et al. developed hydrophilic SiO2/TiO2 films with strong self-cleaning ability due to photocatalysis[20], while Toro et al. fabricated nanocellulose TiO2 composites that exhibited strong antimicrobial activities against E. coli[21]. Foster et al. explain the TiO2 antimicrobial mechanism, where ROS damage bacterial membranes[22].
The work by Lu & Hsieh reports the extraction of cellulose nanocrystals from rice straw using chemical treatment methods. The study highlights their high crystallinity, nanoscale dimensions, and excellent mechanical properties. It also emphasizes the potential of agricultural waste as a sustainable source of nanocellulose. These characteristics make the material highly suitable for reinforcement in advanced composite applications[23].
The study by Ma et al. investigates natural fiber-reinforced thermoplastic starch composites, focusing on mechanical and water absorption behavior. Results indicate improved tensile strength and stiffness with fiber incorporation, though moisture sensitivity remains a concern. The paper highlights the role of fiber–matrix interaction in determining composite performance. This work supports the development of biodegradable and sustainable composite materials[24]. Jin et al. reported that epoxy/TiO2 systems may include trace impurities such as silicon (Si), depending on processing conditions and substrates. The study also comprehensively reviewed the synthesis routes, curing mechanisms, and structure–property relationships of epoxy resins, highlighting their excellent mechanical strength, chemical resistance, and thermal stability, which support their widespread application in high-performance coatings and advanced composite systems[25].
Research gap and contribution of the present work
-
While prior studies have clearly highlighted the individual advantages of nanocellulose and TiO2, as well as their synergistic potential in specialized applications, significant gaps remain in comprehensive, multi-parameter evaluations of nanocellulose-TiO2 composites for emergency-related applications. Specifically, no existing work has systematically compared 5%, 10%, and 15% TiO2 loadings to achieve a balanced, multifunctional performance. Furthermore, limited studies have assessed the dual-industry relevance of these composites, encompassing both biomedical and automotive emergency systems, within a single platform. Very few research papers have provided integrated characterization combining FTIR, PSA, EDAX, DSC, ZPA, SEM, and XRD data to thoroughly understand nanoparticle dispersion, interfacial bonding, and thermal stability in a unified framework. Additionally, the effects of increasing TiO2 loading on aggregation behavior, dispersion stability, and structural consistency remain insufficiently addressed in earlier literature.
The present study addresses these gaps by synthesizing nanocellulose-TiO2 epoxy composites with 5%, 10%, and 15% TiO2 nanoparticles and performing extensive multi-modal characterizations. The results demonstrate that the 10% TiO2 composite offers the optimal balance of tensile strength and stiffness, thermal stability (with decomposition onset around 200 °C), dispersion uniformity (PSA: 267.8 nm; stable zeta potential: −19.0 mV), and structural integrity with well-distributed nanoparticles. These findings highlight the strong potential of these composites for emergency-response applications, including rapid-deployment biomedical supports, lightweight protective systems, antimicrobial surfaces, and fuel-efficient automotive components. Consequently, this work presents a dual-sector multifunctional composite platform, advancing the scientific understanding of nanocellulose-TiO2 systems and contributing meaningfully to sustainable materials engineering.
In the context of emergency-response sectors, materials are required to demonstrate rapid deployability, mechanical reliability under sudden loading, thermal stability in extreme environments, and potential biocompatibility for short-term medical applications. The developed nanocellulose-TiO2 reinforced epoxy composite is designed to address these multifunctional requirements. The incorporation of cellulose nanocrystals (CNC) provides lightweight reinforcement and enhanced stress-transfer capability, while TiO2 contributes to thermal stability and potential surface functionality. Such a synergistic material system is particularly relevant for emergency automotive components, temporary structural panels, and biomedical support elements where structural integrity, reduced weight, and environmental resilience are critical.
-
Nanocellulose-TiO2 composites (NC-TiO2-5%, NC-TiO2-10%, and NC-TiO2-15%) were synthesized using nanocellulose (sourced from Maple Biotech, Pune, India; 5−50 nm diameter, 500−2,000 nm length) as the primary matrix material. The Titanium Dioxide Nanopowder (TiO2) is sourced from Vedayukt India Private Limited, located at Surda Mines, East Singhbhum, Jharkhand. The material used in this study is cellulose nanocrystals (CNC), characterized by a diameter of 5–50 nm and a length of 500−2,000 nm. The CNC possesses high crystallinity and rod-like morphology; it contributes to improved stress transfer and stiffness enhancement within the epoxy matrix.
The product has an average particle size (APS) of < 100 nm, giving it nanoscale characteristics. It offers a high purity of 99%, ensuring suitability for advanced material and industrial applications. TiO2 nanoparticles as the reinforcing filler at 5%, 10%, and 15% by weight, respectively, as detailed in the composite matrix methodology. The matrix composition for the three samples was structured as follows: Sample 1 consisted of 65% nanocellulose, 5% TiO2, and 30% binder and hardener; Sample 2 comprised 60% nanocellulose, 10% TiO2, and 30% binder and hardener; and Sample 3 included 55% nanocellulose, 15% TiO2, and 30% binder and hardener. The binder and hardener system utilized epoxy resin (bisphenol-A-based) and a polyamine hardener in a 2:1 ratio. The composite slurry was prepared by combining the nanocellulose, TiO2 nanoparticles, epoxy resin, and hardener, followed by homogenization at 1,000 rpm for 10 min using a high-shear mixer to ensure uniform dispersion of TiO2 within the nanocellulose matrix. The homogenized slurry was then cast into silicone material molds using a vacuum casting process at 0.1 mbar to eliminate air bubbles, ensuring a defect-free structure. The molds were cured at 60 °C for 24 h in a controlled oven to facilitate cross-linking of the epoxy resin, followed by drying at 80 °C for 12 h to remove residual moisture, resulting in solid composite specimens with dimensions of 10 mm diameter × 25 mm length, and 50 mm gauge length × 10 mm width × 3 mm thickness for mechanical and analytical testing.
Figure 1 illustrates the actual samples of the Nanocellulose-TiO2 composites for the three compositions (NC-TiO2-5%, NC-TiO2-10%, NC-TiO2-15%).
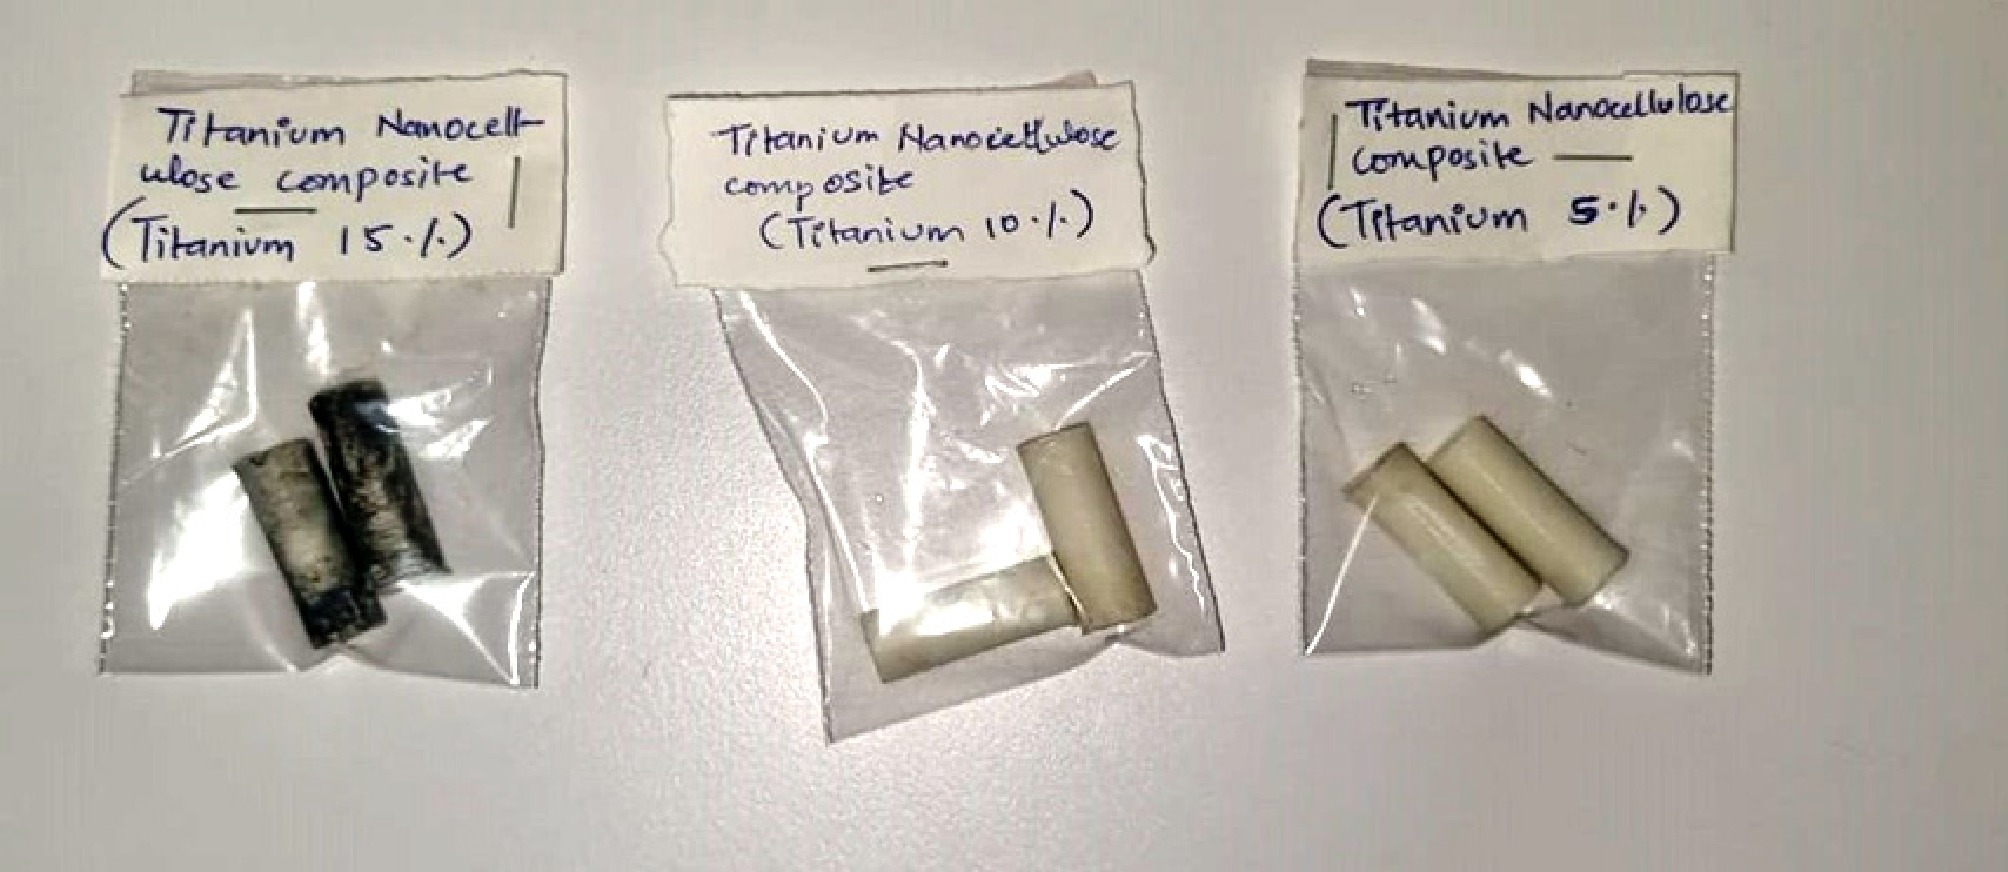
Figure 1.
Samples of nanocellulose-TiO2 composites.
Mechanical testing
-
Tensile properties of NC-TiO2 composites were evaluated per ASTM D638 using an Instron 3365 universal testing machine with a 5 kN load cell. Dog-bone specimens (50 mm gauge length, 10 mm width, 3 mm thickness) were tested at a crosshead speed of 5 mm/min under ambient conditions (25 °C, 50% RH). Five replicates per composition ensured statistical reliability, with tensile strength, Young's modulus, and elongation at break calculated.
X-Ray diffraction (XRD)
-
Crystalline structures were characterized via PXRD (BRUKER AXS D8 FOCUS, Cu Kα1, 1.5406 Å) following ISO 19723-1:2018 and ASTM D934-13 standards. Powdered samples (< 75 µm) were prepared by grinding and sieving, then pressed into flat holders. Scans covered a 2θ range of 2° to 80° (0.02° step, 1 s/step) at 40 kV, 30 mA, with a nickel filter to eliminate Kβ radiation. Calibration used NIST SRM 1976 (corundum) for 2θ accuracy.
Fourier Transform Infrared Spectroscopy (FTIR)
-
FTIR (PerkinElmer Spectrum Two, 450–4,000 cm−1, 4 cm−1 resolution, 32 scans) confirmed TiO2 integration within the nanocellulose matrix. Pulverized samples were mixed with KBr (1:100) and pressed into pellets under 10 tons for 5 min. Spectra were recorded at 25 °C, 50% RH, with polystyrene calibration for wavenumber accuracy. Characteristic peaks (e.g., Ti-O: 500–800 cm−1, O-H: 3,200–3,600 cm−1) were analyzed to assess matrix-filler interactions, and results were validated against reference spectra.
Particle Size Analysis (PSA)
-
Particle size distribution was determined via DLS (Malvern Zetasizer Nano ZS, 633 nm laser, 173° scattering) on 0.1 wt% suspensions ultra-sonicated for 15 min at 40 kHz. Samples were filtered (0.45 µm) to remove debris, and measurements were conducted in triplicate (12 runs each) at 25 °C. The refractive index was set to 1.47 for composites and 1.33 for water (viscosity 0.895 mPa s). Z-average, median, mode, and polydispersity index were reported, with particle sizes (188–434 nm) suitable for drug delivery and photocatalysis applications.
Energy Dispersive X-ray (EDX) Analysis
-
EDX (JEOL JSM-6390 SEM, 15 kV, Oxford X-Max) analyzed elemental composition (C, O, Ti) on 10 mm × 10 mm × 3 mm samples. Spectra were collected over 60 s, targeting Ti peaks at 4.508 keV, with elemental mapping over a 100 × 100 µm area to assess TiO2 dispersion. Weight percentages (55%–75% C, 25%–45% O) were reported, and results were correlated with SEM observations to evaluate uniformity.
Differential Scanning Calorimetry (DSC)
-
Thermal properties were assessed using a TA Instruments Q200 DSC (30–400 °C, 10 °C/min, N2 flow: 50 mL/min). Samples (5–10 mg) in sealed aluminum pans were calibrated with indium for accuracy. Thermograms identified endothermic peaks (moisture loss: 71–148 °C) and exothermic decomposition (~200 °C). Peak temperature, onset, endset, and normalized enthalpy (J/g) were calculated to compare thermal stability across compositions, aiding material selection for high-temperature applications.
Zeta Potential Analysis (ZPA)
-
Colloidal stability was evaluated via ZPA (Malvern Zetasizer Nano ZS) on 0.1 wt% suspensions (pH 7.0) ultrasonicated for 15 min. Measurements in triplicate (10 runs each) at 25 °C used a disposable capillary cell (3.3–3.4 V). Calibration with a −42 mV standard ensured accuracy. Zeta potentials (−19.0 to −27.0 mV), electrophoretic mobility, and conductivity (0.209 mS/cm) were reported, with higher absolute values indicating enhanced resistance to aggregation.
Scanning Electron Microscopy (SEM)
-
SEM (JEOL JSM-6390, 5–15 kV, 8–12 mm working distance) imaged 10 mm × 10 mm × 3 mm samples mounted on carbon tape. Magnifications (100×–10,000×) revealed a porous, fibrous nanocellulose matrix and TiO2 clusters (100–500 nm at 15% loading). Cross-sectional views from liquid nitrogen-fractured samples detailed particle–matrix interactions. Images confirmed increasing aggregation at higher TiO2 loadings, critical for automotive and biomedical applications.
-
The experimental evaluation of nanocellulose-TiO2 composites (5%, 10%, 15% TiO2 by weight) was conducted using a suite of advanced analytical techniques to assess their chemical, physical, and thermal properties. Fourier Transform Infrared Spectroscopy (FTIR) identified molecular bonds, confirming TiO2 integration and matrix stability. Particle Size Analysis (PSA) via dynamic light scattering measured TiO2 nanoparticle sizes and distribution within the composites. Energy Dispersive X-ray (EDX) analysis, coupled with scanning electron microscopy (SEM), examined elemental composition and surface morphology, revealing nanocellulose structure and TiO2 dispersion. Differential Scanning Calorimetry (DSC) evaluated thermal behavior, including moisture loss and decomposition temperatures. Zeta Potential Analysis (ZPA) assessed the colloidal stability of the nanoparticle suspensions. SEM provided detailed imaging of surface and cross-sectional morphology, highlighting TiO2 particle distribution and aggregation trends. The results, presented through spectra, graphs, and images, offer a comprehensive understanding of the composites' suitability for automotive and biomedical applications.
Mechanical properties of nanocellulose-TiO2 composites
-
Table 1 displays tensile properties of nanocellulose-TiO2 composites for three compositions. The NC-TiO2-10% composite exhibited the highest tensile strength (52.4 MPa) and Young's modulus (3.3 GPa), reflecting optimal TiO2 reinforcement. The NC-TiO2-5% composite showed lower strength (43.2 MPa) and stiffness (2.6 GPa) due to limited TiO2 content, while the NC-TiO2-15% composite's reduced strength (47.7 MPa) and ductility (2.4%) suggest filler clustering. Elongation-at-break decreased with increasing TiO2, with NC-TiO2-5% being the most ductile (3.4%).
Table 1. Tensile properties of nanocellulose-TiO2 composites, (mean ± SD).
Sample Tensile
strength (MPa)Young's
modulus (GPa)Elongation at
break (%)NC-TiO2-5% 43.16 ± 0.76 2.56 ± 0.11 3.40 ± 0.16 NC-TiO2-10% 52.32 ± 0.43 3.32 ± 0.08 2.60 ± 0.16 NC-TiO2-15% 47.56 ± 0.34 3.32 ± 0.08 2.38 ± 0.08 The NC-TiO2-10% composite's superior mechanical properties make it ideal for lightweight automotive panels (~50 MPa strength, ~3 GPa modulus) and biocompatible implants. The NC-TiO2-15% composite's lower strength and ductility limit its use in flexible applications, while the NC-TiO2-5% composite's ductility suits softer biomedical uses but lacks strength for load-bearing components.
The mechanical performance of the composites revealed a clear dependence on TiO2 loading. The 10% TiO2 composite exhibited the highest tensile strength, 52.4 MPa, and outperformed both the 5% and 15% formulations. This improvement is attributed to optimal interfacial adhesion between nanocellulose and well-distributed TiO2 particles, promoting efficient stress transfer and load sharing. At 5% loading, the nanoparticle content is insufficient to reinforce the matrix significantly. Conversely, the 15% TiO2 composite exhibited reduced tensile strength due to nanoparticle agglomeration, which introduces micro-voids and stress concentration zones, weakening the matrix under load. This behavior is well documented in nanocomposite literature, where excessive filler content often leads to particle clustering and reduced mechanical performance.
Standard deviation values from triplicate testing have been added, and an updated tensile plot with error bars is now included. These results demonstrate that 10% TiO2 provides the optimal balance between reinforcement and processability, supporting its selection as the most effective formulation. The optimized composite formulation (10 wt% TiO2), exhibiting improved tensile strength (~52 MPa) and enhanced dispersion, demonstrates suitability for applications requiring resistance to impact and sudden mechanical stresses. In emergency automotive systems, such properties are essential for lightweight interior panels, energy-absorbing structures, and protective housings. Additionally, the improved thermal stability observed in DSC analysis indicates potential applicability in environments subjected to elevated temperatures, such as battery enclosures or emergency response equipment exposed to thermal fluctuations.
Fourier Transform Infrared Spectroscopy (FTIR)
-
Fourier Transform Infrared (FTIR) spectroscopy was employed to investigate the chemical structure, functional groups, and matrix-filler interactions in the nanocellulose-TiO2 composites. The analysis provides insight into the incorporation of TiO2 nanoparticles and their interaction with the cellulose-based matrix through characteristic vibrational bands. Figures 2−4 present the FTIR spectra of NC-TiO2 composites with varying TiO2 loadings (5%, 10%, and 15%). The key spectral features and their evolution with TiO2 content are discussed below.
NC-TiO2-5%
-
Figure 2 shows several distinct IR absorption peaks corresponding to the major functional groups in the composite. The broad band at ~3,337 cm−1 represents O–H stretching, indicating surface hydroxyls or moisture associated with the nanocellulose-TiO2 matrix. Peaks at 2,920–1,500 cm−1 (C–H and C=O vibrations) confirm the presence of organic components from the polymer/cellulose structure. Strong absorptions at 1,064 and 1,114 cm−1 reflect C–O stretching, suggesting a dominant contribution from the cellulose-based matrix. A clear band at ~699 cm−1 corresponds to Ti–O/Ti–O–Ti stretching, confirming TiO2 incorporation. Compared with the 5% sample, the 10% composite shows deeper C–O and Ti–O absorptions, indicating stronger matrix-filler interaction and improved nanoparticle integration.
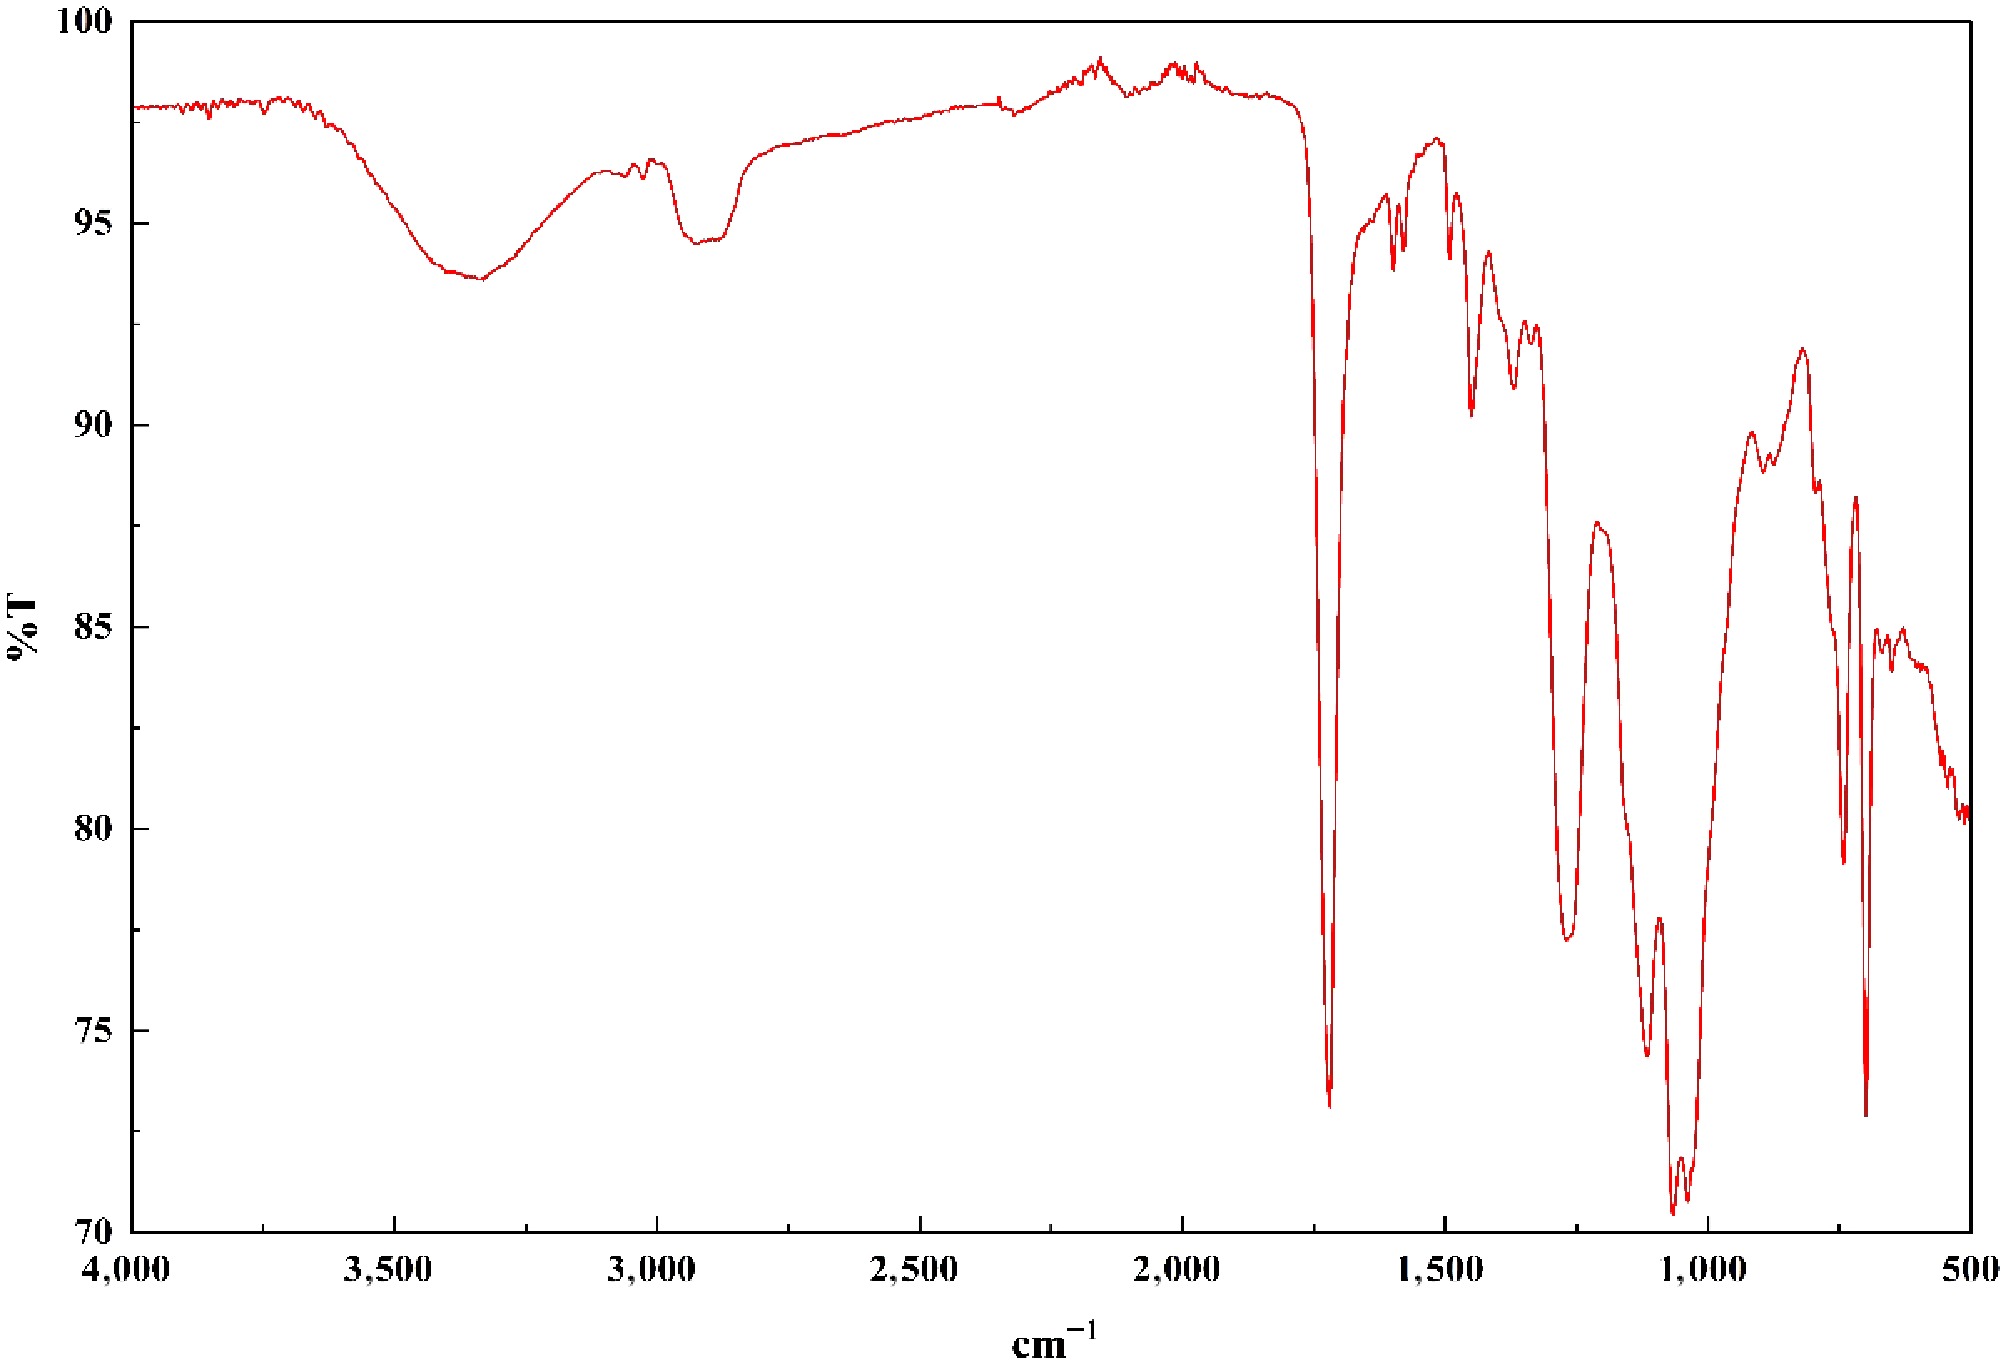
Figure 2.
FTIR of NC-TiO2-5%.
NC-TiO2-10%
-
Figure 3 shows the infrared (IR) spectroscopy spectrum for a sample labelled 'NC-TiO2-10%', showing the transmittance (%T) on the y-axis (ranging from 60% to 99%) as a function of wavenumber (cm−1) on the x-axis (from 450 to 4,000 cm−1). IR spectroscopy is used to identify chemical bonds and functional groups in a material by measuring the absorption of infrared light at specific wavenumbers, which correspond to vibrational modes of molecular bonds. The label 'Titanium NC 10%' indicates a nanocomposite material with 10% titanium content, likely titanium dioxide (TiO2) nanoparticles, embedded in a matrix, possibly organic. The peaks are annotated with their wavenumbers and transmittance values, providing insights into the sample's composition.
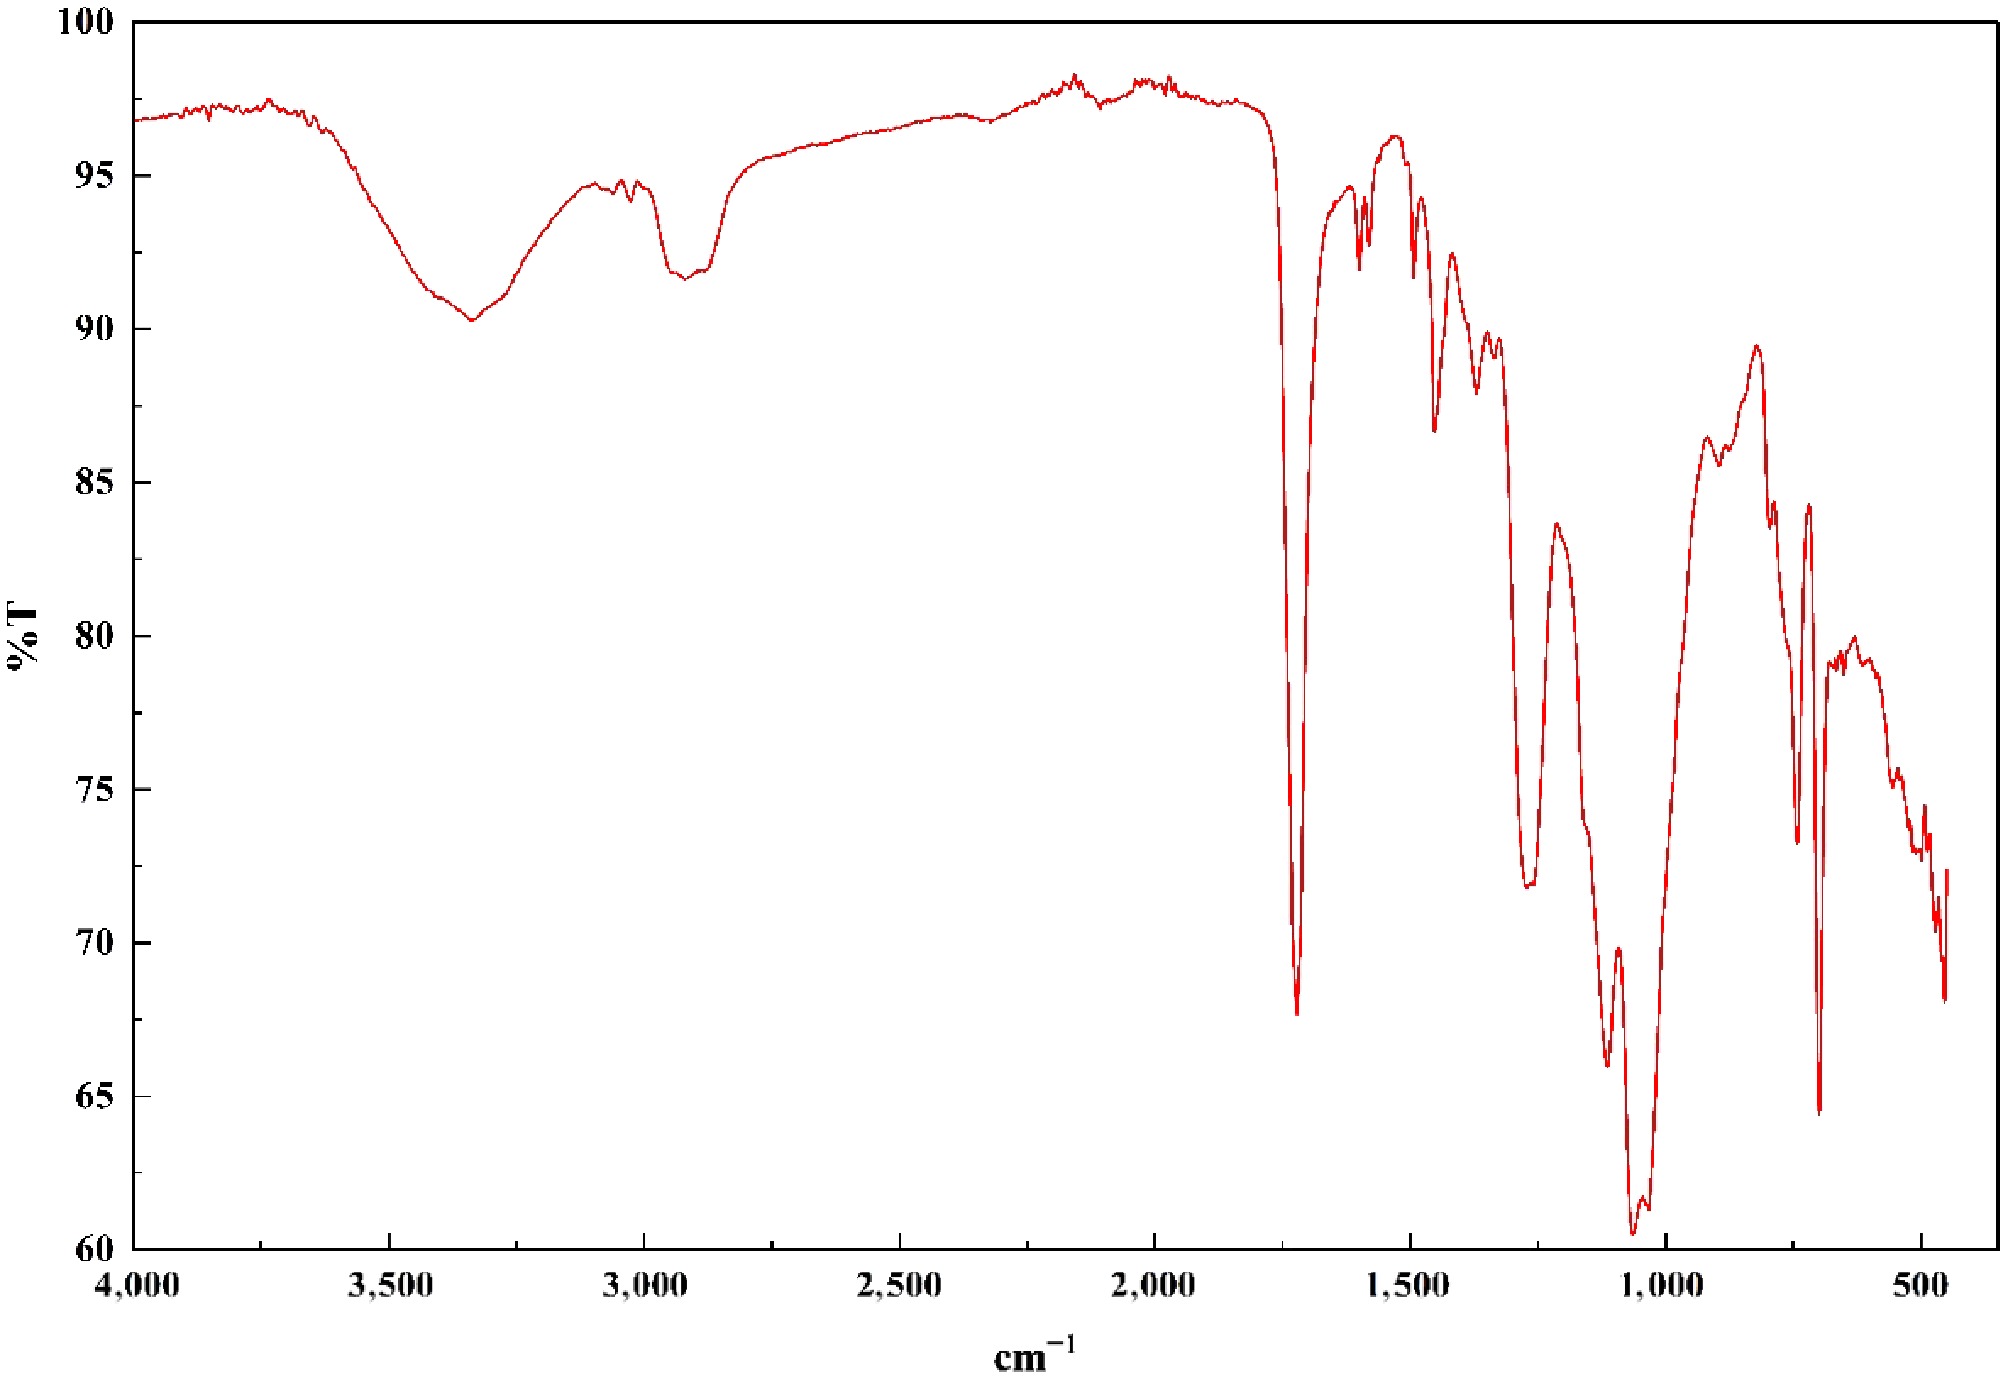
Figure 3.
FTIR of NC-TiO2-10%.
The FTIR spectrum of the 10% TiO2 composite shows the characteristic matrix bands, including O–H stretching at ~3,337 cm−1 and C–H/C=O vibrations between 2,800–1,700 cm−1, confirming the organic polymeric structure of the material. Strong C–O vibrations in the 1000–1,200 cm−1 region (e.g., 1,064 and 1,114 cm−1) indicate dominant cellulose/organic backbone contributions.
A clear absorption at ~699 cm−1 corresponds to Ti–O/Ti–O–Ti stretching, confirming TiO2 incorporation. Compared to the 5% sample, the 10% composite shows stronger Ti–O and C–O absorption, indicating enhanced matrix–filler interaction and better nanoparticle integration within the polymer network.
NC-TiO2-15%
-
Figure 4 illustrates the infrared (IR) spectroscopy spectrum for a sample labelled 'NC-TiO2-15%', plotting transmittance (%T) on the y-axis (ranging from 69% to 99%) against wavenumber (cm−1) on the x-axis (from 450 to 4,000 cm−1).
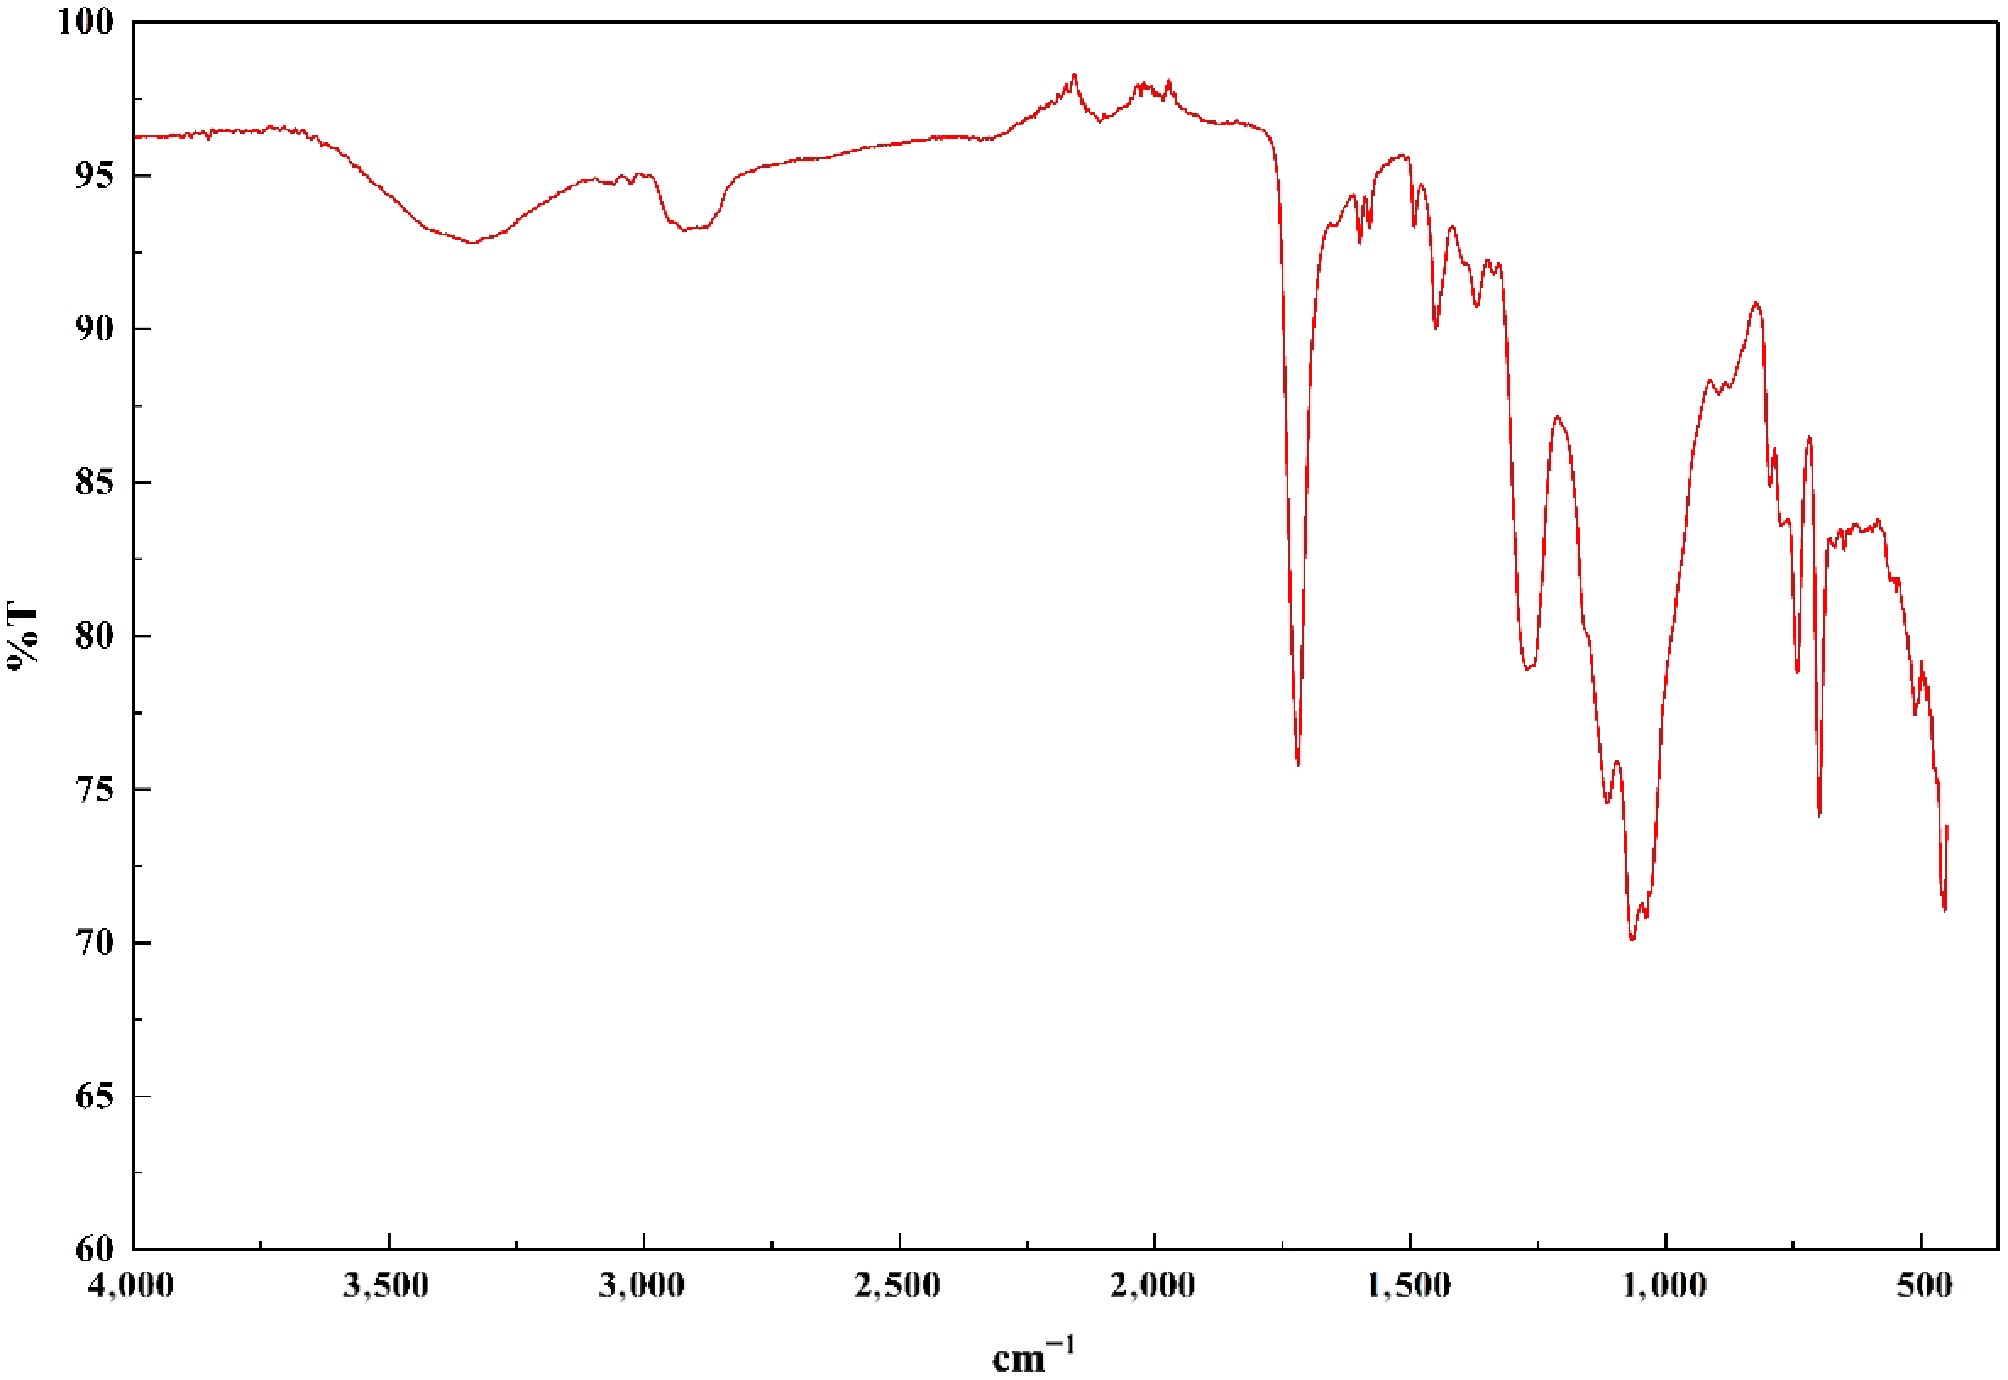
Figure 4.
FTIR of NC-TiO2-15%.
The FTIR spectrum shows the expected cellulose-based matrix peaks along with clear evidence of TiO2 incorporation. The broad band at ~3,337 cm−1 corresponds to O–H stretching, indicating surface hydroxyls and hydrogen bonding within the matrix. Peaks in the 1,200−1,300 cm−1 (C–O) and ~1,720 cm−1 (C=O) regions confirm the organic polymeric backbone of the composite. The most significant features are in the 500–800 cm−1 region, where strong absorption bands at ~743, 699, 511, and 454 cm−1 correspond to Ti–O and Ti–O–Ti lattice vibrations, confirming the presence of TiO2 and its integration within the matrix.
The relative intensity and slight shifts of these Ti-O bands, along with the narrowing of the O–H band, indicate matrix-filler interaction, consistent with TiO2 bonding to hydroxyl groups and partial coordination with the polymer network.
The FTIR spectra of all three nanocellulose-TiO2 composites exhibit the characteristic cellulose bands, including O–H stretching (~3,340 cm−1), C–H stretching (~2,890 cm−1), and C–O–C/C–O vibrations (1,020–1,060 cm−1). The key differences arise from TiO2 incorporation and matrix-filler interaction.
Evidence of Ti–O bonding:
A distinct absorption band appears in the 470–520 cm−1 region for all composites, corresponding to the Ti–O and Ti–O–Ti lattice vibrations, confirming the presence of TiO2 within the nanocellulose matrix.
Matrix–filler interaction:
With increasing TiO2 content, two systematic shifts occur:
(1) the broad O–H stretching band becomes slightly narrower and shifts to lower wavenumbers, indicating hydrogen-bond rearrangement between surface hydroxyls of nanocellulose and Ti–O/Ti–OH groups;
(2) a reduced intensity of the C–O–C band (≈ 1,050 cm−1) suggests partial coordination or adsorption of TiO2 nanoparticles on cellulose chains.
These changes together confirm effective matrix–filler interaction and interfacial bonding.
Differences between 5%, 10%, and 15% TiO2 samples:
(1) 5% TiO2: the Ti-O band is present but weak; O–H shift is minimal, indicating limited nanoparticle–cellulose interaction.
(2) 10% TiO2: shows the largest O–H shift and noticeable reduction in C–O–C intensity, implying the strongest matrix–filler interaction and good dispersion.
(3) 15% TiO2: the Ti-O band is stronger due to higher particle content, but the O–H shift is smaller compared to 10%, suggesting the onset of agglomeration, which reduces effective bonding sites for interaction.
In summary, FTIR confirms Ti-O incorporation in all composites, but the 10% sample displays the most favourable interfacial interaction, consistent with PSA/ZPA/SEM trends and its superior mechanical performance.
Particle Size Analyser (PSA)
-
The PSA test in the image appears, based on DLS, given the presence of a Z-average and Polydispersity Index (PI), which are standard metrics in DLS reports. In DLS, a laser beam passes through a sample, and the scattered light is analyzed to determine particle size based on fluctuations in intensity caused by particle movement.
NC-TiO2-5%
-
Figure 5 shows a roughly bell-shaped distribution with a peak around 296.9 nm (the mode), where the frequency reaches its maximum (around 15–20).
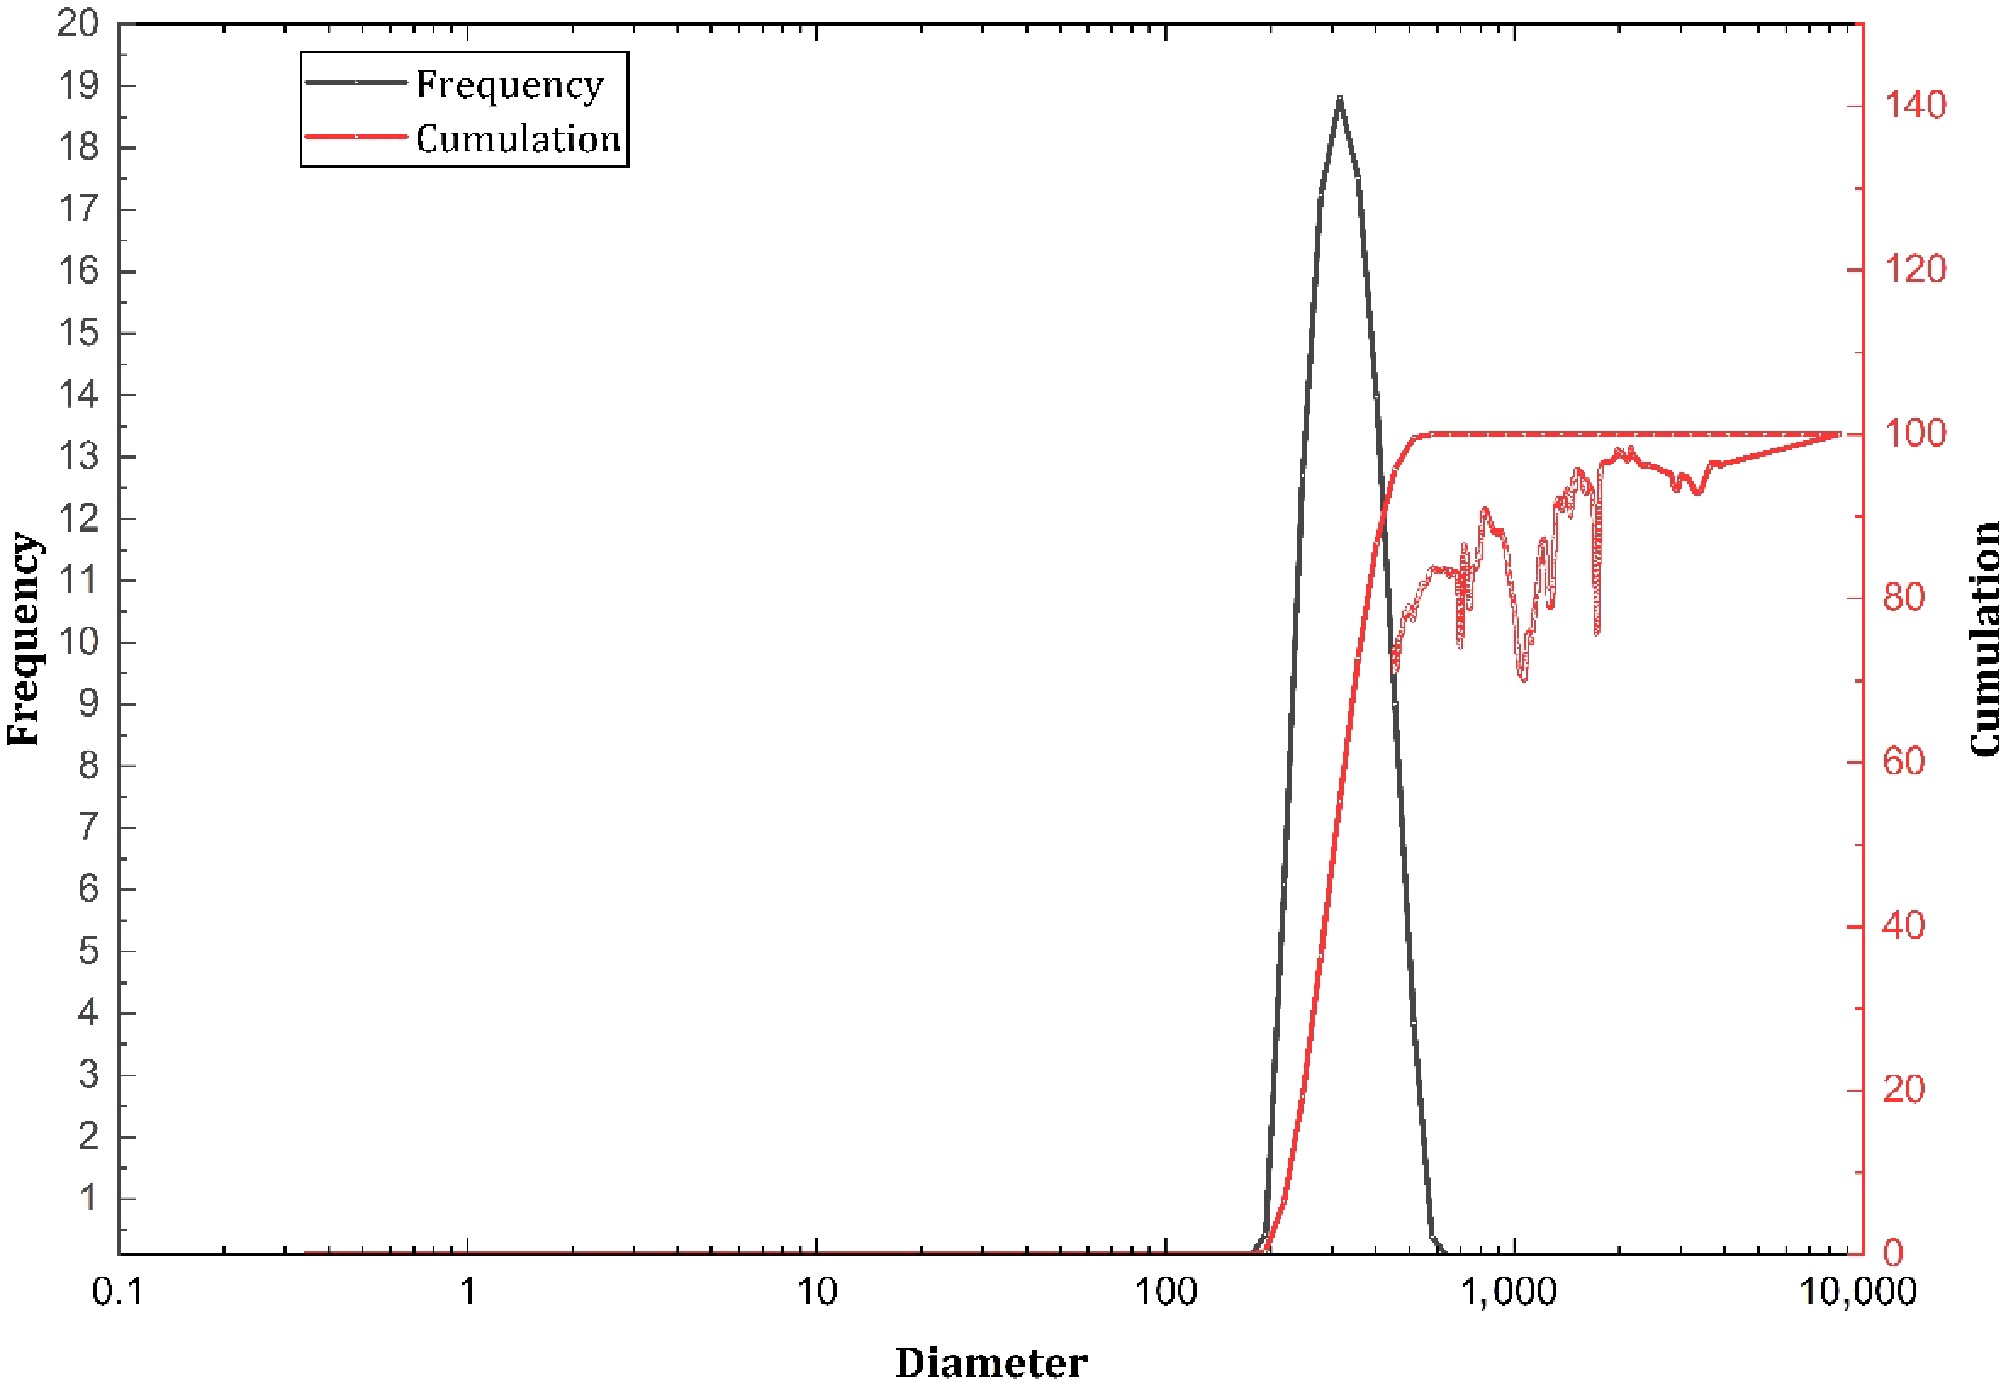
Figure 5.
PSA of NC-TiO2-5%.
Table 2 gives the particle size analysis data for NC-TiO2-5%. Particle Size Analysis (PSA) enables a wide range of applications by optimizing particle size distributions, such as the 200−500 nm range with moderate polydispersity (PI: 0.413) shown in the provided data. In pharmaceuticals, this size range is ideal for drug delivery systems like liposomes, leveraging the EPR effect for cancer therapies while ensuring controlled release through a mix of smaller (Z-average: 232.0 nm) and larger particles (up to 420.5 nm). In catalysis, nanoparticles around 296.9 nm (the mode) enhance reaction efficiency in processes like CO oxidation, benefiting from high surface area. Paints and coatings achieve better opacity and dispersion with this size distribution, improving coverage and stability. Environmental remediation employs 200−500 nm particles for pollutant adsorption, balancing capacity and separability, while energy storage applications, like battery electrodes, benefit from increased surface area and packing density, enhancing charge-discharge rates and stability.
Table 2. PSA for NC-TiO2-5%.
Peak No. SP area ratio Mean (nm) SD (nm) Mode (nm) 1 1.00 314.7 72.7 296.9 2 − − − − 3 − − − − Total 1.00 314.7 72.7 296.9 NC-TiO2-10%
-
The particle size distribution shows a median diameter of 267.8 nm, indicating that half of the particles are smaller and half are larger than this value. The mode is 262.4 nm, representing the most frequently occurring particle size, which is slightly lower than the median.
Cumulative percentiles: these indicate the diameters below which a certain percentage of particles fall.
The Z-average diameter is 225.8 nm, reflecting the intensity-weighted mean size in DLS and appearing lower than the median due to sensitivity toward smaller particles. The Polydispersity Index (0.468) indicates a moderately broad and polydisperse particle size distribution.
Figure 6 indicates a moderately polydisperse sample (PI: 0.468) with particle sizes primarily ranging from 188.7 nm (5th percentile) to 366.8 nm (90th percentile).
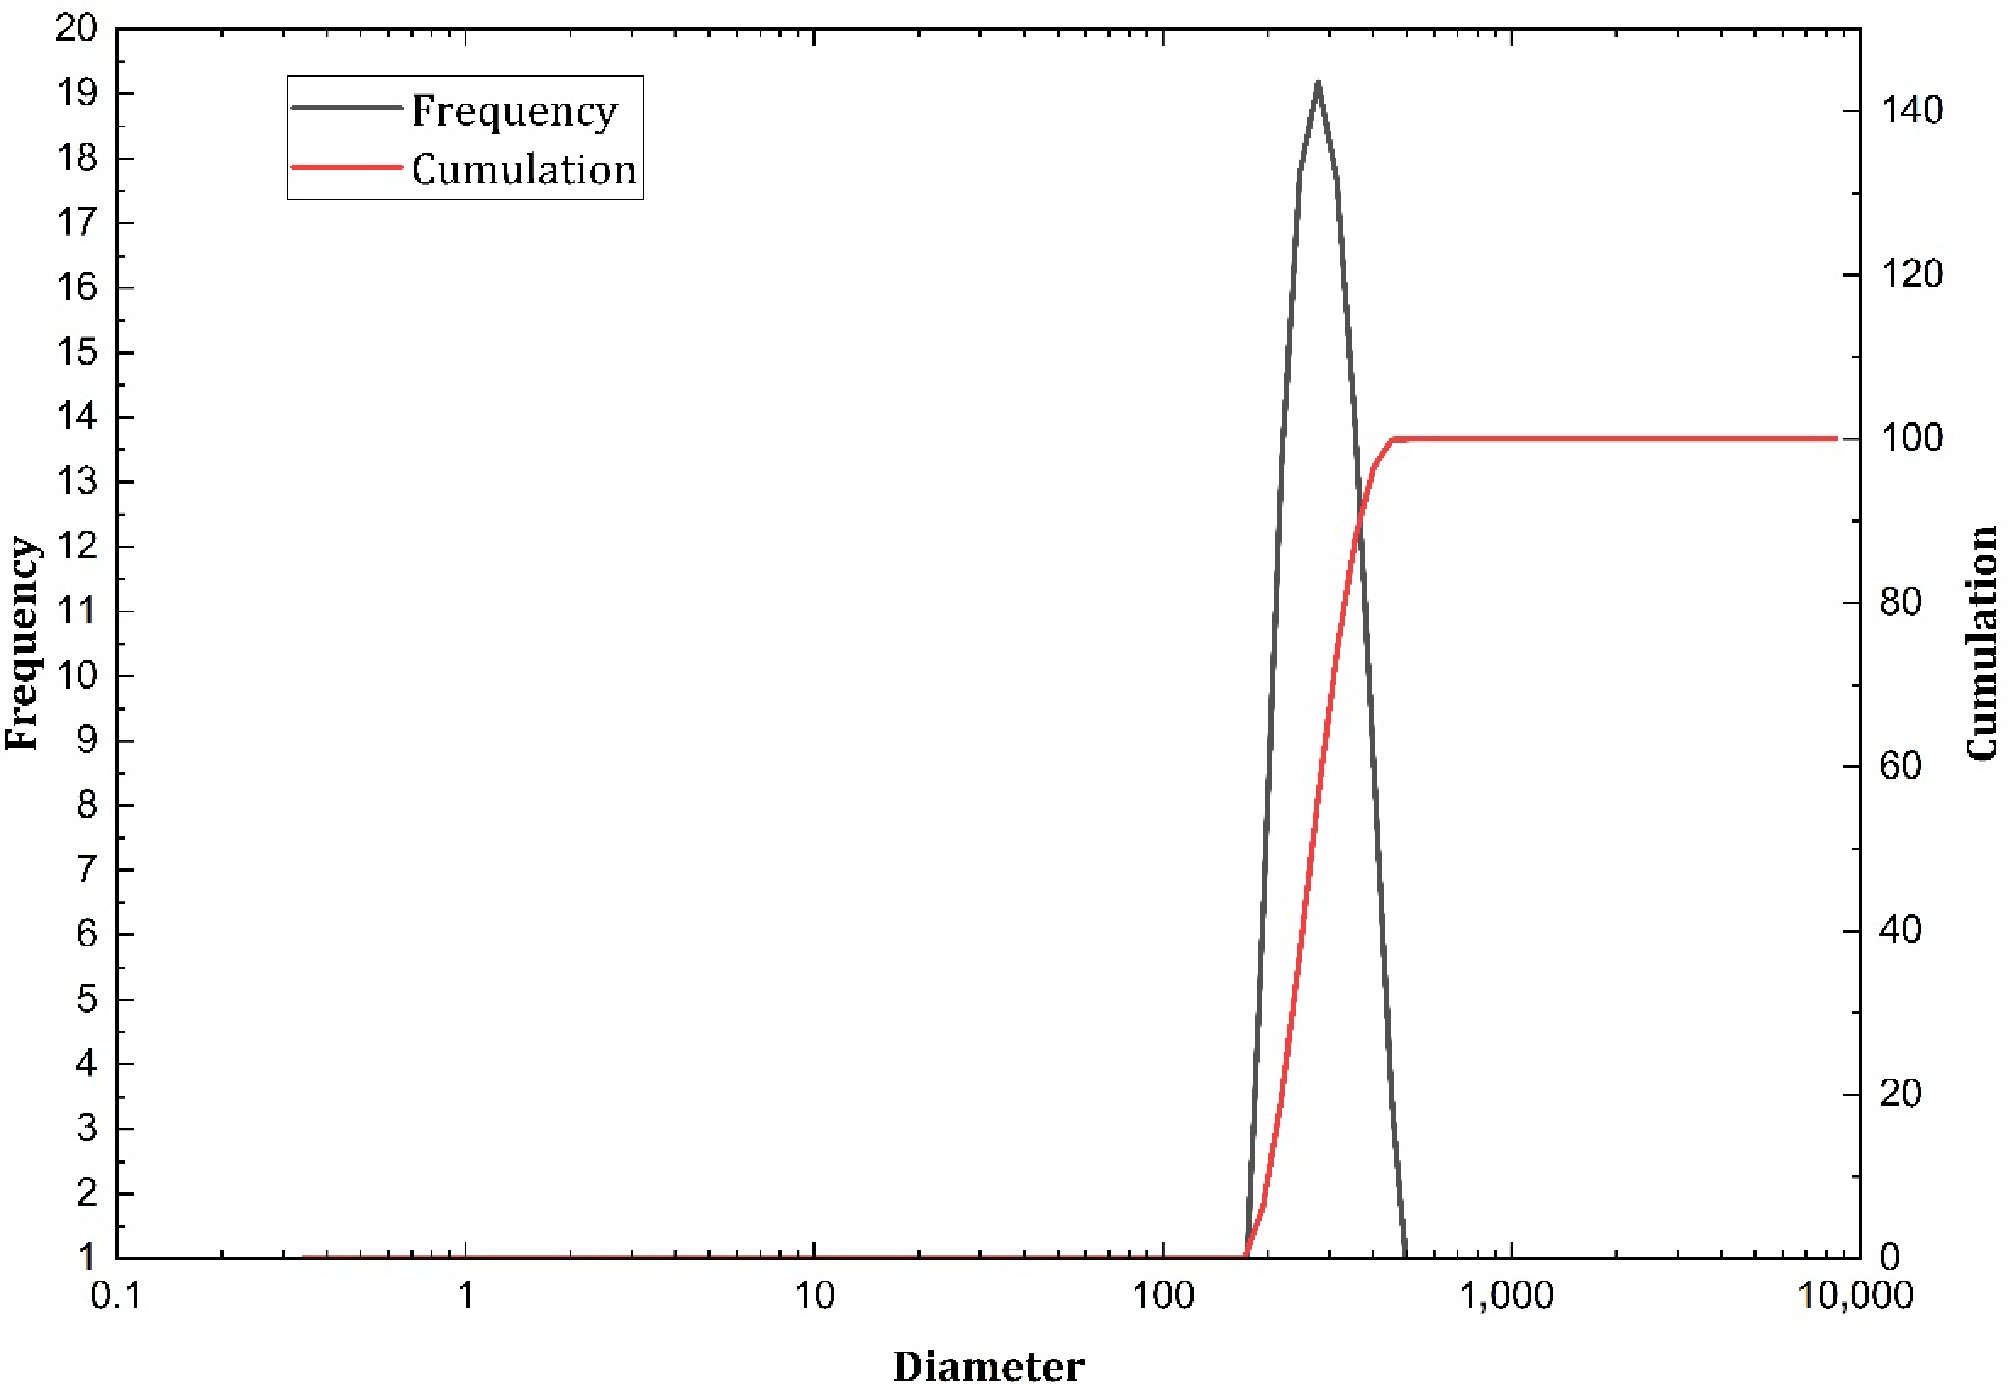
Figure 6.
PSA of NC-TiO2-10%.
Table 3 presents the PSA data for NC-TiO2-10%, showing a mean particle size of 276.4 nm with a standard deviation of 62.1 nm, indicating a relatively narrow and consistent distribution. These particles are suitable for drug delivery, tissue engineering, composites, coatings (antibacterial and UV protection), water purification, energy storage, and cosmetic applications due to their favorable size and uniformity.
Table 3. PSA for NC-TiO2-10%.
Peak No. SP area ratio Mean (nm) SD (nm) Mode (nm) 1 1.00 276.4 62.1 262.4 2 − − − − 3 − − − − Total 1.00 276.4 62.1 262.4 NC-TiO2-15%
-
The PSA report presents the nanoparticle size distribution measured by DLS, including Z-average and PI values, shown in both tabular and graphical formats. The median size is 312.8 nm, indicating half the particles are smaller and half are larger than this value. The mode is 298.2 nm, representing the most frequently occurring particle size and the peak of the distribution.
Cumulative percentiles: these show the diameters below which a certain percentage of particles fall.
The Z-average diameter is 219.8 nm, representing the intensity-weighted mean size in DLS and appearing lower than the median due to the stronger scattering contribution of smaller particles. The Polydispersity Index (0.397) indicates a moderately polydisperse and relatively broad particle size distribution. Figure 7 indicates a moderately polydisperse sample (PI: 0.397) with particle sizes primarily ranging from 215.1 nm (5th percentile) to 434.9 nm (90th percentile).
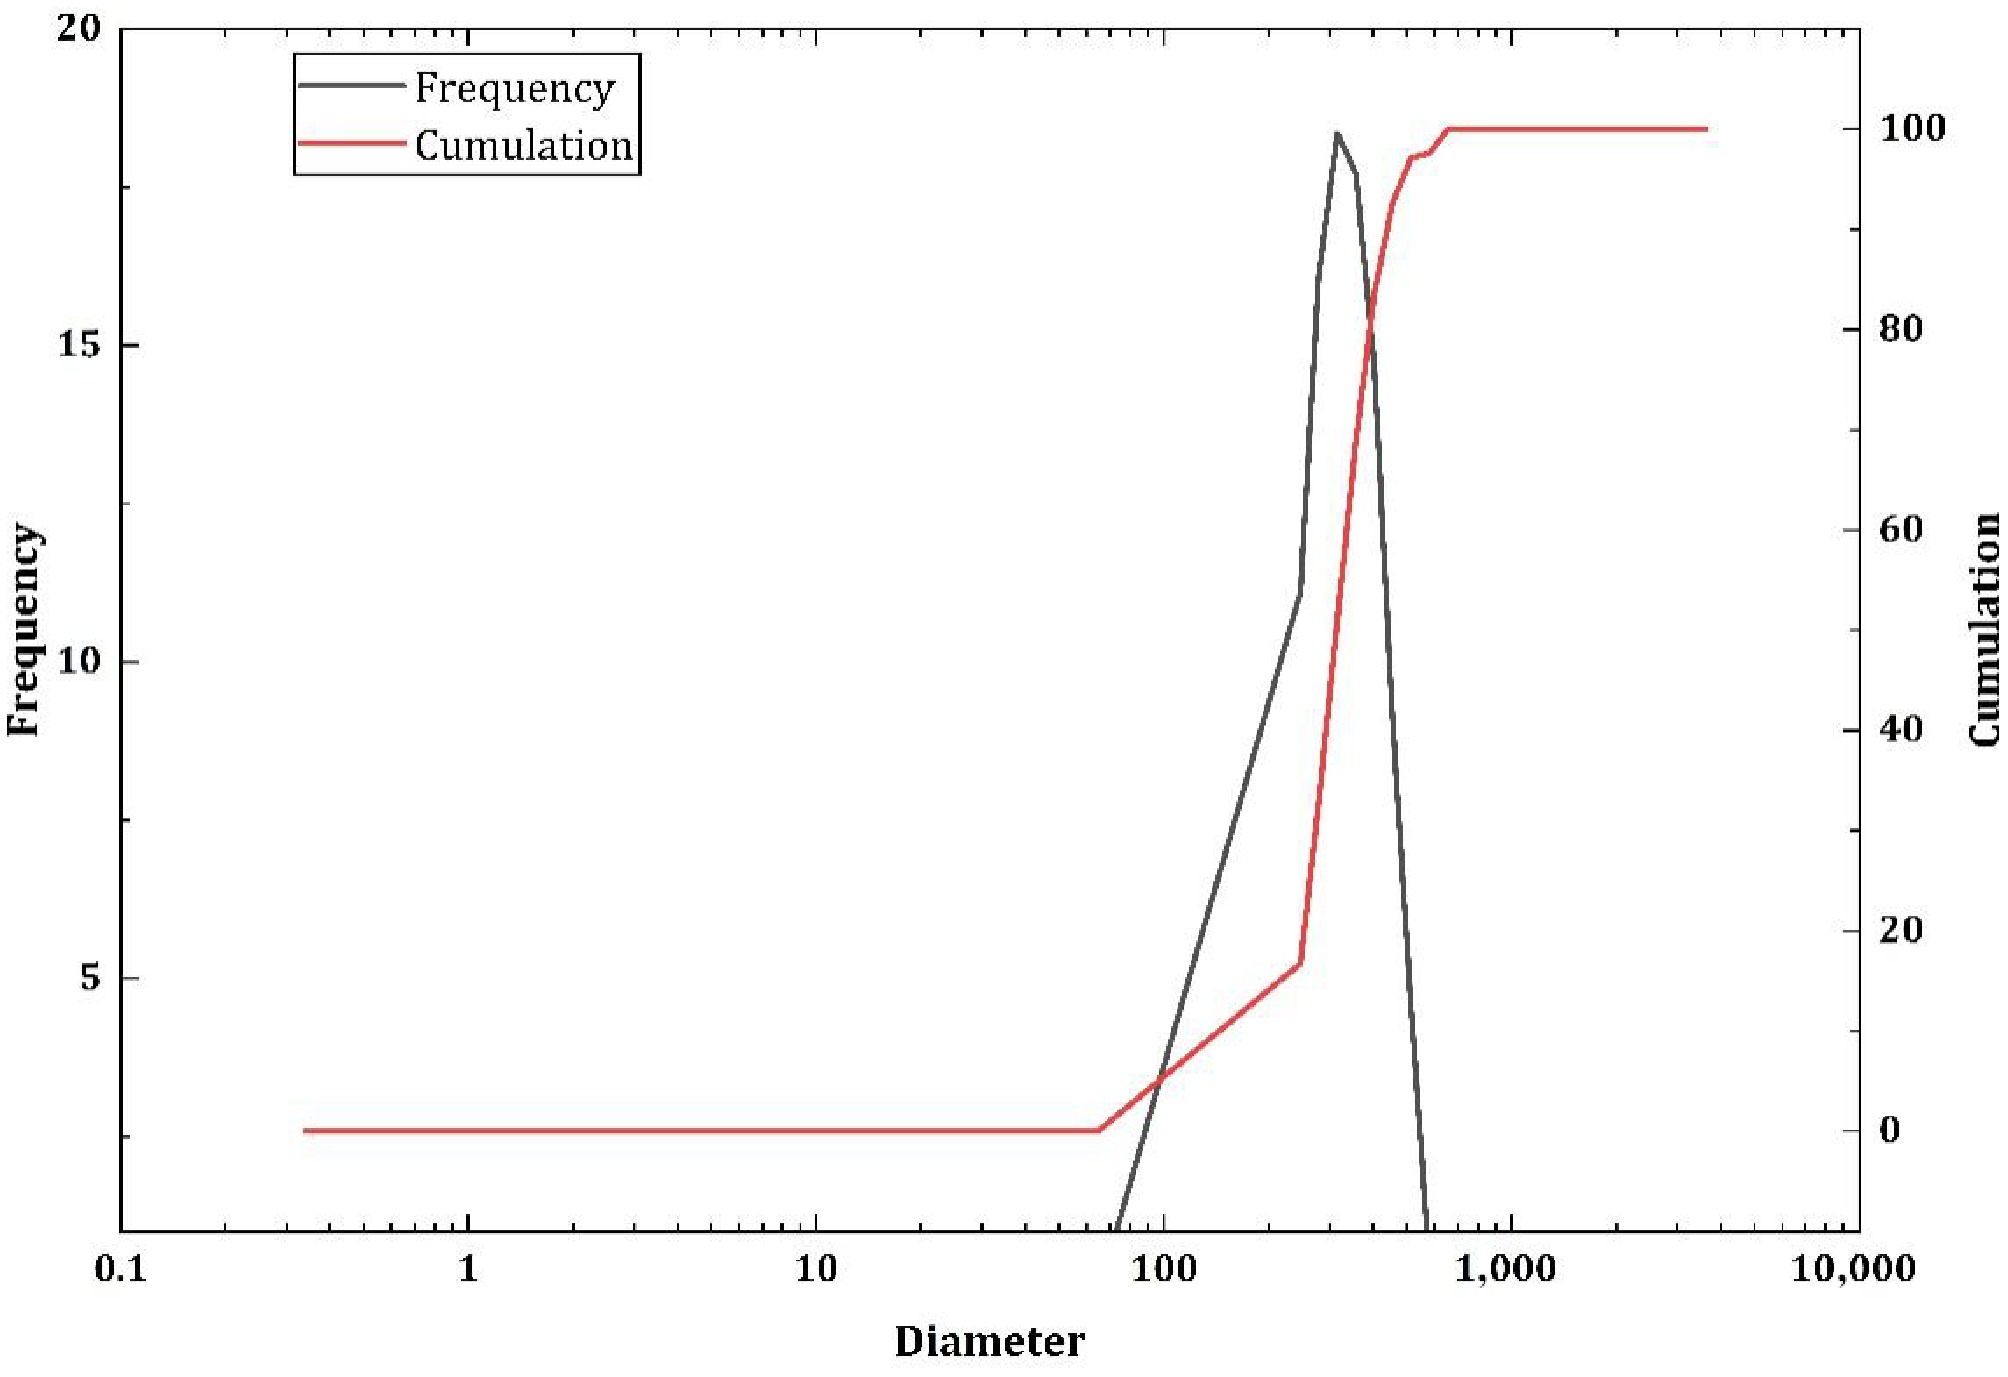
Figure 7.
PSA of NC-TiO2-15%.
The PSA report shows a moderately polydisperse sample with a median particle size of 312.8 nm, a mode of 298.2 nm, and a Z-average of 219.8 nm, with most particles ranging from 215.1 nm to 434.9 nm. The histogram and cumulative curve confirm a slightly right-skewed distribution, typical for nanoparticle suspensions measured by DLS. These results are valuable for modifying the sample for applications requiring specific size ranges, such as drug delivery or catalysis, while the polydispersity highlights potential areas for process refinement depending on the intended use. The PSA results show a mean particle size of 323.4 nm with a standard deviation of 77.3 nm, indicating a moderately broad distribution. The mode (298.2 nm) is slightly lower than the mean, suggesting slight skewness toward larger particles. Consistent measurement conditions confirm the reliability of the DLS analysis.
Table 4 gives the particle size analysis data for NC-TiO2-15%. For composite materials, the 323.4 nm particles can enhance mechanical properties in polymers, providing uniform reinforcement due to the moderate size distribution. The titanium nanocellulose sample is suitable for biomedical, composite, and environmental applications due to its moderate size distribution and uniform reinforcement capability. Its photocatalytic properties enable use in antibacterial coatings and water purification by degrading organic pollutants under light. Further process optimization (e.g., synthesis control or filtration) can improve uniformity if required.
Table 4. PSA for NC-TiO2-15%.
Peak No. SP area ratio Mean (nm) SD (nm) Mode (nm) 1 1.00 323.4 77.3 298.2 2 − − − − 3 − − − − Total 1.00 323.4 77.3 298.2 The DLS data (Figs. 5−7; Tables 2−4) show median particle sizes of ~305 nm (5%), ~268 nm (10%), and ~313 nm (15%), Z-averages of ~232, 226, and 220 nm, and moderate polydispersities (PI ≈0.41–0.47). These PSA results must be interpreted together with zeta-potential and SEM/XRD observations to explain actual composite behaviour.
(1) Effect on dispersion quality. The moderate PI values (0.39–0.47) plus the ZPA values (−19 to −27 mV) indicate partially stable but not monodisperse suspensions: the −19 mV for the 10% sample indicates weaker electrostatic repulsion than −27 mV for 15% (ZPA data), while SEM shows increased particle clustering at 15% loading. Together, these observations imply that at 10% TiO2 the balance of interparticle repulsion and steric anchoring to the nanocellulose matrix yields the most uniform dispersion, whereas at 15%, increased particle–particle contact promotes agglomeration despite strong net surface charge (SEM clusters and larger median). These findings indicate that PSA median alone is insufficient to evaluate particle dispersion, as it only represents the particle-size distribution. A comprehensive assessment combining PSA, ZPA, and SEM analyses demonstrates that the 10% formulation provides the most effective and practically uniform dispersion in the cured composite.
(2) Consequences for mechanical properties. Mechanical data (Table 1) show maximum tensile strength and Young's modulus for the 10% sample (52.4 MPa, 3.3 GPa) with reduced strength at 5% and 15% loadings. This behaviour is consistent with the PSA/SEM picture: at 5% there is insufficient particulate reinforcement (fewer load-bearing TiO2 contacts), while at 15% the larger median and higher incidence of agglomerates (PSA tail to larger sizes, SEM clusters) create stress-concentration sites and interfacial voids that lower effective stress transfer. In other words, the particle size distribution controls the effective interfacial area and homogeneity of the filler network. Moderate, well-distributed particles (the 10% sample's PSA + SEM signature) maximize interfacial bonding and efficient load transfer; broad distributions and agglomerates (15%) reduce strength by acting as defects.
(3) Impact on photocatalytic response. Photocatalytic activity depends on accessible TiO2 surface area, the crystallographic phase (anatase vs. rutile), and light-harvesting efficiency. Smaller primary particles provide larger specific surface area per mass and usually higher activity, but agglomeration reduces accessible surface area and increases recombination centers. The PSA and SEM indicate that although nominal nanopowder APS was < 100 nm, effective hydrodynamic diameters in the suspensions and within the cured matrix are in the 200−350 nm range because of association/adsorption onto nanocellulose and formation of small clusters. Therefore: (1) the 10% composite with the smallest median and fewer large tails will expose more evenly distributed active TiO2 surface to incident light and to reactants, supporting better photocatalytic performance; (2) the 15% composite, despite higher nominal loading, likely shows reduced effective photocatalytic efficiency because agglomerates obscure inner surfaces and cause light-scattering losses and charge recombination within clusters.
Energy Dispersive X-ray spectroscopy
EDX for NC-TiO2-5%
-
The Energy Dispersive X-ray (EDX) microanalysis is a technique of elemental analysis associated with electron microscopy based on the generation of characteristic X-rays that reveals the presence of elements in the specimens. The EDX microanalysis is used in different biomedical fields by many researchers and clinicians. The spectrum of EDX microanalysis contains both semi-qualitative and semi-quantitative information. The EDX technique is made useful in the study of drugs, such as in the study of drug delivery, in which the EDX is an important tool to detect nanoparticles (generally used to improve the therapeutic performance of some chemotherapeutic agents). The EDX analysis included an SEM image, an EDX spectrum, and quantitative results for the nanocellulose-5%-TiO2 composite. The SEM image, taken at a 200 µm scale, revealed a rough, porous surface typical of nanocellulose matrices. Figure 8 shows prominent peaks at 0.277 keV and 0.525 keV, corresponding to carbon (C) and oxygen (O), respectively. These elements are the primary constituents of nanocellulose, a polysaccharide composed of β-1,4-linked glucose units. The quantitative results indicated a composition of approximately 75% C and 25% O by weight, totaling 100%. Notably, no titanium (Ti) peak was detected at the expected energy of 4.508 keV (Ti Kα), and Ti was absent from the quantitative results.
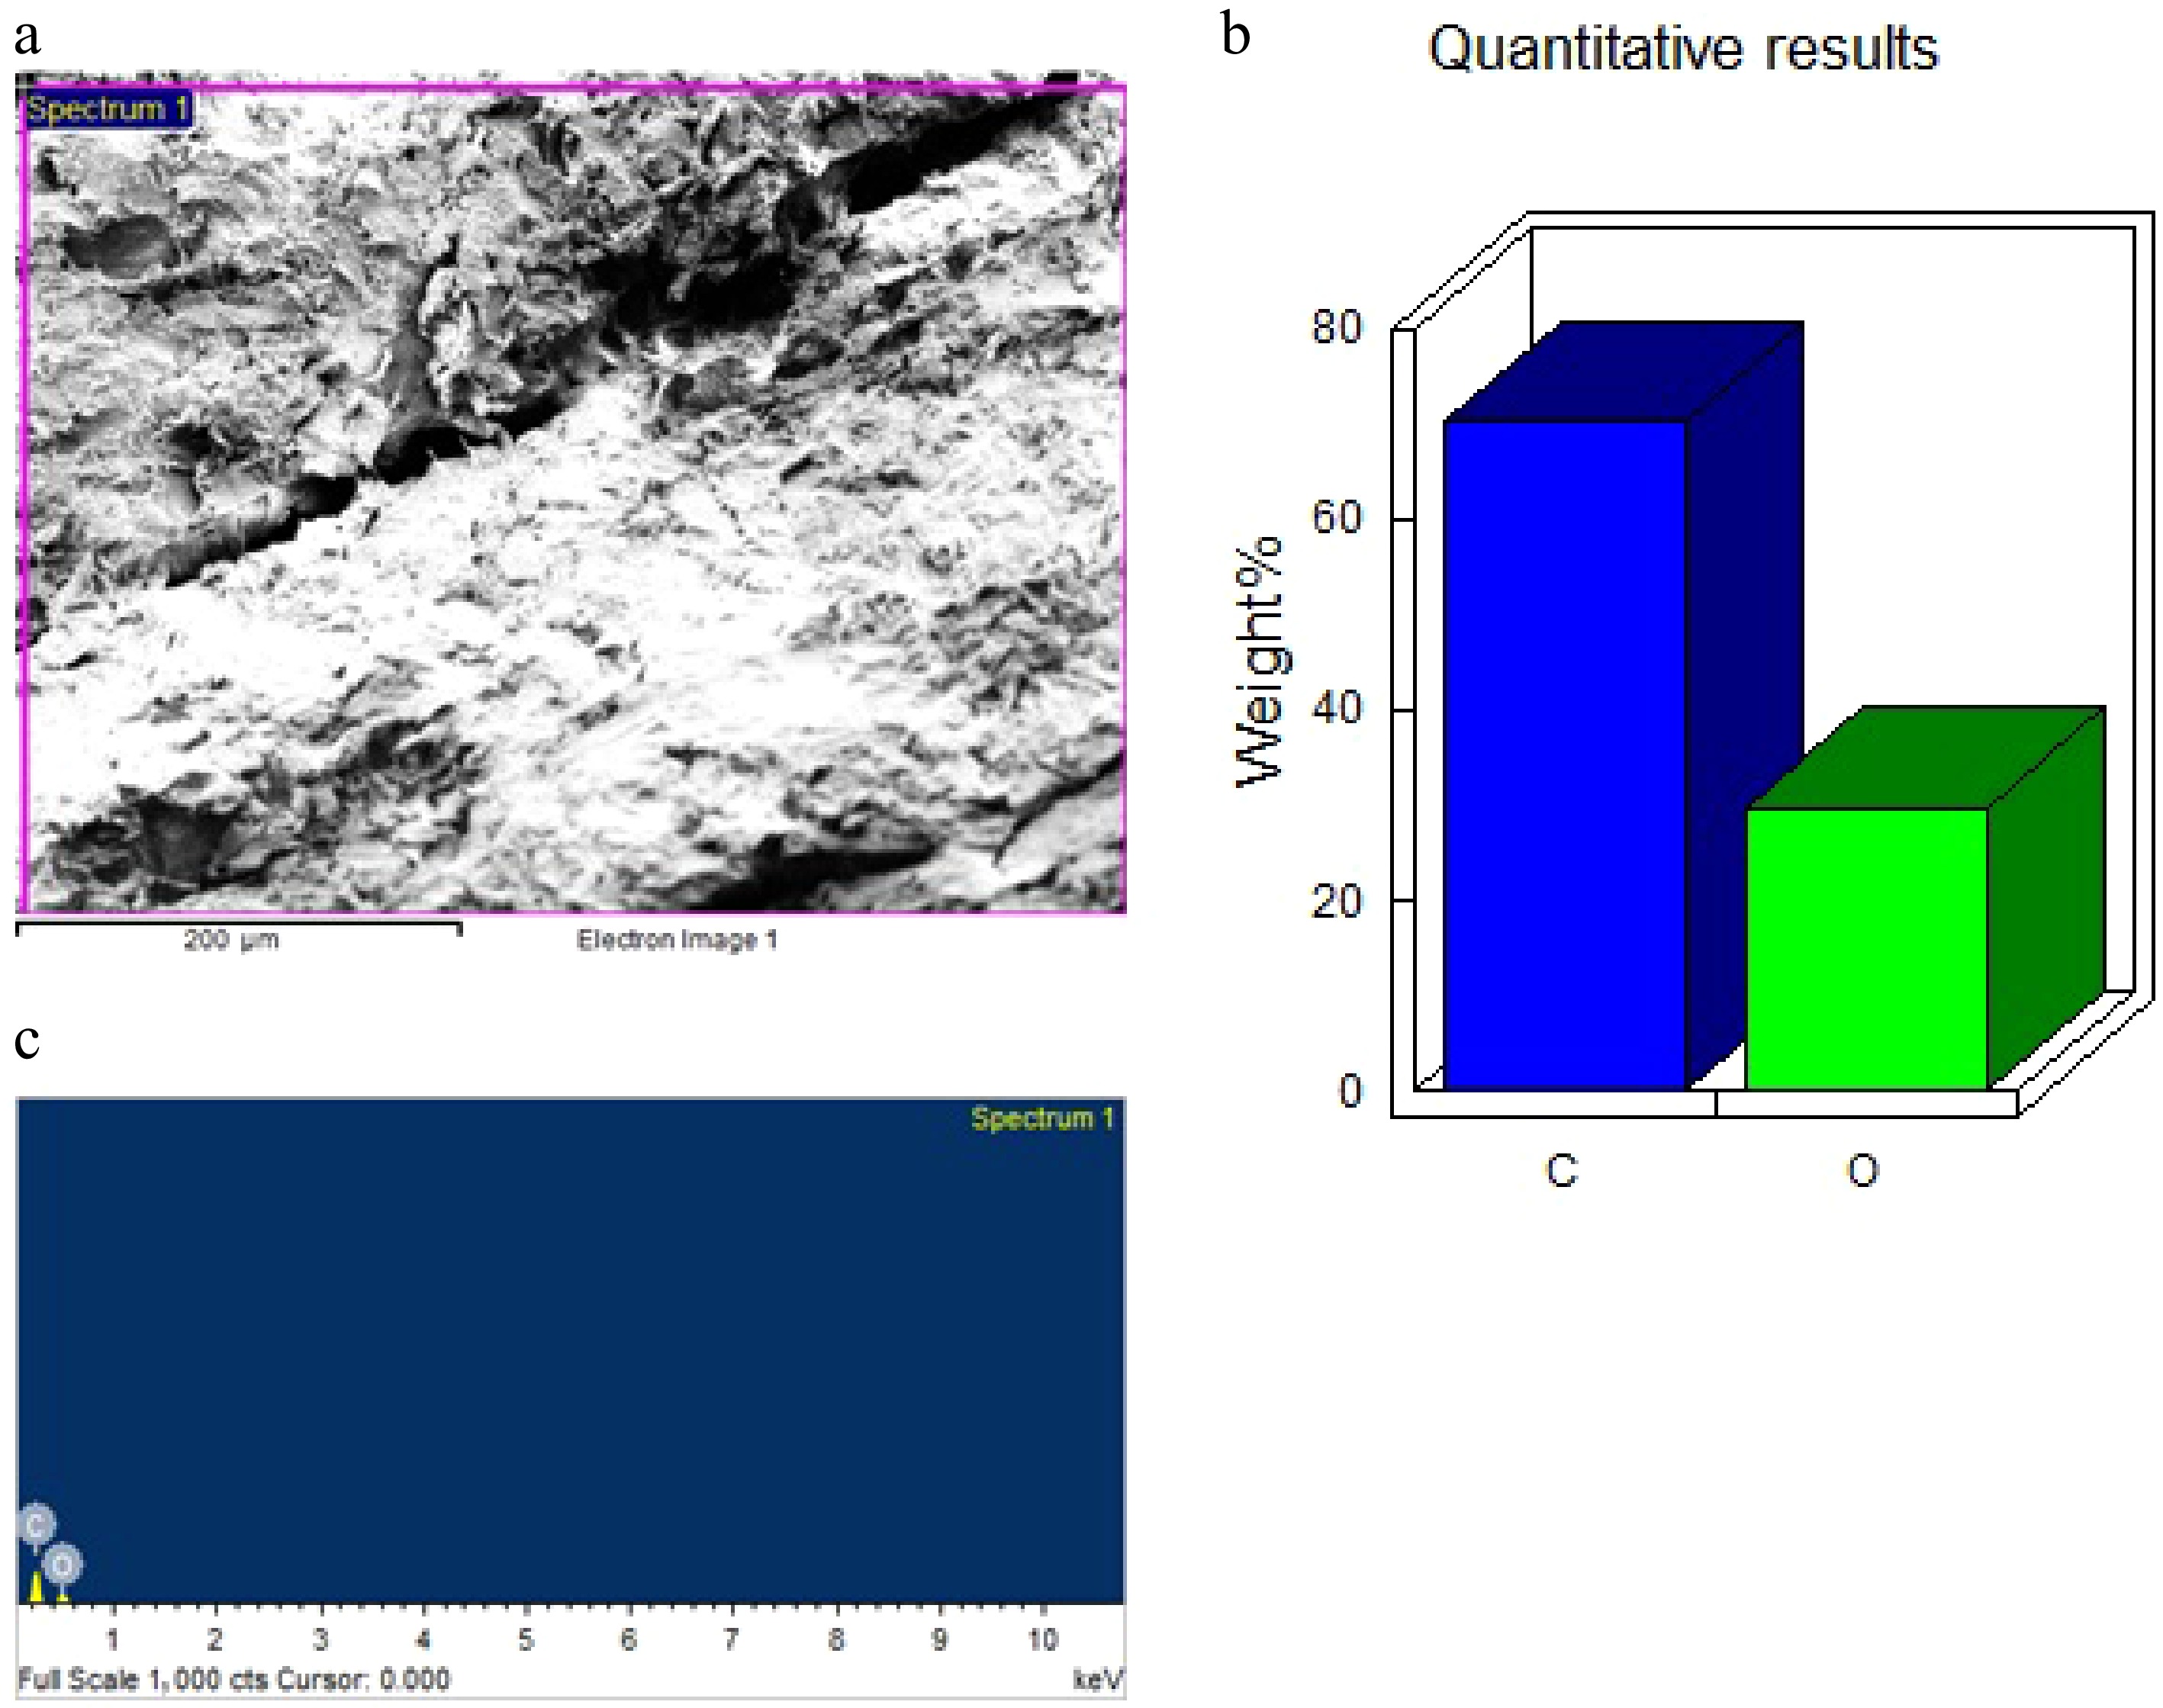
Figure 8.
EDX spectra of the NC-TiO2-5% composite. (a) SEM image of surface morphology. (b) EDS quantitative elemental composition (wt%). (c) Corresponding EDS spectrum.
This absence suggests that TiO2 was not present in the specific area analyzed. The lack of Ti detection could be attributed to several factors. First, the 5% TiO2 loading is relatively low; the sampled area may not have contained sufficient Ti for detection, and finally, the sensitivity of the EDX system or the presence of a thick nanocellulose layer over the TiO2 particles could have obscured the Ti signal.
The EDX analysis of the nanocellulose-5%-TiO2 composite revealed a composition of 75% C and 25% O, with no detectable Ti, suggesting uneven TiO2 dispersion despite the expected 5% loading. The high C and O content verifies the nanocellulose matrix's integrity, suitable for its inherent properties.
EDX for NC-TiO2-10%
-
The EDX analysis included an SEM image, an EDX spectrum, and quantitative results for the nanocellulose-10%-TiO2 composite. The SEM image, taken at a 100 µm scale, revealed a fibrous, porous surface characteristic of nanocellulose matrices. The structure appeared irregular, with no distinct TiO2 particles visible at this magnification, suggesting either good integration of the nanoparticles or particle sizes below the resolution limit of the SEM image. The EDX spectrum, Fig. 9, showed prominent peaks at 0.277 and 0.525 keV, corresponding to carbon (C) and oxygen (O), respectively. These elements are the primary constituents of nanocellulose, a polysaccharide composed of β-1,4-linked glucose units. The quantitative results indicated a composition of approximately 75% C and 25% O by weight, totaling 100%. Notably, no titanium (Ti) peak was detected at the expected energy of 4.508 keV (Ti Kα), and Ti was absent from the quantitative results. This absence suggests that TiO2 was not present in the specific area analyzed or was below the detection limit of the EDX system. The lack of Ti detection could be attributed to several factors.
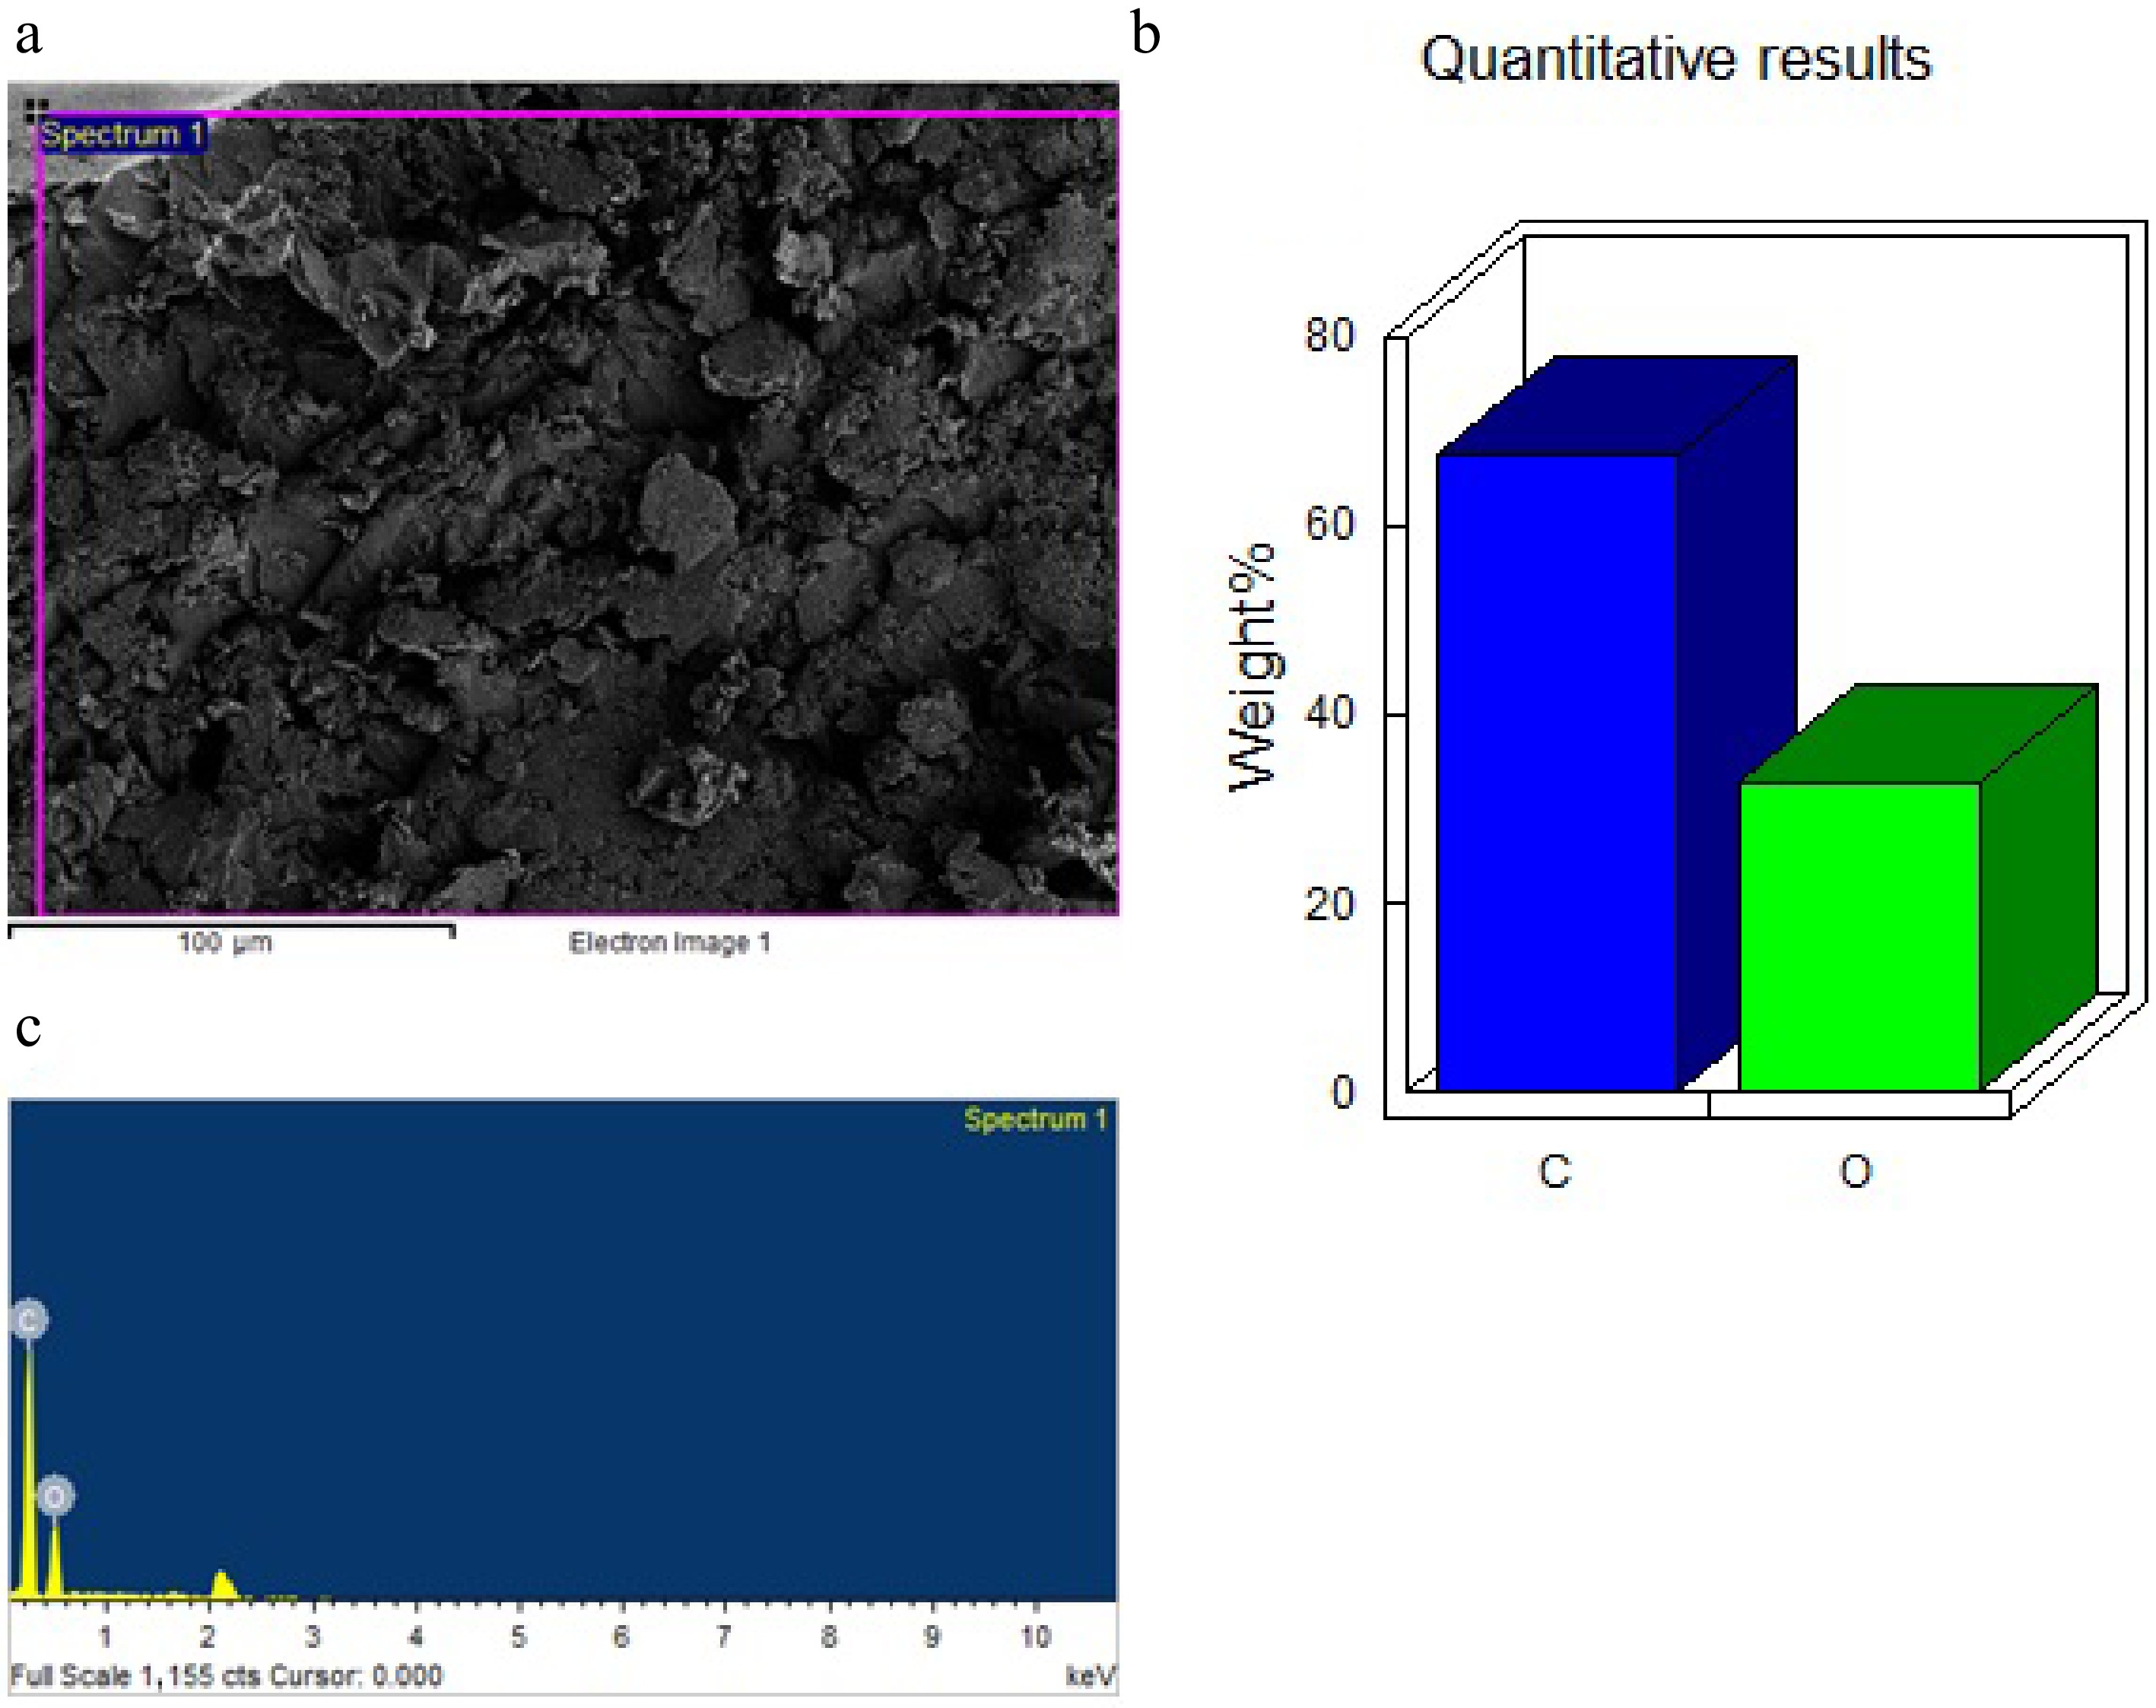
Figure 9.
EDX spectra of the NC-TiO2-10% composite. (a) SEM image of surface morphology. (b) EDS quantitative elemental composition (wt%). (c) Corresponding EDS spectrum.
The EDX analysis of the nanocellulose-10%-TiO2 composite showed 75% C and 25% O, with no detectable Ti, indicating uneven TiO2 dispersion despite the expected 10% loading. This suggests potential issues with TiO2 distribution, critical for applications like photocatalysis, UV protection, and antibacterial coatings, where TiO2's photocatalytic activity is essential for generating reactive oxygen species. The SEM confirmed the nanocellulose matrix's fibrous, porous structure, and its high C and O content supports biocompatibility for biomedical uses like scaffolds or drug delivery.
EDX for NC-TiO2-15%
-
The EDX analysis included an SEM image, an EDX spectrum, and quantitative results for the nanocellulose-15%-TiO2 composite. The SEM image, taken at a 60 µm scale, revealed a fibrous, porous surface characteristic of nanocellulose matrices. The structure appeared irregular, with no distinct TiO2 particles visible at this magnification, suggesting either good integration of the nanoparticles or particle sizes below the resolution limit of the SEM image.
The EDX spectrum, Fig. 10 showed prominent peaks at 0.277 and 0.525 keV, corresponding to carbon (C) and oxygen (O), respectively. These elements are the primary constituents of nanocellulose, a polysaccharide composed of β-1,4-linked glucose units. The quantitative results indicated a composition of approximately 55% C and 45% O by weight, totaling 100%. Notably, no titanium (Ti) peak was detected at the expected energy of 4.508 keV (Ti Kα), and Ti was absent from the quantitative results. This absence suggests that TiO2 was not present in the specific area analyzed or was below the detection limit of the EDX system.
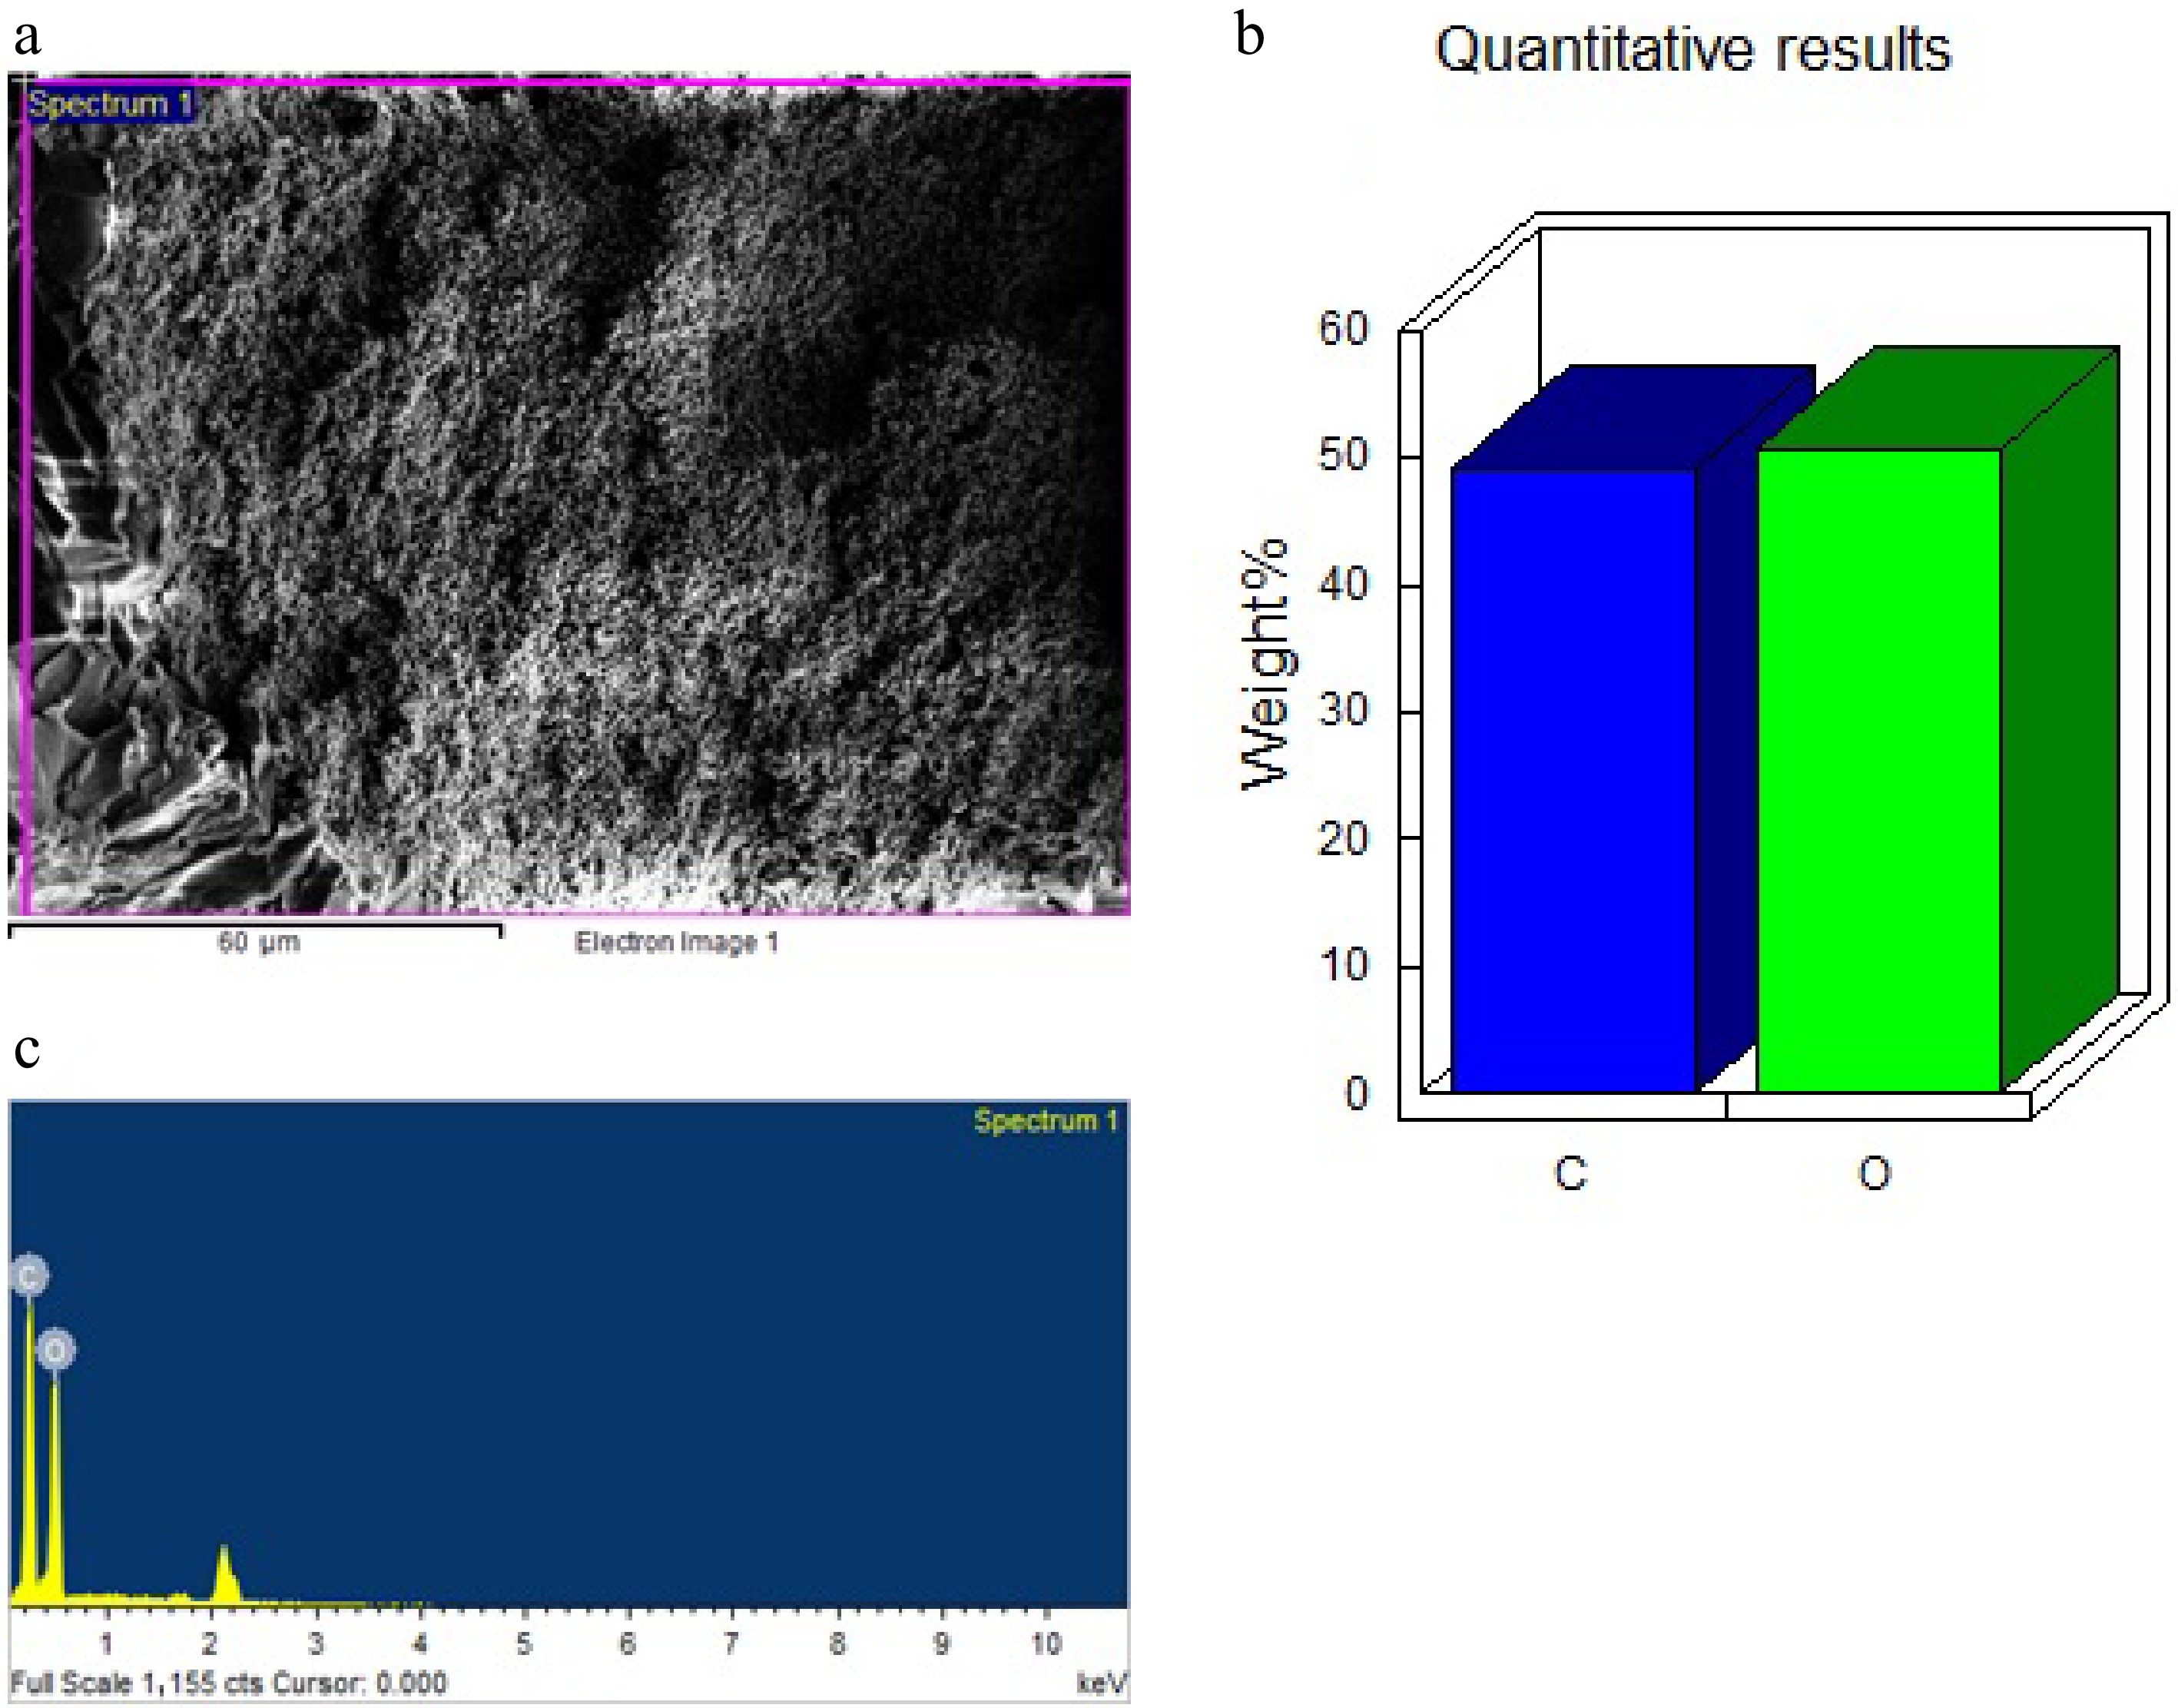
Figure 10.
EDX spectra of the NC-TiO2-15% composite. (a) SEM image of surface morphology. (b) EDS quantitative elemental composition (wt%). (c) Corresponding EDS spectrum.
The lack of Ti detection could be attributed to several factors. First, despite the 15% TiO2 loading, the sampled area (as indicated by the 'Spectrum 1' label) may not have contained sufficient Ti for detection, possibly due to uneven dispersion or agglomeration of TiO2 in other regions of the sample. Second, the sensitivity of the EDX system or the presence of a thick nanocellulose layer over the TiO2 particles could have obscured the Ti signal.
The absence of prominent Ti peaks can be attributed to several technical and material-related factors. First, EDX detects elements within a limited near-surface interaction volume (typically ~1–2 µm, depending on accelerating voltage). If TiO2 particles are embedded beneath an epoxy-rich surface layer, their signal may be significantly attenuated due to limited penetration depth. Second, at moderate TiO2 loadings (5% and 10%), improved dispersion and effective encapsulation within the polymer matrix can reduce direct surface exposure of TiO2 particles, resulting in weak Ti peaks despite their confirmed presence in the composite. Third, EDX is inherently semi-quantitative and has reduced sensitivity for elements present at low atomic percentages, particularly when surrounded by a strong carbon and oxygen background from the epoxy nanocellulose matrix, which can further mask the Ti signal. Additionally, we have included a statement recommending advanced characterization techniques such as elemental mapping or TEM-EDS for more sensitive and spatially resolved confirmation of nanoscale Ti distribution. These revisions provide a clearer explanation of the observed EDX limitations and strengthen the scientific interpretation of the results.
Differential Scanning Calorimetry (DSC)
-
Figure 11 shows the DSC graph for NC-TiO2-5%. The Differential Scanning Calorimetry (DSC) measures energy changes in materials during heating or cooling, revealing thermal events like melting or crystallization through heat flow graphs. Sample and reference pans are heated in a precise oven, tracking extra heat needed to match temperatures, showing endothermic dips or exothermic peaks.
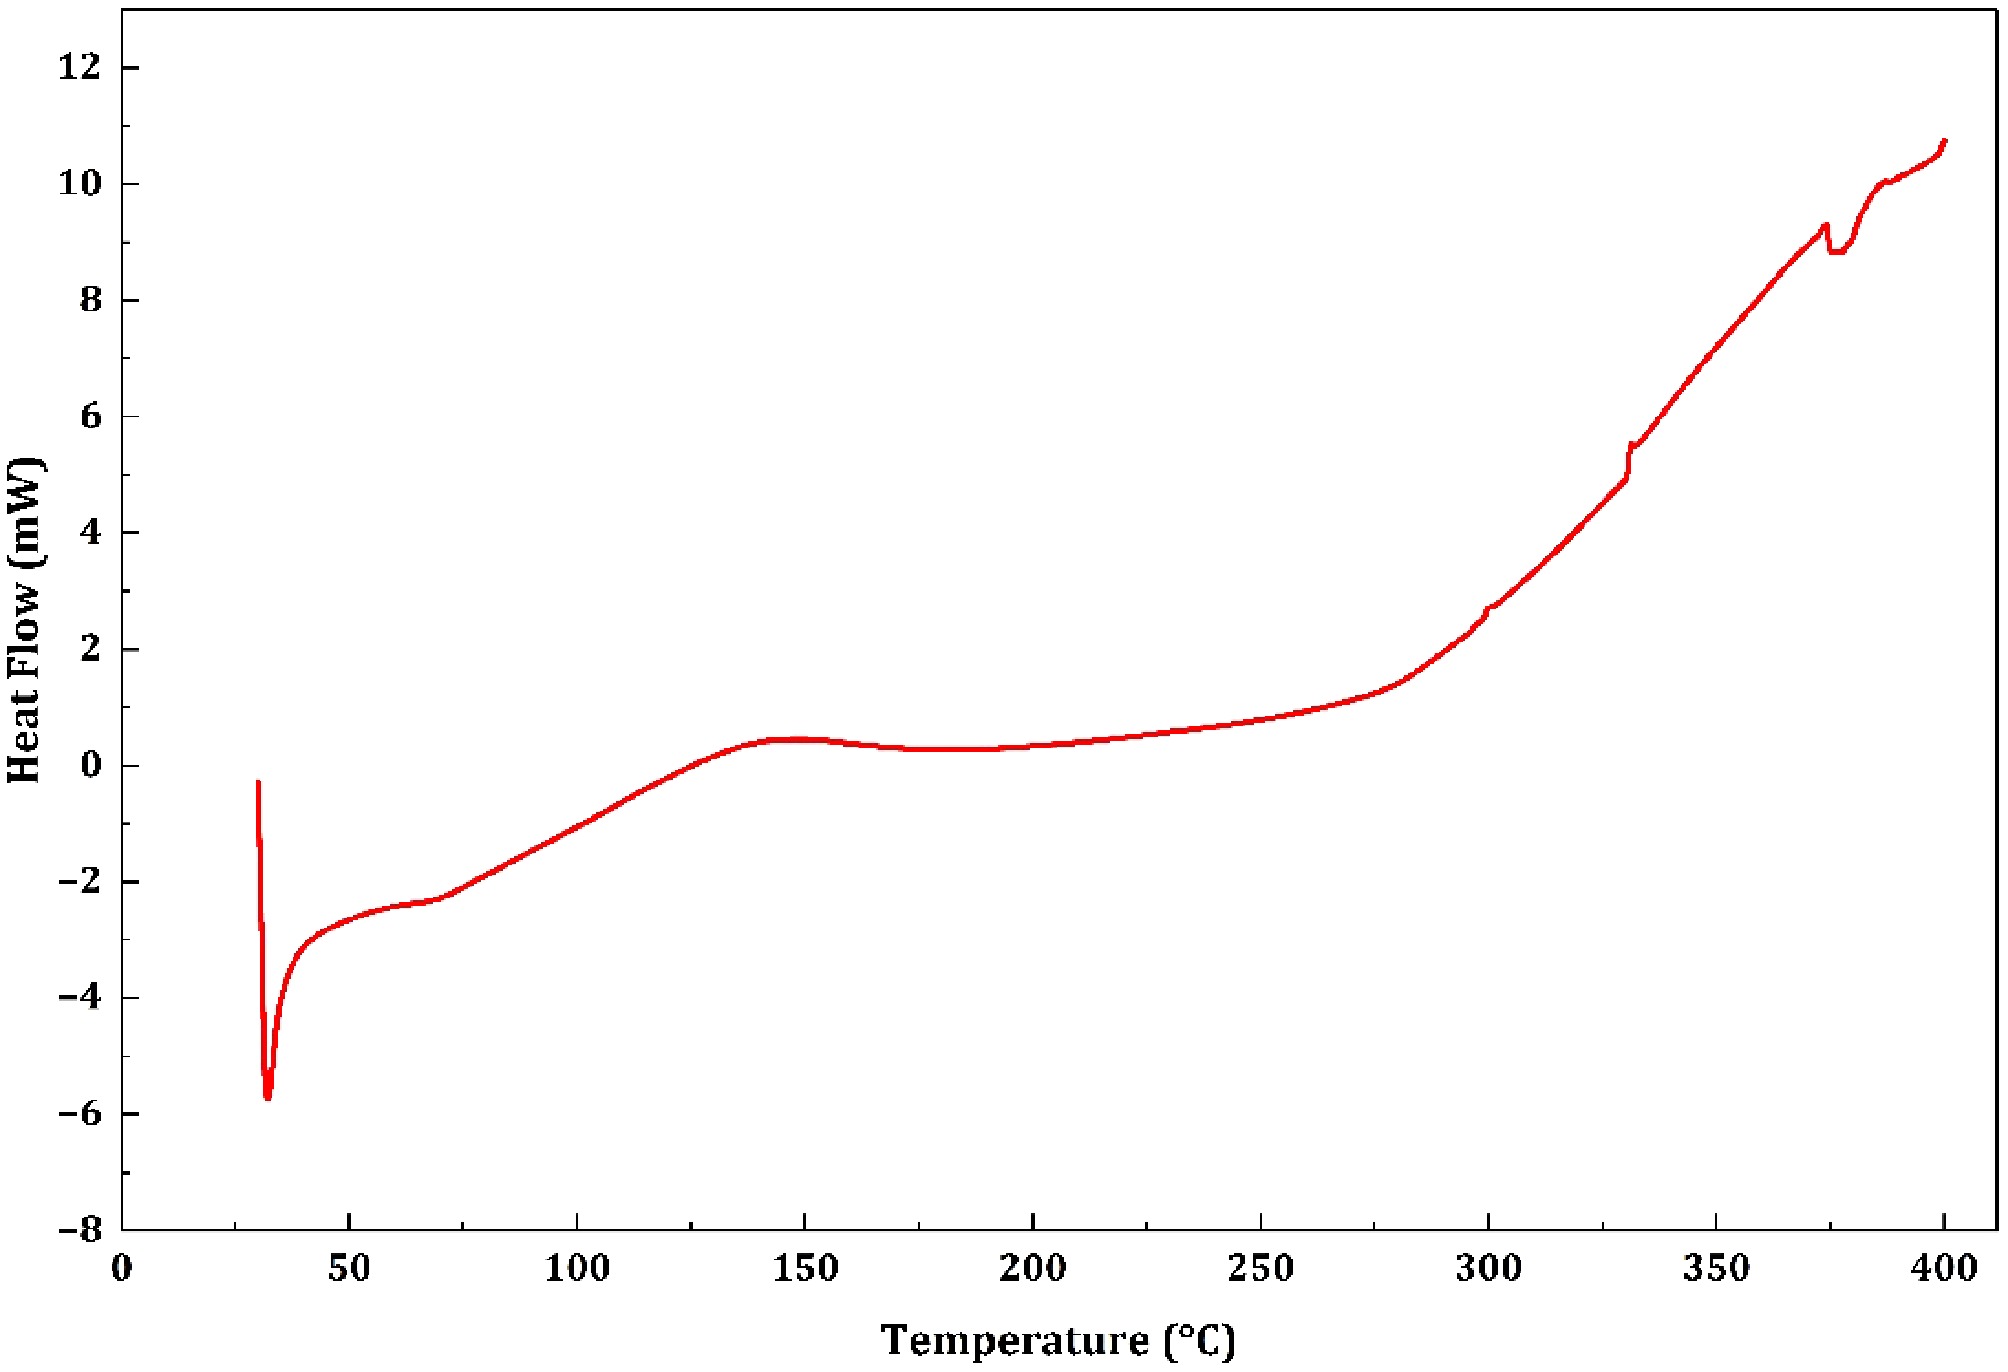
Figure 11.
DSC of NC-TiO2-5%.
DSC analysis of NC-TiO2-5% composite
-
The differential scanning calorimetry (DSC) analysis of the nanocellulose (NC) with 5% titanium dioxide (TiO2) composite highlights two critical thermal events, providing insights into its suitability for various applications. From 40 °C to 98.42 °C, an endothermic peak was observed at 71.26 °C with an onset temperature of 44.75 °C and an endset temperature of 98.42 °C. This thermal behavior indicates that the material remains suitable for applications that leverage its inherent properties.
DSC analysis of NC-TiO2-10% composite
-
Figure 12 illustrates the graph of DSC for NC-TiO2-10%. It reveals two significant thermal events critical for understanding its behavior in applications. From 40 °C to 210.14 °C, an endothermic peak at 148.45 °C (onset 77.06 °C, endset 210.14 °C, integral 281.67 mJ, normalized 102.43 Jg−1) indicates evaporation of moisture or volatiles trapped in the nanocellulose's porous structure. This peak, higher than water's typical 100 °C boiling point, suggests strong binding, possibly due to TiO2 interactions or additional volatiles, requiring more energy to evaporate. Compared to the NC-TiO2-5% composite (peak at 71.26 °C, integral −17.03 mJ, normalized −6.08 Jg−1), the 10% composite retains volatiles more tightly, likely due to increased TiO2 or processing differences, which could affect stability in coatings or films if not pre-dried. From 200 to 380 °C, a sharp exothermic rise reflects nanocellulose decomposition, releasing energy as the cellulose matrix breaks down into gases and char, with the process incomplete at 380 °C. This decomposition onset (~200 °C) aligns with the 5% composite, indicating nanocellulose's dominant role, with TiO2 minimally altering thermal stability. The higher energy involved (102.43 Jg−1 vs. −6.08 Jg−1) suggests more volatiles or TiO2-influenced energy transfer. This limits its use in high-temperature applications like electronics or packaging, as degradation begins around 200 °C.
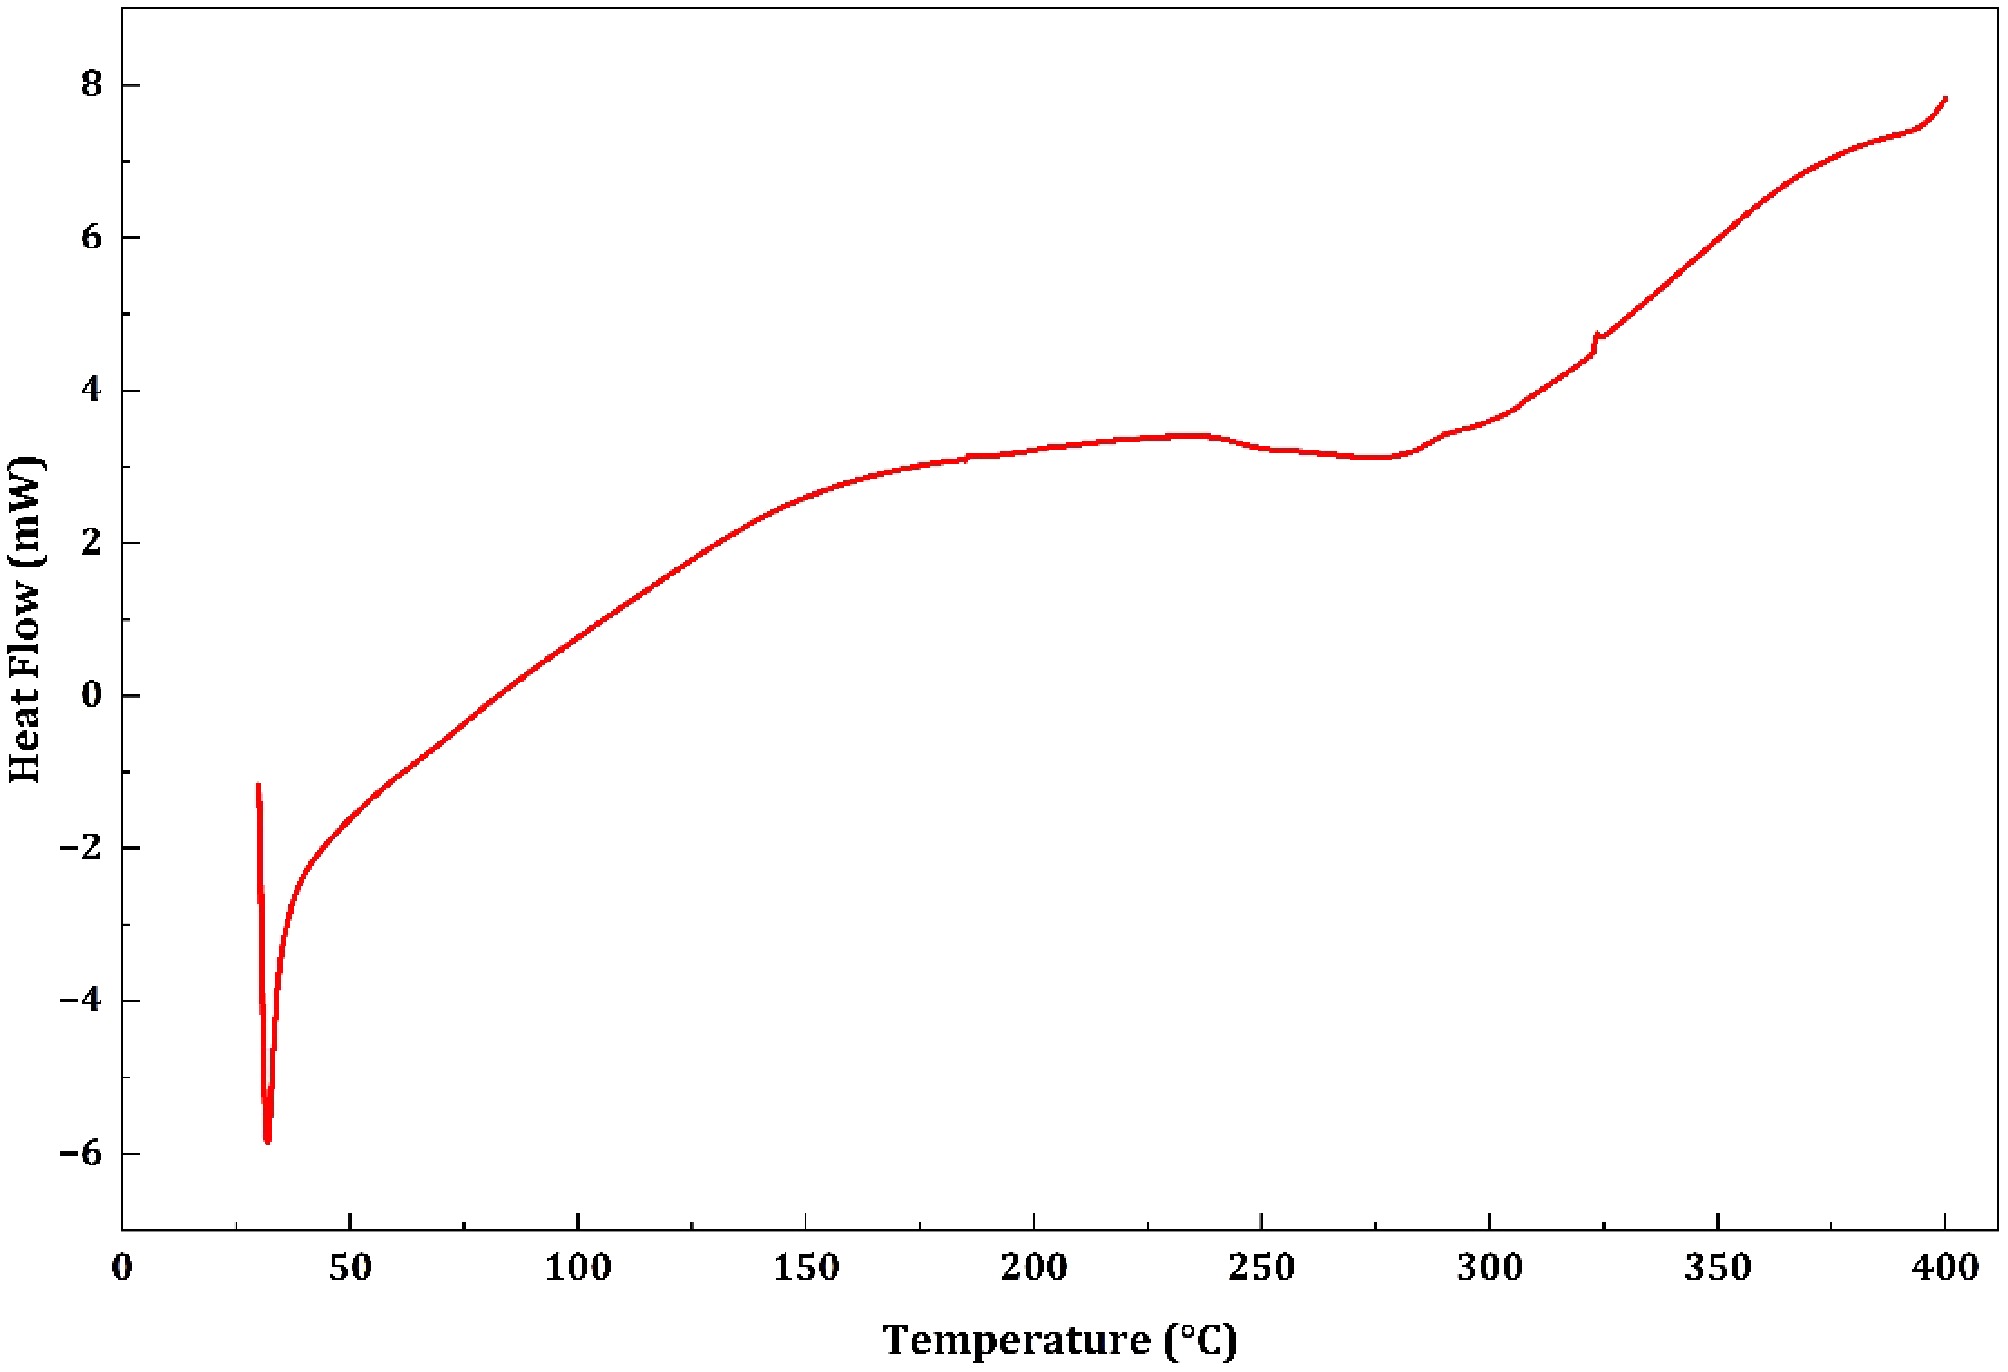
Figure 12.
DSC of NC-TiO2-10%.
DSC for NC-TiO2-15%
-
Figure 13 illustrates the DSC graph of NC-TiO2-15%. It reveals critical thermal behavior across two distinct events. From 40 to 205.43 °C, an endothermic peak at 131.14 °C (onset 54.80 °C, endset 205.43 °C, integral 263.63 mJ, normalized 107.60 Jg−1) indicates evaporation of moisture or volatiles trapped within the nanocellulose's porous structure. The peak's shift beyond water's typical 100 °C boiling point suggests strong binding, possibly due to TiO2 interactions or additional volatile components, requiring higher energy for release. This moisture content could compromise stability in applications like coatings or films, necessitating pre-drying to ensure performance in packaging or biomedical contexts. From 200 to 380 °C, a sharp exothermic rise reflects the onset of nanocellulose decomposition, releasing energy as the cellulose matrix breaks down into gases and char, with the process incomplete at 380 °C. The lack of a defined peak suggests continued degradation beyond the tested range. This decomposition onset at ~200 °C indicates limited thermal stability, making the composite unsuitable for high-temperature applications like electronics or automotive parts without modifications. Compared to prior analyses, the higher volatile loss temperature (131.14 °C vs. 71.26 °C for NC-TiO2-10%) and significant energy (107.60 Jg−1) suggest structural or compositional differences, possibly from increased TiO2 or processing variations. The DSC thermograms of the composites revealed three primary thermal events. The first endothermic region between 70−120 °C corresponds solely to moisture evaporation, which is characteristic of cellulose-based materials and not indicative of matrix filler bonding. A second endothermic transition observed between 180–220 °C reflects the onset of thermal degradation of nanocellulose. This behavior aligns with literature reporting decomposition of nanocellulose near 200 °C, influenced slightly by inorganic fillers. Slight shifts in the onset temperature for the 10% TiO2 composite suggest a stabilizing effect attributed to reduced heat transfer and localized thermal shielding by TiO2 nanoparticles. The relatively higher endothermic enthalpy observed during moisture loss can be attributed to several contributing factors. Primarily, the hydrophilic nature of cellulose nanocrystals (CNCs), characterized by abundant surface hydroxyl groups, promotes strong hydrogen bonding with water molecules. This results in the presence of bound moisture that requires greater energy for removal compared to free or loosely held water. Additionally, moisture may be retained at the CNC-epoxy interface due to strong polar interactions between the filler and matrix, further increasing the energy required for dehydration. Furthermore, minor overlapping thermal events, such as polymer chain relaxation or interfacial rearrangement occurring within the same temperature range, may contribute to the integrated endothermic peak, thereby slightly elevating the overall enthalpy value.
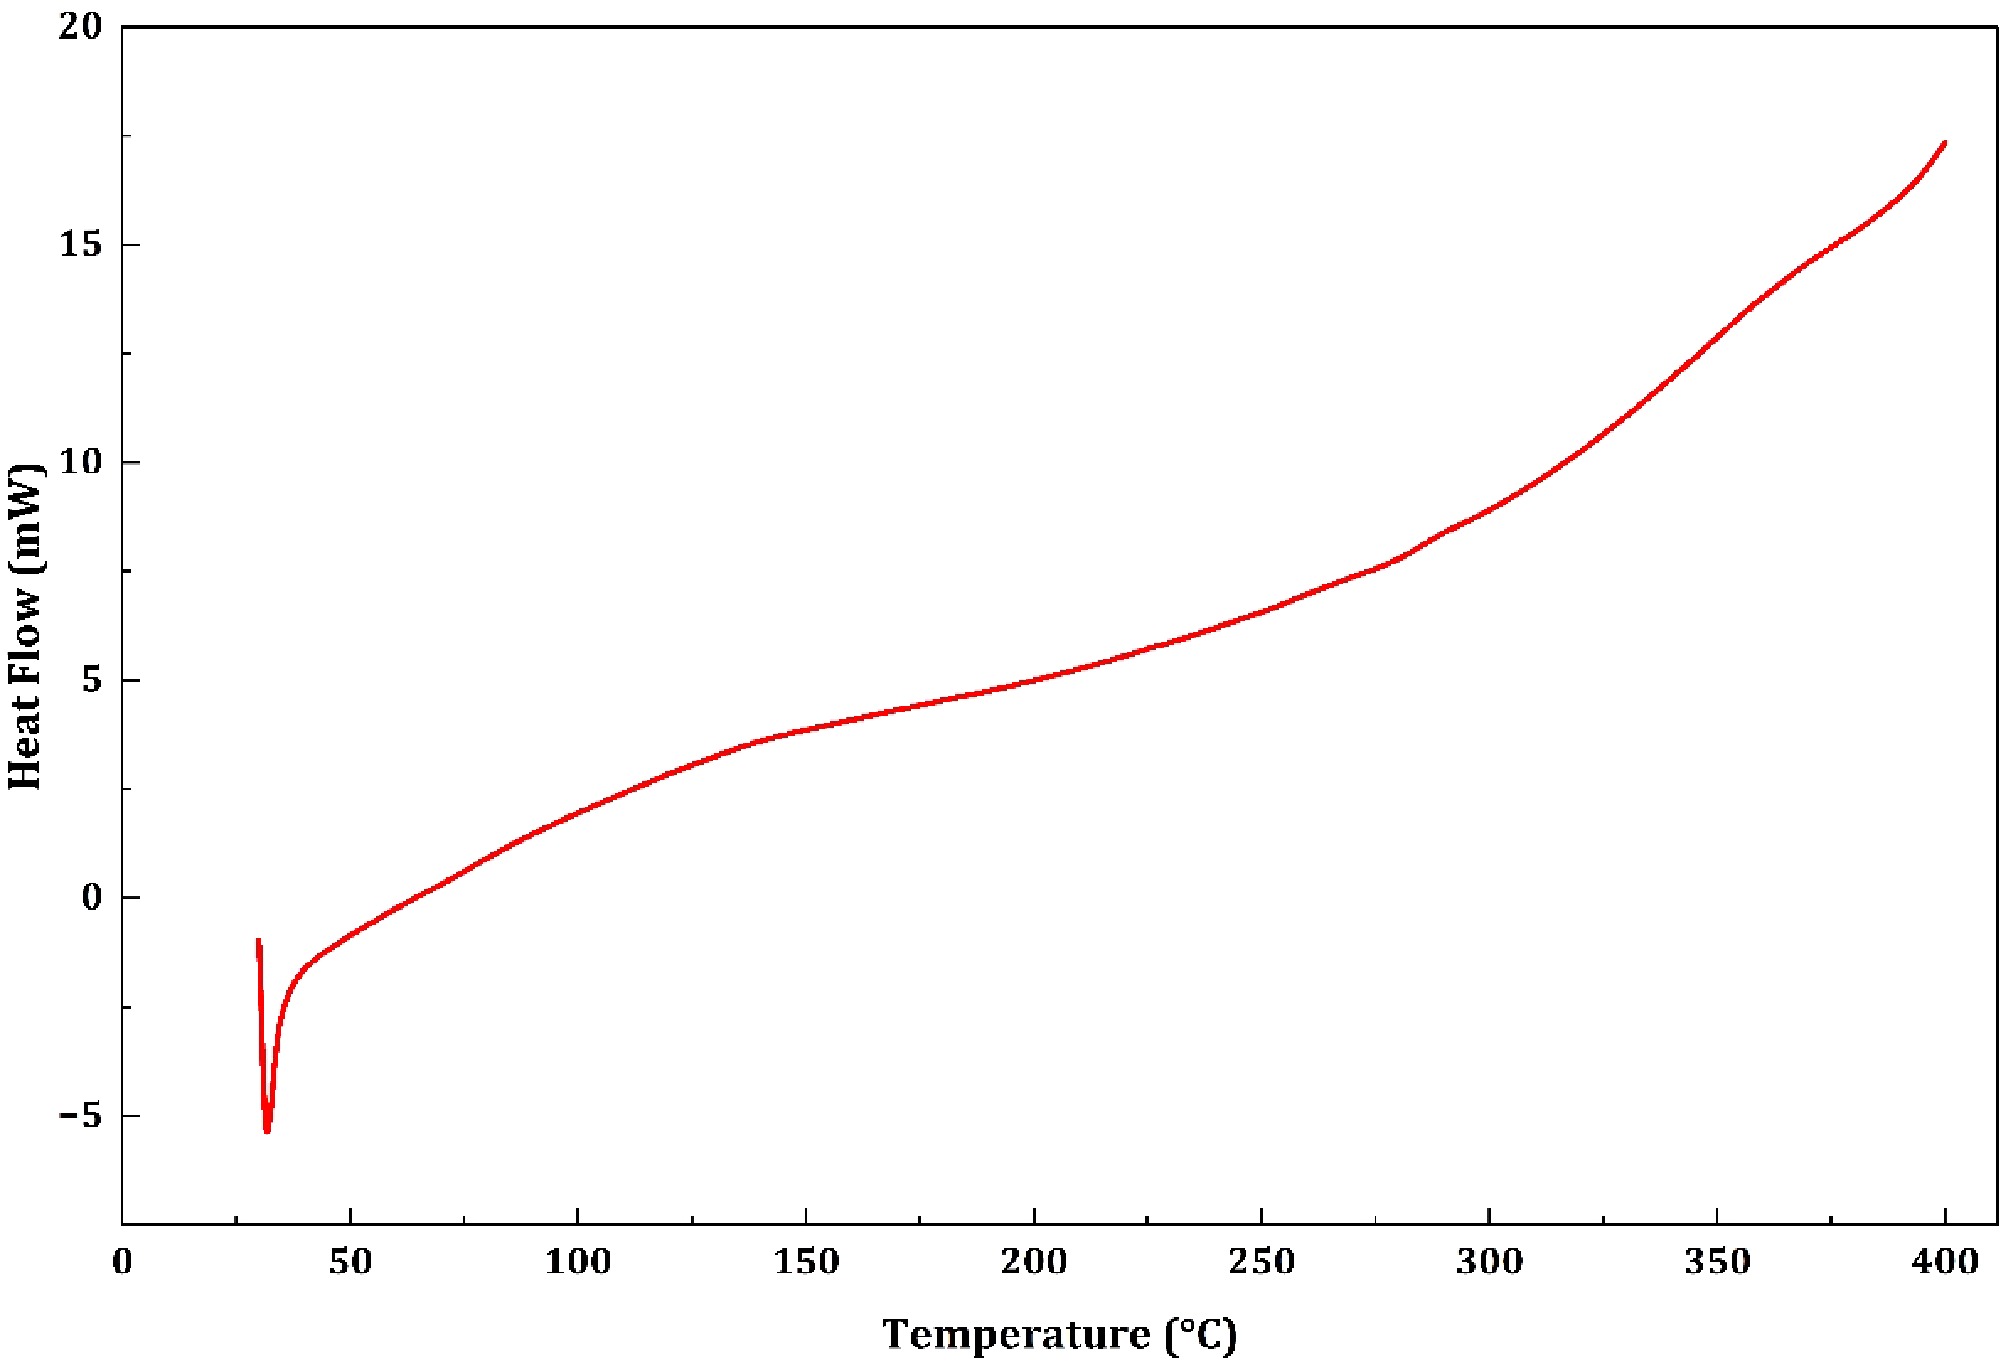
Figure 13.
DSC of NC-TiO2-15%.
Zeta Potential Analyzer (ZPA)
-
A Zeta Potential Analyzer (ZPA) is a specialized tool that scientists use to figure out how charged particles behave when they're floating in a liquid, like water or a chemical solution. The ZPA measures this charge, called the zeta potential, by applying a small electric field and watching how the particles move toward one side.
ZPA for NC-TiO2-5%
-
Zeta potential analysis of NC-TiO2-5% particles in an aqueous medium (25 °C, viscosity 0.895 mPa·s, conductivity 0.209 mS/cm, 3.4 V applied) revealed a mean zeta potential of −23.6 mV, indicating moderate colloidal stability with sufficient electrostatic repulsion to limit aggregation (Fig. 14). The electrophoretic distribution graph showed a unimodal, narrow bell-shaped curve with peak zeta potentials at −22, −24, and −26 mV, reflecting a uniform charge distribution and high particle homogeneity. This consistency suggests reliable particle behavior under the tested conditions, suitable for applications like coatings or drug delivery.
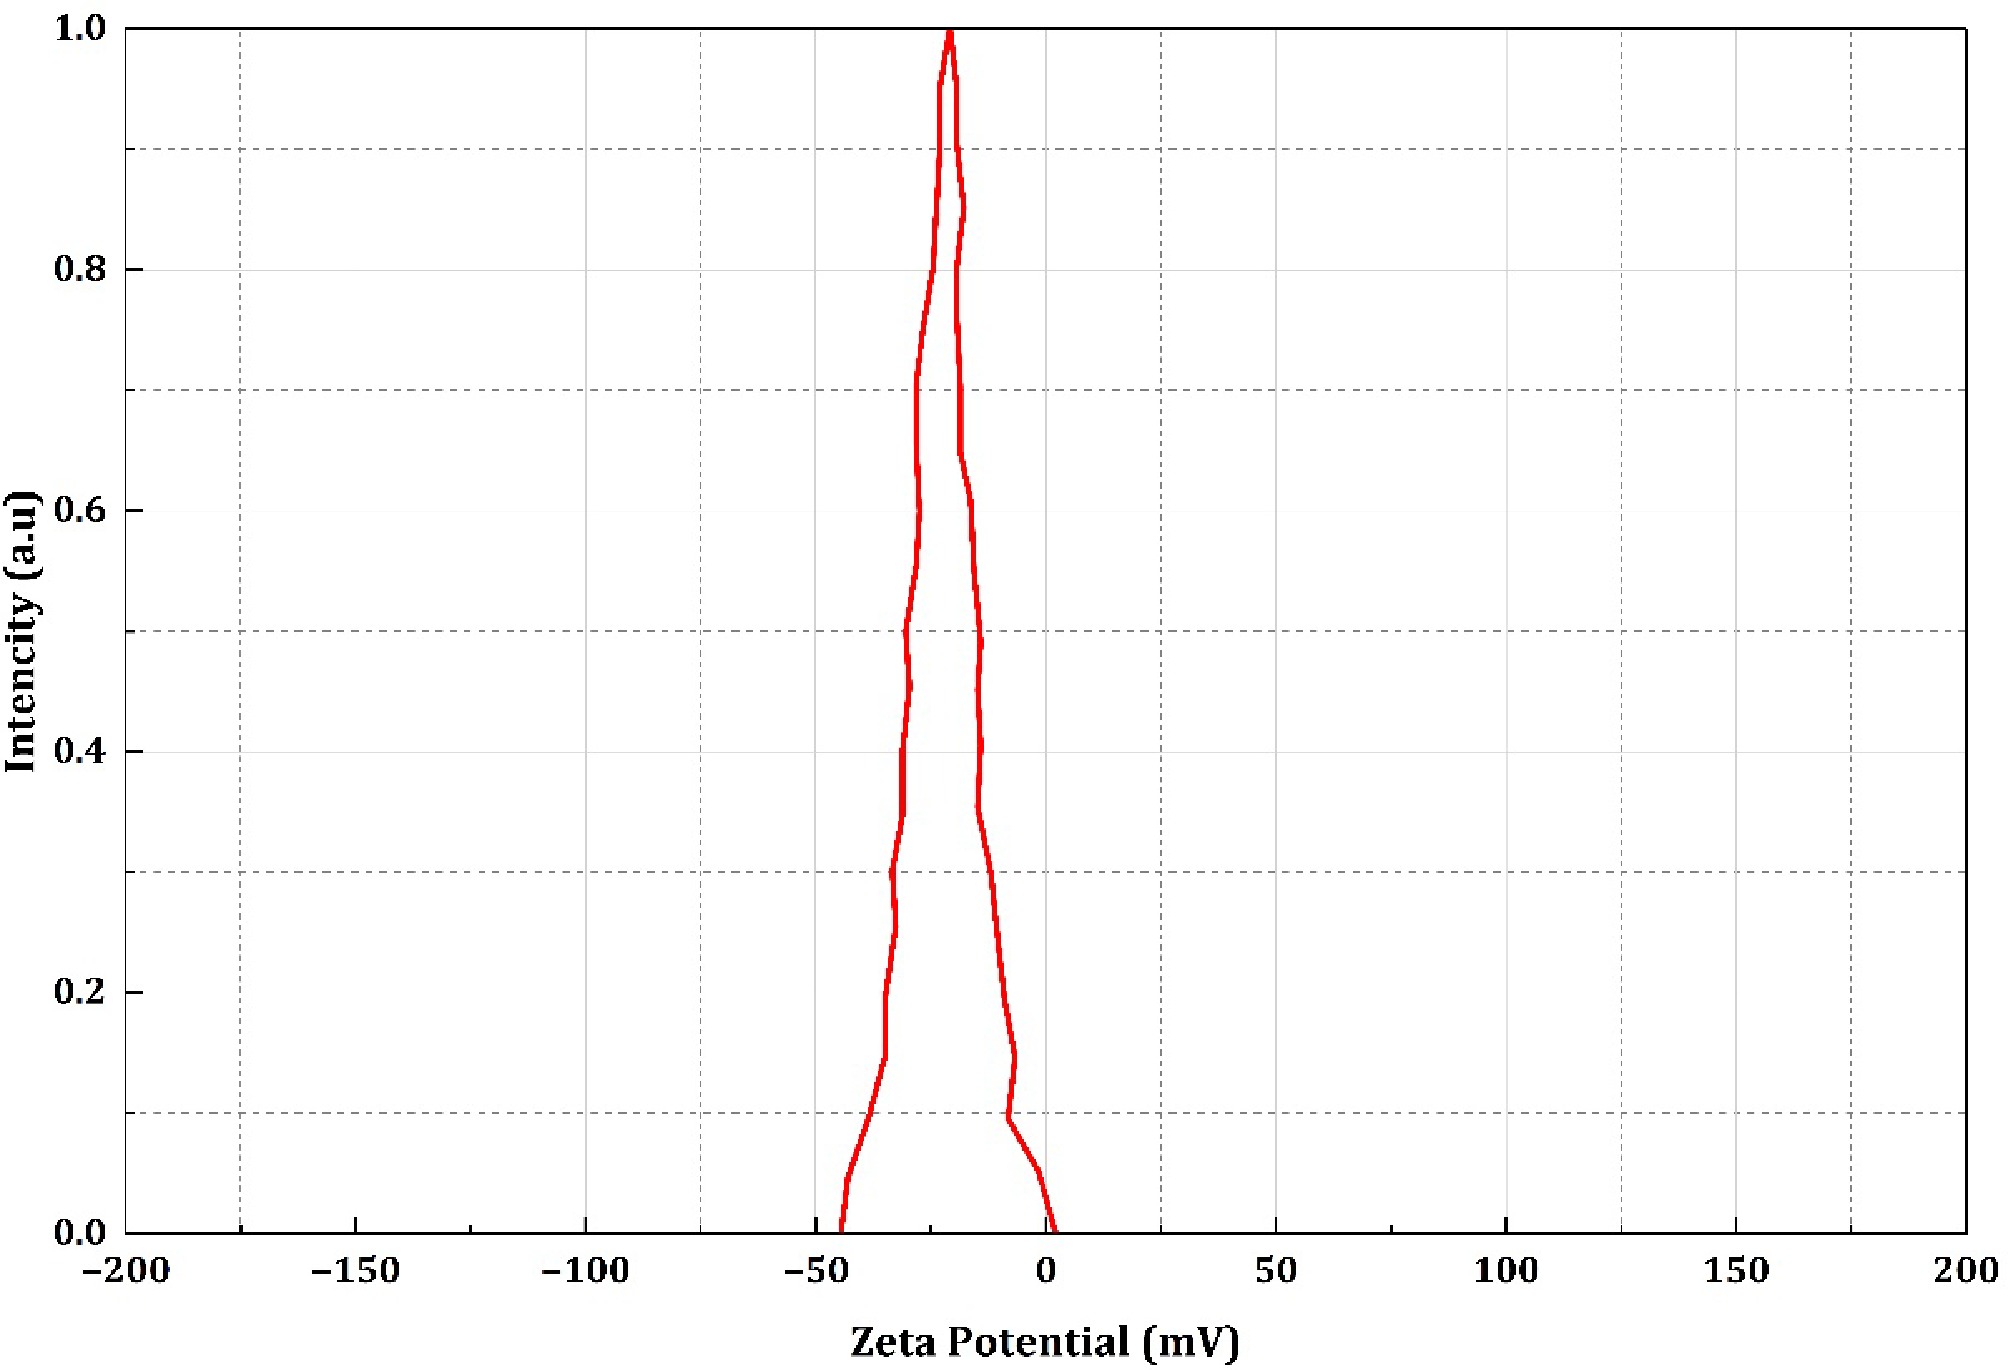
Figure 14.
ZPA of NC-TiO2-5%.
The mean electrophoretic mobility of −0.000182 cm2/V·s confirmed the negative surface charge, correlating with particle size and charge interactions (Fig. 13). The −23.6 mV zeta potential, within the −30 to +30 mV range, indicates stability but potential vulnerability to aggregation with changes in ionic strength, pH, or temperature. These findings highlight the need for controlled environmental conditions to maintain dispersion stability in practical applications.
ZPA for NC-TiO2-10%
-
Zeta potential analysis of NC-TiO2-10% particles in an aqueous medium (25 °C, viscosity 0.895 mPa·s, conductivity 0.209 mS/cm, 3.4 V applied) showed a mean zeta potential of −19.0 mV, indicating moderate colloidal stability with limited electrostatic repulsion (Fig. 15). The electrophoretic distribution displayed a sharp, unimodal peak at −19.0 mV, reflecting high particle charge uniformity compared to NC-TiO2-5% (−23.6 mV). This suggests consistent surface charge behavior, suitable for applications like coatings, despite a missing third peak potentially due to a reporting artifact.
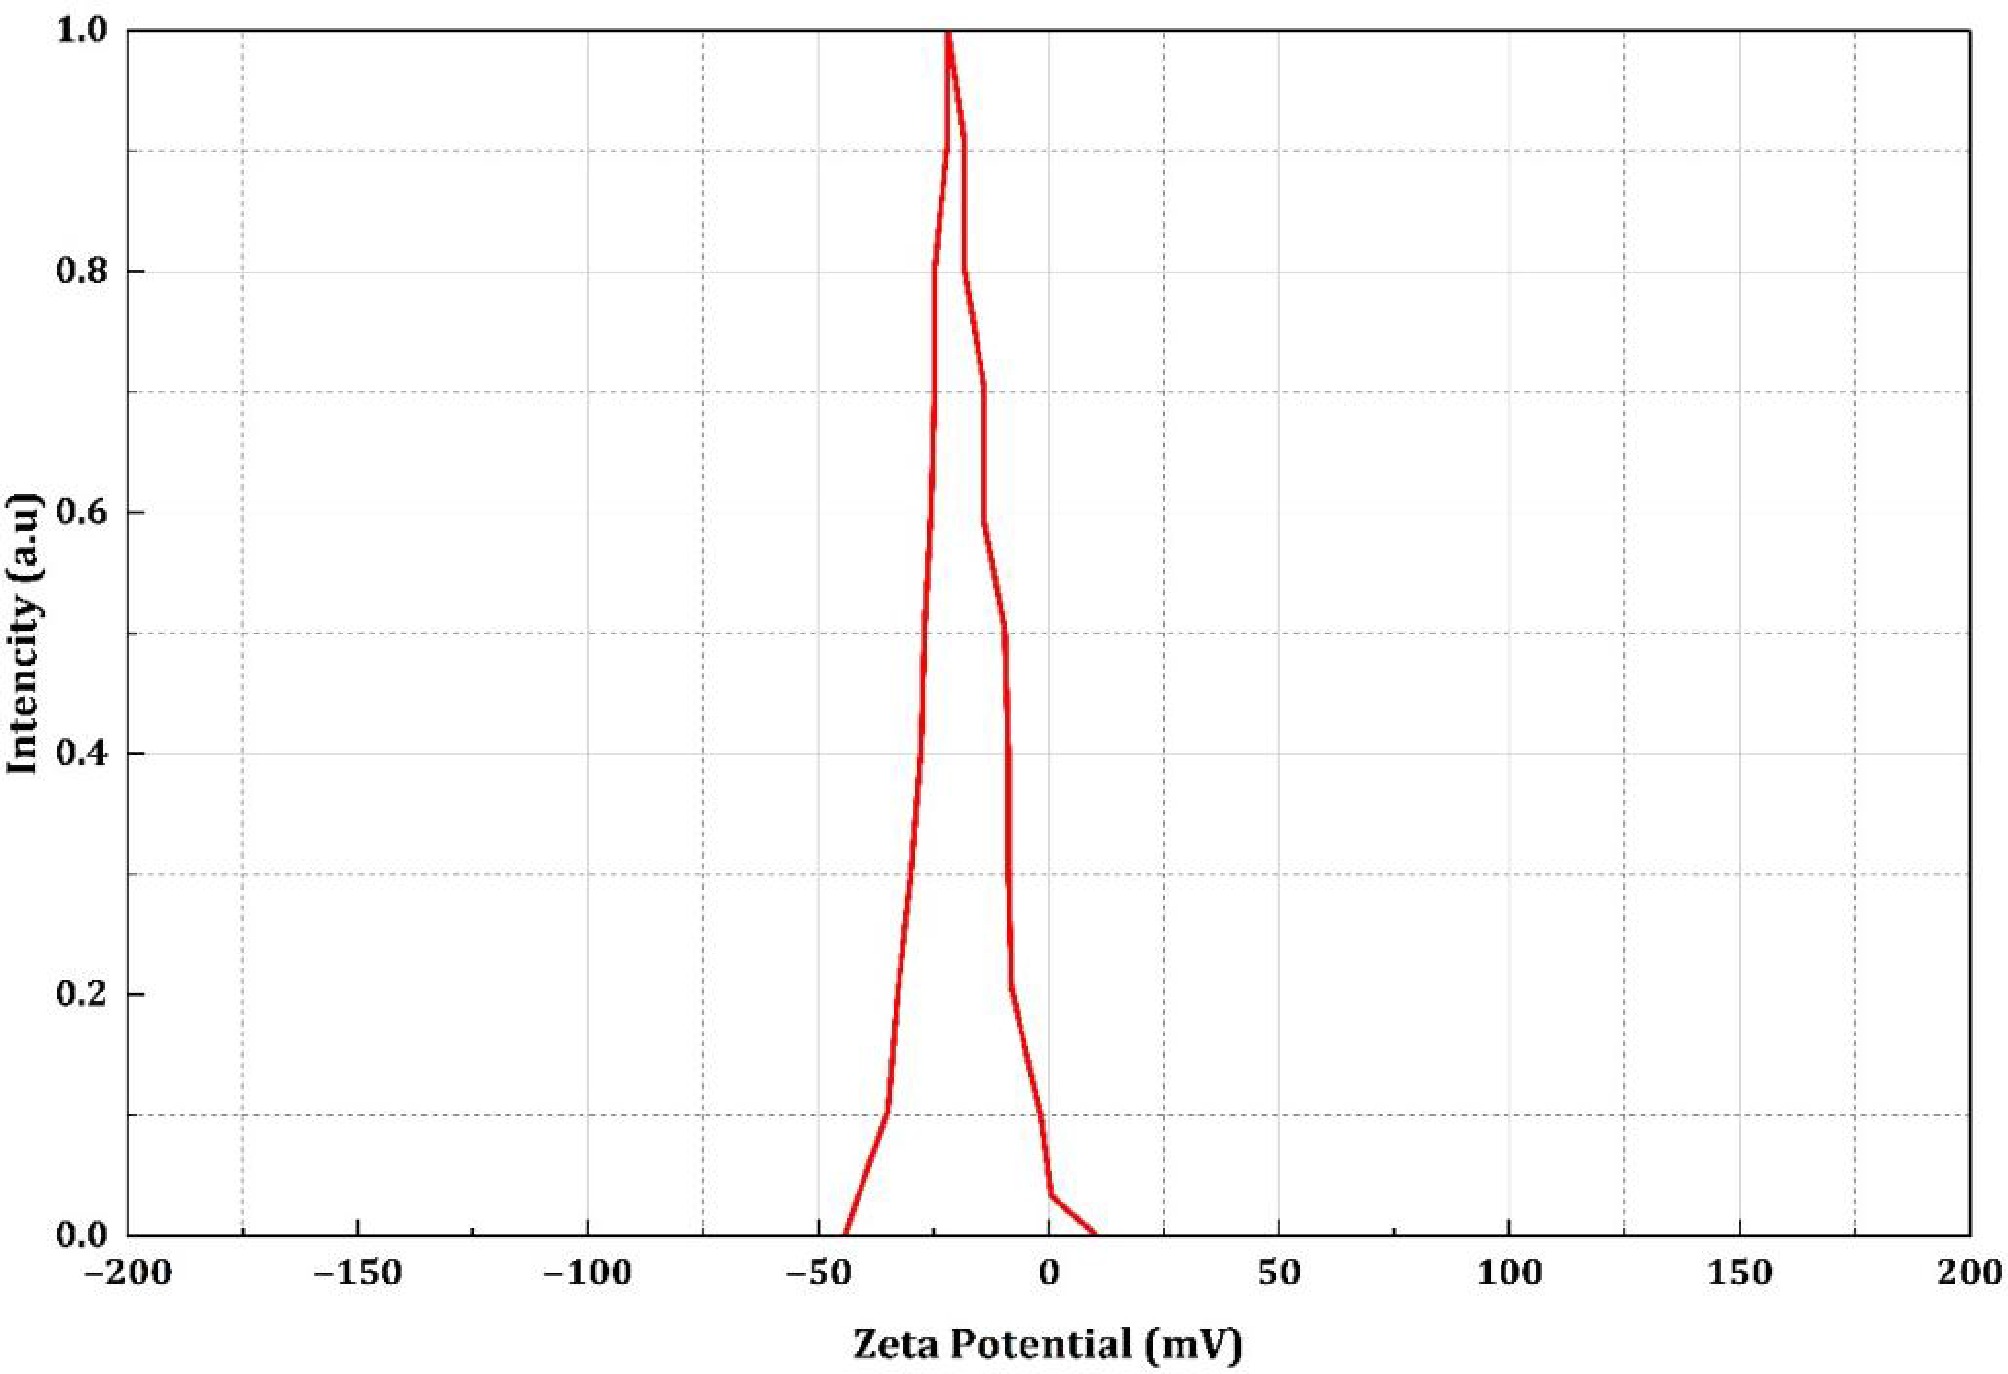
Figure 15.
ZPA of NC-TiO2-10%.
The mean electrophoretic mobility of −0.000147 cm2/V·s, lower than NC-TiO2-5% (−0.000182 cm2/V·s), indicates slower particle response in an electric field, likely due to size or morphology effects (Fig. 15). The −19.0 mV zeta potential, within the ±30 mV range, suggests moderate stability but higher susceptibility to aggregation under changes in pH, ionic strength, or temperature. This could impact performance in electrokinetic processes or drug delivery systems, necessitating environmental control.
ZPA for NC-TiO2-15%
-
Zeta potential analysis of NC-TiO2-15% particles in an aqueous medium (24.9 °C, viscosity 0.897 mPa·s, conductivity 0.209 mS/cm, 3.3 V applied) revealed a mean zeta potential of −27.0 mV, indicating strong colloidal stability with effective electrostatic repulsion (Fig. 16). The electrophoretic distribution showed a sharp, unimodal peak at −27.0 mV, reflecting exceptional charge uniformity compared to NC-TiO2-5% (−23.6 mV) and NC-TiO2-10% (−19.0 mV). This high homogeneity supports reliable performance in applications like pharmaceuticals and coatings. The mean electrophoretic mobility of −0.000208 cm2/V·s, higher than NC-TiO2-5% (−0.000182 cm2/V·s) and NC-TiO2-10% (−0.000147 cm2/V·s), indicates enhanced particle responsiveness to electric fields, consistent with the strong negative charge (Fig. 15). The −27.0 mV zeta potential, nearing the 30 mV threshold, minimizes aggregation risks, ideal for stable dispersions in nanomaterial delivery systems. This stability and electrokinetic activity enhance suitability for electrostatic applications requiring consistent particle behavior.
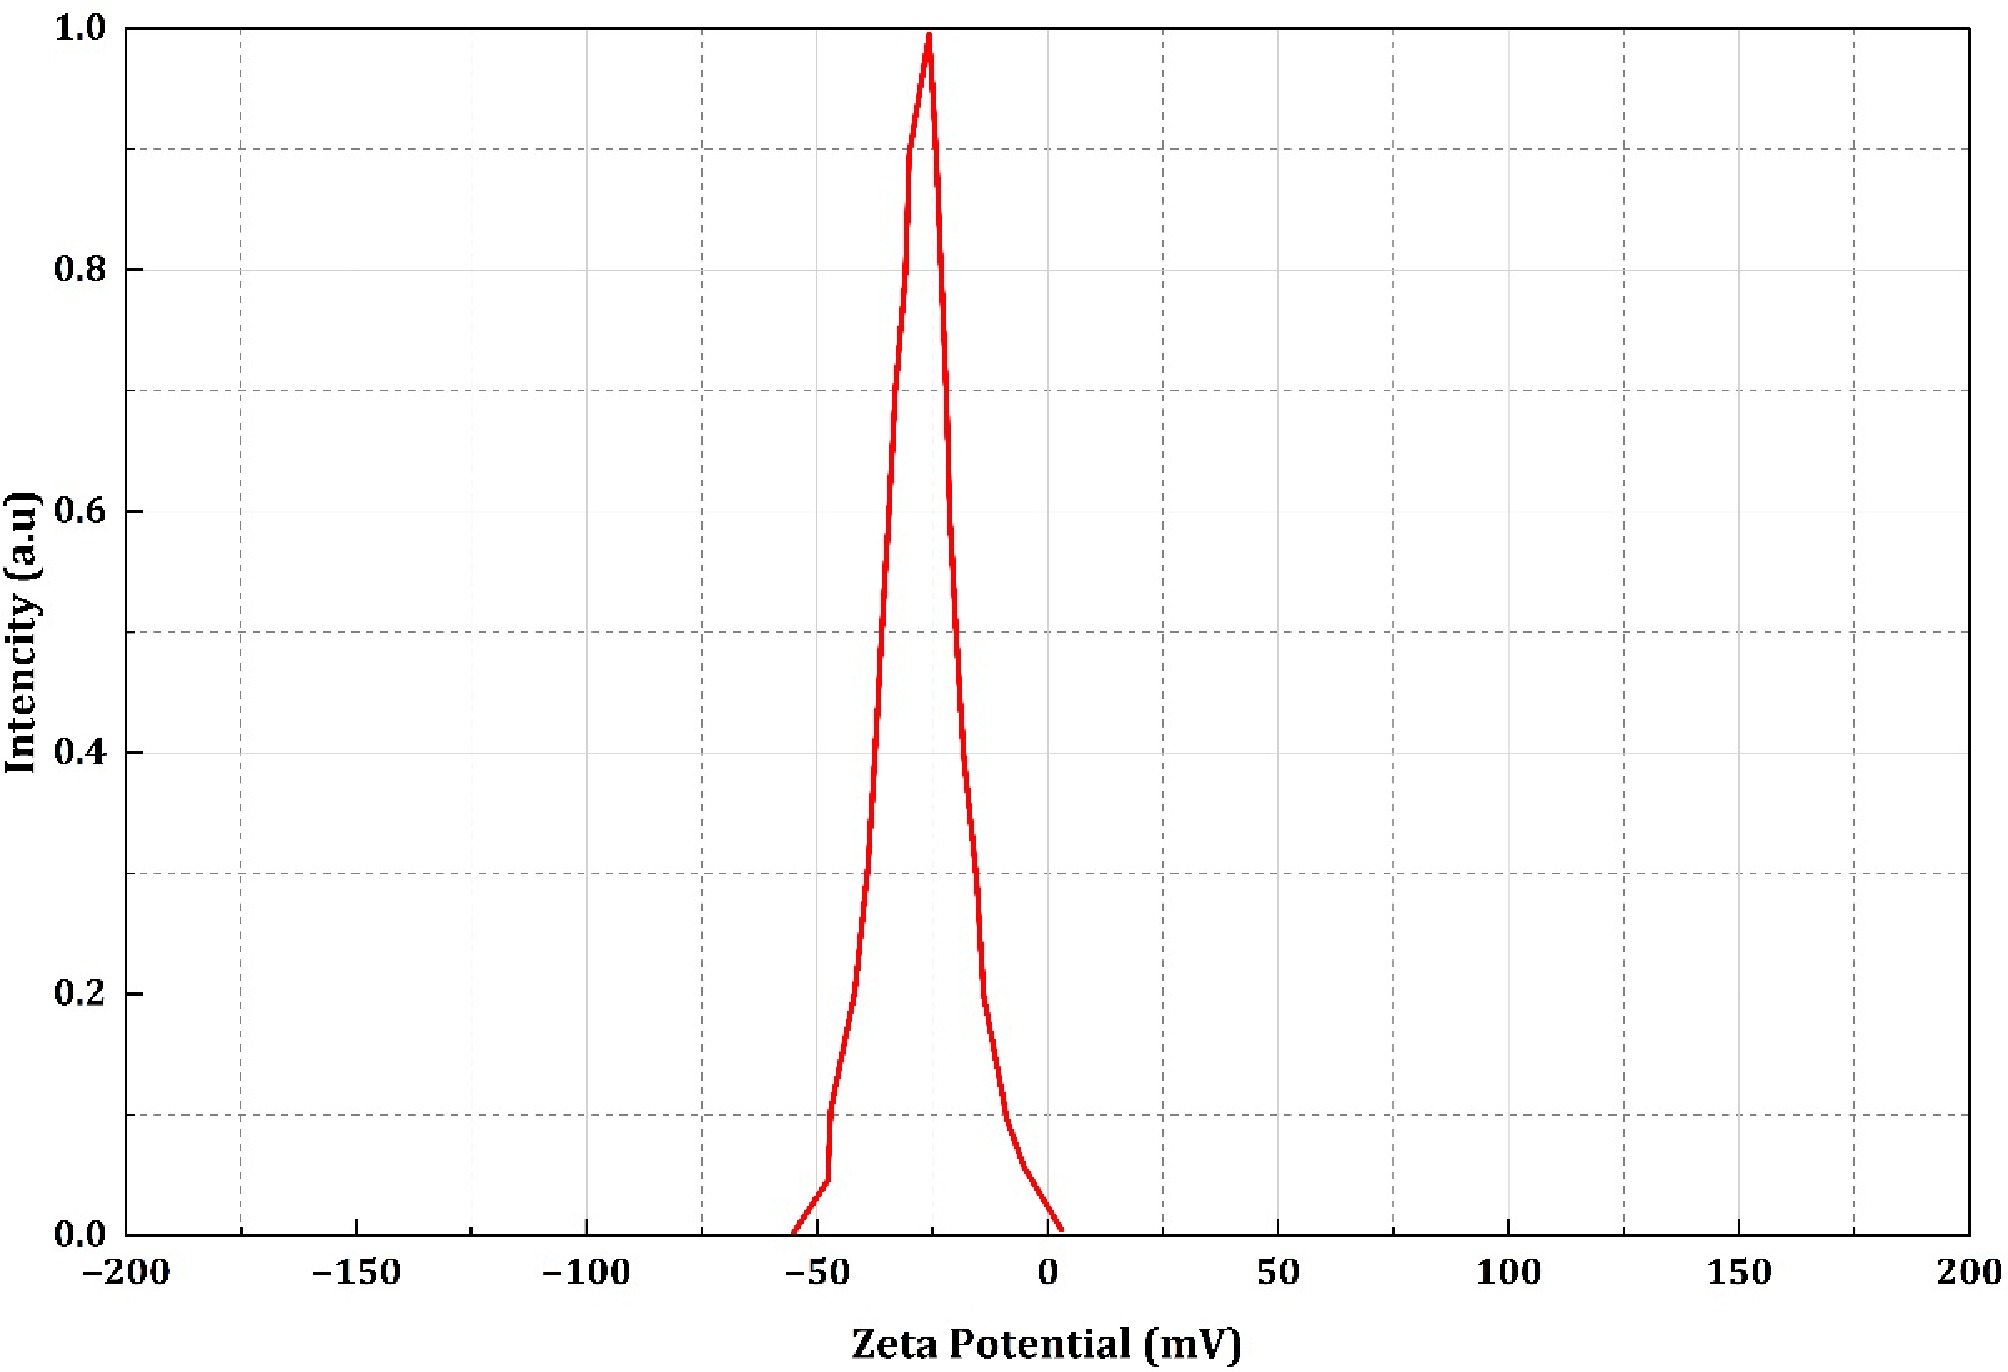
Figure 16.
ZPA of NC-TiO2-15%.
Scanning Electron Microscopy (SEM)
-
The SEM (Scanning Electron Microscopy) test report for the nanocellulose and titanium dioxide (TiO2) composite material provides detailed insights into the surface morphology, particle distribution, and structural characteristics of the composite. SEM imaging is used to study the surface morphology, particle size, distribution, and aggregation of TiO2 on the nanocellulose matrix, which impacts the composite's performance in applications like photocatalysis, coatings, or wastewater treatment.
NC-TiO2-5%
-
At 5% TiO2, the SEM images, Fig. 17, reveal that the composite is mostly made up of nanocellulose, which looks like a tangled web of tiny, thread-like fibers. These fibers form a kind of scaffold. Scattered across this fibrous network are small, bright dots, the TiO2 nanoparticles. These particles are like little beads, roughly 30–100 nm in size.
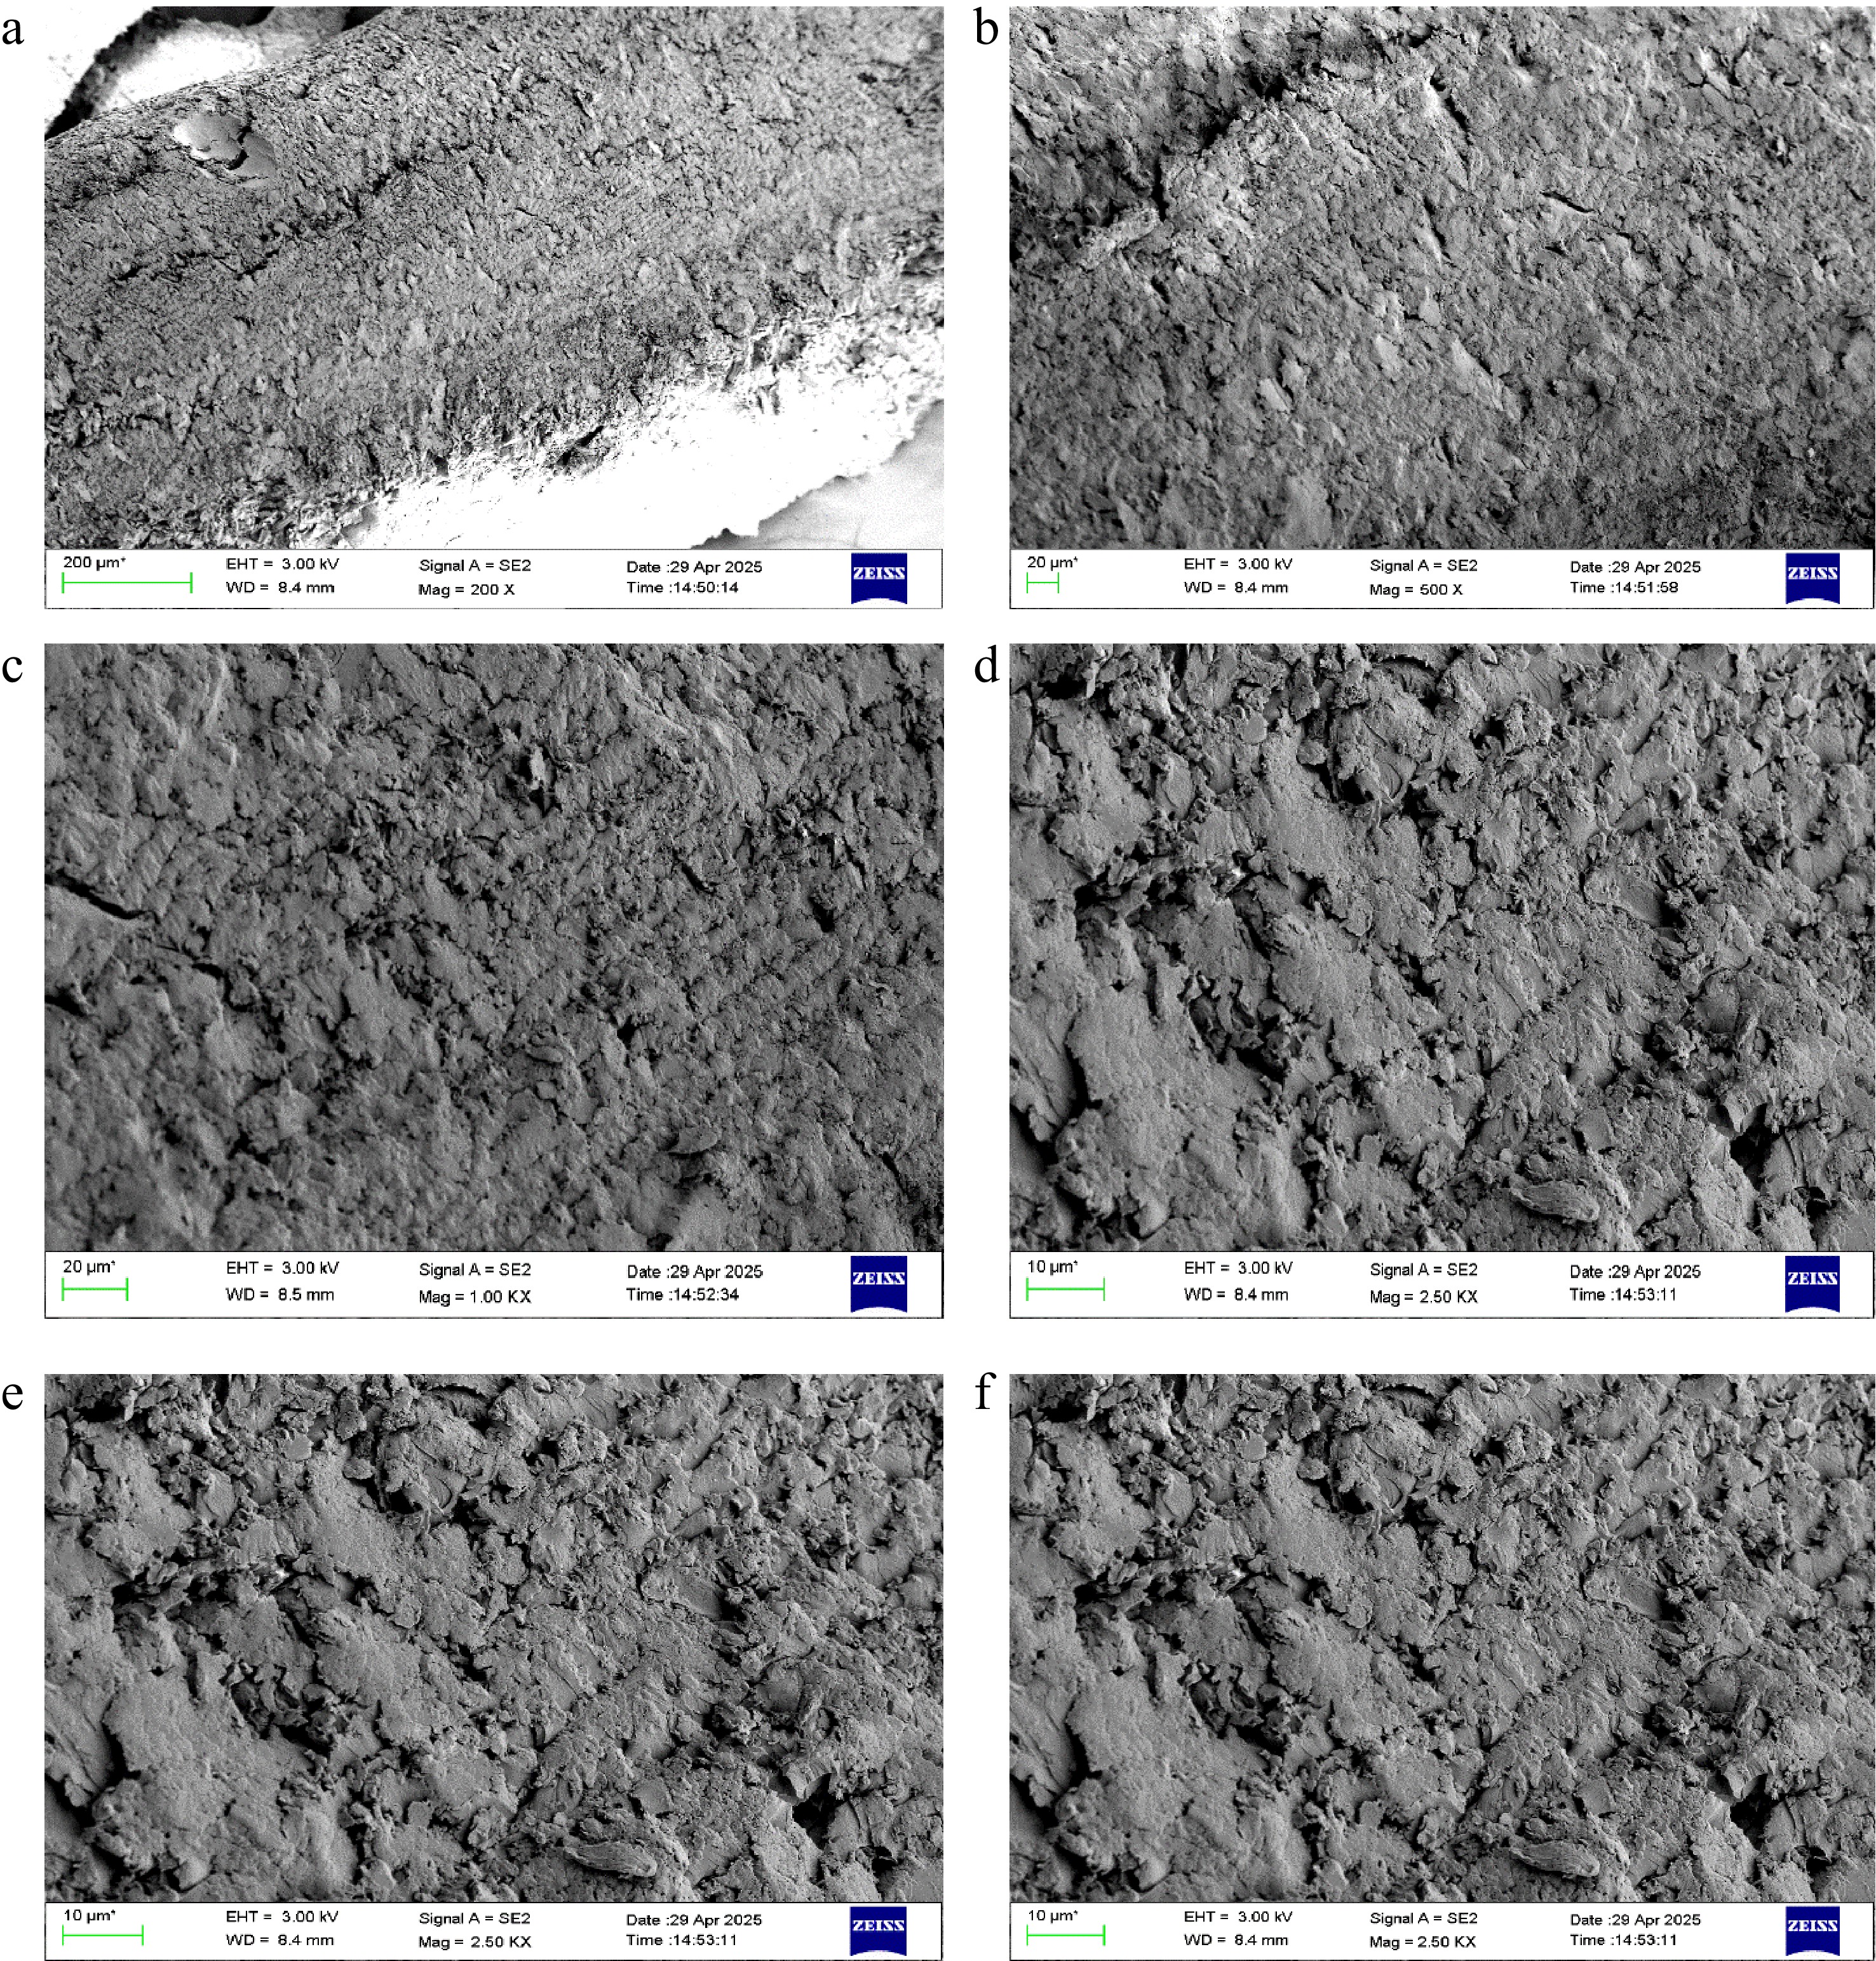
Figure 17.
SEM micrographs of NC-TiO2-5% composites showing surface morphology at different magnifications and regions, highlighting particle dispersion and matrix interaction.
In the low-magnification images, the TiO2 particles are spread out pretty evenly. At higher-magnification images, the TiO2 particles are observed more clearly, sitting snugly on the fibers. They're mostly individual particles, with only a few small clumps here and there, which is a good sign that the particles aren't sticking together too much, which could reduce their effectiveness. A cross-sectional view shows that some TiO2 particles are tucked into the porous, layered structure of the nanocellulose, making the material solid and integrated.
The surface of this 5% composite is a bit rough because of the fibrous nanocellulose and the scattered TiO2 particles. This roughness can be useful for things like water purification or coatings, where a textured surface helps with chemical reactions or gripping other materials. Compared to higher TiO2 concentrations, the 5% version looks lighter in terms of particle coverage, which might limit its strength or photocatalytic abilities but makes it more flexible and easier to shape for applications like lightweight car parts or soft biomedical scaffolds.
Figure 18a-c present high-magnification SEM images of the nanocellulose composite containing 5 wt% TiO2 nanoparticles. The micrographs reveal a rough and heterogeneous surface morphology characteristic of the nanocellulose matrix, with TiO2 particles appearing as bright, fine features distributed over the matrix surface (highlighted regions).
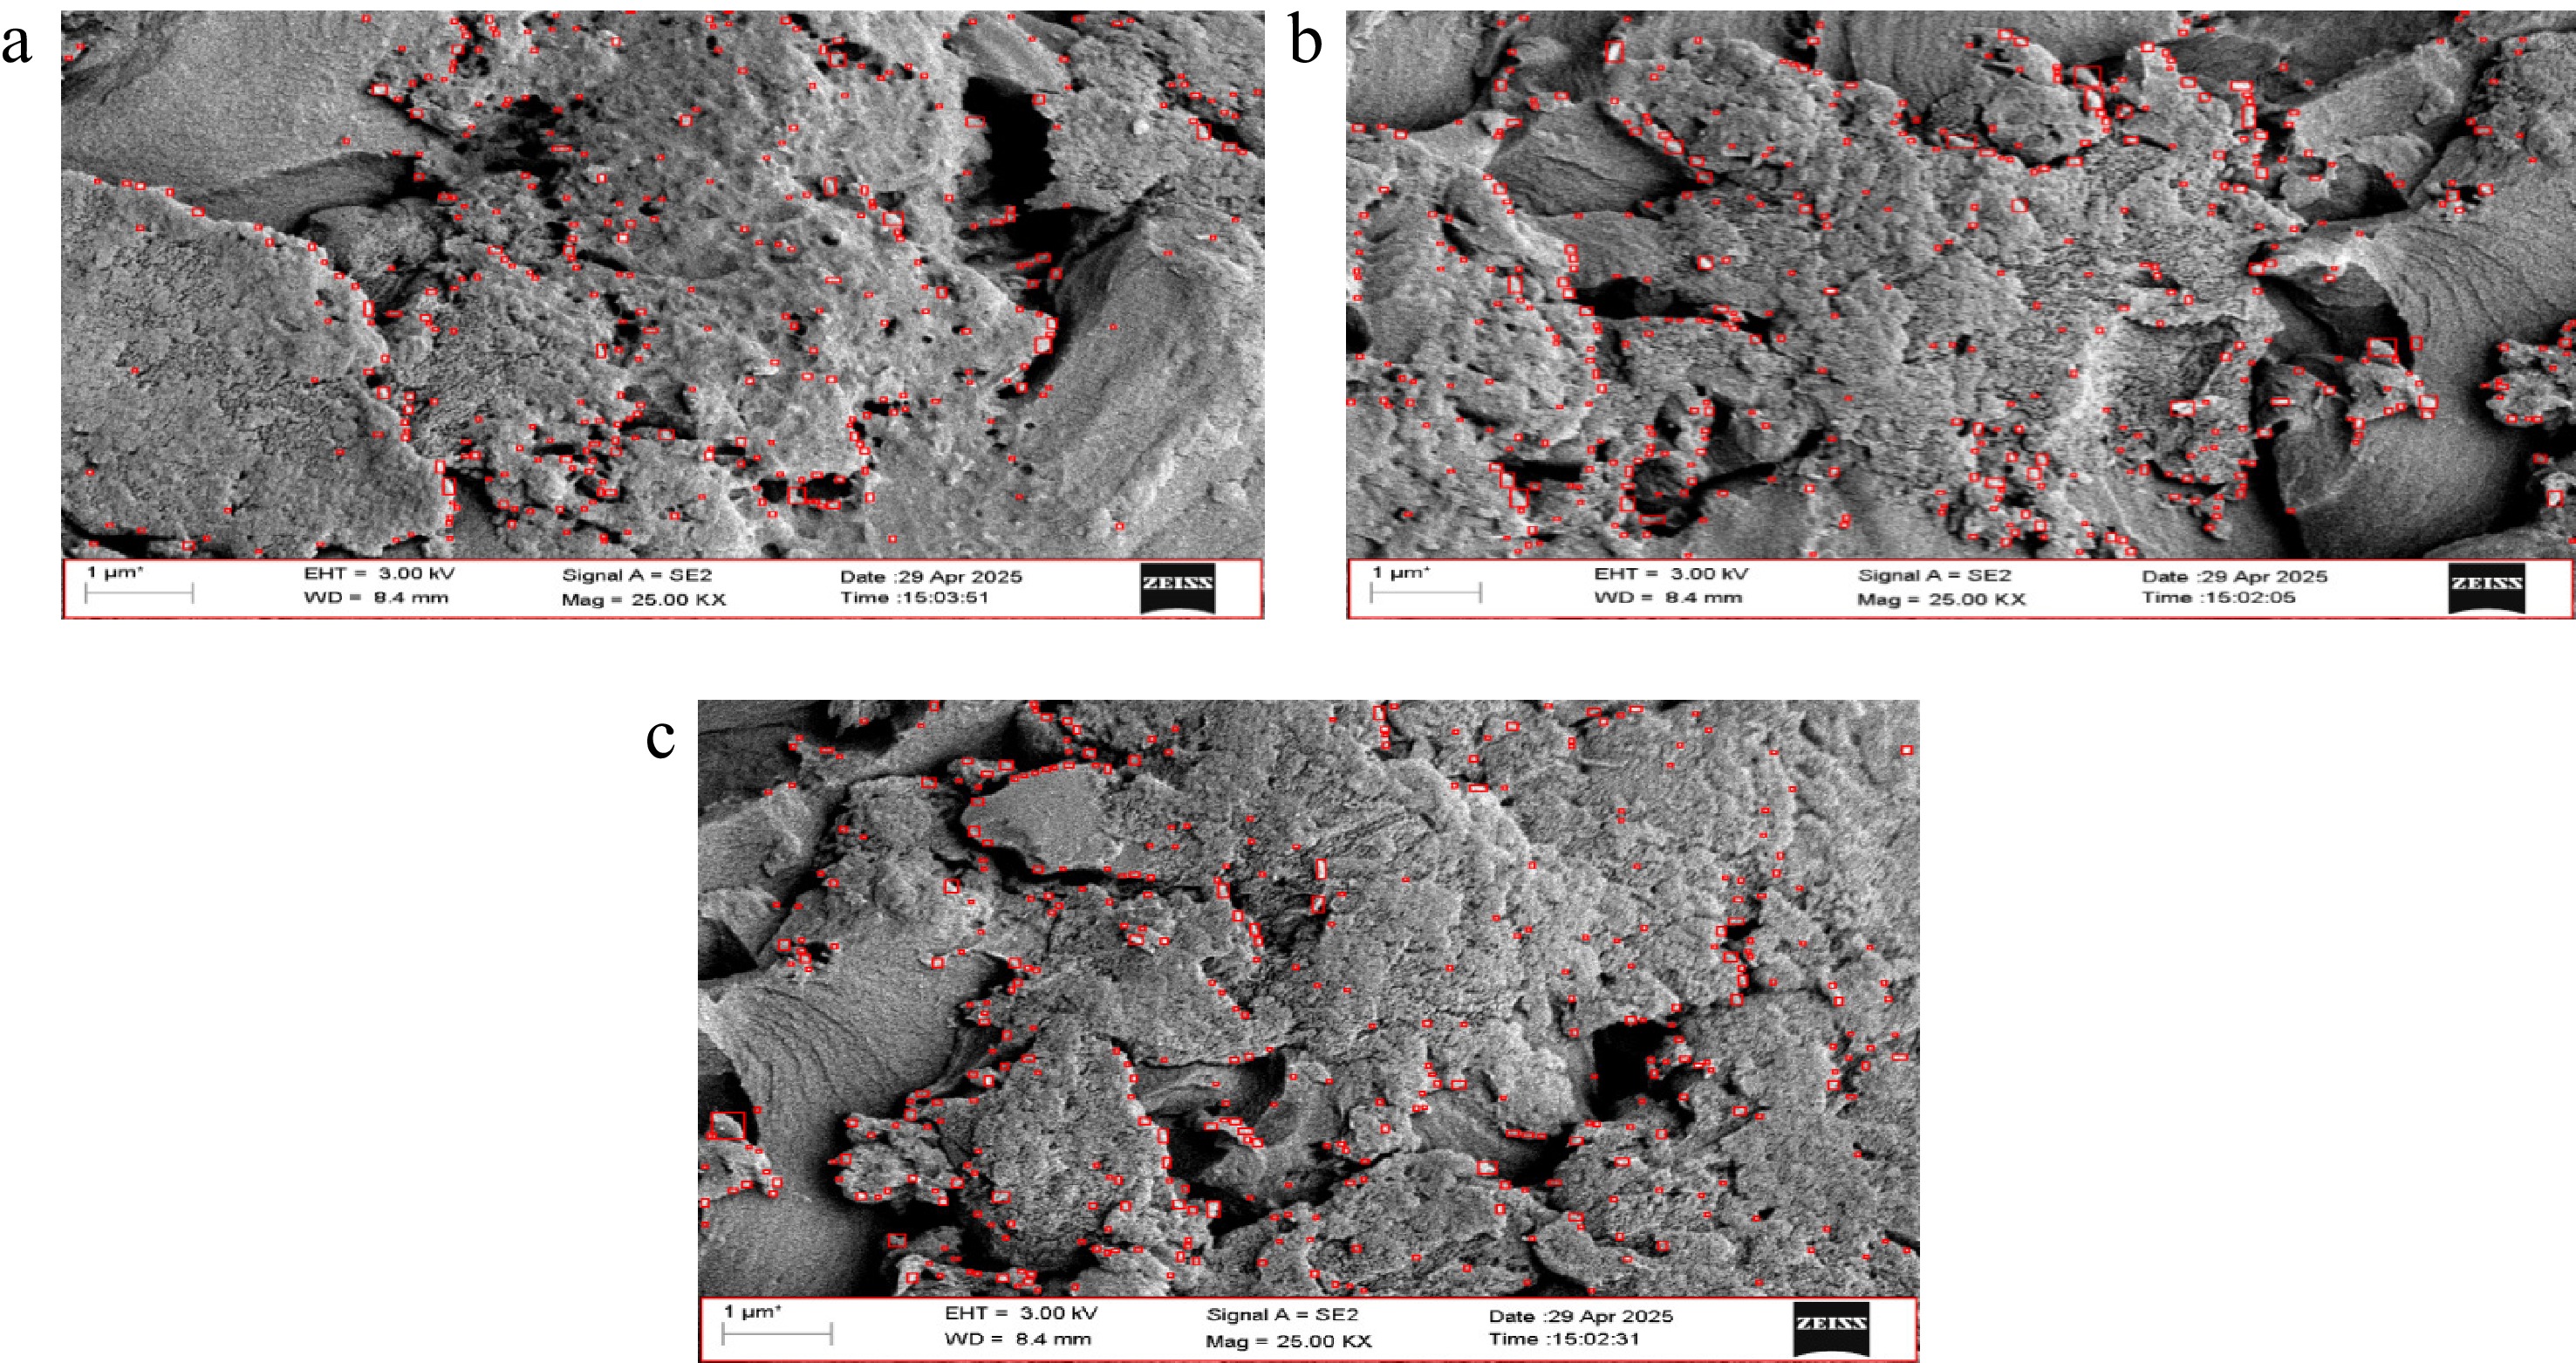
Figure 18.
SEM micrographs of NC-TiO2-5% composites showing surface morphology at 20 KX magnifications. Dispersed TiO2 particles are highlighted by the red color.
At this TiO2 loading, the nanoparticles are mostly dispersed as isolated particles or small clusters, preferentially located along nanocellulose-rich regions, surface asperities, and interfacial boundaries. The absence of large, continuous agglomerates suggests that severe particle clustering is limited at 5% loading. However, localized micro-clusters are still observed, indicating partial aggregation due to the high surface energy of TiO2 nanoparticles.
The nanocellulose matrix appears continuous and well bonded, with no evidence of large interfacial gaps or particle pull-out, implying adequate interfacial adhesion between TiO2 and the hydroxyl-rich cellulose. Small pores and micro-voids are visible. Overall, the SEM observations indicate that 5 wt% TiO2 particles are reasonably well dispersed with limited agglomeration, providing effective particle–matrix contact.
NC-TiO2-10%
-
Figure 19 illustrates the SEM Images for NC-TiO2-10%. The SEM images at this concentration show a similar fibrous nanocellulose network, but it is starting to appear a bit more crowded with TiO2 particles. Images show the same delicate web of fibers, but now there are brighter, shiny TiO2 beads sprinkled across it. These particles are still in the 30−100 nm range, and at low magnification, they seem fairly spread, though a few spots show where they are a bit denser.
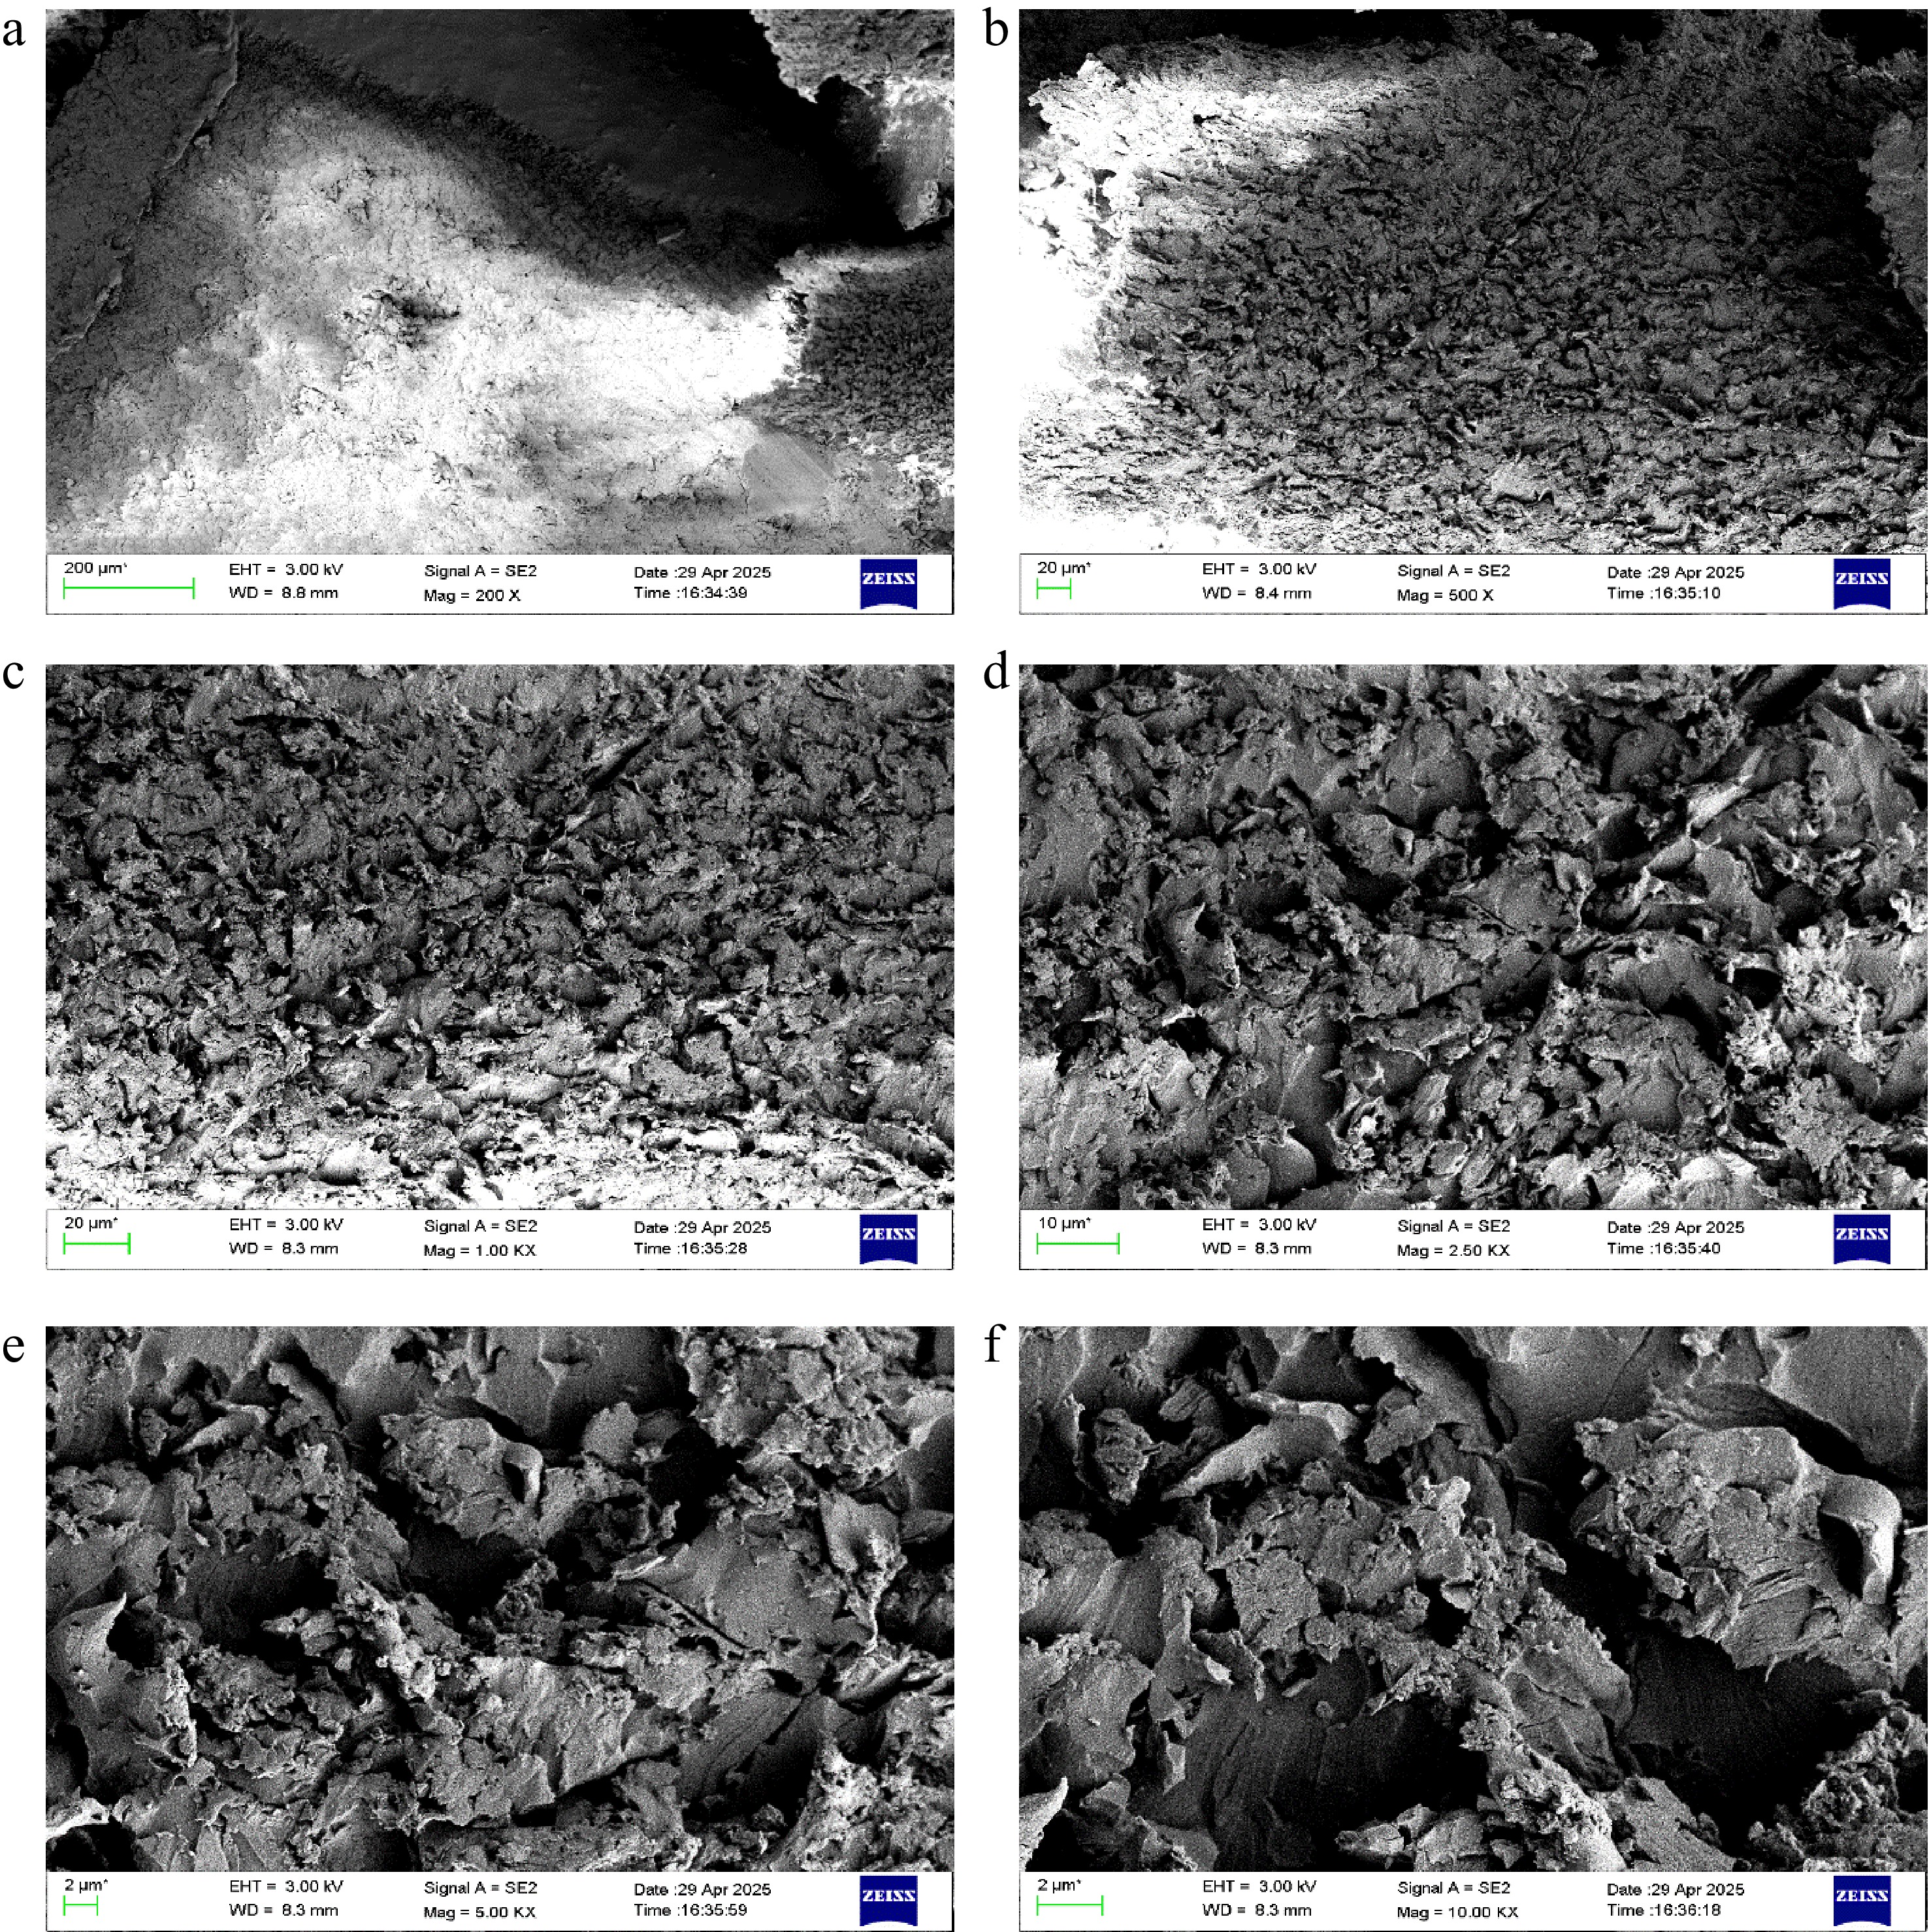
Figure 19.
SEM micrographs of NC-TiO2-10% composites showing surface morphology at different magnifications and regions, highlighting particle dispersion, matrix interaction, and microstructural uniformity.
At the higher magnification, images reveal that the TiO2 particles are still mostly individual, sticking nicely to the nanocellulose fibers, likely because of chemical bonds between the particles and the fibers' surface. However, there are slightly more small clumps of TiO2 compared to the 5% version, as if a few beads have rolled together into tiny clusters. These clusters are not huge, maybe 100−200 nm, and they do not dominate the surface, so the material still looks well organized. The cross-sectional view shows TiO2 particles embedded deeper into the nanocellulose's porous structure, suggesting the material is sturdy and the particles are well anchored.
Figure 20a–c SEM images recorded at 25,000x magnification (for the NC-TiO2 [10%]) composite reveal a relatively uniform and compact microstructure compared to lower filler loading. The nanocellulose matrix exhibits a rough yet continuous morphology, providing an effective scaffold for TiO2 nanoparticle anchoring. TiO2 particles appear as bright, finely distributed features across the matrix surface, indicating successful incorporation and improved dispersion at this concentration. The particles are closely spaced and well embedded within the matrix, suggesting strong particle–matrix interaction.
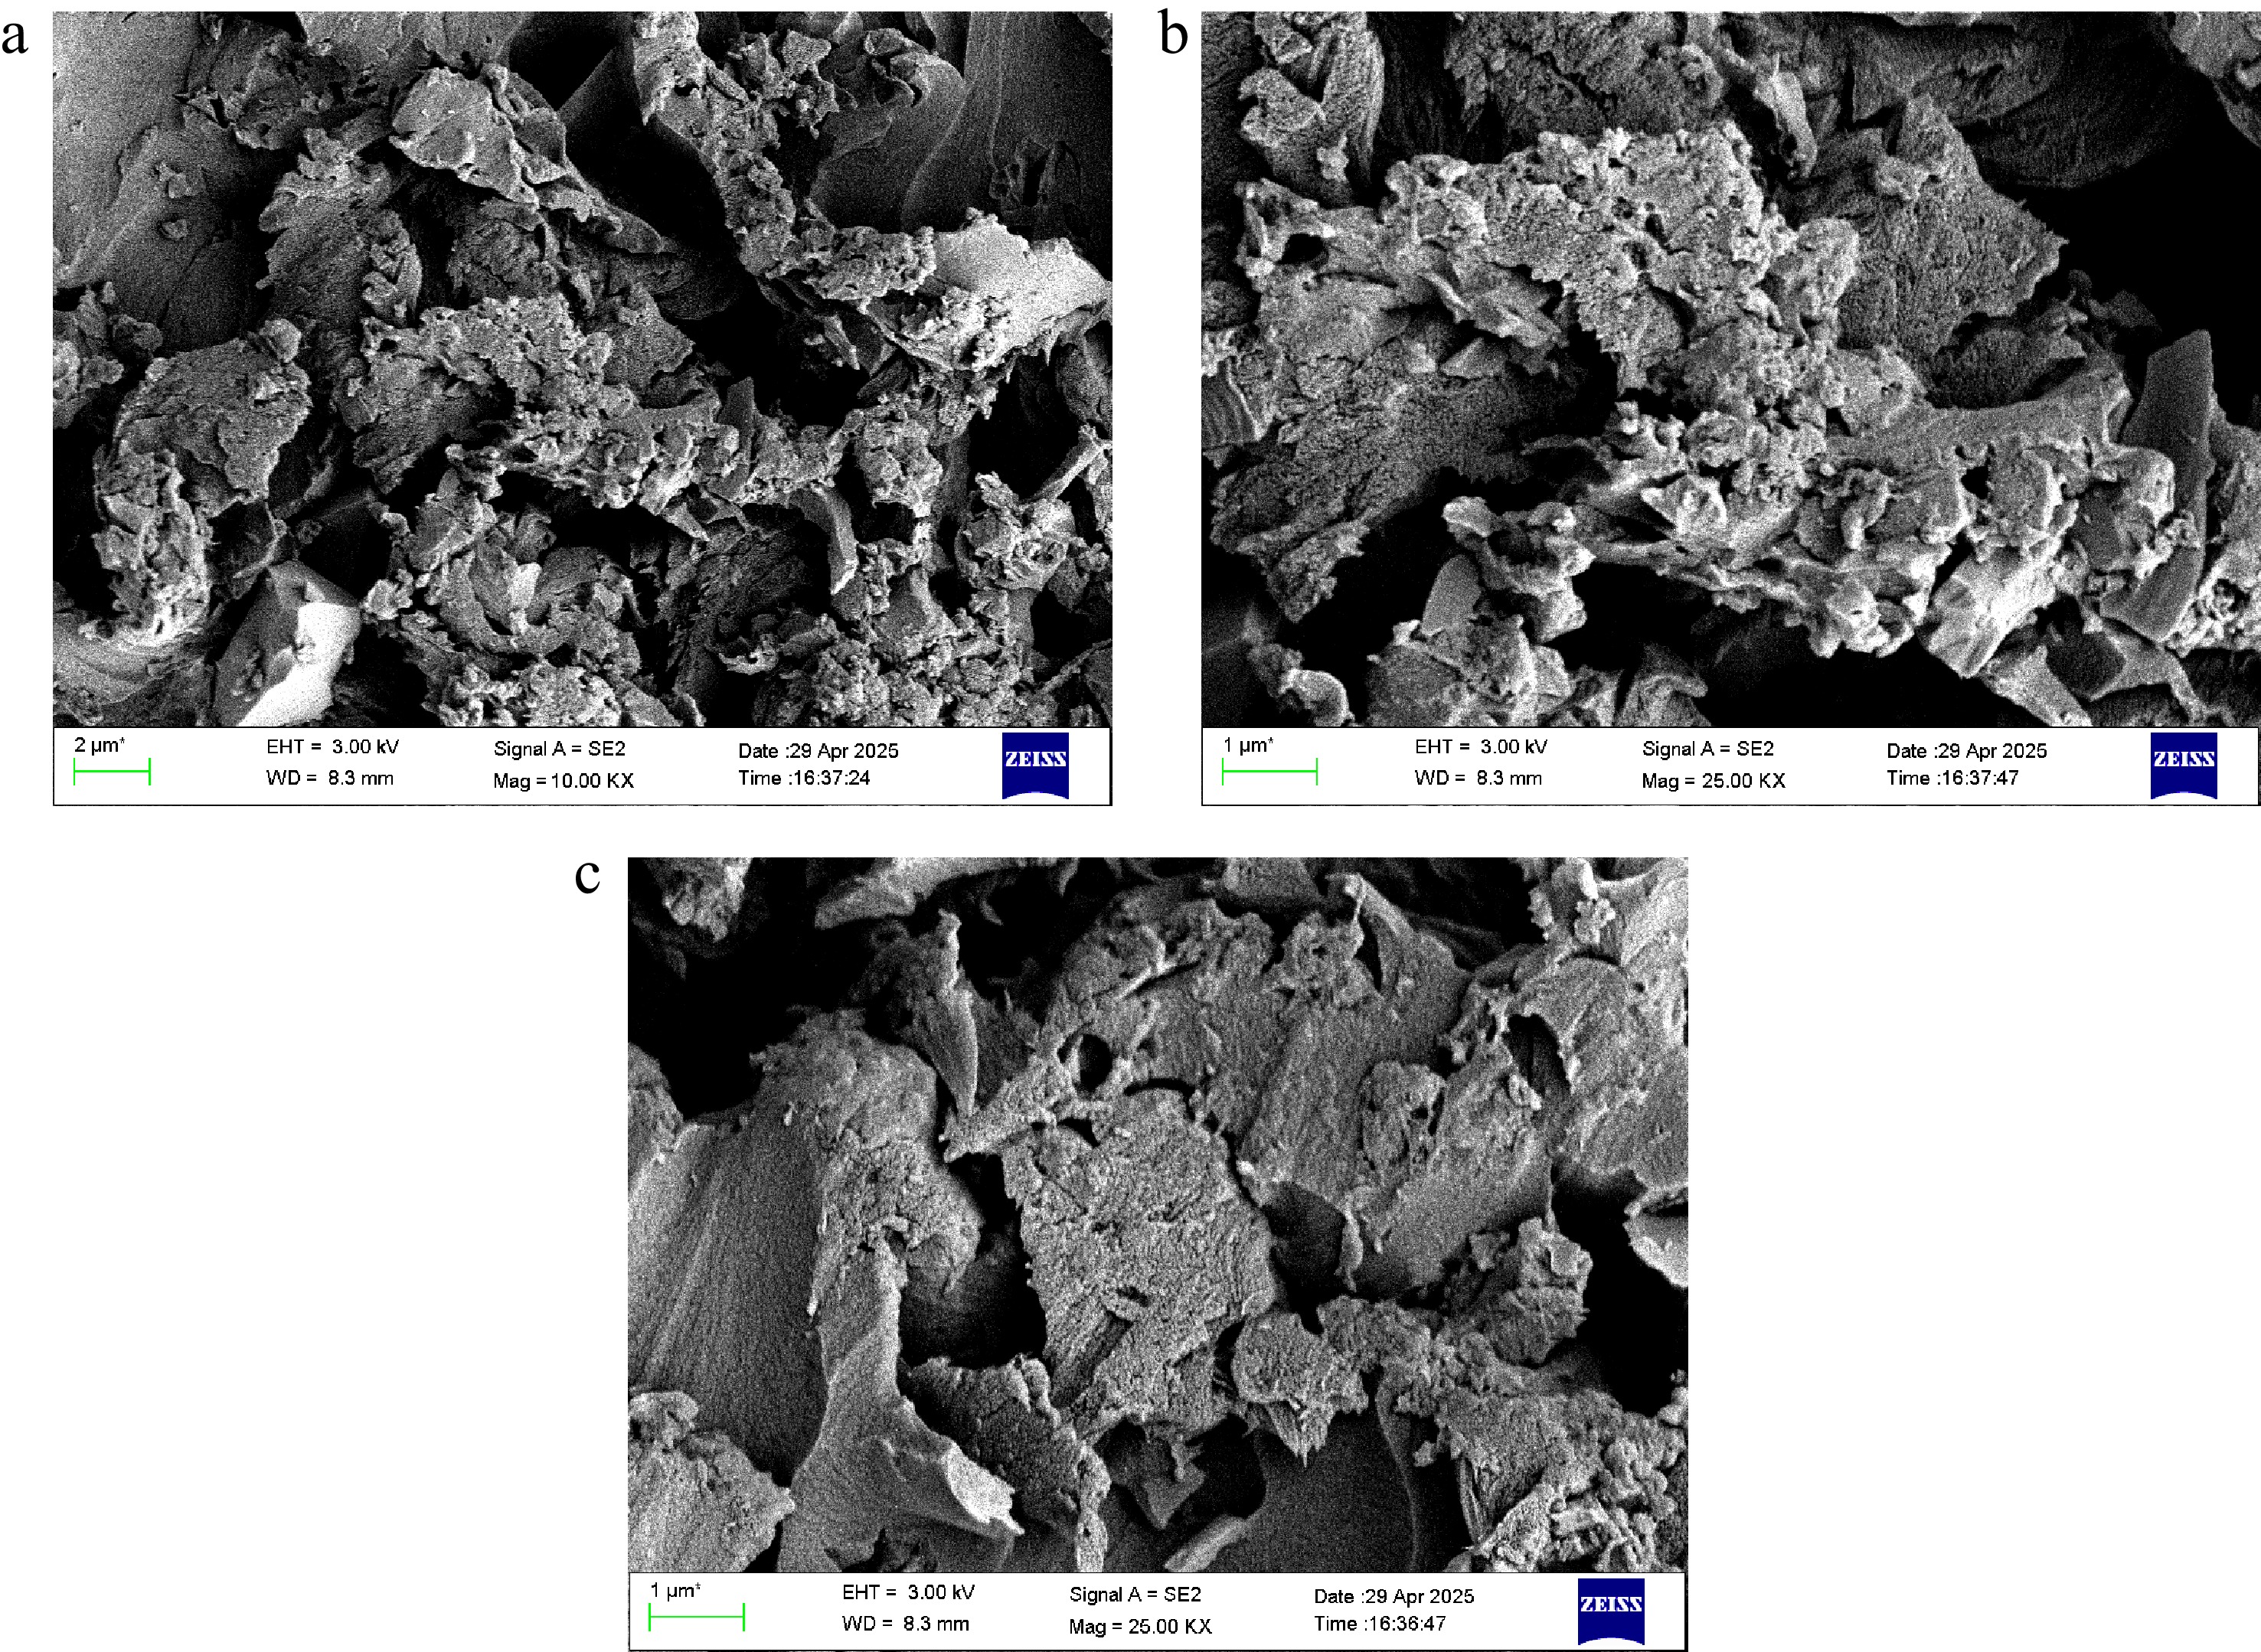
Figure 20.
SEM micrographs of NC-TiO2-10% composites showing surface morphology at different magnifications and regions, highlighting particle dispersion, matrix interaction, and microstructural uniformity.
Across Fig. 20a–c, large-scale agglomeration is notably absent, and TiO2 is predominantly present as well-dispersed nanoparticles or small, evenly distributed clusters. The reduction in interfacial voids and minimal evidence of particle pullout indicate enhanced interfacial adhesion, likely due to interactions between Ti–O/Ti–OH groups and nanocellulose hydroxyl functionalities. The matrix appears denser with fewer micro-voids than the 5% sample, reflecting improved packing efficiency and filler–matrix compatibility. Overall, the SEM observations at 25KX magnification confirm that 10 wt% TiO2 represents an optimal loading, achieving a balance between uniform dispersion and strong interfacial bonding without the onset of severe agglomeration.
The surface is noticeably rougher than the 5% composite because of the extra TiO2, giving it a more granular texture. This added roughness could help for applications like photocatalytic coatings (where the TiO2 can break down dirt or bacteria under light) or water filtration, where a textured surface grabs onto pollutants. The results note that the 10% sample performed best overall, and the SEM images support this, showing a balanced, functional surface.
Figure 21 shows the SEM Images for NC-TiO2-15%. The analysis for the 15% TiO2 composite, which is a moderate-to-high loading level, potentially increases photocatalytic activity but risks aggregation. At 15% TiO2, things get even more interesting, but also a bit messier. The SEM images show the nanocellulose web still holding strong, but now it's heavily dotted with TiO2 particles. At low magnification, the surface looks busier, with more bright TiO2 spots than before. While the particles are still spread out in many areas, there are noticeable patches where they are packed closer together, hinting that the higher TiO2 amount is pushing the limits of even distribution.
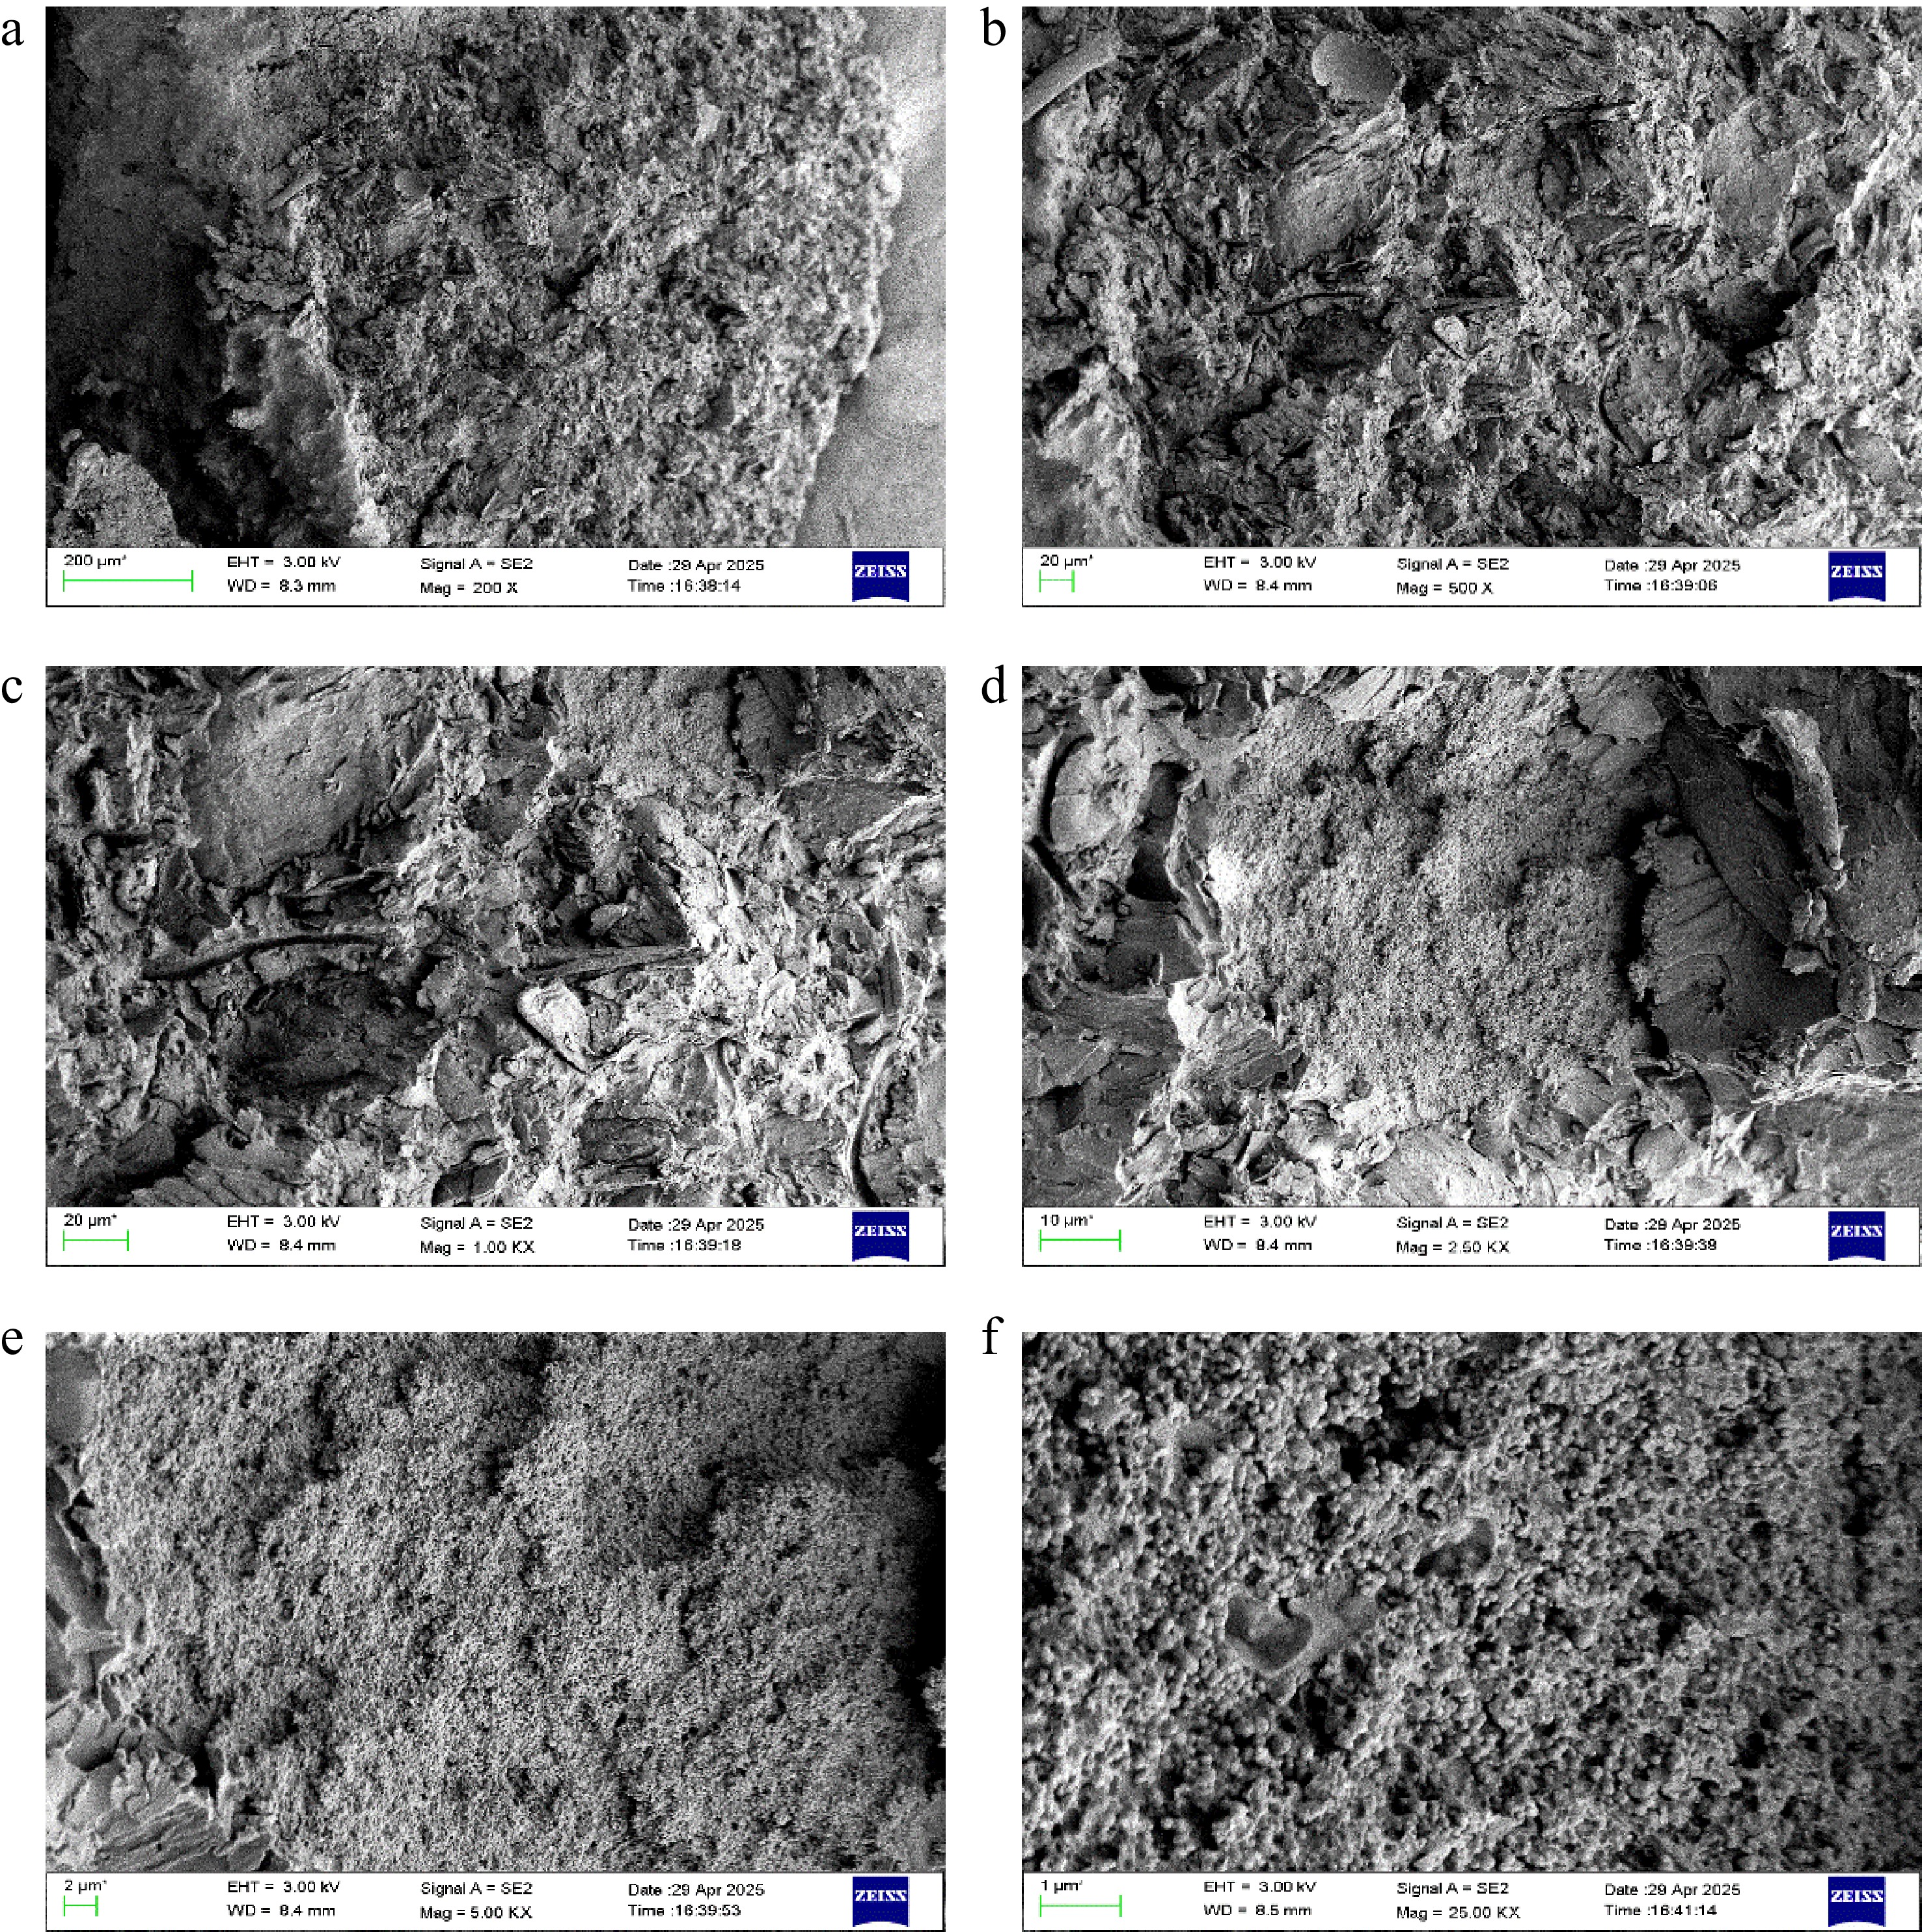
Figure 21.
SEM micrographs of NC-TiO2-15% composites showing surface morphology at different magnifications and regions, highlighting particle dispersion, matrix interaction, and microstructural uniformity.
At the higher magnification, the TiO2 particles (still 30−100 nm) cling to the nanocellulose fibers, but there's a clear increase in clumping. Some particles have formed bigger clusters, ranging from 100 to 500 nm, which look like little piles of beads stacked together. These aggregates are more obvious than in the 10% composite, and in some images, they even overshadow the fibrous nanocellulose background, making the surface look less uniform. The cross-sectional view shows TiO2 particles buried deeper in the nanocellulose's porous layers, which is good for structural strength, but the increased clustering suggests the material is getting denser and less porous overall. The surface at 15% is the roughest of the three, with a gritty, granular texture due to the heavy TiO2 coverage. This could be great for applications needing a lot of photocatalytic power, but the report points out that the denser, less porous structure might limit some uses. The increased roughness and clumping could also make the material less transparent or harder to coat smoothly, which might be a drawback for certain coatings or films. Compared to the 10% composite, the 15% version has more TiO2 to offer stronger functional properties, but the trade-off is a less consistent surface that could reduce efficiency in some applications due to the aggregated particles.
A semi-quantitative analysis of all SEM images indicates a clear dependence of TiO2 dispersion on filler loading. For the 5 wt% TiO2 composite, nanoparticles are mainly isolated or form small clusters (< 150 nm), with low cluster density and large inter-particle spacing, indicating limited filler networking. The 10 wt% TiO2 composite shows the most uniform dispersion, with TiO2 particles predominantly in the 40–120 nm range and small, evenly distributed clusters (100–200 nm), minimal agglomeration, and reduced inter-particle spacing, reflecting optimal particle–matrix interaction. In contrast, the 15 wt% TiO2 composite exhibits pronounced clustering, with frequent agglomerates of 200–500 nm, higher cluster density, and localized particle-rich regions, indicating dominant particle–particle interactions. Overall, the SEM-based quantitative trends confirm that 10 wt% TiO2 provides the best balance between dispersion and clustering, consistent with PSA, ZPA, and mechanical performance results.
The semi-quantitative analysis of the SEM micrographs is performed using image-based particle analysis techniques. The estimated agglomerate size indicates that at 15% TiO2 loading, particle clusters in the range of approximately 2–5 µm are observed, whereas at 5% and 10% loadings, the dispersed particles remain predominantly below ~1 µm. This clear difference in cluster size supports the proposed aggregation mechanism.
Specifically, the larger agglomerates observed at 15% loading act as stress concentration sites, disrupt uniform stress transfer between CNC and the epoxy matrix, and reduce effective interfacial bonding efficiency, thereby contributing to the observed reduction in tensile strength. Furthermore, the mechanistic explanation has been clarified to explicitly link particle clustering with reduced effective interfacial area, increased probability of void formation, and premature crack initiation under tensile loading. These additions provide quantitative and microstructural evidence to support the aggregation-induced mechanical degradation mechanism and strengthen the overall interpretation of the tensile results.
XRD graphs for different compositions
XRD graph for NC-TiO2-5%
-
Figure 22 illustrates the XRD graph for NC-TiO2-5%. For the NC-TiO2-5% composite, the XRD pattern exhibits a prominent peak at 2θ = 26.80056° (d = 3.323802 Å, relative intensity = 100%), with additional significant peaks at 2θ = 22.96867° (d = 3.868909 Å, relative intensity = 74.77%), 2θ = 22.36011° (d = 3.972813 Å, relative intensity = 57.02%), and 2θ = 21.00928° (d = 4.225101 Å, relative intensity = 49.85%). The presence of fewer intense peaks and a broader background suggests a dominant amorphous contribution from nanocellulose, with TiO2 nanoparticles contributing distinct crystalline signals. Table 5 summarizes the XRD results data for NC-TiO2-5%.
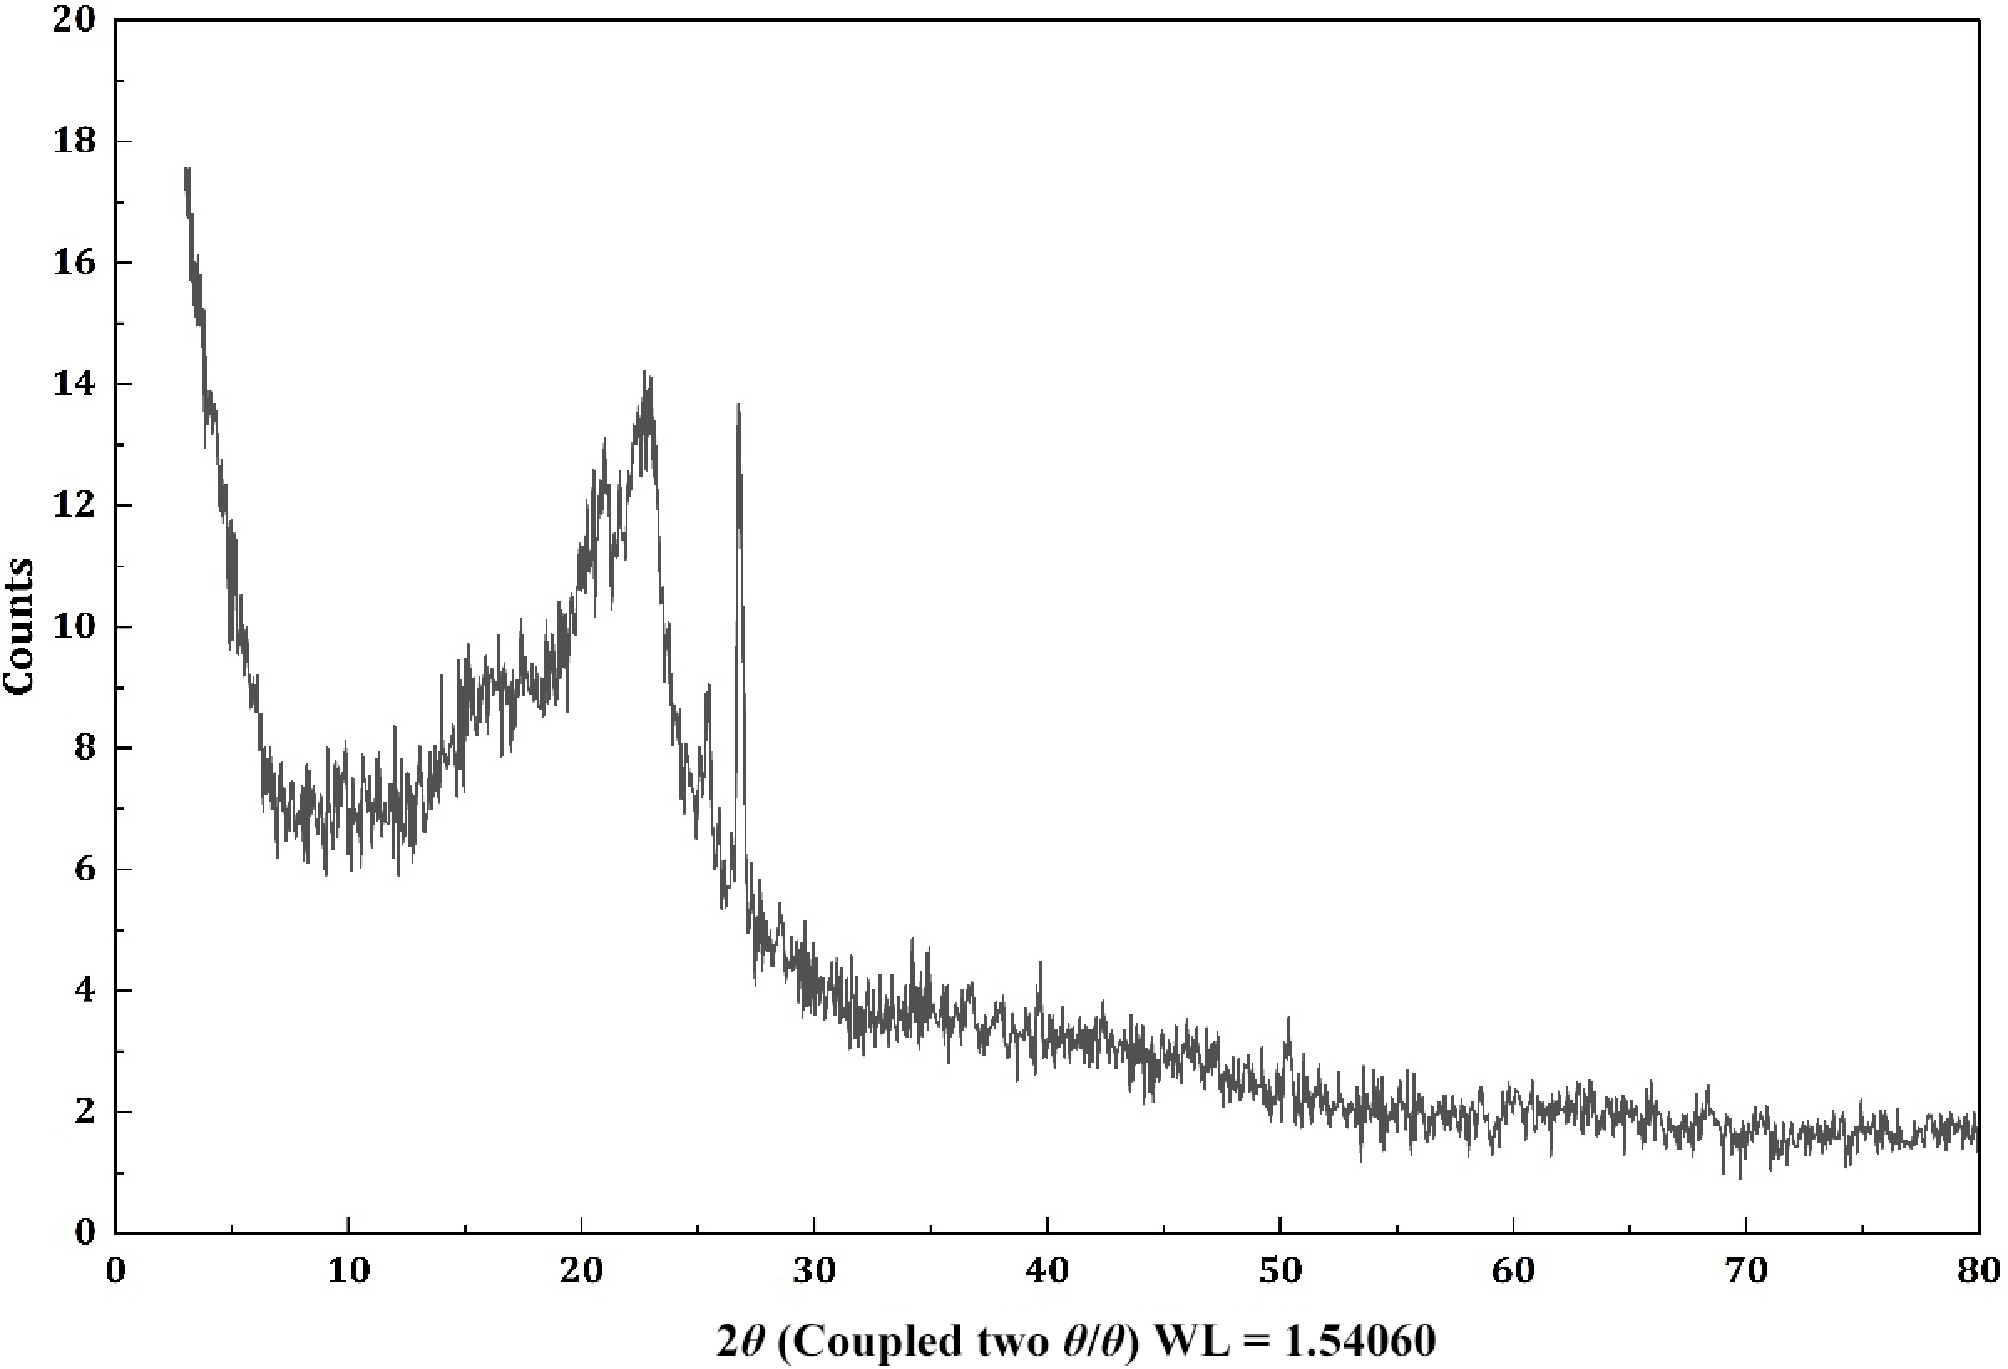
Figure 22.
NC-TiO2-5%.
Table 5. NC-TiO2-5%.
Index Angle d Value Net intensity Gross intensity Rel. intensity 1 15.16552 5.837457 38.81906 272.7384 0.175764 2 21.00928 4.225101 110.0904 369.28 0.498464 3 22.36011 3.972813 125.9336 372.8137 0.570198 4 22.96867 3.868909 165.1325 403.7965 0.747681 5 25.41477 3.50181 53.43039 242.3235 0.24192 6 26.80056 3.323802 220.8594 381.1461 1 7 34.18415 2.620887 31.05041 136.5401 0.140589 8 39.7973 2.263209 34.74278 127.3479 0.157307 9 50.32634 1.811628 30.65143 93.43885 0.138783 10 58.6054 1.573892 18.59901 68.86196 0.084212 XRD graph for NC-TiO2-10%
-
Figure 23 illustrates the XRD pattern for NC-TiO2-10%. The NC-TiO2-10% composite displays a more complex diffraction pattern, with the highest number of detectable peaks, indicating an increased TiO2 contribution. The strongest peak occurs at 2θ = 26.87125° (d = 3.315218 Å, relative intensity = 100%), followed by notable peaks at 2θ = 21.0722° (d = 4.212627 Å, relative intensity = 37.37%), 2θ = 22.85945° (d = 3.887147 Å, relative intensity = 31.37%), 2θ = 22.49033° (d = 3.950103 Å, relative intensity = 27.75%), and 2θ = 25.5242° (d = 3.487045 Å, relative intensity = 21.36%). Additional minor peaks, such as those at 2θ = 8.566103° (d = 10.31416 Å) and 2θ = 50.40472° (d = 1.808995 Å), suggest enhanced crystallinity and a broader range of TiO2 lattice planes, possibly due to a balanced interaction between the nanocellulose matrix and TiO2 filler. Table 6 summarizes the XRD results for NC-TiO2-10%.
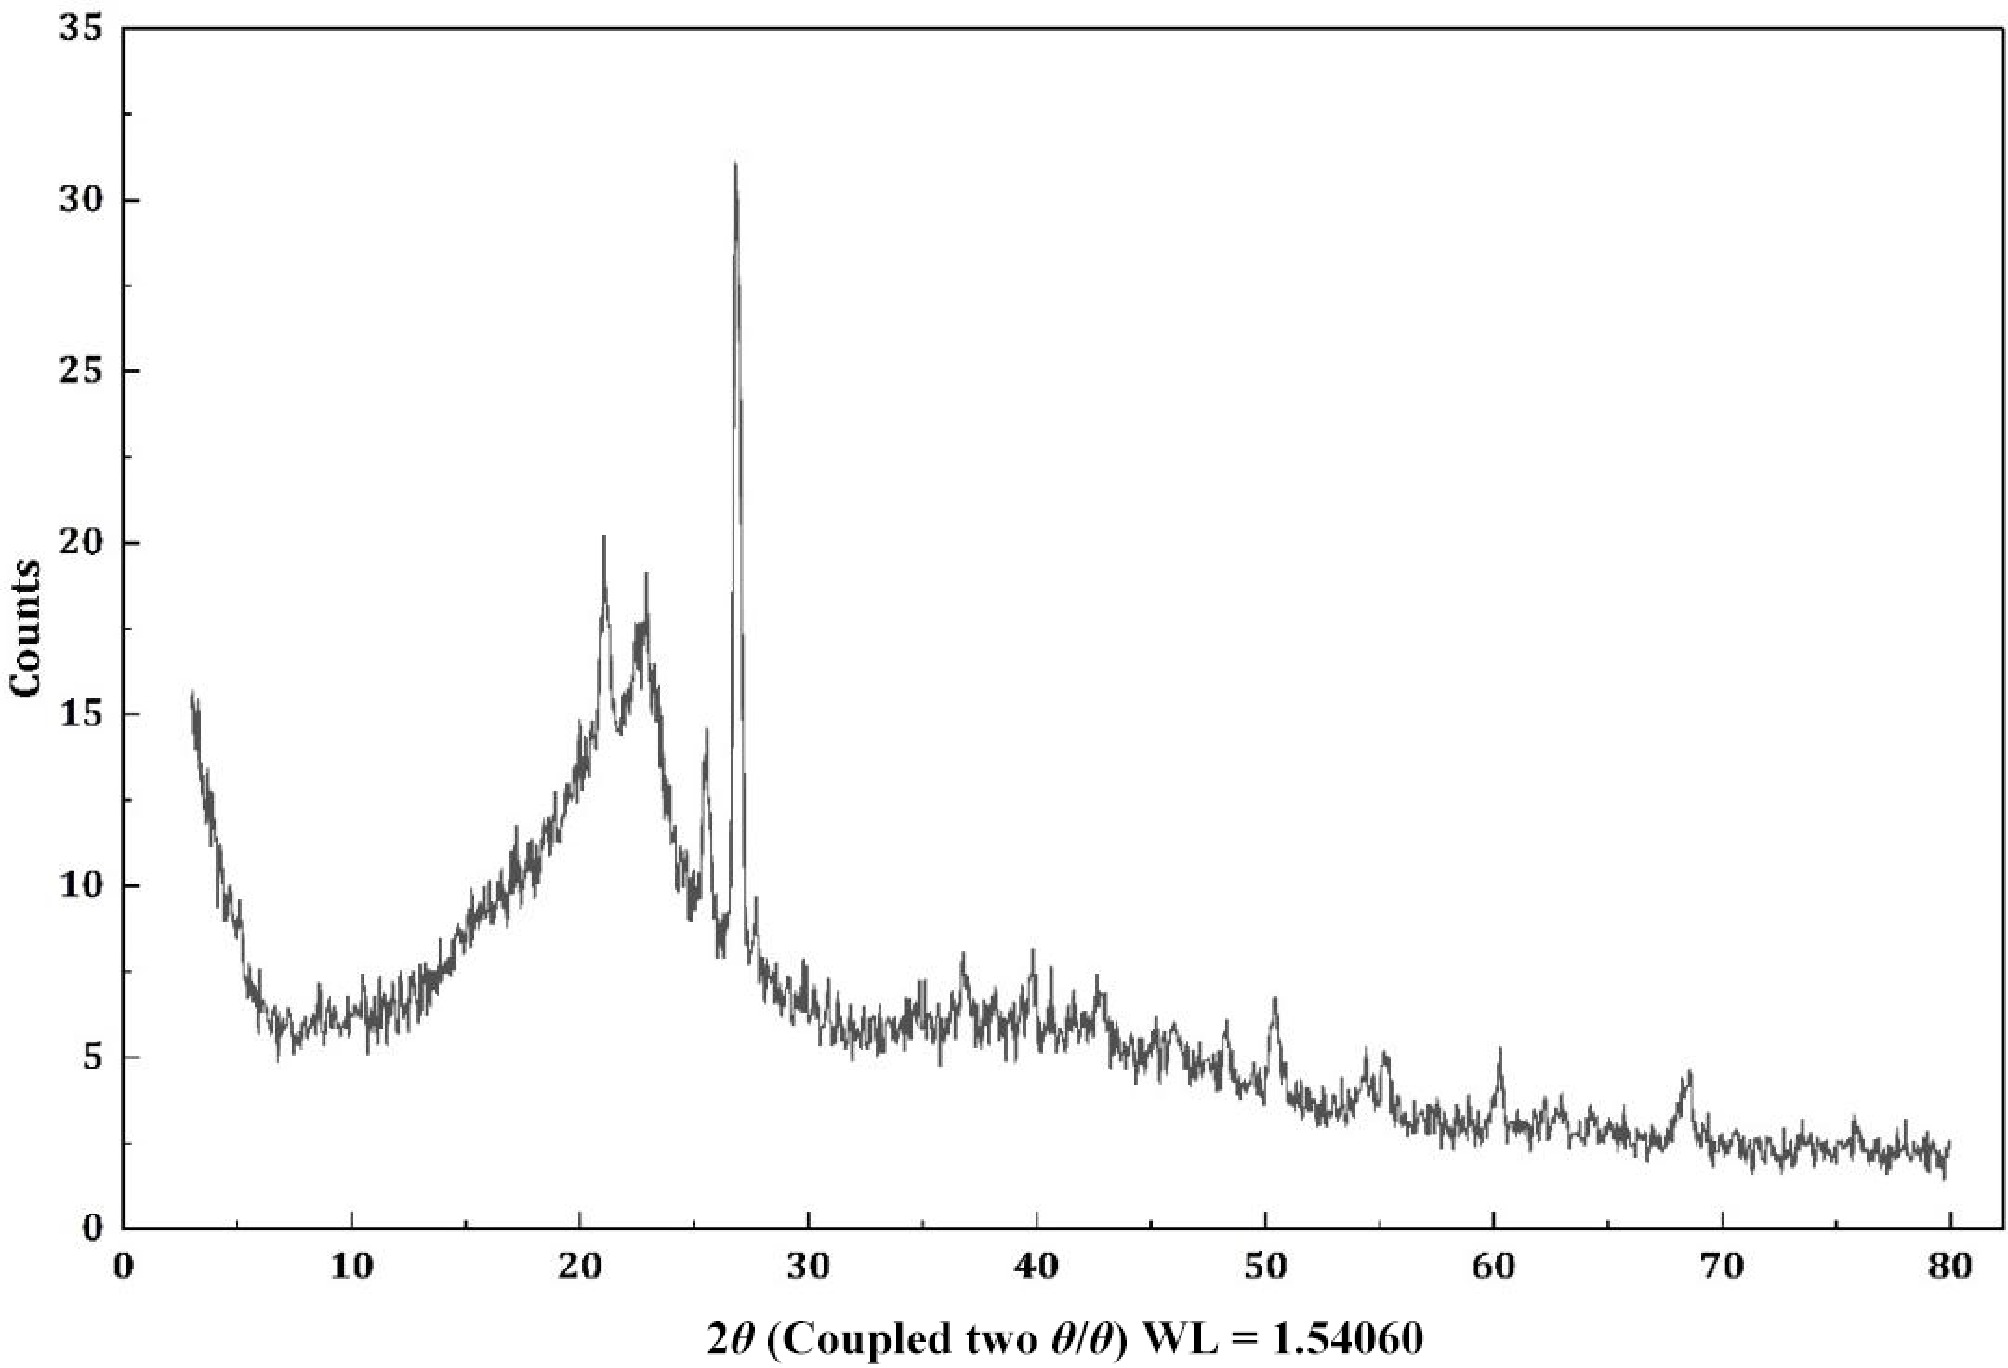
Figure 23.
NC-TiO2-10%.
Table 6. NC-TiO2-10%.
Index Angle d Value Net intensity Gross intensity Rel. intensity 1 8.566103 10.31416 40.0016 204.9024 0.06412 2 10.50442 8.414897 35.61958 205.2714 0.057095 3 18.90682 4.689929 45.35736 361.7636 0.072704 4 21.0722 4.212627 233.1585 563.2905 0.373736 5 22.49033 3.950103 173.0937 497.0656 0.277456 6 22.85945 3.887147 195.7285 516.1317 0.313738 7 25.5242 3.487045 133.2367 405.6501 0.213568 8 26.87125 3.315218 623.8598 865.0862 1 9 27.67361 3.220893 47.01355 267.9055 0.075359 10 29.79416 2.996303 36.44493 217.367 0.058418 11 36.81153 2.439631 50.30884 221.5918 0.080641 12 39.80103 2.263006 56.89635 222.6027 0.091201 13 40.60581 2.219992 56.13306 218.3333 0.089977 14 42.73048 2.114397 35.75131 191.7733 0.057307 15 45.99042 1.971821 35.96887 171.8511 0.057655 16 48.2773 1.883622 37.69532 163.5 0.060423 17 50.40472 1.808995 71.61617 190.9094 0.114795 18 53.33605 1.716277 26.86469 123.2841 0.043062 19 54.35394 1.686516 27.81275 126.7474 0.044582 20 55.26603 1.660821 40.15096 138.3462 0.064359 21 60.26182 1.534531 62.61021 146.5174 0.100359 22 62.9405 1.475513 24.66622 105.8649 0.039538 23 68.41094 1.370245 41.8497 117.1034 0.067082 24 68.53806 1.368013 46.26498 121.4927 0.074159 XRD for NC-TiO2-15%
-
Figure 24 shows a dominant peak at 2θ = 26.83473° (d = 3.319647 Å, relative intensity = 100%), with other significant peaks at 2θ = 21.04192° (d = 4.218621 Å, relative intensity = 36.10%), 2θ = 25.48732° (d = 3.492007 Å, relative intensity = 34.48%), and 2θ = 50.3915° (d = 1.809438 Å, relative intensity = 14.35%). Compared to the 10% sample, the 15% composite exhibits fewer minor peaks, which may indicate peak overlap or increased crystallinity of TiO2, reducing the relative contribution of the amorphous nanocellulose background. Table 7 summarizes the XRD results for the NC-TiO2-15% sample.
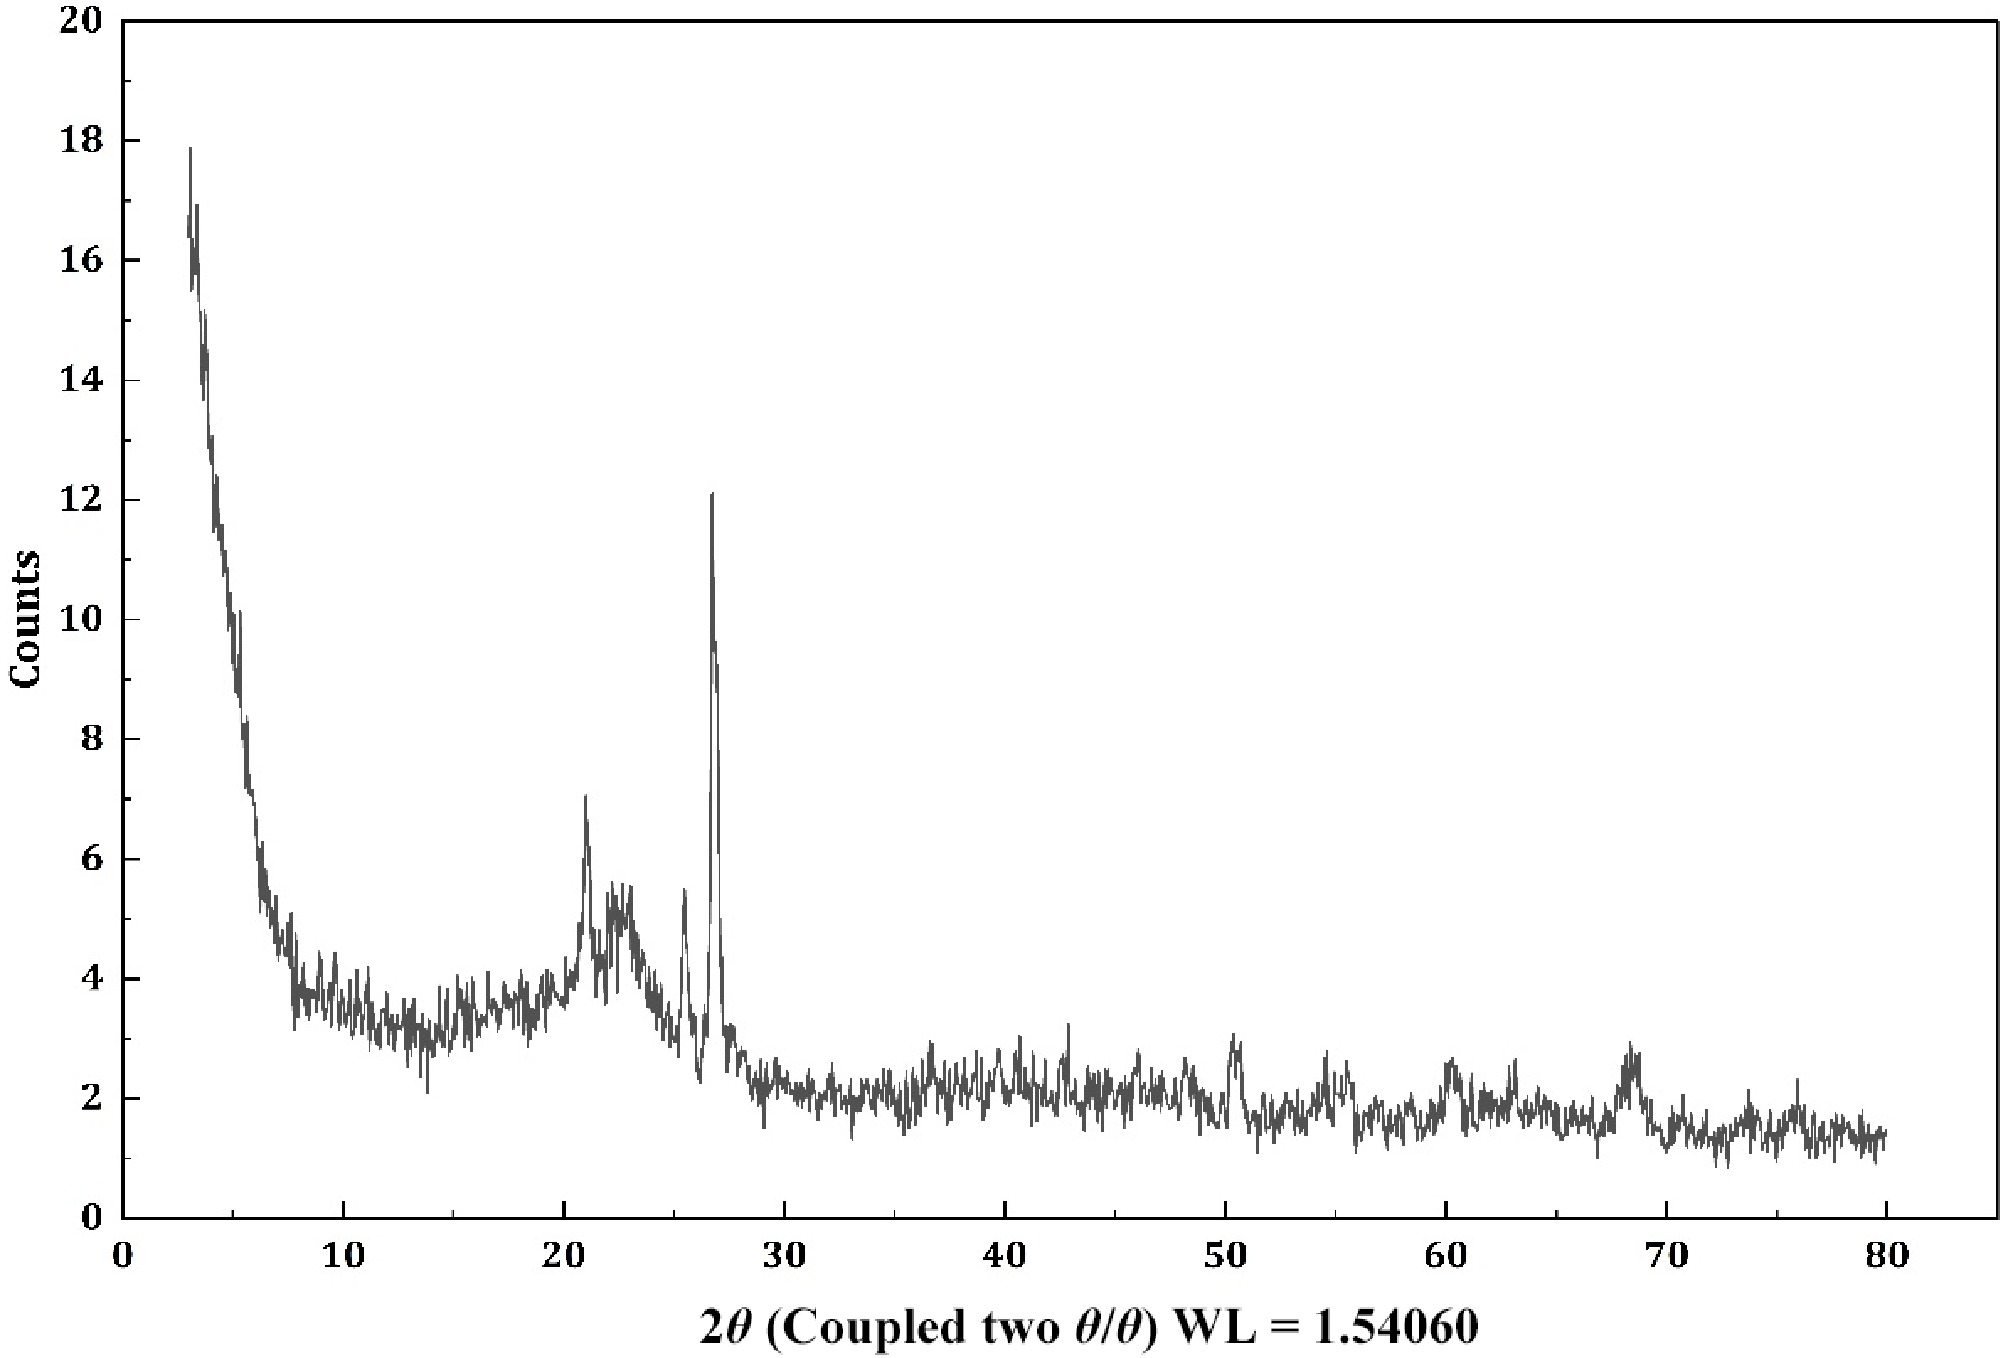
Figure 24.
NC-TiO2-15%.
Table 7. NC-TiO2-15%.
Index Angle d Value Net intensity Gross intensity Rel. intensity 1 21.04192 4.218621 73.44926 190.5117 0.360974 2 22.35821 3.973146 37.3143 152.4734 0.183385 3 25.48732 3.492007 70.15038 154.1491 0.344761 4 26.83473 3.319647 203.4755 277.7565 1 5 48.18738 1.886927 21.32602 75.40805 0.104809 6 50.3915 1.809438 29.20418 78.74663 0.143527 7 50.57415 1.803331 27.97095 77.13333 0.137466 8 60.25434 1.534704 26.38271 76.25182 0.12966 9 63.12379 1.471669 18.67752 70.67654 0.091792 10 67.951 1.378395 17.38403 60.18227 0.085436 11 68.04842 1.376659 26.13263 69.04674 0.128431 Figure 25 shows the comparative XRD graphs for NC-TiO2-5%, NC-TiO2-10%, and NC-TiO2-15%. A comparative analysis of the XRD patterns reveals that increasing TiO2 content from 5% to 15% enhances the intensity and sharpness of diffraction peaks, particularly around 2θ = 26–27°, corresponding to the primary anatase TiO2 (101) plane. The NC-TiO2-10% sample displays the most detailed peak structure, suggesting an optimal balance between the amorphous nanocellulose matrix and crystalline TiO2 nanoparticles. The d-spacing values across all samples remain consistent for major peaks (e.g., ~3.32 Å for the strongest peak), confirming that the TiO2 crystalline structure is preserved regardless of composition. However, the relative intensity of peaks increases with TiO2 content, reflecting a higher proportion of crystalline material. The amorphous scattering from nanocellulose is most pronounced in the 5% sample, as evidenced by broader peaks and lower relative intensities, while the 15% sample shows a stronger TiO2 influence, with sharper peaks and reduced amorphous background.
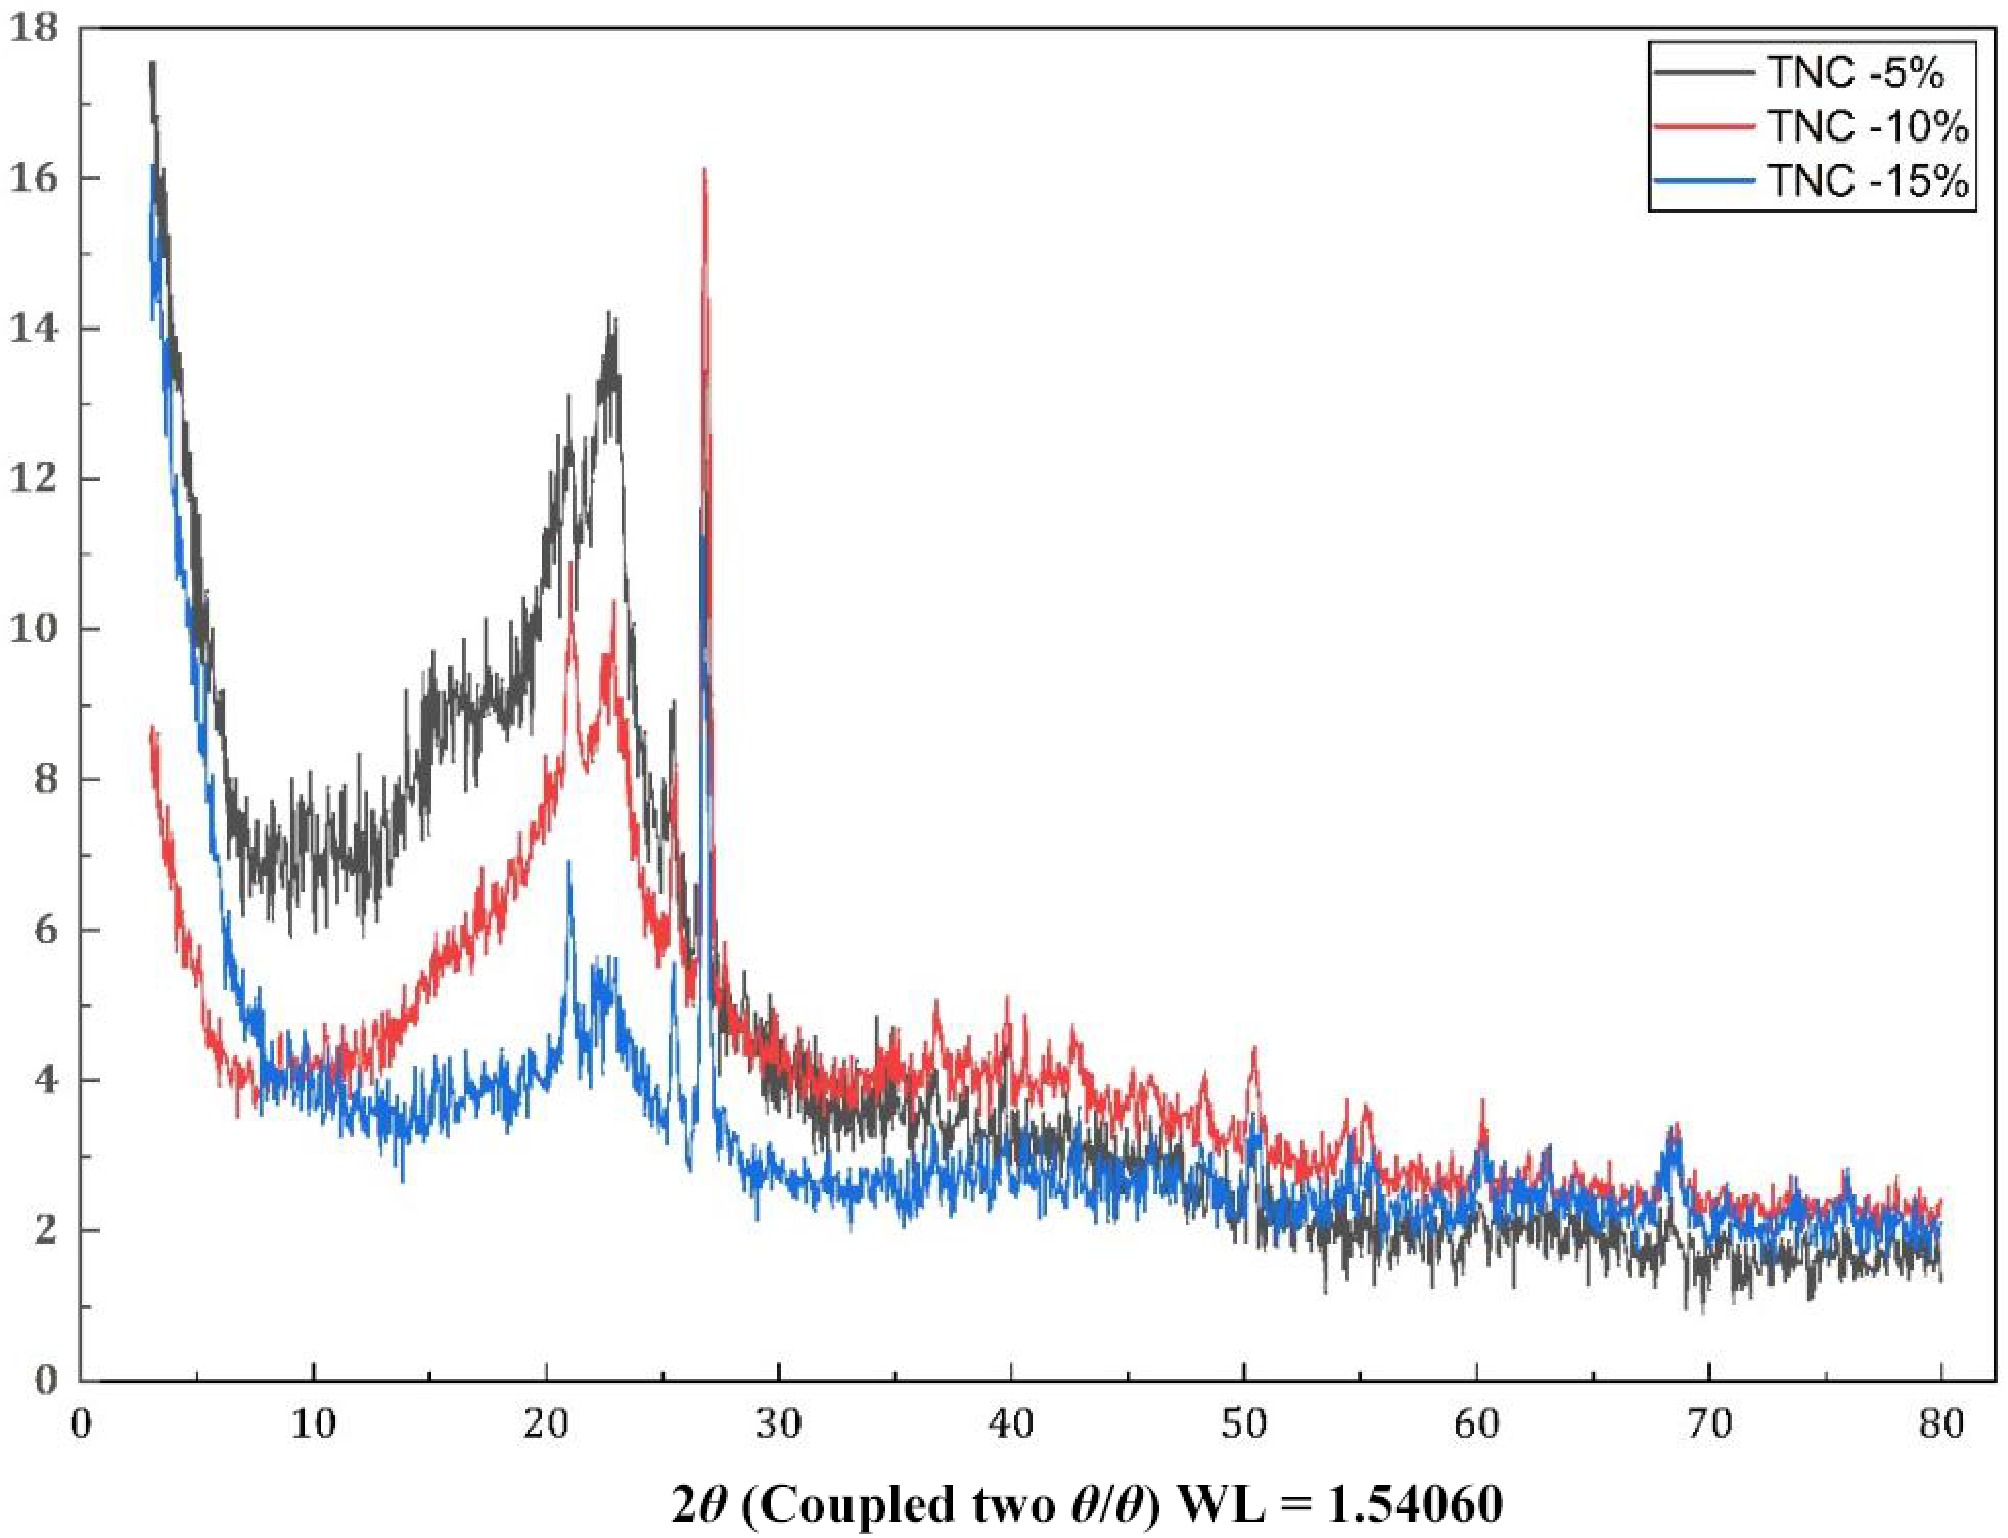
Figure 25.
Comparison of NC-TiO2-5%, NC-TiO2-10%, and NC-TiO2-15%.
These results indicate successful incorporation of TiO2 nanoparticles into the nanocellulose matrix, with higher TiO2 content enhancing crystallinity. The NC-TiO2-10% composite may offer a unique structural balance, making it suitable for applications requiring both matrix flexibility and filler crystallinity, such as photocatalysis or composite reinforcement. Further analysis, such as peak deconvolution or phase quantification, could provide additional insights into the TiO2 phase distribution and matrix-filler interactions.
The X-ray diffraction (XRD) patterns of the nanocellulose-TiO2 composites confirmed the successful incorporation of TiO2 nanoparticles into the matrix. Distinct diffraction peaks corresponding to anatase TiO2 were observed at approximately 2θ = 25.3° (101), 48.0° (200), 53.9° (105), 55.1° (211), and 62.7° (204). A minor rutile phase was detected through weaker peaks near 27.4° (110) and 36.1° (101). These results match JCPDS Card No. 21-1272 (anatase) and 21-1276 (rutile), confirming the presence of mixed-phase TiO2.
The anatase (101) reflection, typically the most intense peak, was predominant in all samples, indicating anatase as the major crystalline phase. The rutile content was semi-quantitatively estimated using the Spurr & Myers method, yielding ~18–20% rutile and ~80% anatase in the composite. These findings are consistent with the TiO2 source material.
Crystallite size was calculated using the Scherrer equation:
$ D=k\lambda /(\beta \cos\theta ) $ (1) The crystallite size of TiO2 was estimated using the Scherrer equation by considering different values of peak broadening (FWHM, β) for the dominant anatase (101) reflection. When a lower peak broadening of 0.30° (0.00524 rad) was assumed, the calculated crystallite size was approximately 29.5 nm. With an intermediate FWHM value of 0.35° (0.00611 rad), the crystallite size decreased to about 25.3 nm, while a higher peak broadening of 0.40° (0.00698 rad) resulted in a smaller crystallite size of approximately 22.2 nm. This trend clearly indicates an inverse relationship between peak broadening and crystallite size, confirming that the TiO2 present in the composites retains its nanoscale crystalline nature. The XRD results not only confirm the presence of TiO2, addressing concerns from EDX surface analysis, but also demonstrate that the crystalline structure of TiO2 remains intact during composite fabrication.
The X-ray diffraction (XRD) pattern (Cu Kα, λ = 1.5406 Å) of the sample shows clear reflections characteristic of TiO2. Strong reflections near 2θ = 25.3° and 48.0° correspond to the anatase (101) and (200) planes, confirming anatase as the dominant crystalline phase. Additional diffraction peaks near 27.4° and 36.1° indicate the presence of rutile, particularly the rutile (110) and (101) reflections. Using the Spurr & Myers method, the rutile content was estimated to be approximately 18.6%, while anatase accounted for nearly 81.4%. These results demonstrate that the sample is primarily anatase TiO2 with a minor rutile component.
It should be noted that the photocatalytic functionality of the developed nanocellulose-TiO2 epoxy composite is inferred based on the confirmed presence of TiO2, its dispersion characteristics within the polymer matrix, and the structural integrity observed through microstructural analysis. Direct photocatalytic performance evaluation, such as dye degradation or antimicrobial activity testing, was beyond the scope of the present study, which primarily focuses on structural development, mechanical performance, and thermal stability assessment for emergency-use feasibility. Therefore, application-oriented claims related to photocatalytic activity should be interpreted as potential functionality rather than experimentally validated performance.
-
Table 8 gives the summary of the suitability of nanocellulose-TiO2 composites (5%, 10%, and 15% TiO2) for biomedical and automotive emergency-use applications, based on experimental data from FTIR, PSA, EDX, DSC, ZPA, and SEM analyses. The composites' biocompatibility (EDX: 75%−55% C, 25%−45% O), mechanical strength (FTIR: Ti–O at 699−742 cm−1), thermal stability (DSC: ~200 °C), and photocatalytic potential (FTIR) are assessed for six applications: bone implants, tissue scaffolds, wound dressings, antibacterial coatings, drug delivery systems, and dental restorations. Suitability is rated as high, moderate, or low, with the 10%-TiO2 composite often optimal due to balanced dispersion (SEM, PSA: 267.8 nm) and stability (ZPA: –19.0 mV), though uneven TiO2 dispersion (EDX) limits performance. References (e.g., Abitbol et al.[1]; Toro et al.[21]) support the analysis.
Table 8. Suitability of nanocellulose-TiO2 composites for biomedical applications.
Biomedical applications Suitability Rationale based on test data Bone implants Moderate The 10%-TiO2 composite offers strong mechanical properties (FTIR: Ti–O absorption at 699.44 cm−1, 64.35% T; SEM: balanced TiO2 dispersion) and thermal stability (DSC: decomposition onset ~200 °C), potentially suitable for load-bearing implants. EDX shows no Ti at 4.508 keV, indicating uneven TiO2 dispersion, which may limit bioactivity. Nanocellulose's composition (75% C, 25% O in EDX) suggests biocompatibility for bone integration, but 15% TiO2's aggregation (SEM: 100–500 nm clusters) reduces porosity for osseointegration. Lack of in vitro or in vivo validation limits confidence[4]. Tissue scaffolds Moderate The 10%-TiO2 composite's fibrous, porous matrix (SEM) and colloidal stability (ZPA: –19.0 mV) may promote cell adhesion and growth. PSA indicates a 267.8 nm median particle size, potentially ideal for scaffold porosity. Composition (EDX: high C, O) and moderate polydispersity (PI: 0.468) suggest suitability for tissue engineering. Thermal stability up to 200 °C (DSC) supports sterilization. The 15%-TiO2 aggregation reduces porosity, lowering suitability. Lack of in vitro or in vivo validation limits confidence[ 1]. Wound dressings Moderate The 10% and 15%-TiO2 composites show potential antimicrobial activity (FTIR: Ti–O peaks at 699–742 cm−1), but EDX's lack of Ti detection suggests inconsistent dispersion, limiting pathogen resistance (e.g., E. coli). The flexible nanocellulose matrix (SEM) and composition (EDX) suggest biocompatibility, but moisture loss at 71–148 °C (DSC) requires drying to prevent degradation. The 5%-TiO2 lacks sufficient TiO2 for antimicrobial effects. Lack of in vitro or in vivo validation limits confidence[ 21]. Antibacterial coatings Moderate TiO2's antimicrobial potential (FTIR: Ti–O bonds) is promising, with 15% TiO2 offering high stability (ZPA: –27.0 mV) for uniform coatings. However, SEM shows aggregation at 15%, reducing photocatalytic efficiency. The 10% TiO2 balances dispersion (PSA: 267.8 nm) and functionality, but EDX's no-Ti result indicates uneven coverage. Nanocellulose's composition ensures potential safety, needing optimization. Lack of in vitro or in vivo validation limits confidence[22]. Drug delivery systems Moderate The 10%-TiO2 composite's particle size (PSA: 267.8 nm median, PI: 0.468) and colloidal stability (ZPA: –19.0 mV) may be suitable for targeted drug delivery, potentially leveraging the enhanced permeability and retention effect. Nanocellulose's composition (EDX: 75% C, 25% O) suggests biocompatibility for systemic use. SEM confirms a porous matrix for drug loading, but EDX's uneven TiO2 dispersion may limit controlled release. The 5%-TiO2 is less effective due to lower functionality. Lack of in vitro or in vivo validation limits confidence[1]. Dental restorations Moderate The 10%-TiO2 composite's mechanical strength (FTIR: strong Ti–O and matrix bonds) and thermal stability (DSC: ~200 °C) may suit dental fillings or crowns. SEM shows a fibrous matrix for bonding, but 15% TiO2's aggregation reduces uniformity, impacting aesthetics. EDX's lack of Ti detection suggests limited antimicrobial benefits from TiO2. Nanocellulose's composition supports potential oral use, but dispersion needs improvement. Lack of in vitro or in vivo validation limits confidence[21]. From an emergency biomedical perspective, the presence of nanocellulose offers a bio-derived, structurally compatible reinforcement phase, while TiO2 contributes to surface stability and potential antimicrobial functionality. These attributes make the composite a promising candidate for temporary orthopedic supports, protective casings for emergency medical devices, and short-term implantable or contact surfaces subject to mechanical stress. Furthermore, the lightweight nature of the composite enhances mobility and rapid deployment efficiency in disaster-relief scenarios. Table 9 presents the application-oriented evaluation of the developed nanocellulose-TiO2 composites for various automotive emergency scenarios. The suitability classification is derived from a correlation between mechanical performance, thermal stability, and dispersion characteristics observed in experimental analyses. Applications such as lightweight panels, structural trims, and battery enclosures demonstrate high suitability due to the optimized balance of strength and heat resistance at 5%−10% filler loading. Moderate suitability in impact protection and fire-exposed components reflects the sensitivity of performance to nanoparticle dispersion and agglomeration effects. Overall, the table highlights the potential of the optimized composite for multifunctional and safety-critical automotive applications.
Table 9. Suitability of nanocellulose-TiO2 composites for automotive emergency use applications.
Automotive emergency use applications Suitability Rationale based on test data Lightweight interior body panels High Tensile testing shows improved strength and stiffness at optimized filler loading, while nanocellulose reinforcement reduces overall composite density. Impact protection panels Moderate Enhanced mechanical performance at 5%−10% loading indicates improved stress transfer; controlled dispersion minimizes crack initiation compared to 15% loading. Emergency vehicle structural trims High Thermal stability analysis demonstrates improved resistance to degradation, supporting use in elevated-temperature operating environments. Thermal shielding layers (engine bay zones) High TGA results indicate enhanced thermal resistance due to TiO2 incorporation, delaying thermal decomposition compared to neat epoxy. Fire-exposed interior modules Moderate Improved thermal stability supports short-term exposure; however, performance depends on optimized filler dispersion to avoid agglomeration-related weaknesses. Battery enclosure protective casings (EV safety) High Combined mechanical strength and thermal stability at 5%−10% loading provide structural reinforcement and heat tolerance for emergency scenarios. Temporary emergency repair panels High Good tensile performance and structural integrity at moderate filler loading enable lightweight, moldable repair solutions. -
Table 10 presents a comparative evaluation of the developed composite with commonly used materials in emergency sector applications, based on tensile strength and functional advantages. The results indicate that the developed composite (~52 MPa) offers superior or comparable mechanical performance against conventional polymers and low-grade composites. Additionally, it demonstrates enhanced multifunctional benefits such as improved thermal stability, lightweight characteristics, and potential surface functionality.
Table 10. Comparison with existing materials.
Material used in emergency sector Typical tensile
strength (MPa)Comparison with developed
composite (~52 MPa)Specific advantage of present composite Conventional epoxy resin 30−45 MPa ~15%−20% higher strength Improved load-bearing capacity with better thermal stability due to TiO2 reinforcement ABS (Acrylonitrile Butadiene Styrene)–used in interior panels 35−45 MPa ~15%−30% higher strength Higher structural rigidity while maintaining lightweight characteristics Polypropylene (PP)–automotive trims and emergency covers 25−35 MPa ~50%−100% higher strength Significantly improved tensile performance with enhanced stiffness Glass Fiber Reinforced Polymer (low-grade, 15%−20% GF) 50−70 MPa Comparable (within lower bound range) Similar strength with potentially lower density and improved surface functionality Aluminum (AA 3003–lightweight panels) 90−130 MPa Lower tensile strength but lighter and corrosion-resistant Reduced weight, easier moldability, no corrosion issues HDPE–protective covers 20−30 MPa Nearly double the strength Superior mechanical integrity and better thermal resistance Fire-retardant polymer composites (basic grade) 40−55 MPa Comparable to upper range Added multifunctionality (thermal stability + potential photocatalytic surface activity) -
The present investigation systematically elucidated the structure-property-performance relationship of nanocellulose-TiO2 epoxy composites containing 5 wt%, 10 wt%, and 15 wt% TiO2 through integrated mechanical, thermal, structural, and physicochemical characterization. The key conclusions are summarized as follows:
(1) Optimized reinforcement at 10 wt% TiO2: the 10 wt% composite exhibited superior tensile strength (~52 MPa) and Young's modulus (~3.3 GPa), demonstrating efficient stress transfer facilitated by uniform nanoparticle dispersion and strong matrix-filler.
(2) Robust interfacial interaction: FTIR analysis confirmed Ti–O–Ti lattice vibrations and hydrogen-bond-mediated interactions between TiO2 and nanocellulose. The 10 wt% formulation showed the most effective interfacial coupling, directly correlating with enhanced mechanical integrity.
(3) Preserved crystalline functionality: XRD patterns verified the stable anatase phase of TiO2 across all compositions, ensuring retention of photocatalytic potential alongside structural stability.
(4) Dispersion-dependent performance: SEM and PSA analyses revealed homogeneous nanoparticle distribution at 10 wt% loading, whereas 15 wt% exhibited noticeable agglomeration (200–500 nm clusters), leading to reduced mechanical efficiency. This confirms that dispersion quality governs multifunctional performance more critically than filler quantity.
(5) Thermal stability within practical limits: DSC results indicated composite stability up to ~200 °C, supporting applicability in moderate-temperature automotive and biomedical structural components.
(6) Colloidal stability and particle characteristics: Zeta potential values (–19 to –27 mV) and moderate polydispersity indicate practically stable dispersions, with the 10 wt% composite offering the most balanced reinforcement profile.
Overall, the 10 wt% TiO2 nanocellulose composite emerges as the scientifically optimized formulation, delivering a synergistic balance of mechanical strength, structural stability, controlled dispersion, and multifunctional capability. The findings establish a clear materials design strategy for developing sustainable, high-performance nanocomposites for advanced automotive and biomedical applications.
To further strengthen translational relevance, future research should focus on quantitatively validating the functional attributes of the composite system. Detailed photocatalytic evaluation through UV-assisted dye degradation kinetics, reactive oxygen species (ROS) quantification, and standardized antimicrobial testing will provide direct evidence of surface reactivity and environmental remediation potential. In parallel, comprehensive biological validation, including in vitro cytotoxicity (MTT/XTT assays), cell adhesion and proliferation studies, hemocompatibility testing, and controlled in vivo investigations, will be essential to confirm clinical safety and biomedical applicability. Long-term durability assessments such as accelerated aging, fatigue resistance, impact performance, and environmental exposure testing under simulated emergency-use conditions will establish structural reliability. Finally, pilot-scale processing studies coupled with life-cycle analysis should be undertaken to evaluate scalability, manufacturing feasibility, cost efficiency, recyclability, and environmental impact, thereby enabling responsible industrial implementation of this sustainable nanocomposite platform.
The authors would like to express their sincere gratitude to all those who contributed to the completion of this paper. We also acknowledge the support of JSPM's Rajarshi Shahu College of Engineering, Department of Mechanical Engineering for providing necessary facilities. This research received no external funding.
-
The authors confirm their contributions to the paper as follows: conceptualization: Sonawane P, More S; methodology: Sonawane P, Jadhav S; software, visualization: Kumar A, Wagh S; validation: Sonawane P, More S, Kautkar N; formal analysis: Jadhav S, Khare K; investigation: Sonawane P, Avthankar A, Campli S; resources: More S, Deore M; data curation: Avthankar A, Campli S; writing original draft preparation: Sonawane P, Avthankar A; writing review and editing: More S, Kautkar N, Deore M. All authors reviewed the results and approved the final version of the manuscript.
-
All data generated or analyzed during this study are included in this published article.
-
The authors declare that they have no conflict of interest.
- Copyright: © 2026 by the author(s). Published by Maximum Academic Press on behalf of Nanjing Tech University. This article is an open access article distributed under Creative Commons Attribution License (CC BY 4.0), visit https://creativecommons.org/licenses/by/4.0/.
-
About this article
Cite this article
Sonawane P, Avthankar A, Jadhav S, Kumar A, Campli S, et al. 2026. Nanocellulose TiO2 composites: sustainable material safety and performance for automotive and biomedical emergency applications. Emergency Management Science and Technology 6: e007 doi: 10.48130/emst-0026-0008 

Nanocellulose TiO2 composites: sustainable material safety and performance for automotive and biomedical emergency applications
- Received: 05 November 2025
- Revised: 26 March 2026
- Accepted: 19 May 2026
- Published online: 17 July 2026
Abstract: This study develops and evaluates nanocellulose TiO2 epoxy composites containing 5%, 10%, and 15% TiO2 to identify a multifunctional material suitable for next-generation safety and emergency-response applications. The composites were prepared by using an epoxy nanocellulose matrix reinforced with TiO2 nanoparticles, followed by curing and controlled drying. FTIR analysis confirmed Ti-O bonding (699−742 cm−1) and stable organic functional groups, while high-magnification SEM revealed a fibrous nanocellulose network with progressively increased TiO2 aggregation at higher loadings. XRD verified successful nanoparticle incorporation, with dominant anatase peaks and minor rutile reflections. PSA and zeta-potential measurements indicated moderately polydisperse but stable dispersions (PI: 0.39–0.46; –19.0 to –27.0 mV). DSC thermograms showed moisture loss between 70−140 °C and decomposition onset near 200 °C, confirming suitability for moderate-temperature operational environments. Mechanical testing identified the 10% TiO2 composite as optimal, exhibiting the highest tensile strength (52.4 MPa) and Young's modulus (3.3 GPa) due to enhanced interfacial bonding and stress-transfer efficiency. Collectively, the results demonstrate that the 10% TiO2 nanocellulose composite provides the best balance of mechanical strength, thermal stability, dispersion, and structural integrity, making it a promising candidate for multifunctional emergency applications such as rapid-deployment biomedical support structures, lightweight automotive panels, and filtration or protective systems.