-
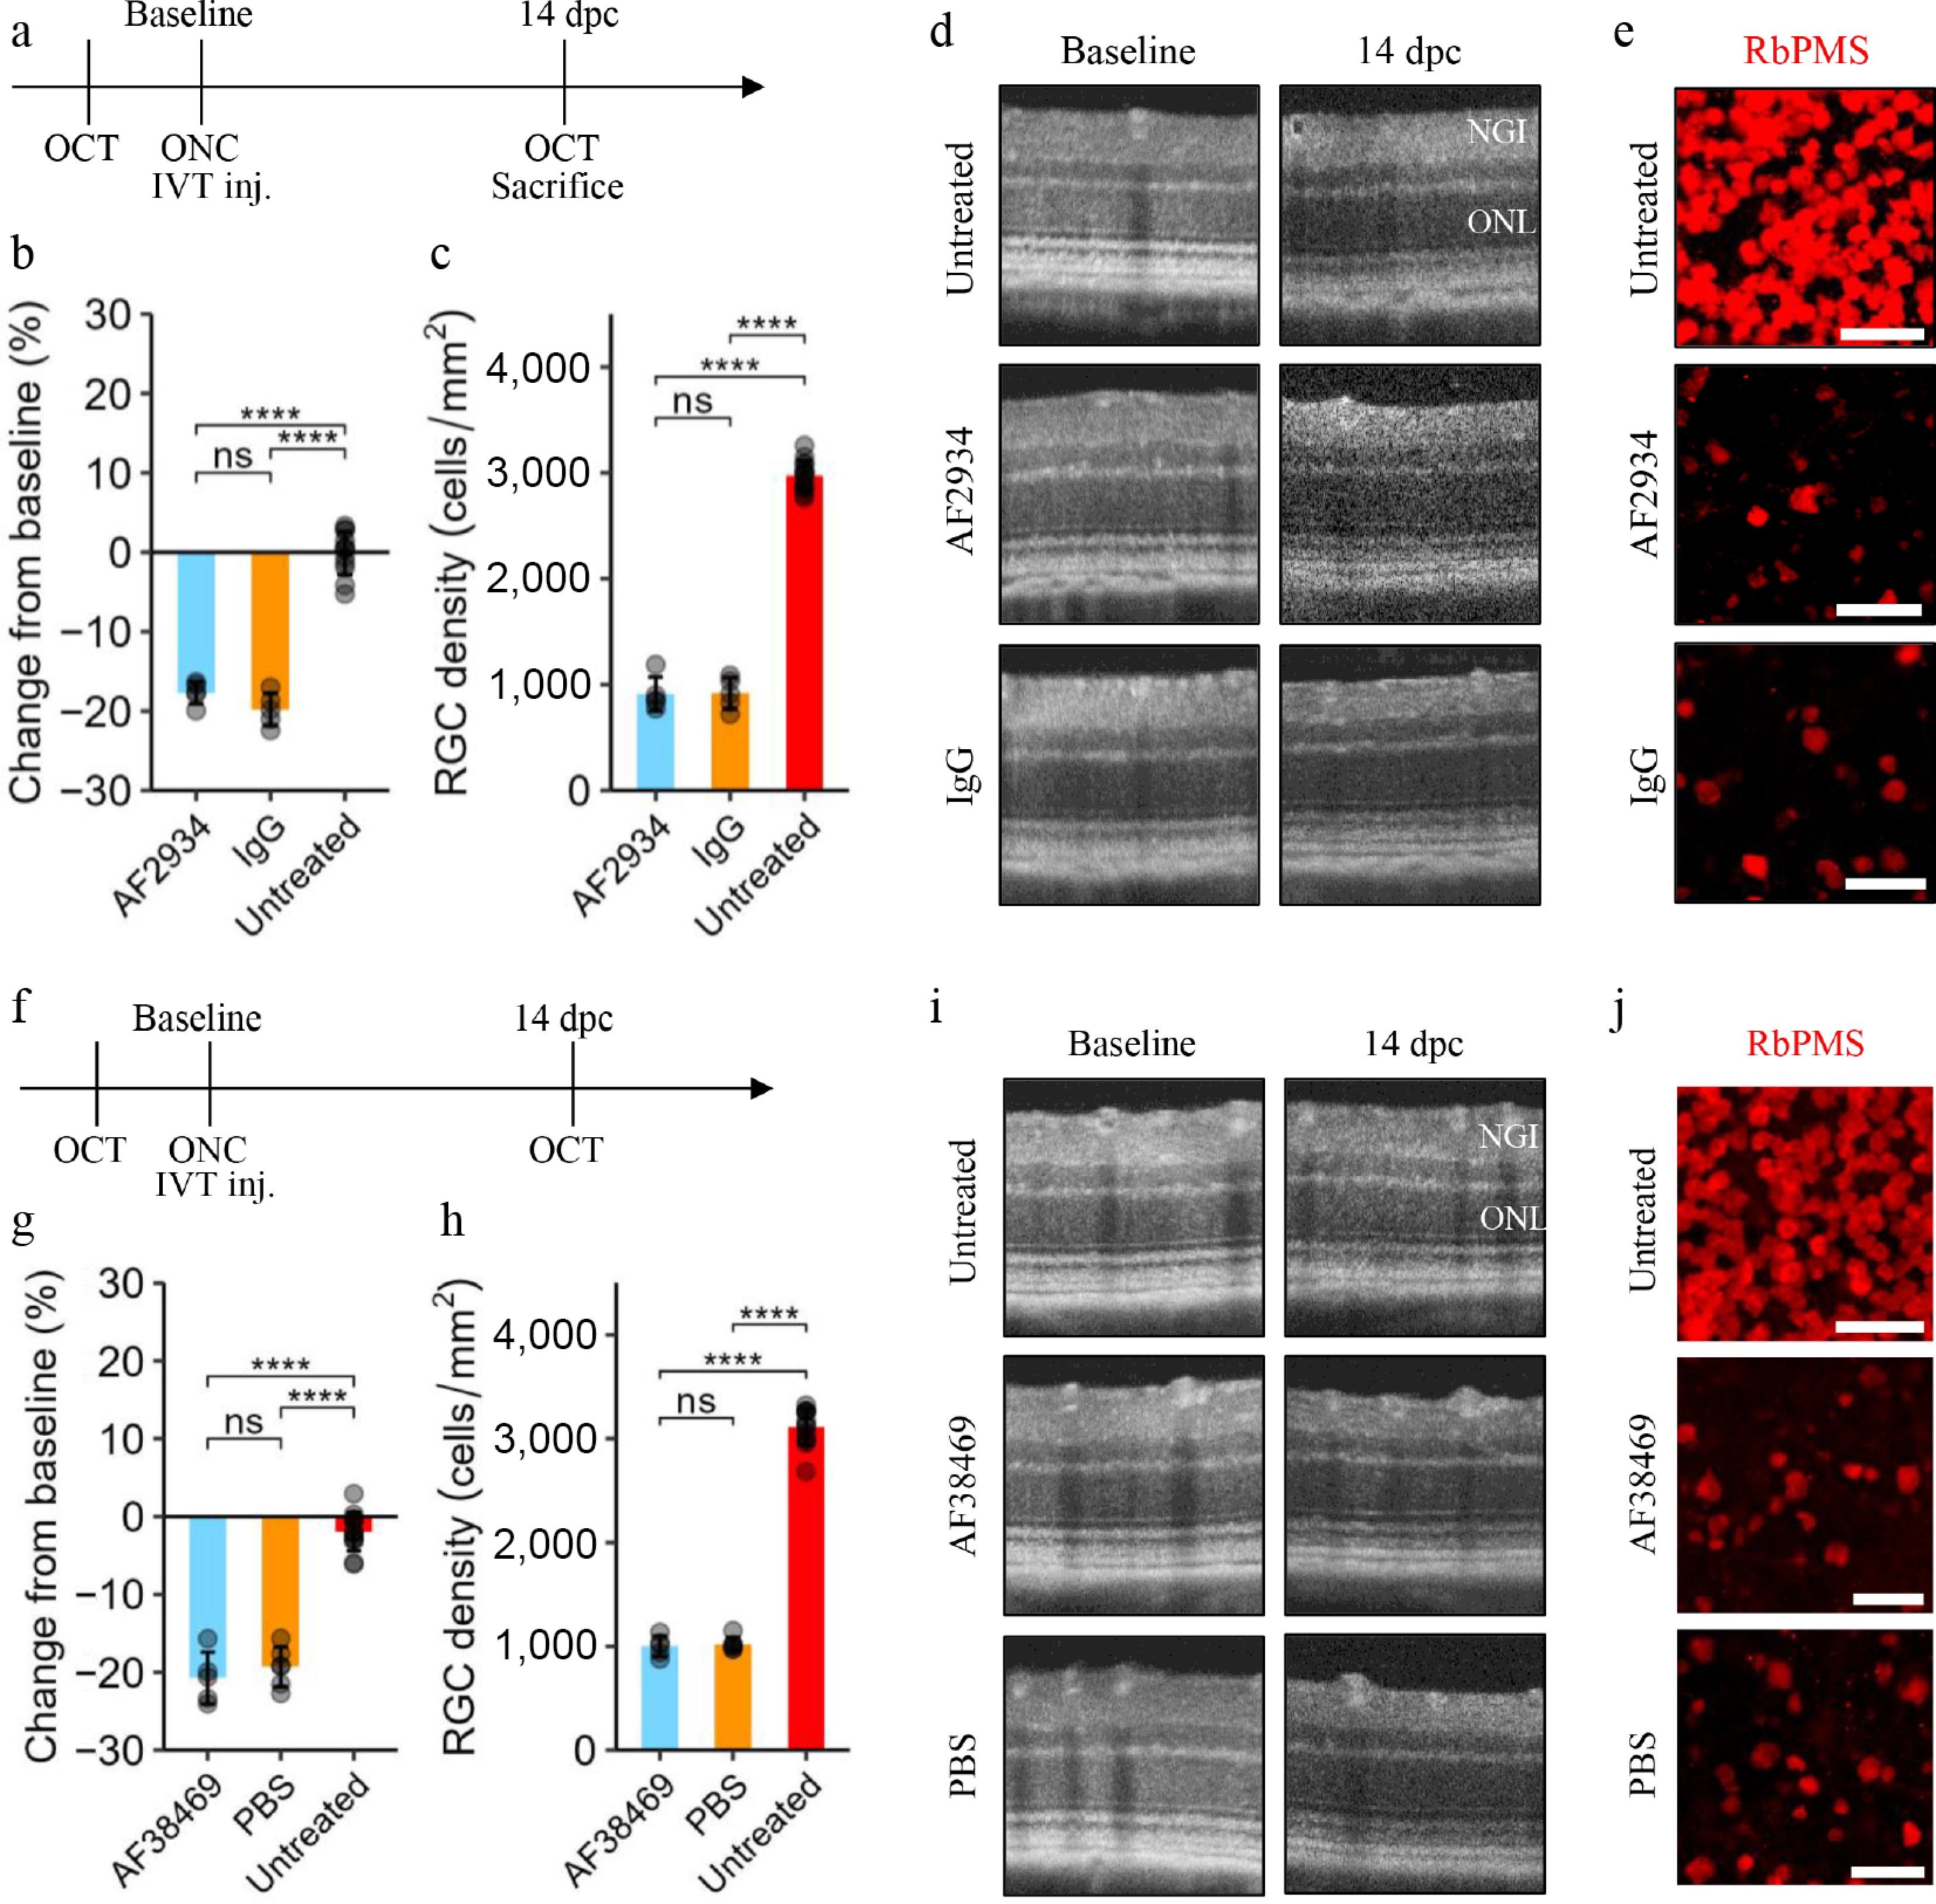
Figure 1.
Sortilin inhibition using a polyclonal antibody or small-molecule inhibitor does not preserve inner retinal structure. (a) Experimental plan: following baseline optical coherence tomography (OCT) scans, C57BL6/JRj mice were subjected to optic nerve crush (ONC) in one eye and a sham procedure in the other eye. Immediately after, mice were randomized to receive intravitreal (IVT) injection of either the anti-sortilin polyclonal antibody (pAb) AF2934 or IgG control (2 µL of 1 µg/µL) in the crush eye, while the other served as an untreated sham control. Mice were sacrificed following OCT at 14 day post-crush (dpc). (b) Bar plot (mean ± SD) showing quantification of the change from baseline of the combined thickness of the nerve fiber, ganglion cell, and inner nuclear layer, denoted the NGI thickness. Statistical comparisons were performed using one-way ANOVA followed by Tukey's test (n > 5). (c) Bar plot (mean ± SD) showing quantification of the density of RNA-binding protein with multiple splicing (RbPMS) positive retinal ganglion cells (RGCs) in retinal flat mounts. Statistical comparisons were performed by one-way ANOVA followed by Tukey's test (n > 5). (d) Representative OCT scans and (e) areas from anti-RbPMS (red) immunostained retinal flat mounts are shown. Scale bars: 50 µm. (f) Experimental plan: as in (a), C57BL6/JRj mice were randomized to receive IVT injection of the small-molecule inhibitor AF38469 (2 µL of 1 µg/µL) or vehicle (PBS-1% DMSO) in the crush eye. (g) Bar plot (mean ± SD) showing quantification of the change from baseline of NGI thickness. Statistical comparisons were performed by one-way ANOVA followed by Tukey's test (n > 5). (h) Bar plot (mean ± SD) showing quantification of RGC density in retinal flat mounts. Statistical comparisons were performed by one-way ANOVA followed by Tukey's test (n > 5). (i) Representative OCT scans and (j) areas from anti-RbPMS (red) immunostained retinal flat mounts are shown. Scale bars: 50 µm. Significance levels: * [0.01, 0.05]; ** [0.001, 0.01]; *** [0.0001, 0.001]; **** [0, 0.0001].
-
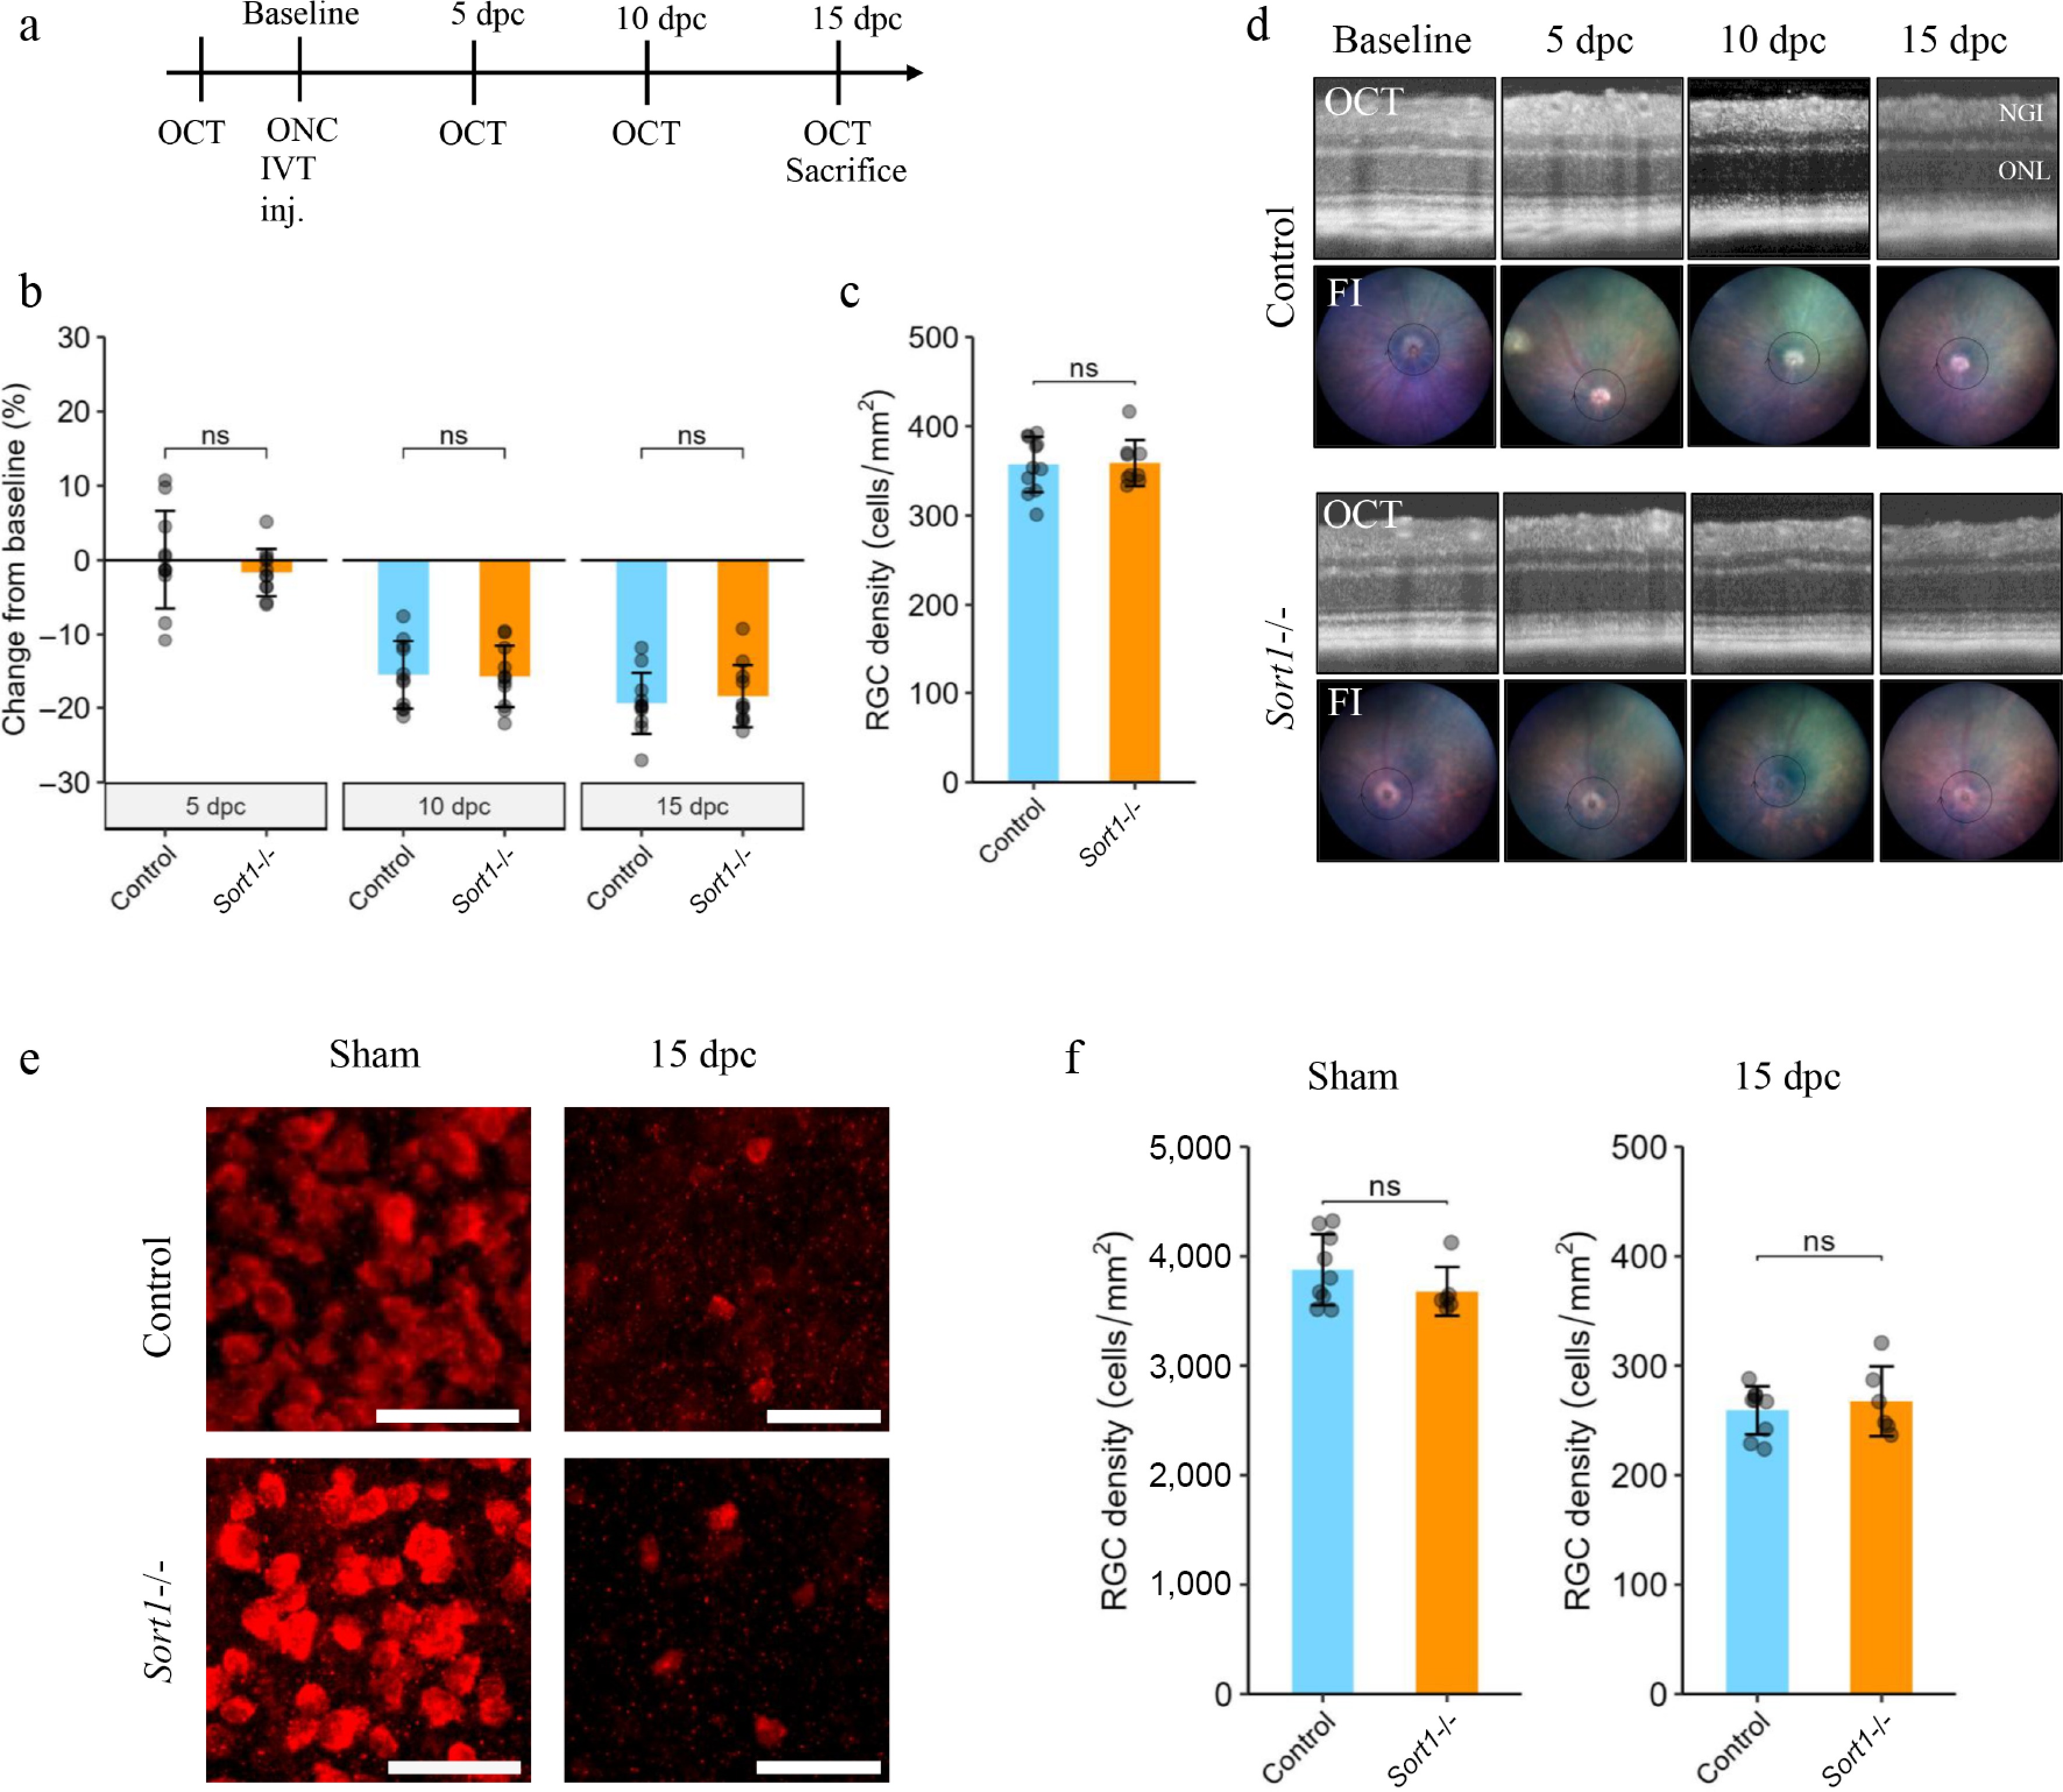
Figure 2.
Sortilin deficiency does not affect inner retinal pathology following optic nerve crush. (a) Experimental plan: 9-week-old Sort1-/- mice and age-matched C57Bl/6JBomTac wild-type mice were subjected to optic nerve crush (ONC) in the right eye. Optical coherence tomography (OCT) scans were performed at baseline and at 5, 10, and 15 day post-crush (dpc). (b) Bar plot (mean ± SD) showing quantification of change from baseline of the combined thickness of the nerve fiber, ganglion cell, and inner nuclear layer denoted the NGI thickness. Statistical comparisons were performed using linear, mixed-effects model to account for repeated measurements (n = 10–11). C. Bar plot (mean ± SD) showing quantification of RNA-binding protein with multiple splicing (RbPMS) positive retinal ganglion cells (RGCs) at 15 dpc. Statistical comparison was performed using Student's t-test (n = 10–11). (d) Representative fundus images (FI) and OCT scans at the respective dpc. (e) Representative areas from anti-RbPMS (red) immunostained retinal flat mounts in a separate replication cohort. Scale bars: 50 µm. (f) Bar plots (mean ± SD) showing quantification of RbPMS-positive RGCs 15 dpc in eyes subjected to crush (right) and the contralateral sham eyes (left). Statistical comparisons were performed using Student's t-test (n = 6–9). Significance levels: * [0.01, 0.05]; ** [0.001, 0.01]; *** [0.0001, 0.001]; **** [0, 0.0001].
-
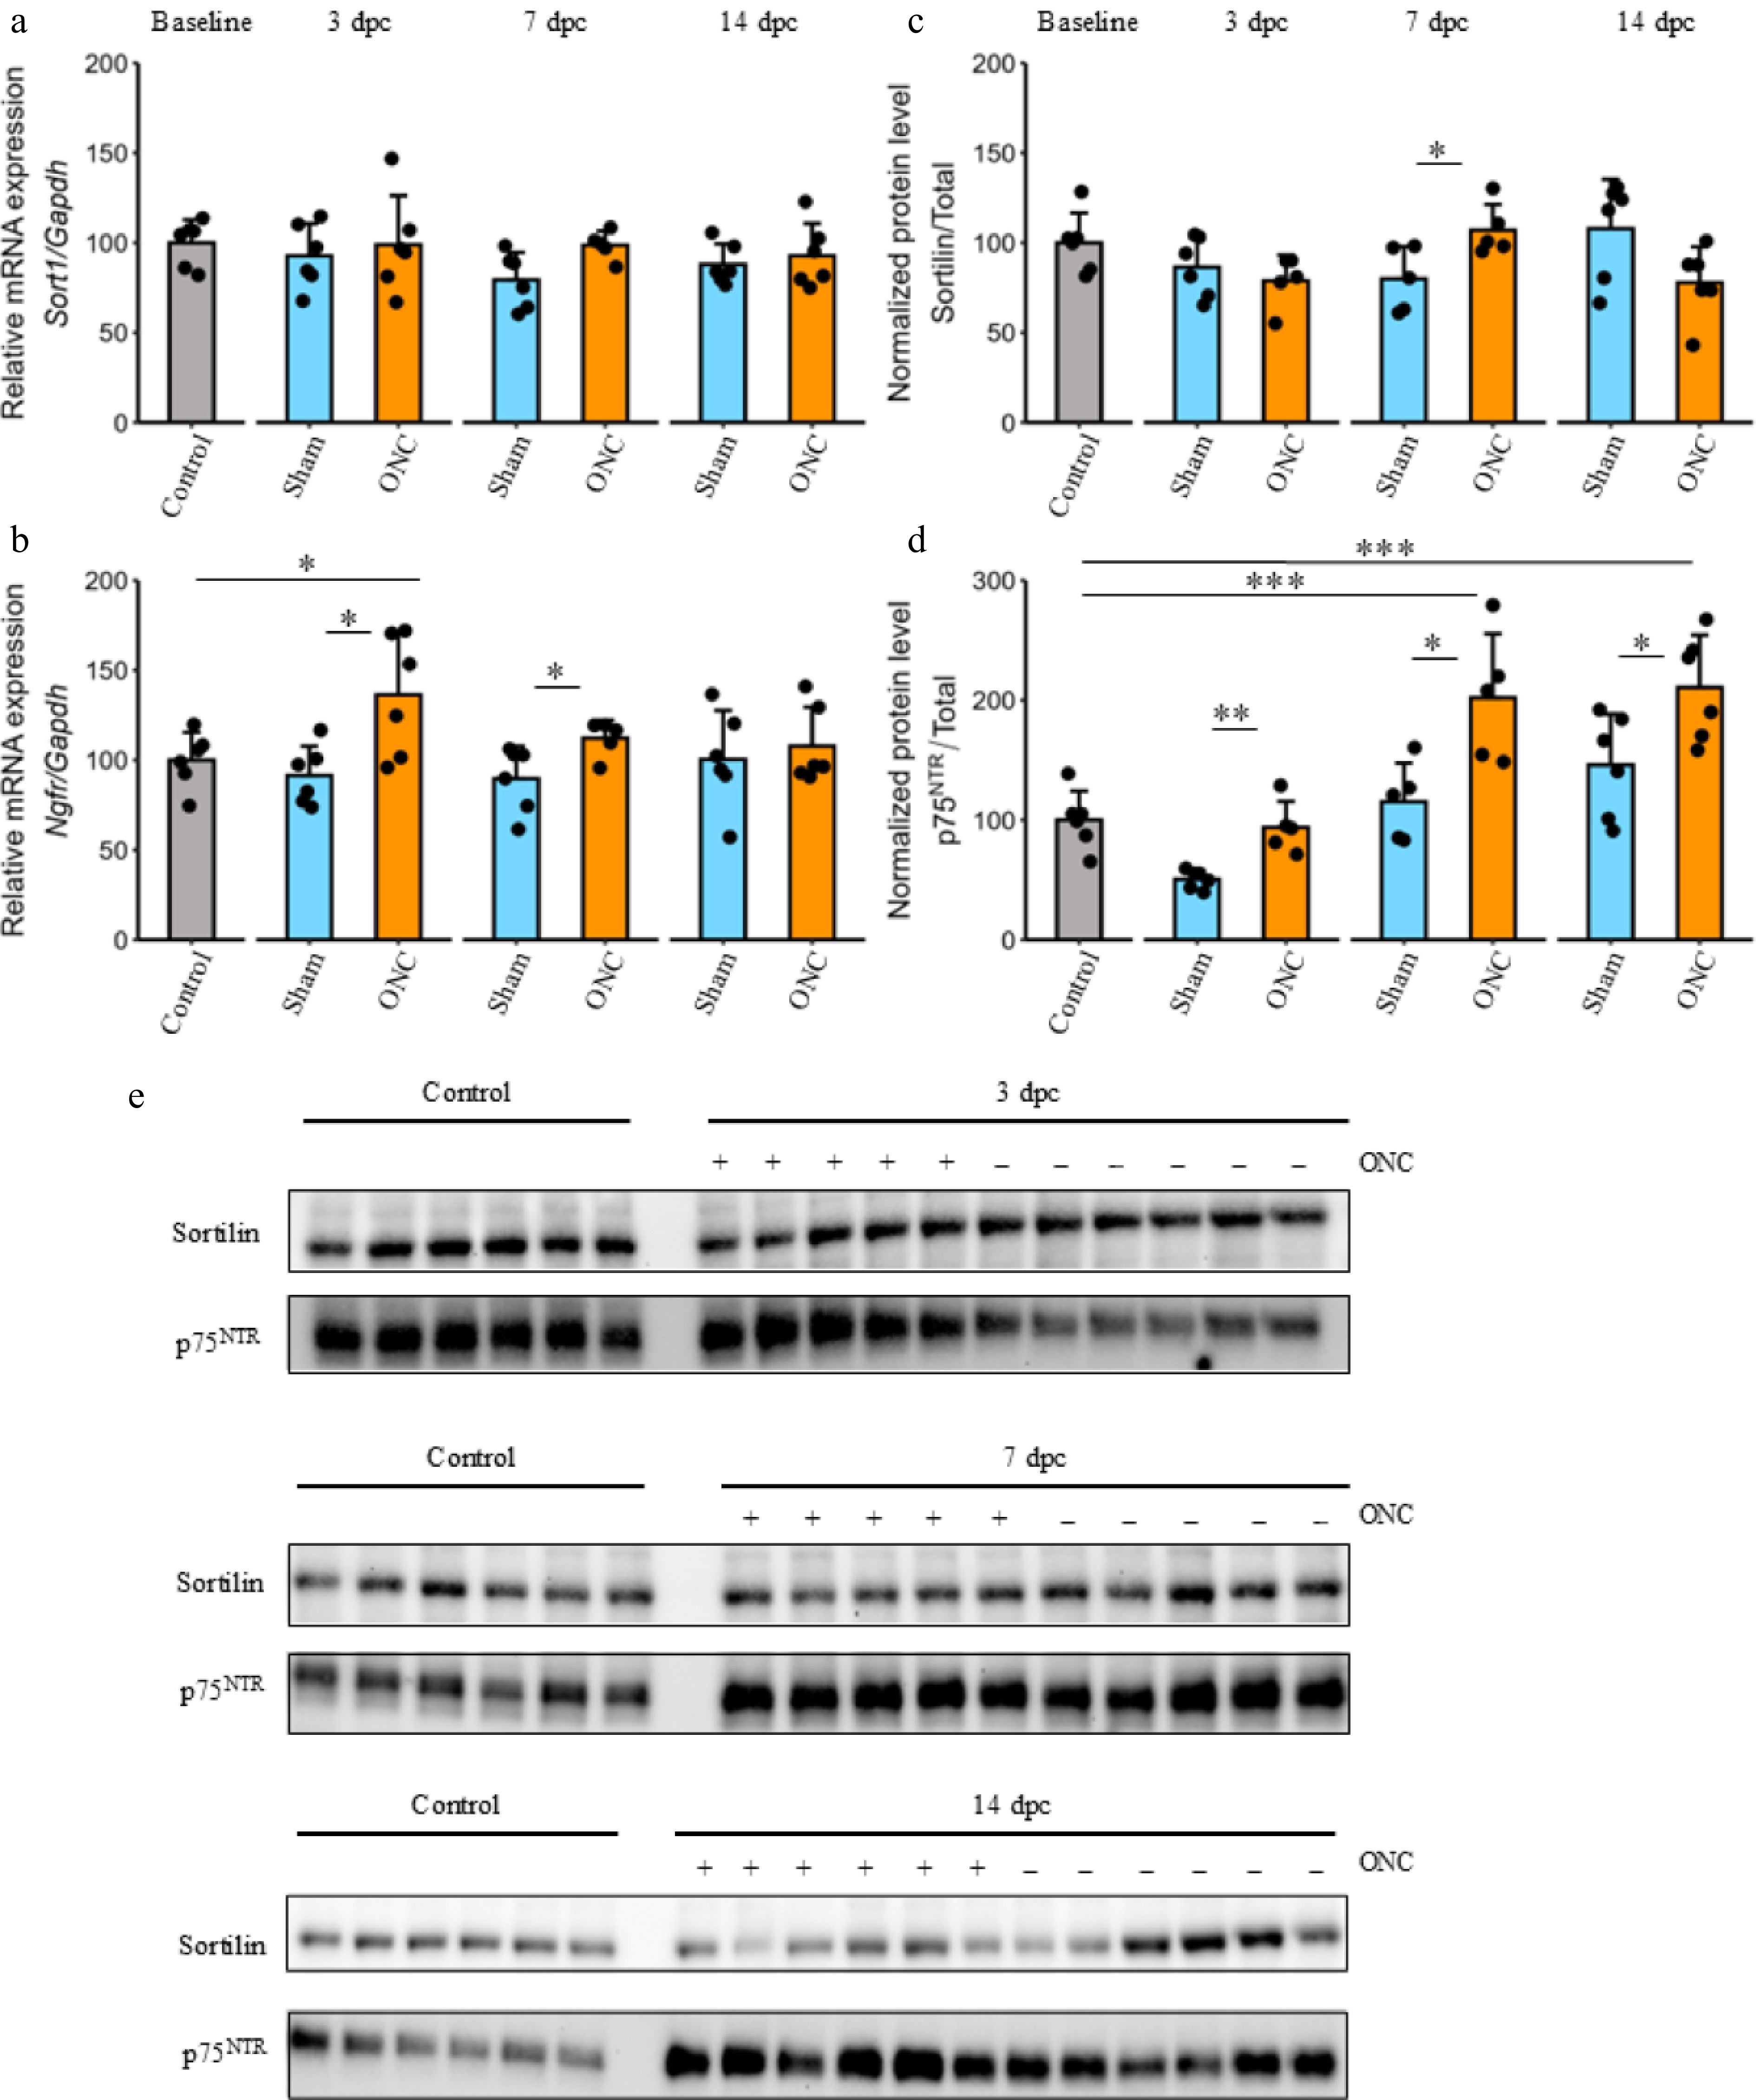
Figure 3.
Sortilin and p75NTR expression following optic nerve crush. Neuroretinal samples from control eyes not subjected to any procedure, as well as eyes subjected to optic nerve crush (ONC) or a sham procedure at 3, 7, and 14 day post-crush (dpc), were analyzed. (a), (b) Bar plots showing expression of Sort1 and Ngfr related to the endogenous control Gapdh. (c), (d) Bar plots (mean ± SD) showing quantification of sortilin and p75NTR protein levels related to total protein. (e) Western blots used for quantification. Statistical comparisons of the difference between the control and ONC group at different time points and comparisons between the ONC and the sham group at different time points were performed using two- or one-way ANOVA followed by Tukey's test and Dunnett's test, respectively (n = 5–6 at each time point). Significance levels: * [0.01, 0.05]; ** [0.001, 0.01]; *** [0.0001, 0.001]; **** [0, 0.0001].
-
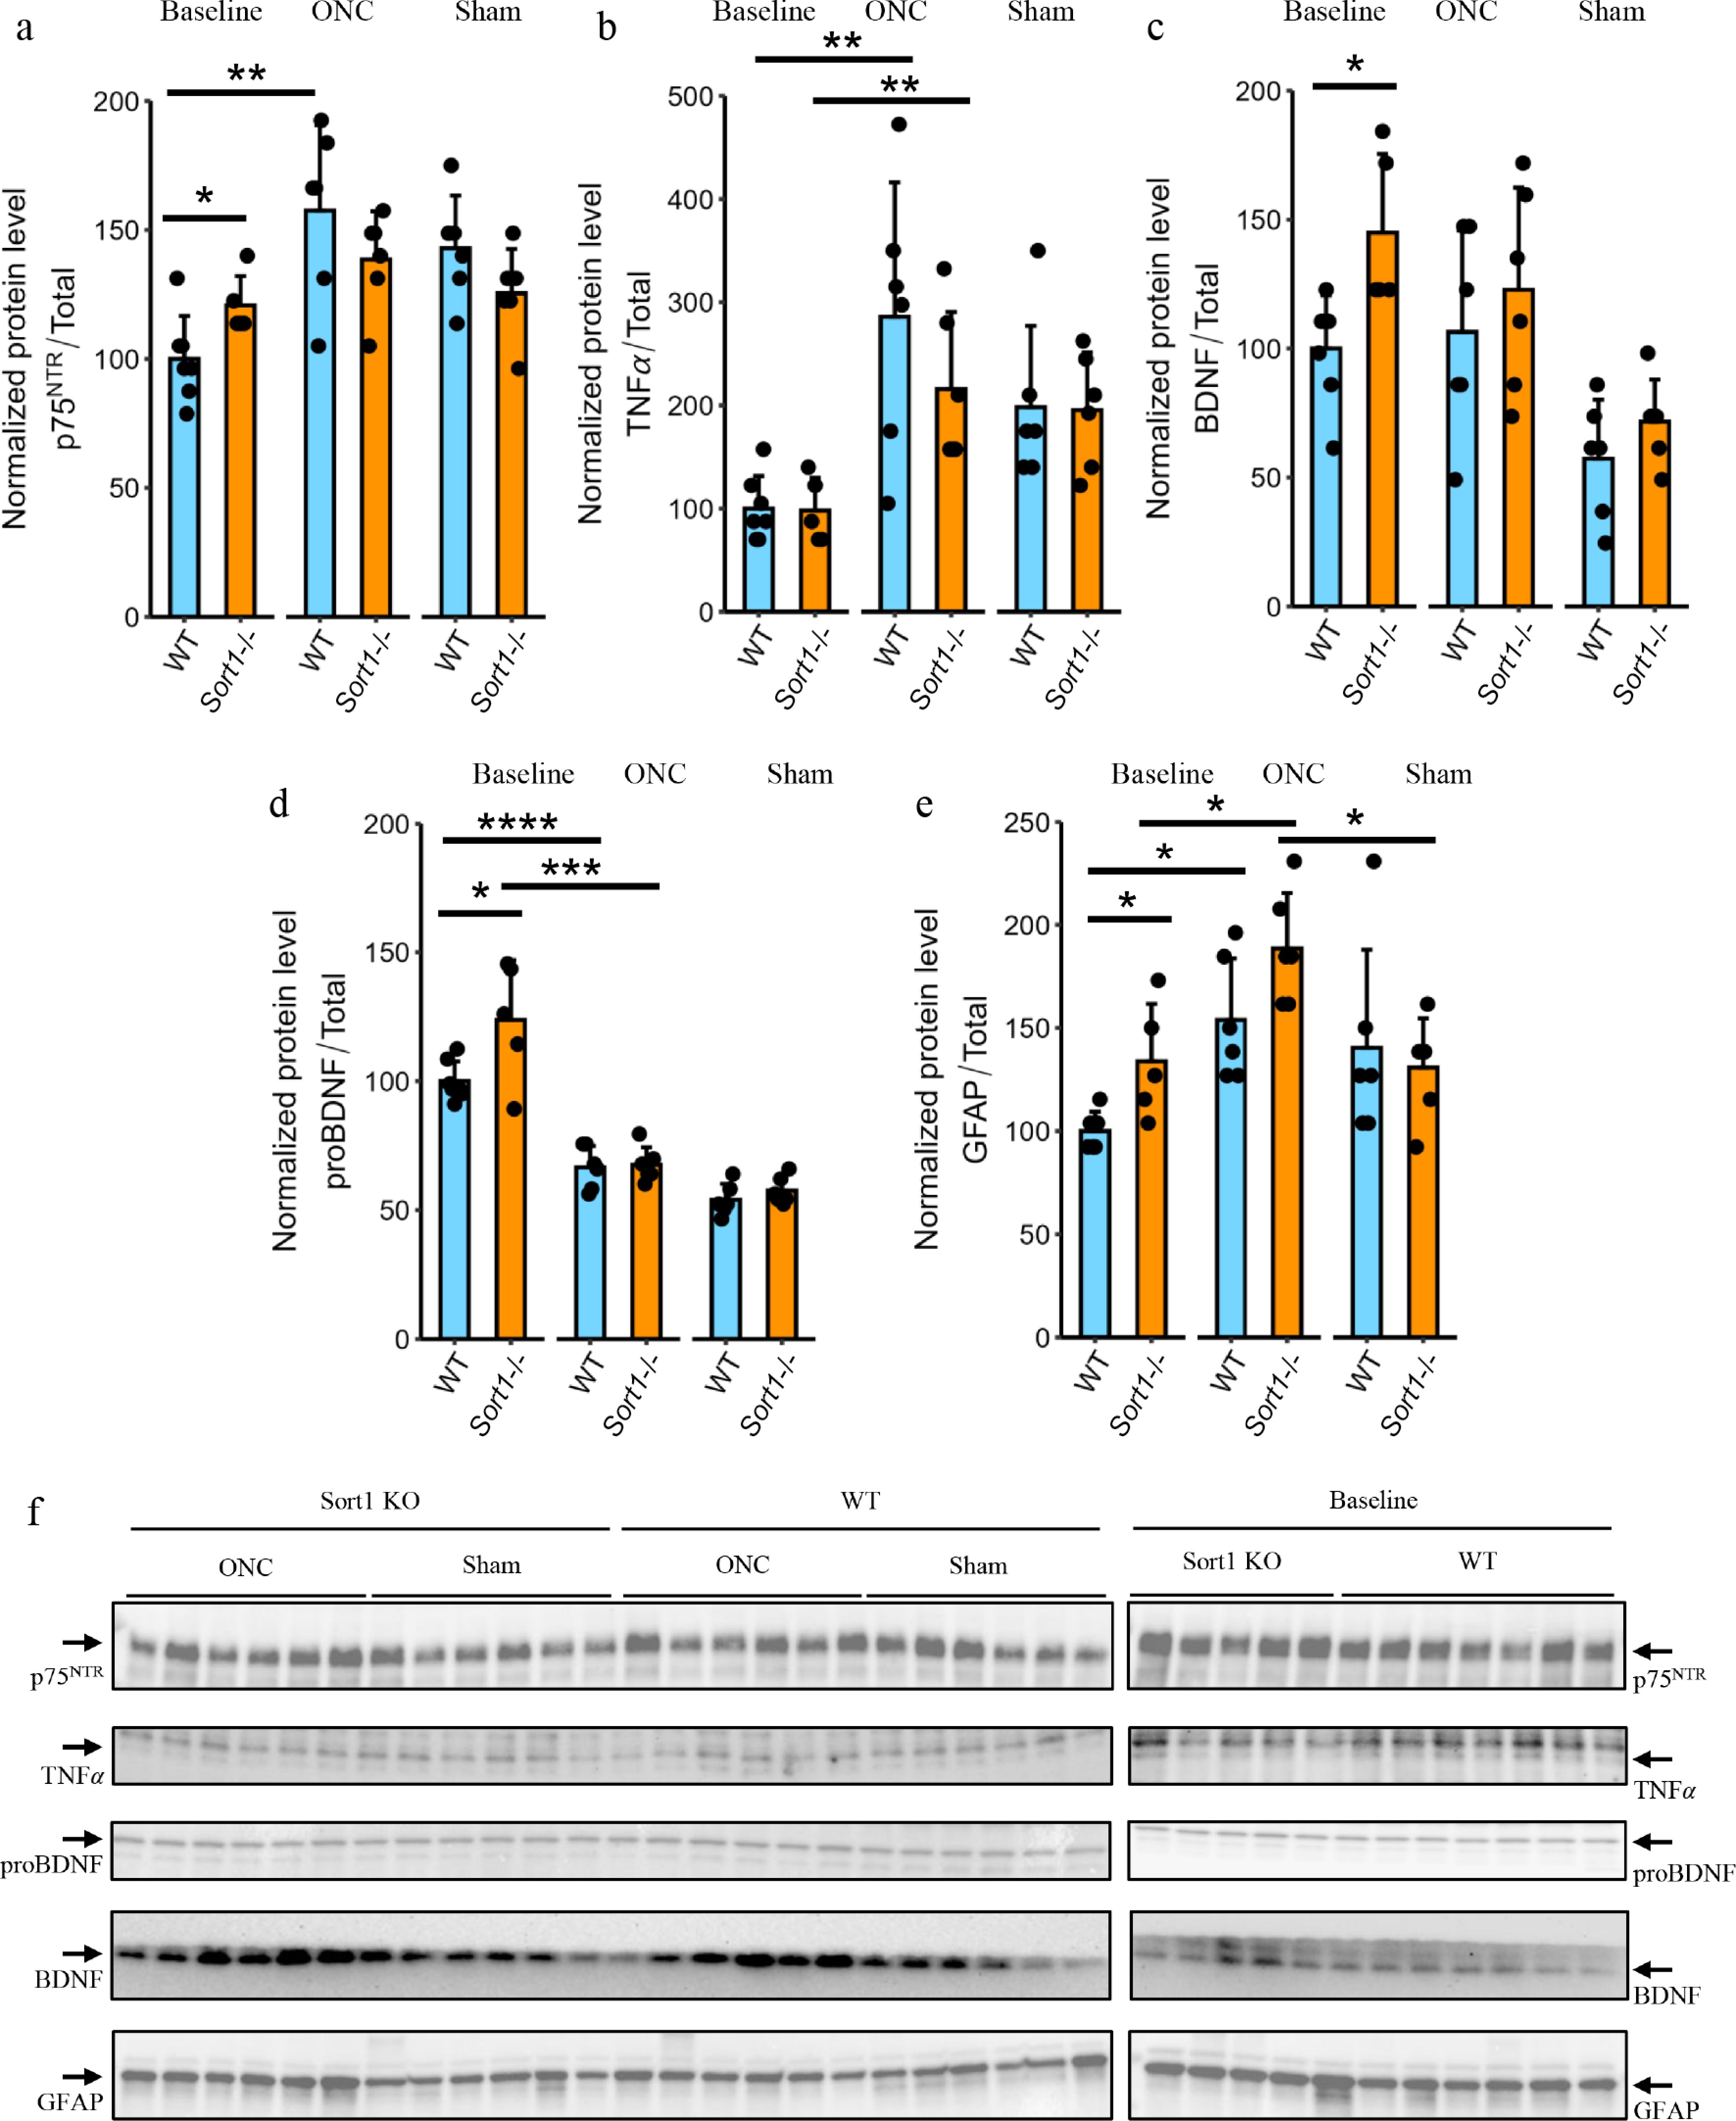
Figure 4.
Influence of sortilin deficiency on protein levels following optic nerve crush. Neuroretinal samples from Sort1-/- and age-matched C57Bl/6JBomTac wild-type (WT) mice not subjected to any procedure or with eyes subjected to optic nerve crush (ONC) or sham procedure and sacrificed 7 day post-crush (dpc) were analyzed. (a)–(e) Bar plots (mean ± SD) showing quantification of protein levels related to total protein in Western blots for p75NTR, TNFα, proBDNF, BDNF, and GFAP, respectively. (f) Western blots used for quantification. Statistical comparisons of the difference between WT and Sort1-/- animals in the different groups and the difference from baseline levels were performed using two-way ANOVA followed by Tukey's test (n = 5–7). Significance levels: * [0.01, 0.05]; ** [0.001, 0.01]; *** [0.0001, 0.001]; **** [0, 0.0001].
Figures
(4)
Tables
(0)