-
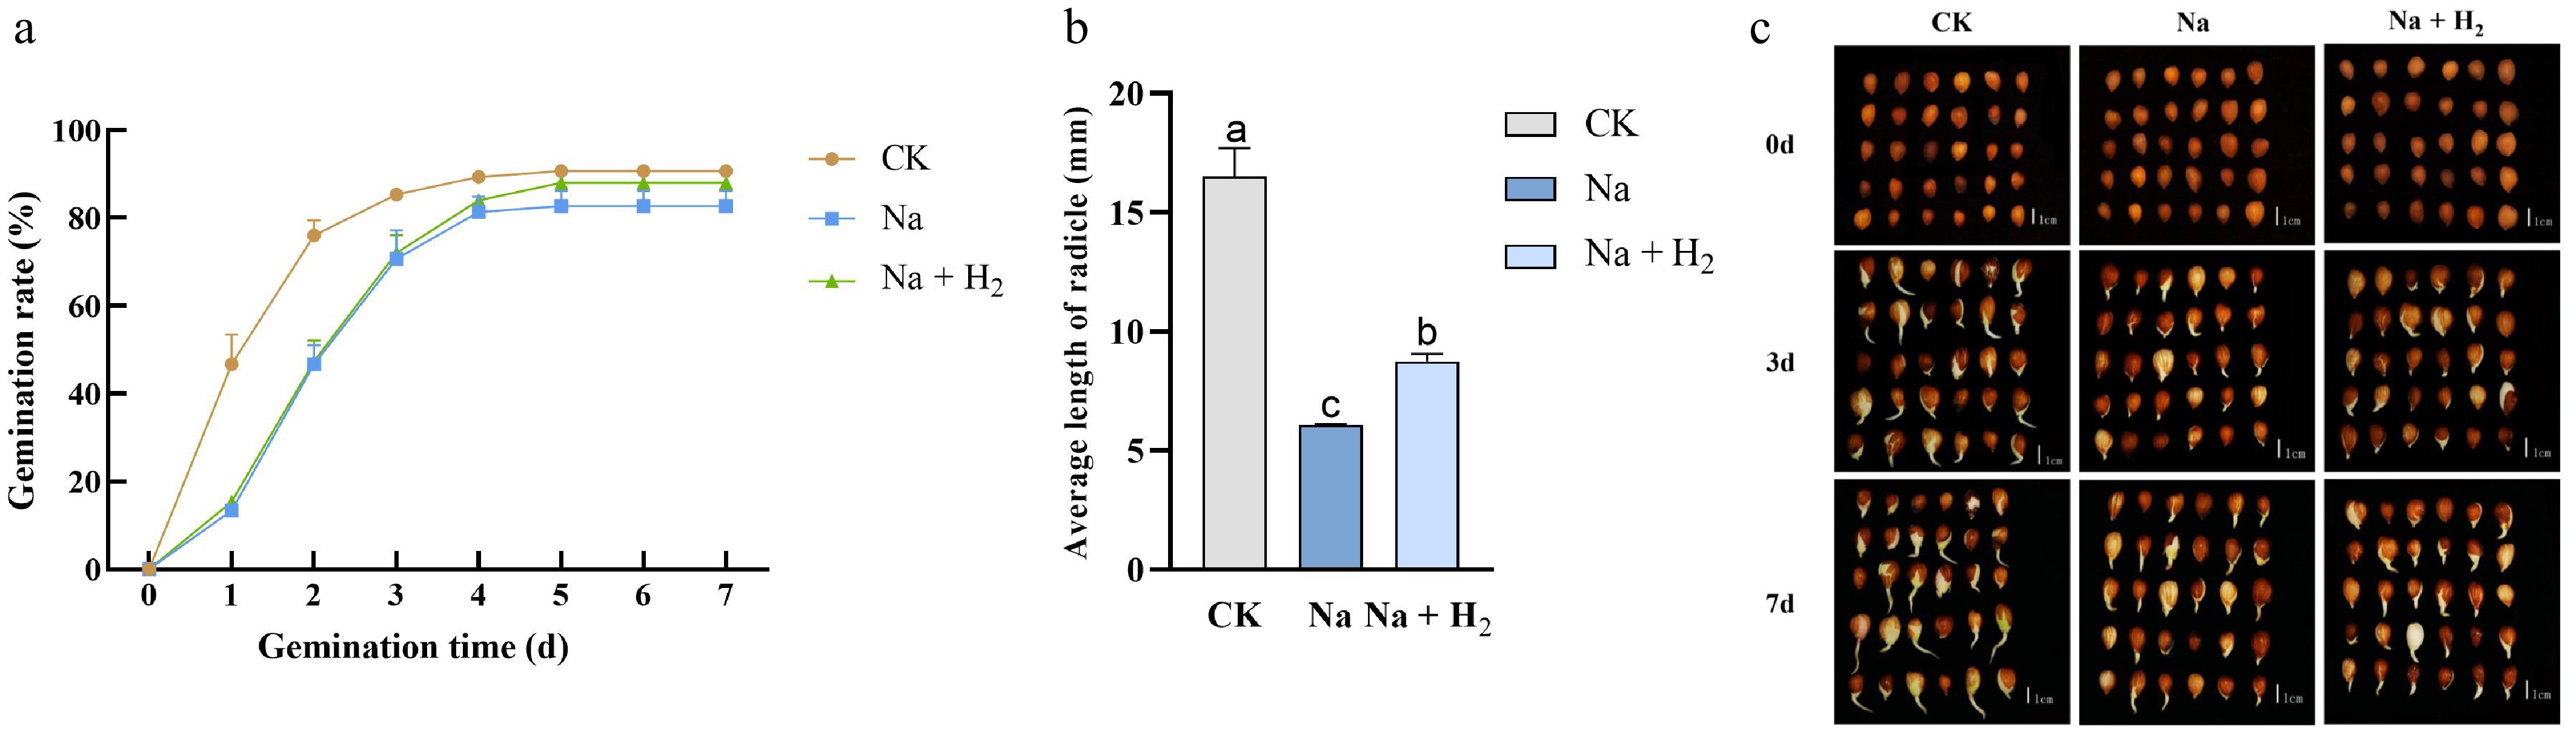
Figure 1.
Effects of different treatments on peach seed germination and radicle growth. (a) Germination rates under various treatments. (b) Radicle length on day 7 (mm). (c) Germination status on days 3 and 7. CK, Na, and Na + H2 denote 0 (control), 200 mmol/L NaCl, and 200 mmol/L NaCl + 50% HRW, respectively. Each experiment was replicated at least three times. Values are mean ± standard deviation. Significant differences are indicated by different lowercase letters (p < 0.05).
-
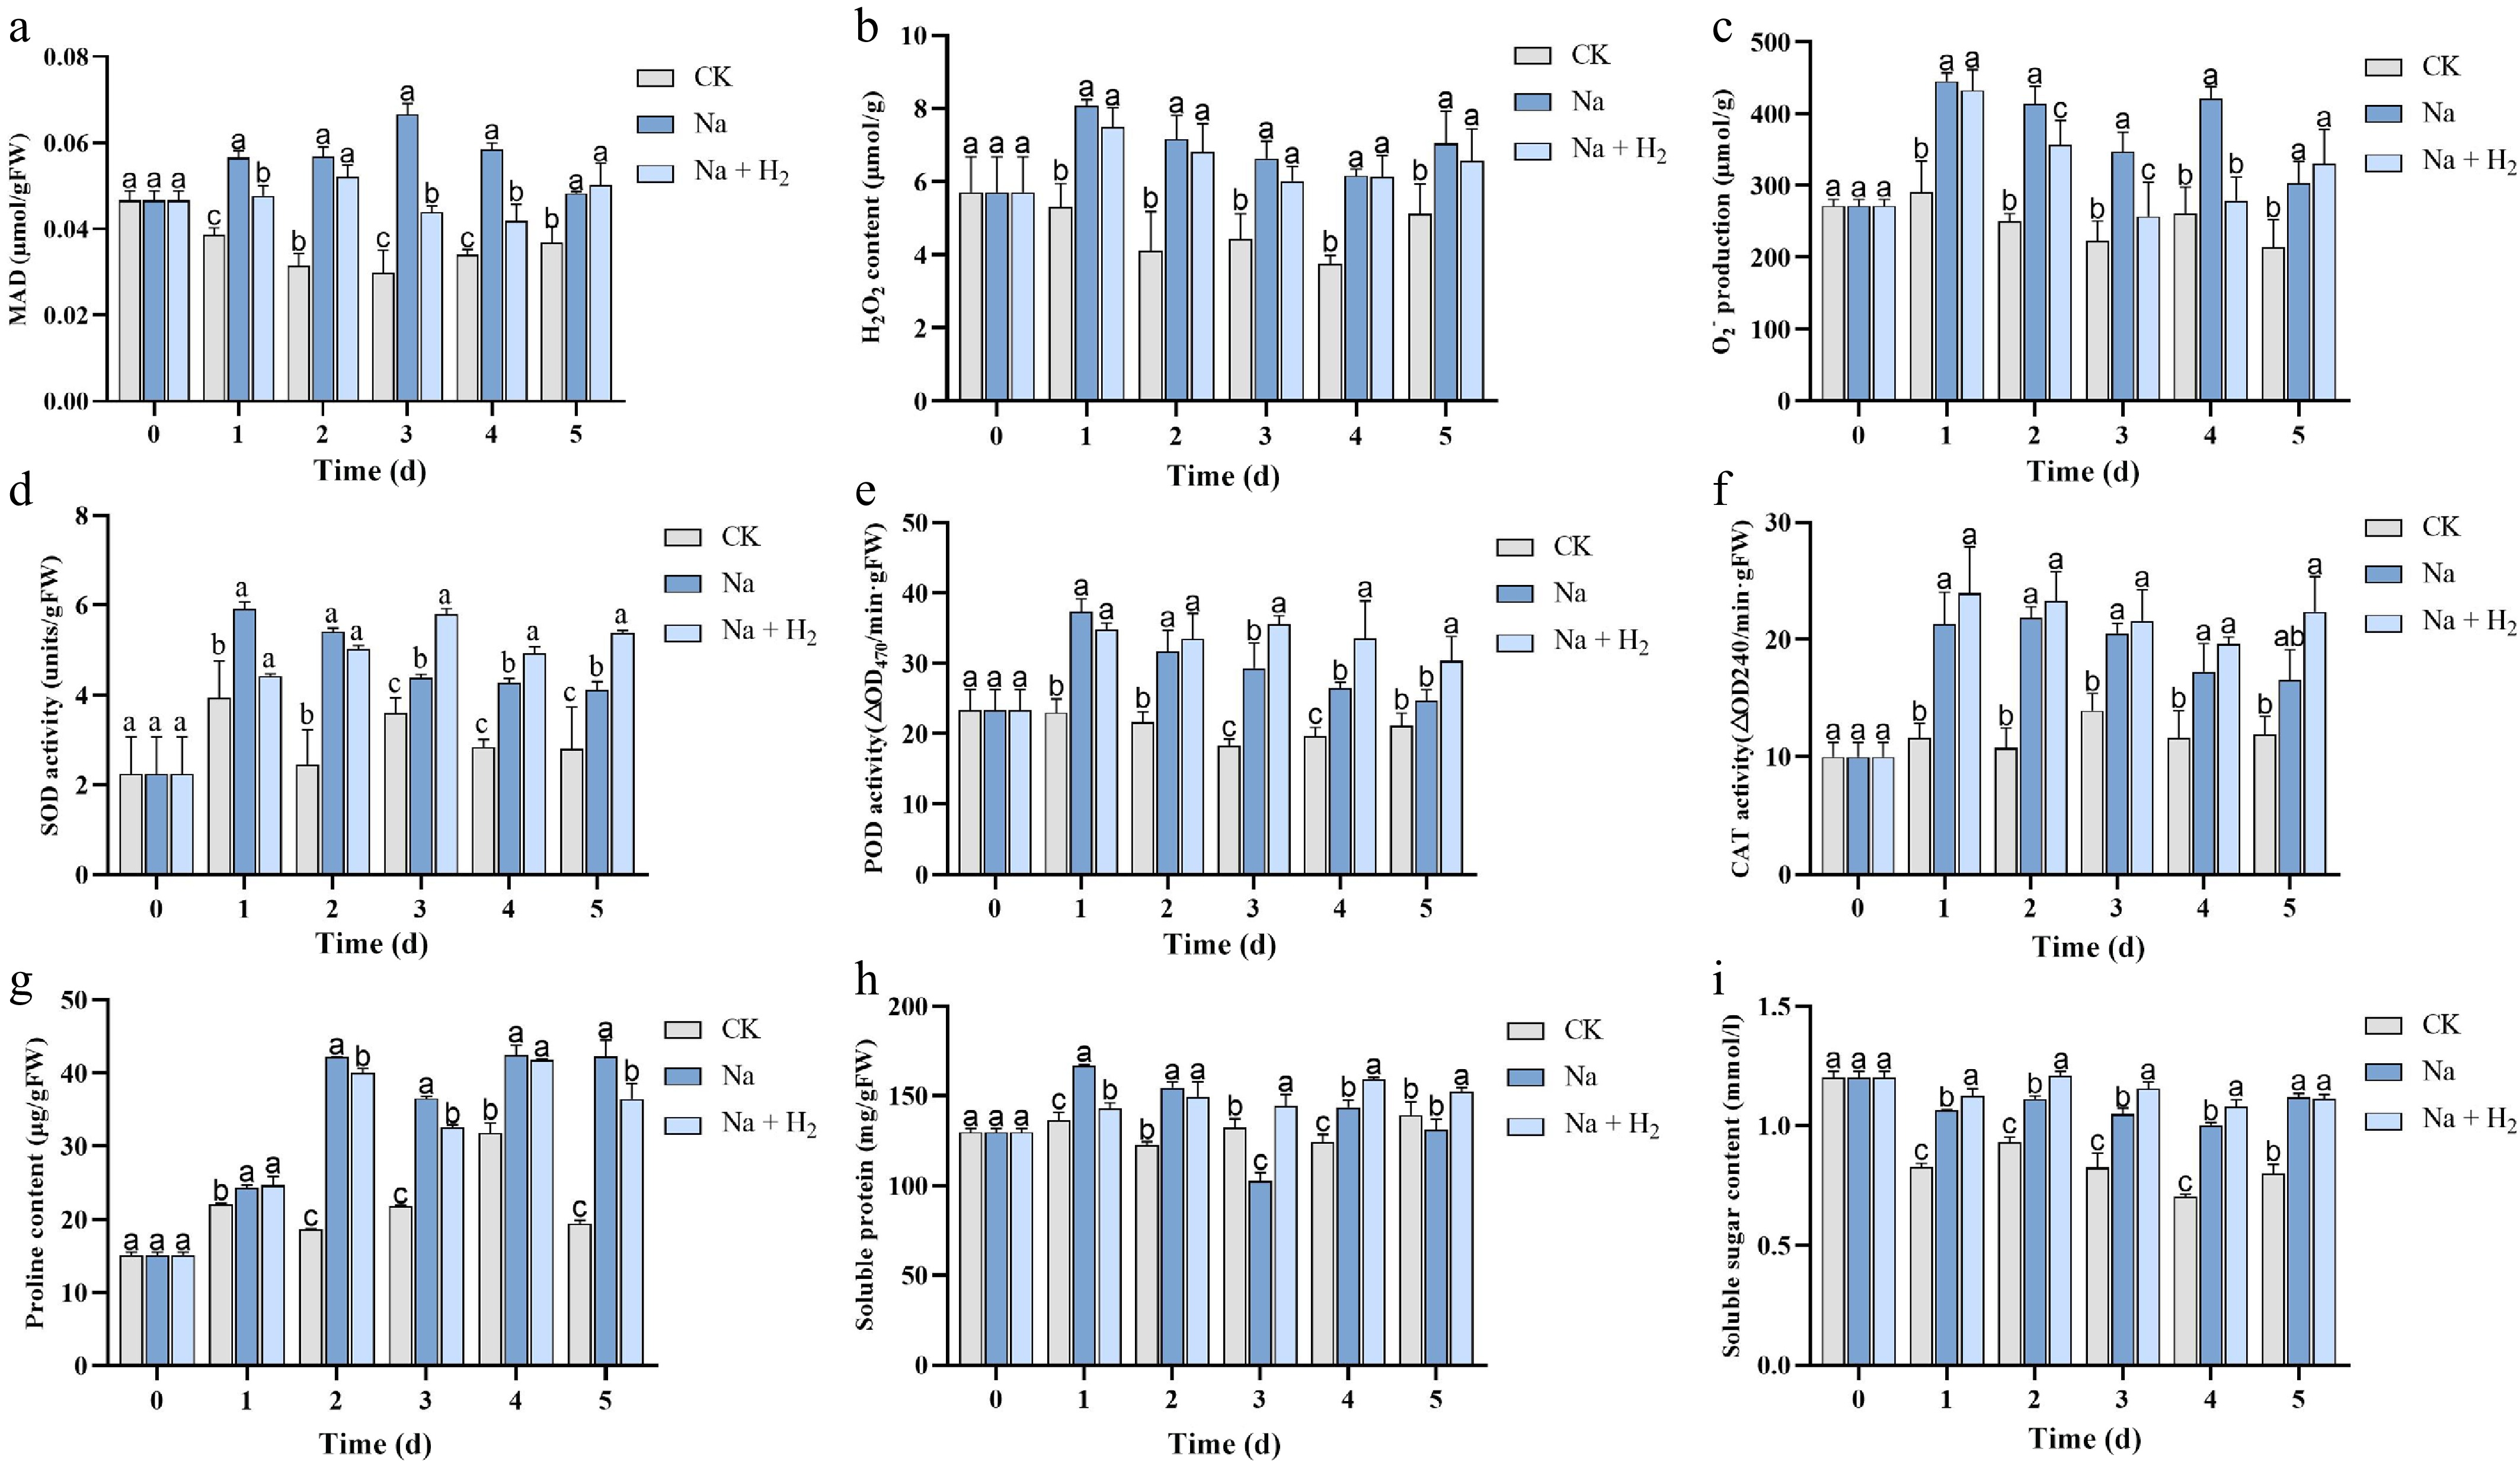
Figure 2.
Changes in physiological indicators of peach seeds under different treatments. (a) MDA content. (b) Hydrogen peroxide content. (c) Superoxide anion generation rate. (d) SOD. (e) POD. (f) CAT. (g) Proline. (h) Soluble proteins. (i) Soluble sugars. Values are mean ± standard deviation. At each time point, one-way ANOVA was used to assess intergroup differences among the control, Na+, and Na+ + H2 groups. Significant differences are indicated by different lowercase letters (p < 0.05).
-
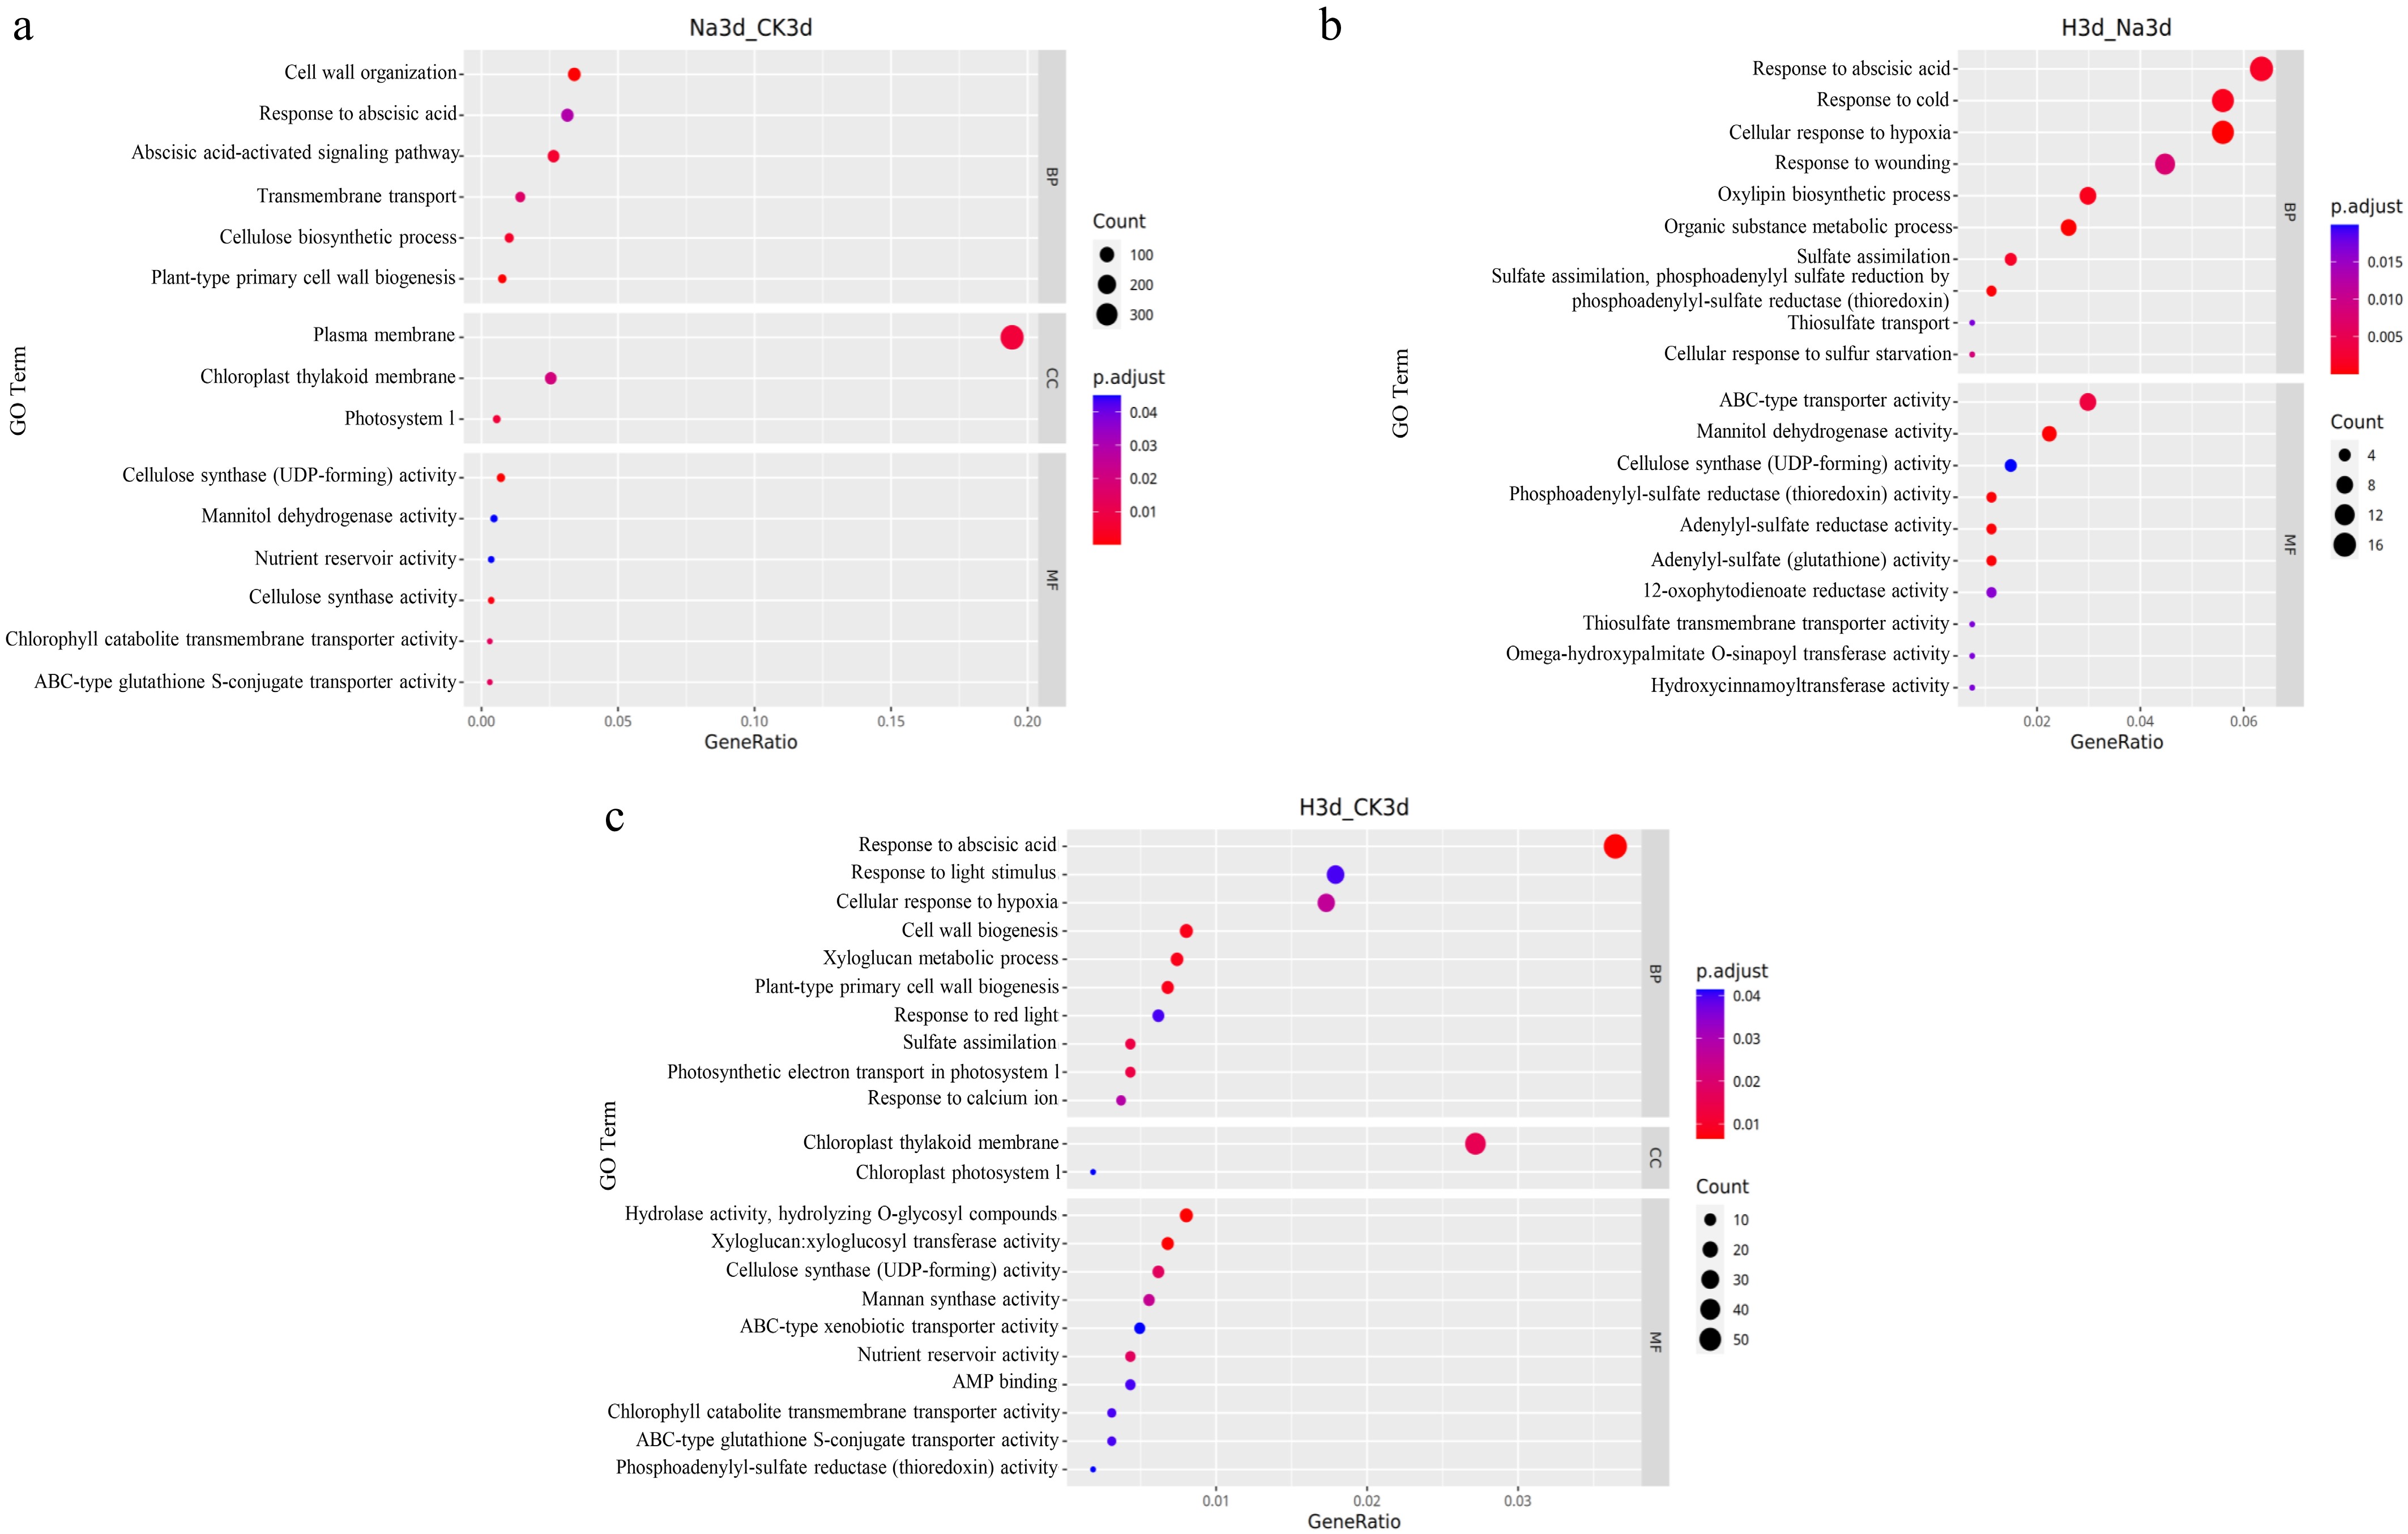
Figure 3.
GO enrichment analysis of differentially expressed genes in various pairwise comparisons under the Na group and the Na + H2 group.
-
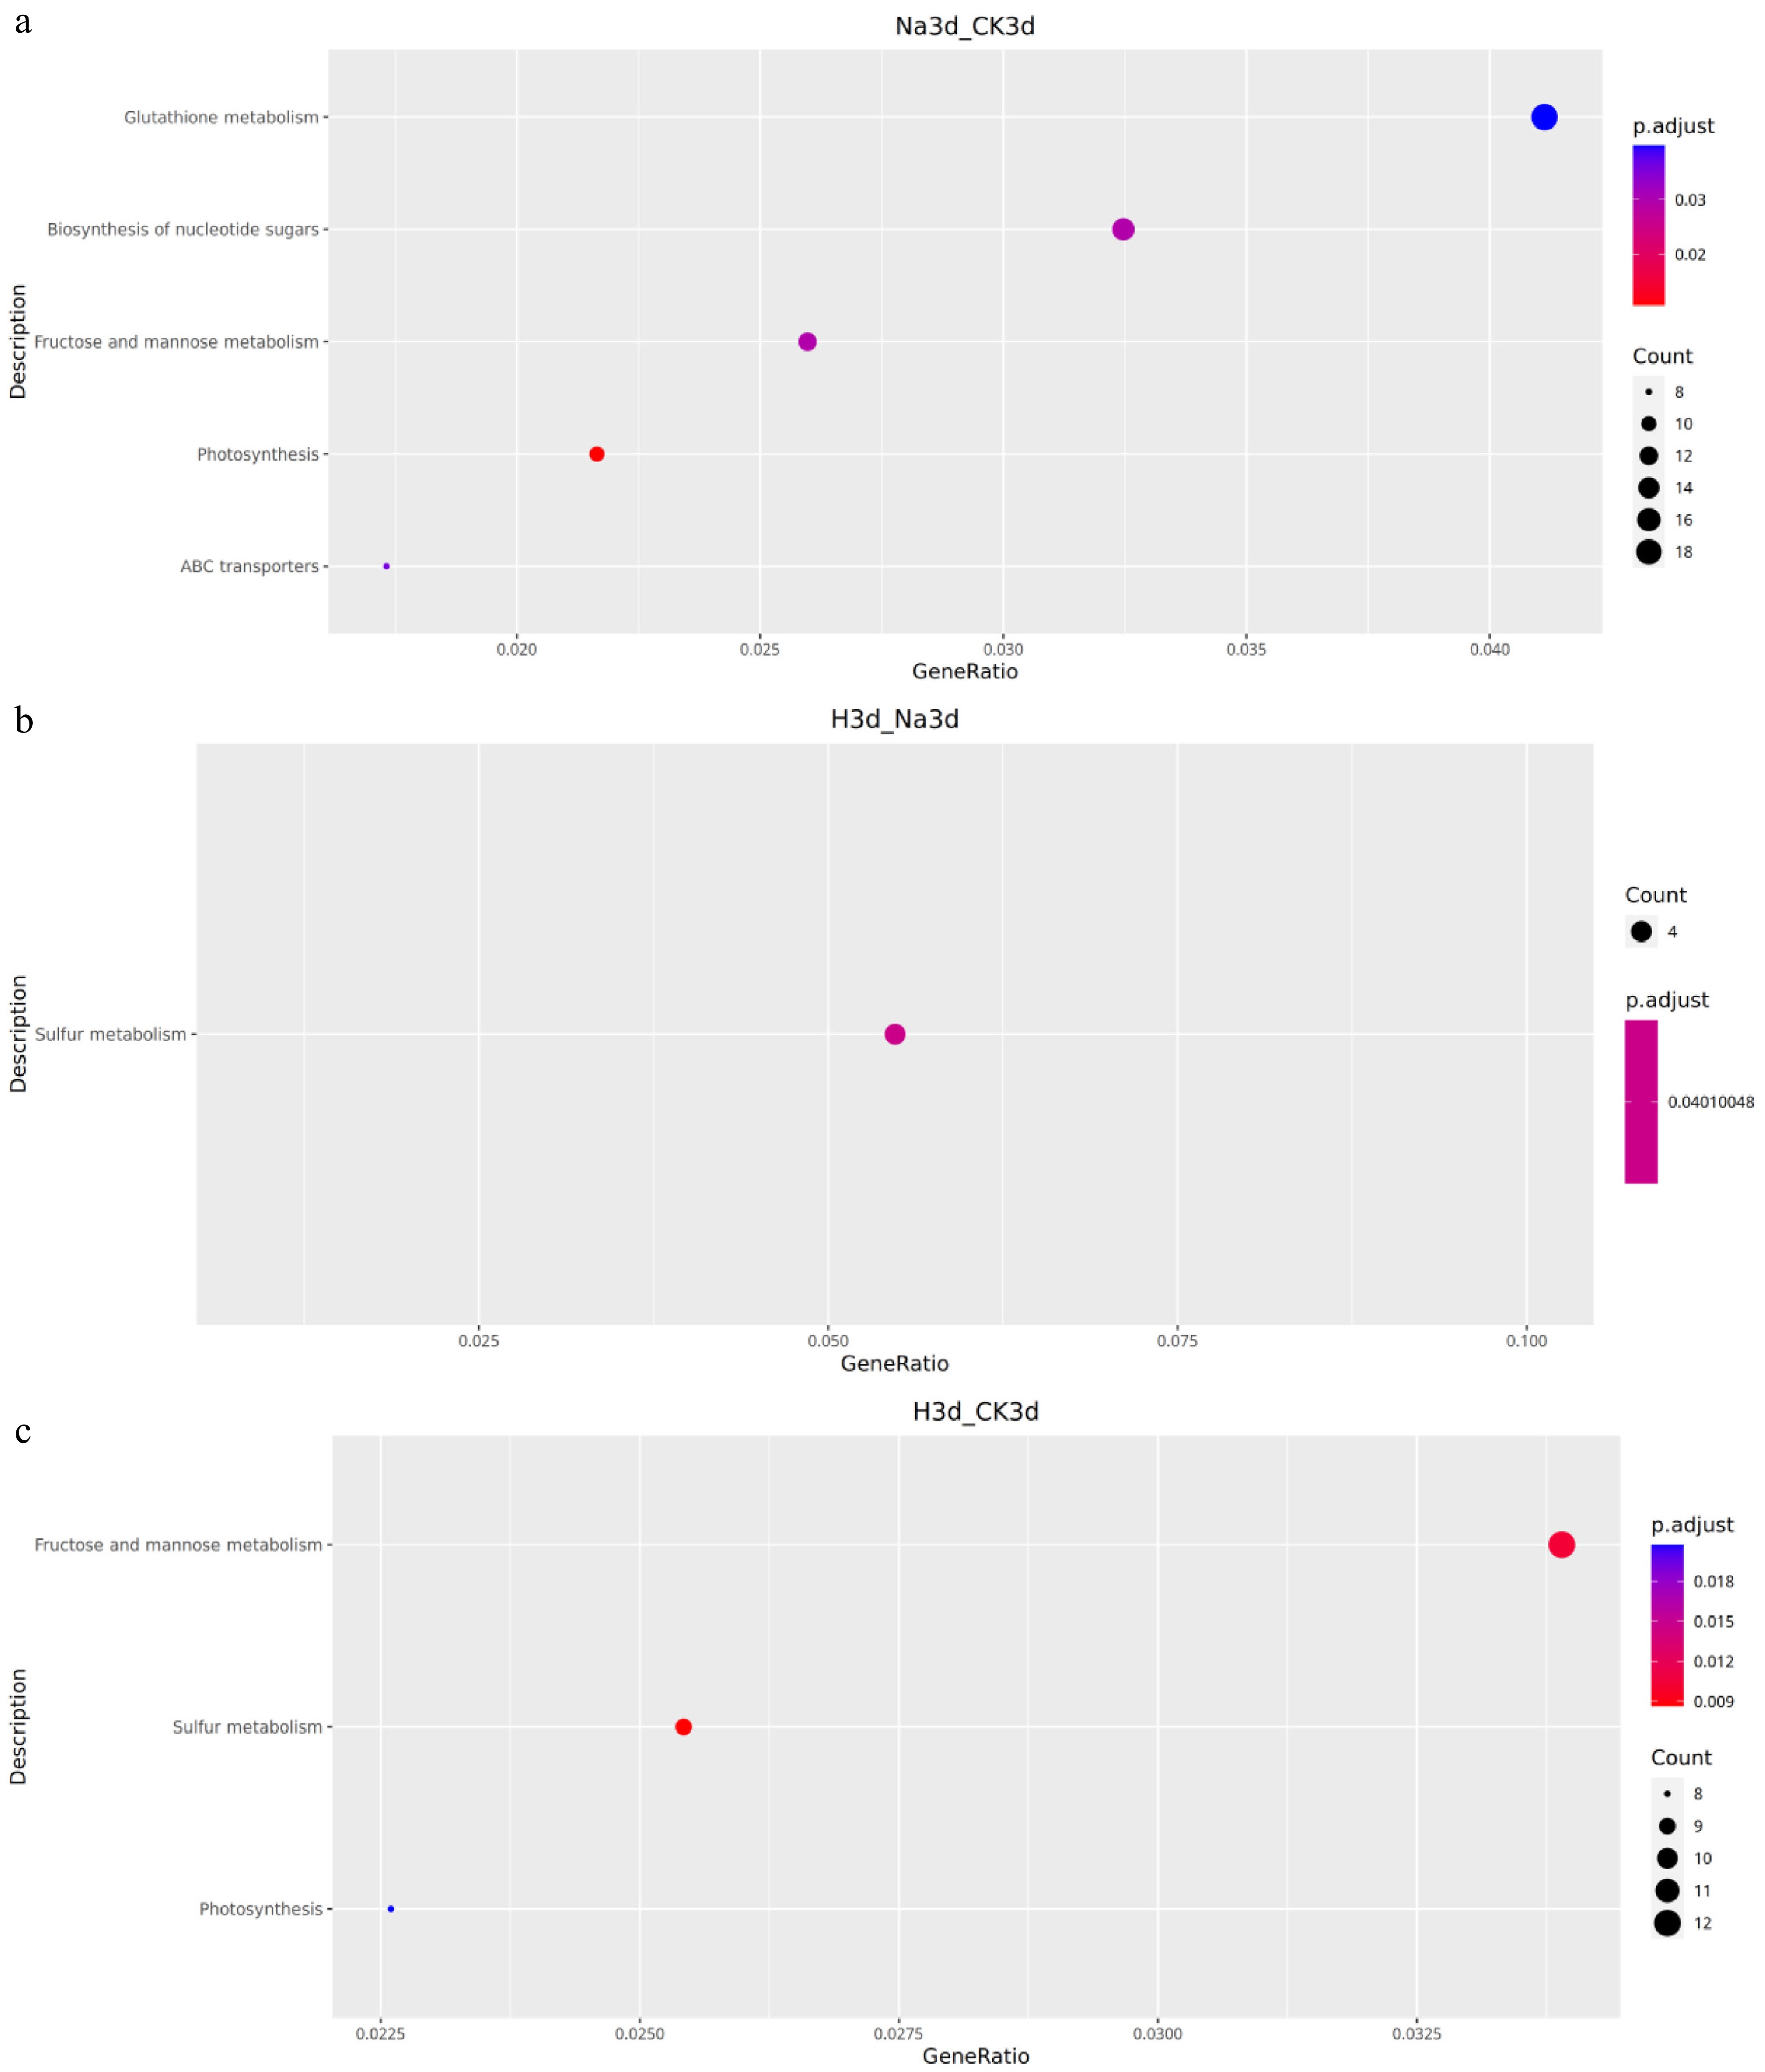
Figure 4.
KEGG pathway enrichment analysis of differentially expressed genes across pairwise comparisons under salt stress and H2 exposure.
-
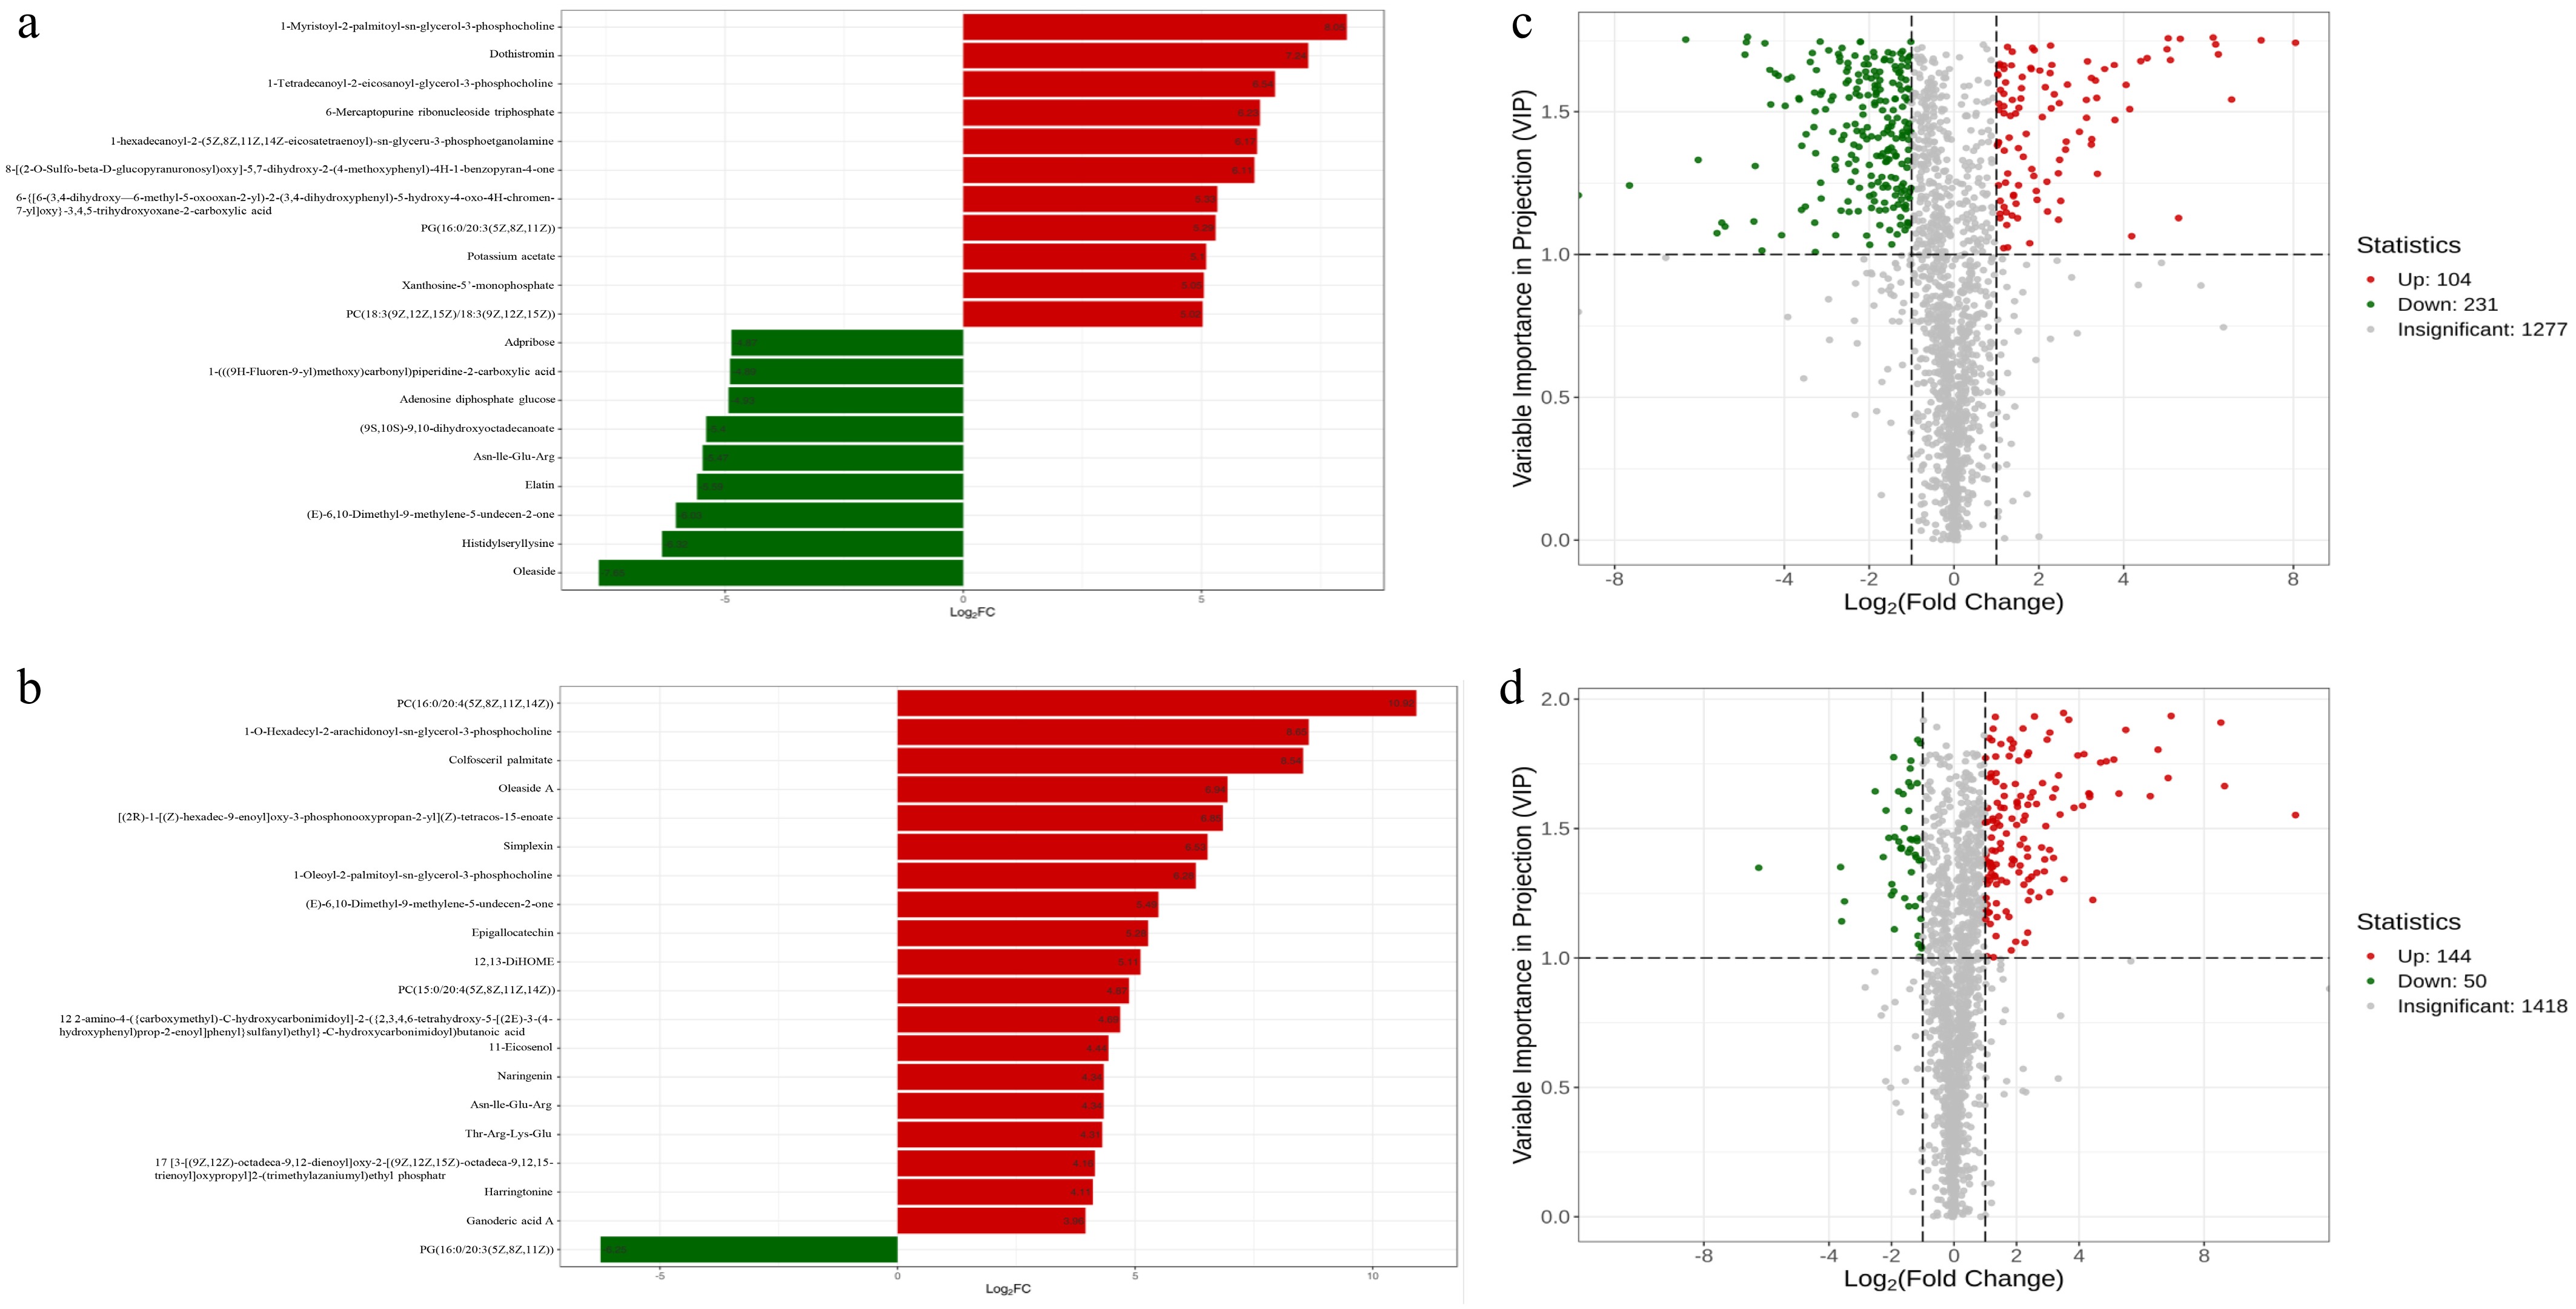
Figure 5.
Up- and downregulation of DAMs in different metabolite classes. (a) Top 20 DAMs with the largest fold changes in Na3d vs CK3d. (b) Volcano plot of up- and downregulated DAMs in Na3d vs CK3d. (c) Top 20 DAMs with the largest fold changes in H3d vs Na3d. (d) Volcano plot of up and downregulated DAMs in H3d vs Na3d.
-
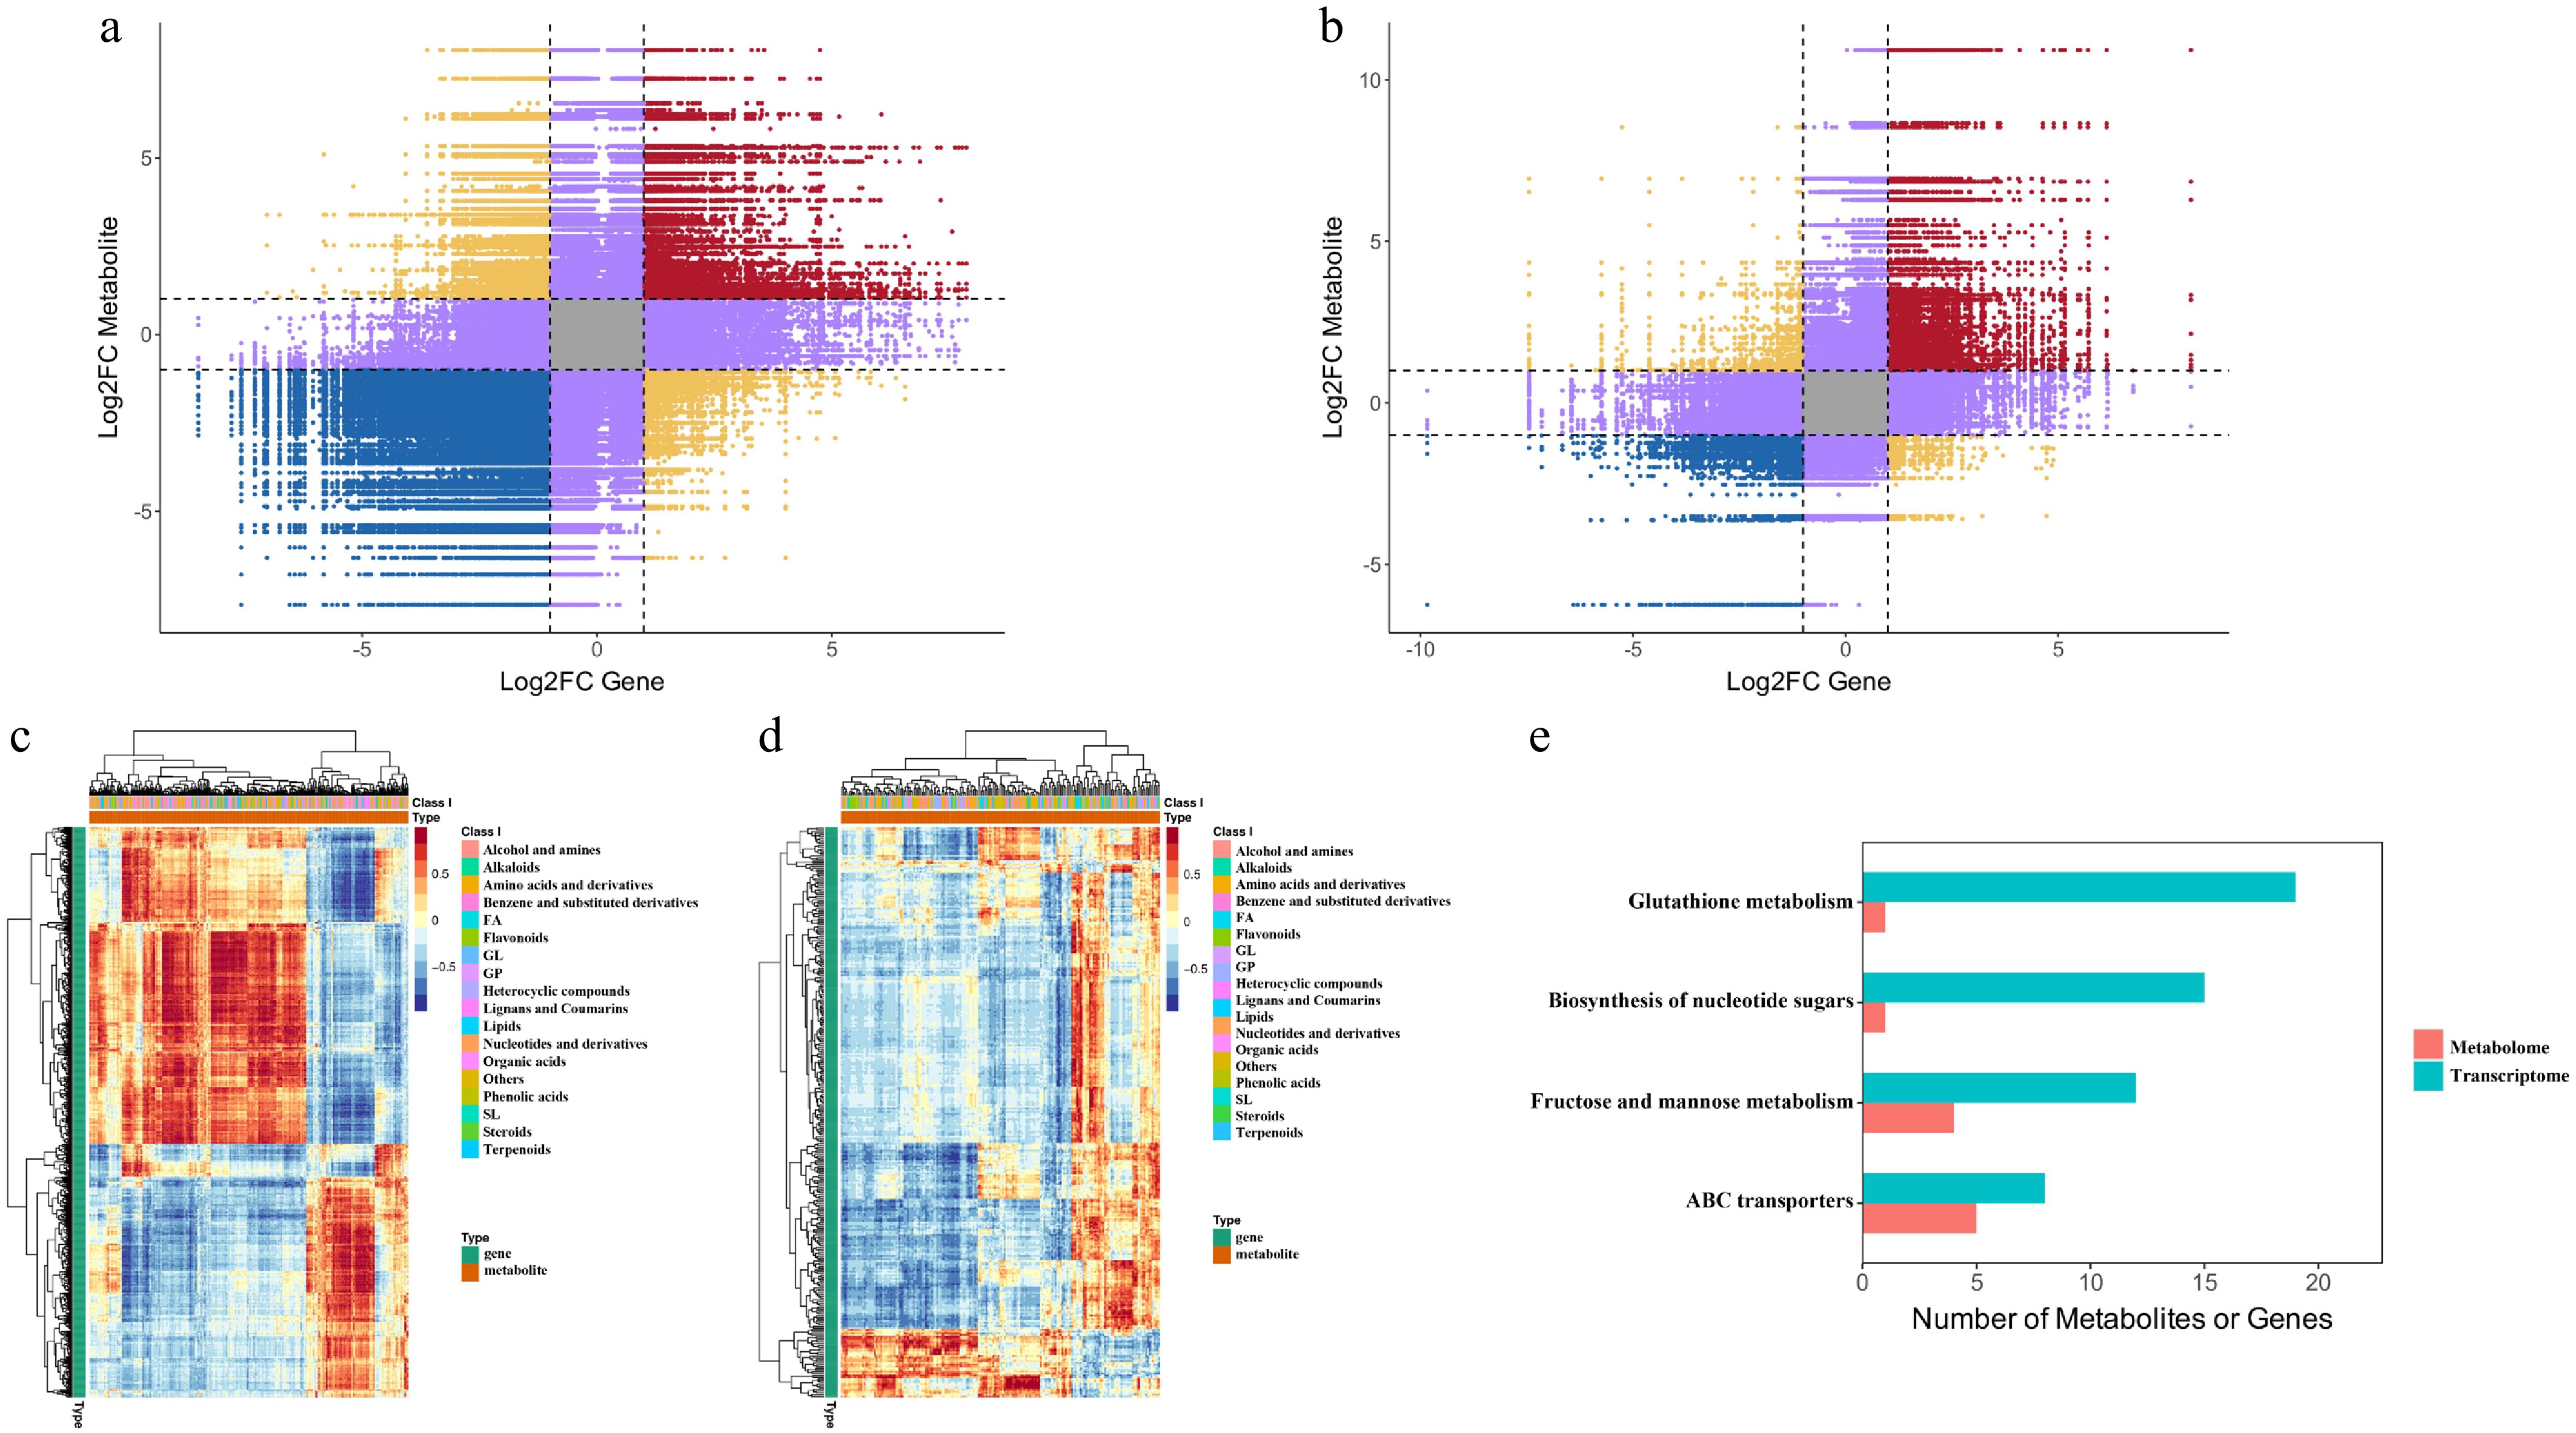
Figure 6.
Correlation analysis of transcriptomic and metabolomic data in peach seeds under the Na group and the Na + H2 group. (a), (b) Nine-quadrant plots showing correlations between genes and metabolites in Na3d (left) and H3d (right). (c), (d) Heatmap displaying cluster analysis results for DEGs (blue) and DAMs (red). (e) KEGG enrichment analysis of DEGs (blue) and DAMs (red) enriched in the same pathways.
-
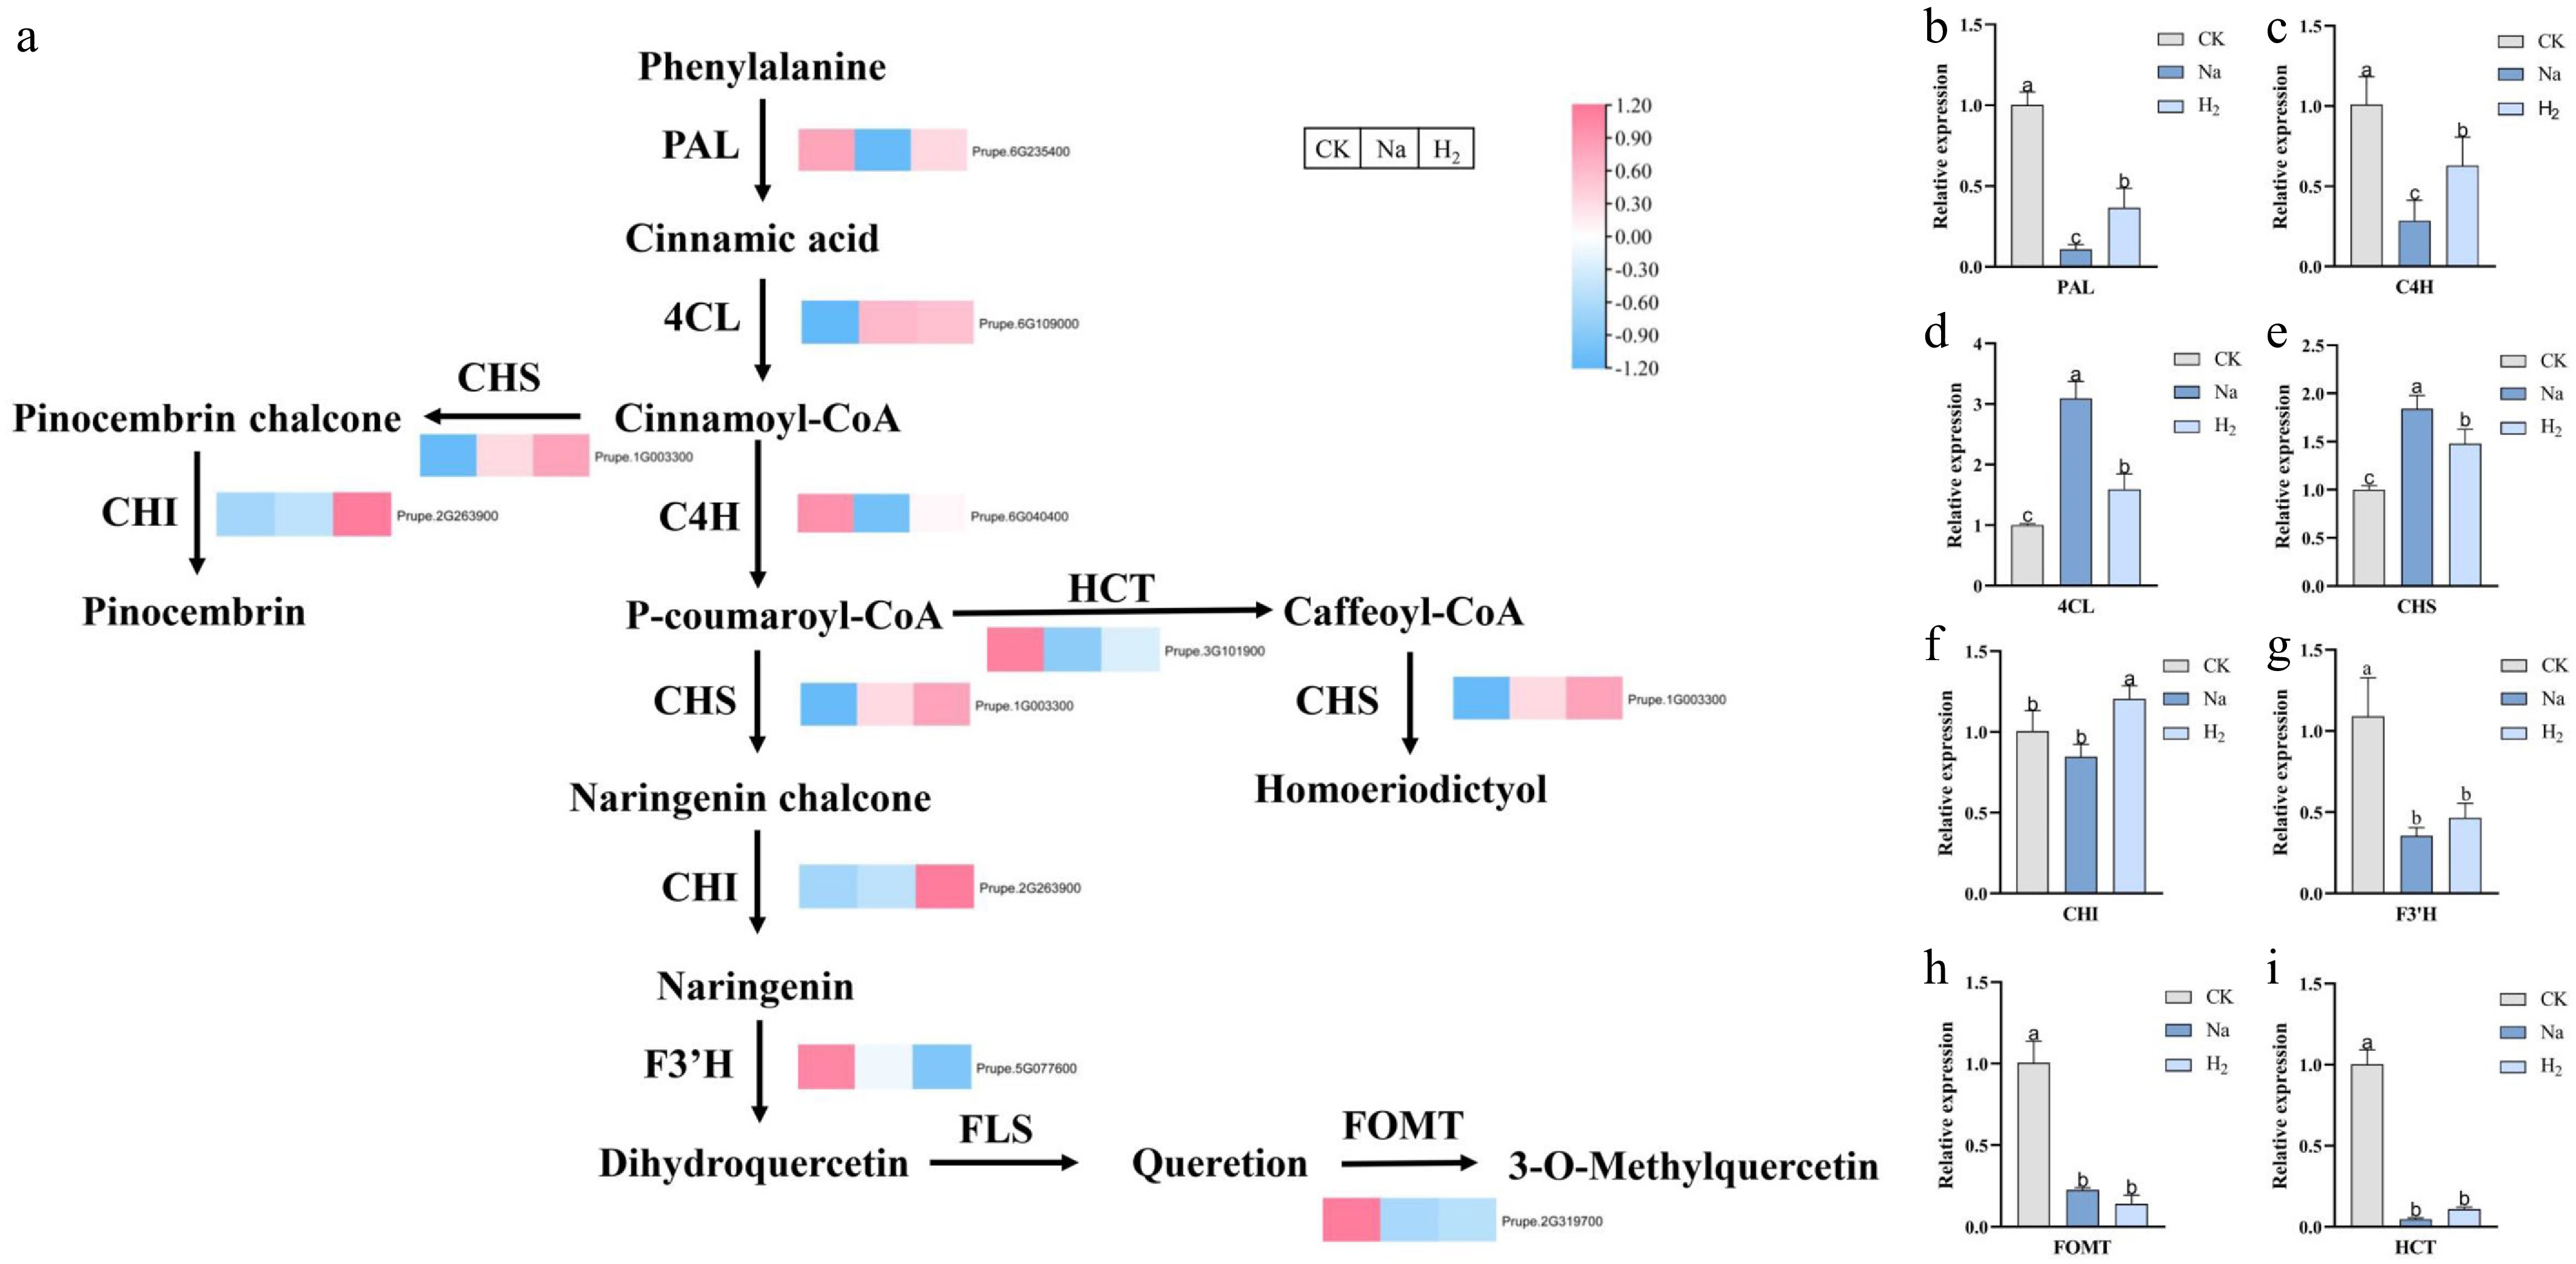
Figure 7.
Analysis of DEGs related to the phenylpropanoid and flavonoid biosynthesis pathways and qRT-PCR validation. (a) Phenylpropanoid and flavonoid biosynthetic pathways reconstructed based on the KEGG database. Gene expression levels are shown as heatmaps of log2(FPKM) values, where red indicates high expression and blue indicates low expression. (b)–(i) qRT-PCR validation of eight genes in peach seeds under different treatments. Values are mean ± standard deviation. Significant differences are indicated by different lowercase letters (p < 0.05).
-
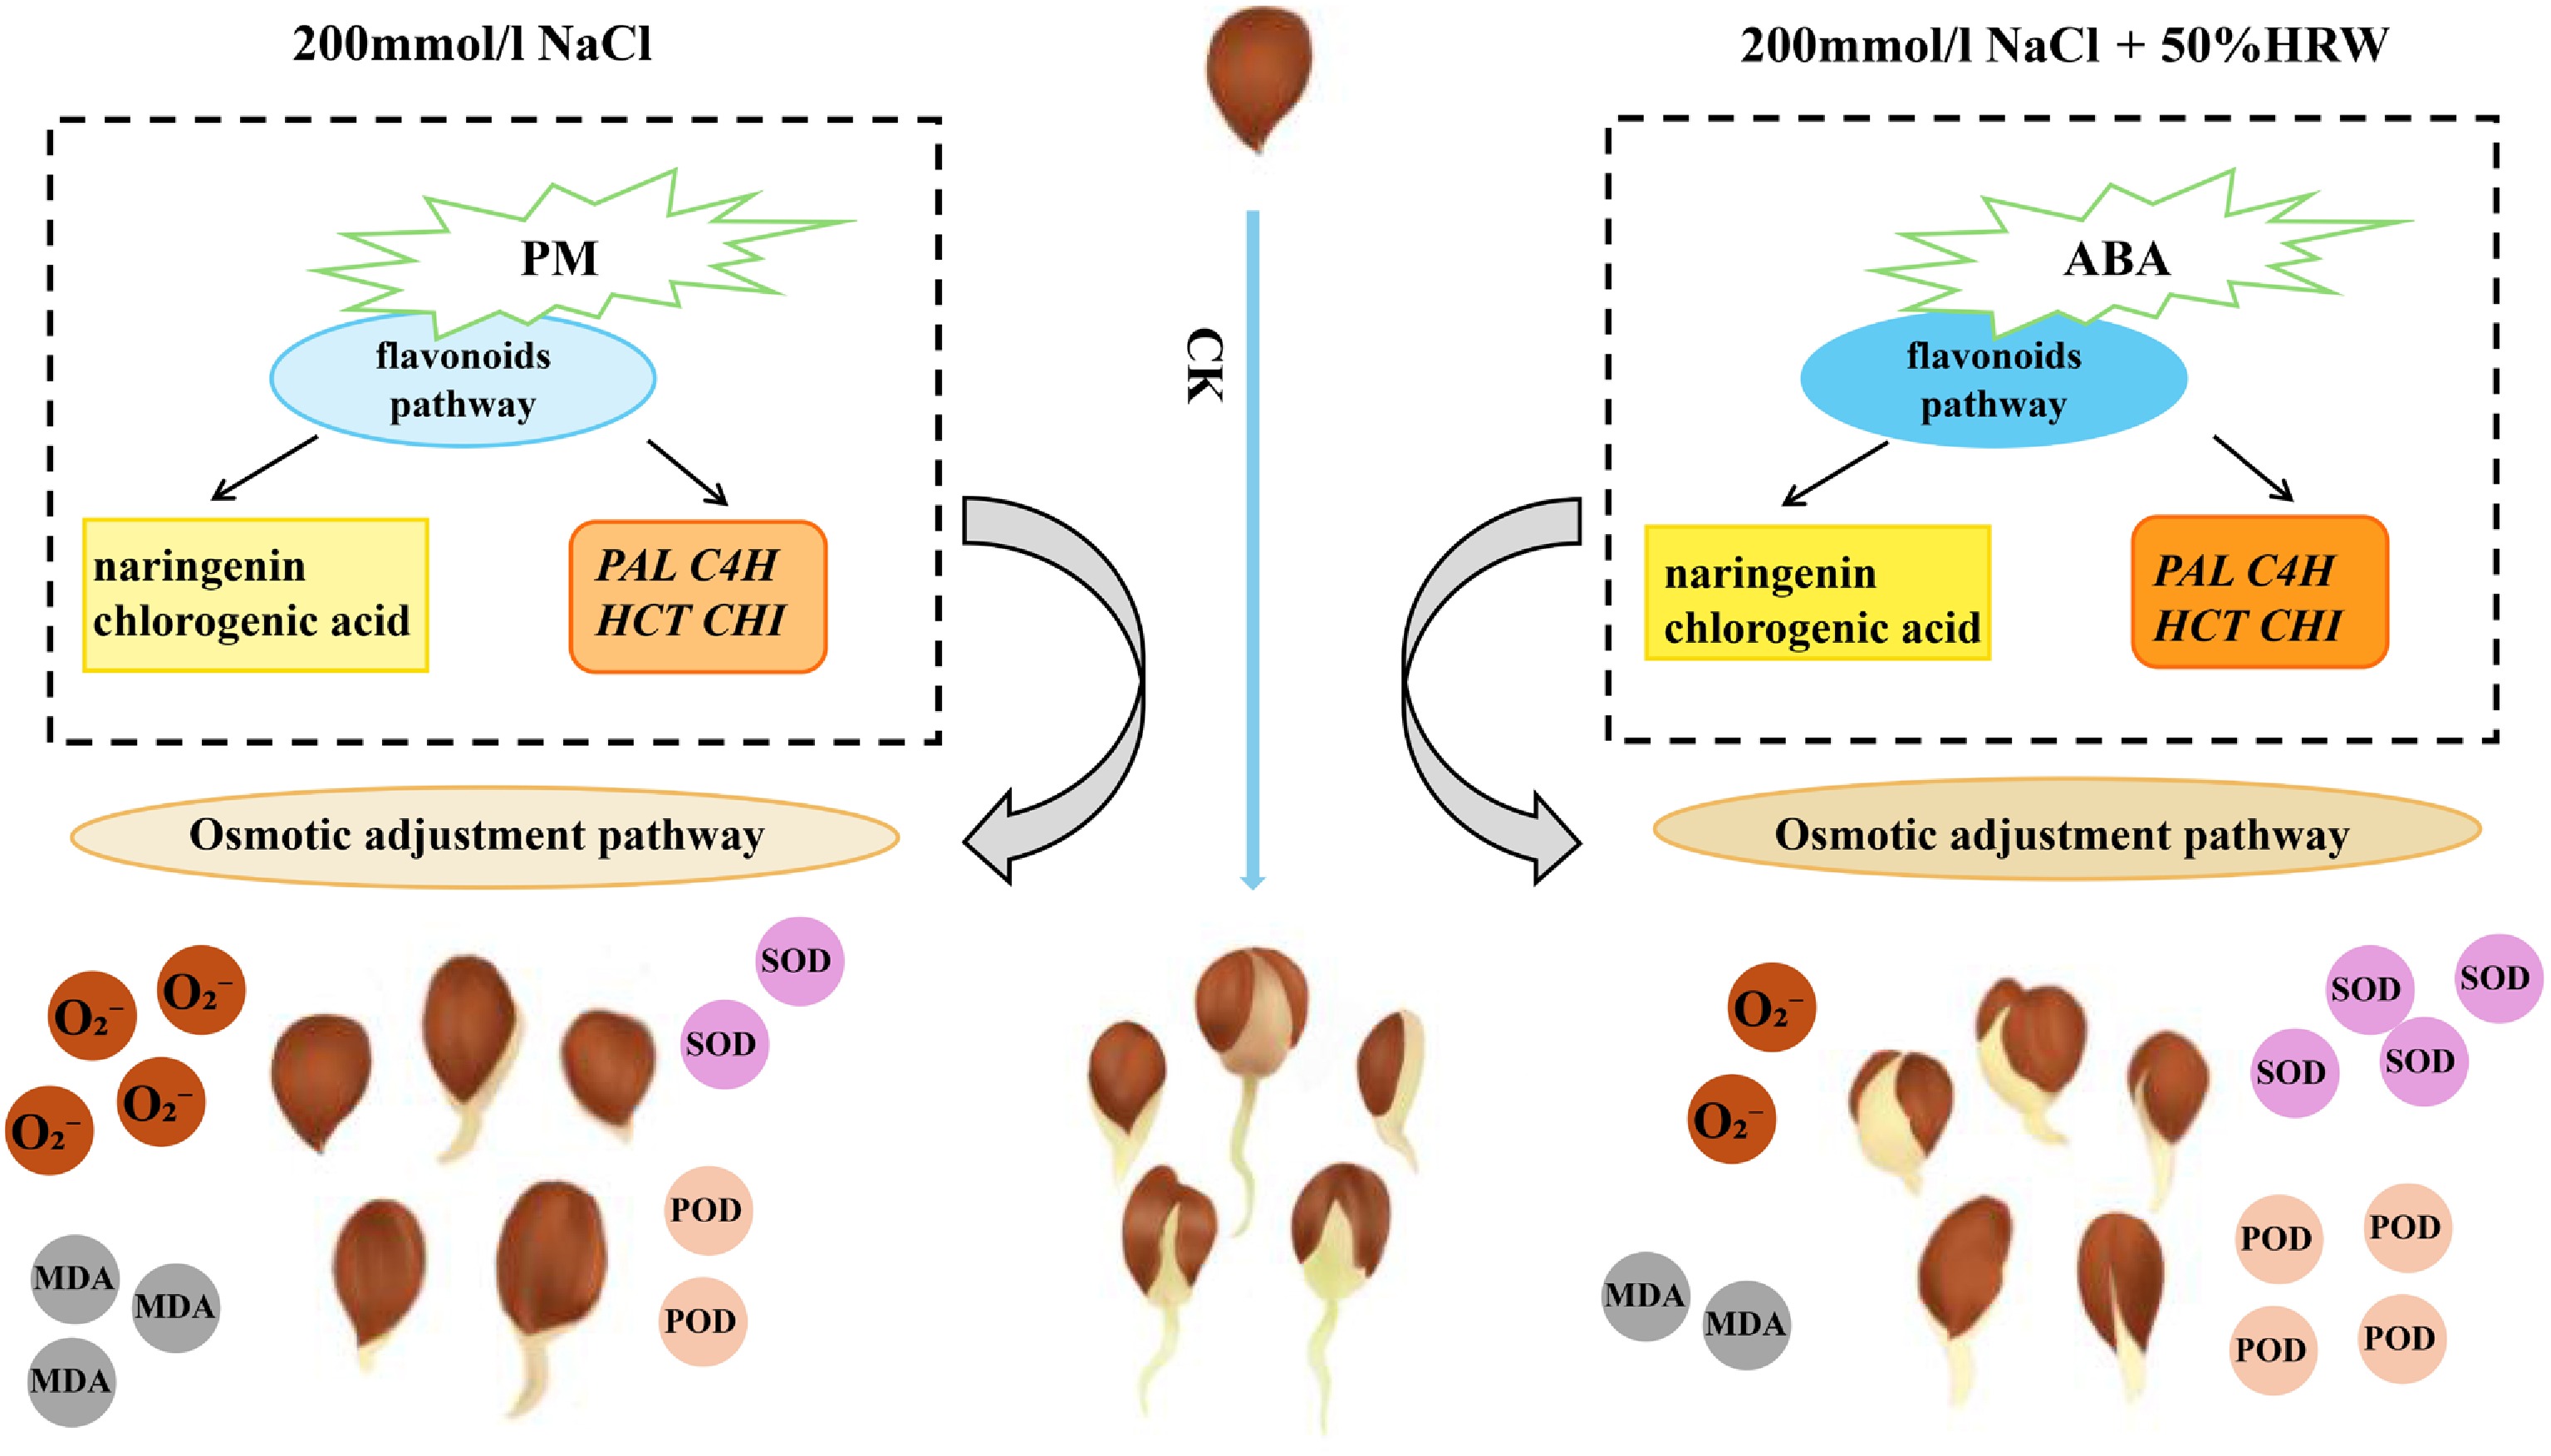
Figure 8.
A model of hydrogen-rich water alleviating salt stress in peach seeds. Darker color indicates higher content, while lighter color indicates lower content.
Figures
(8)
Tables
(0)