-
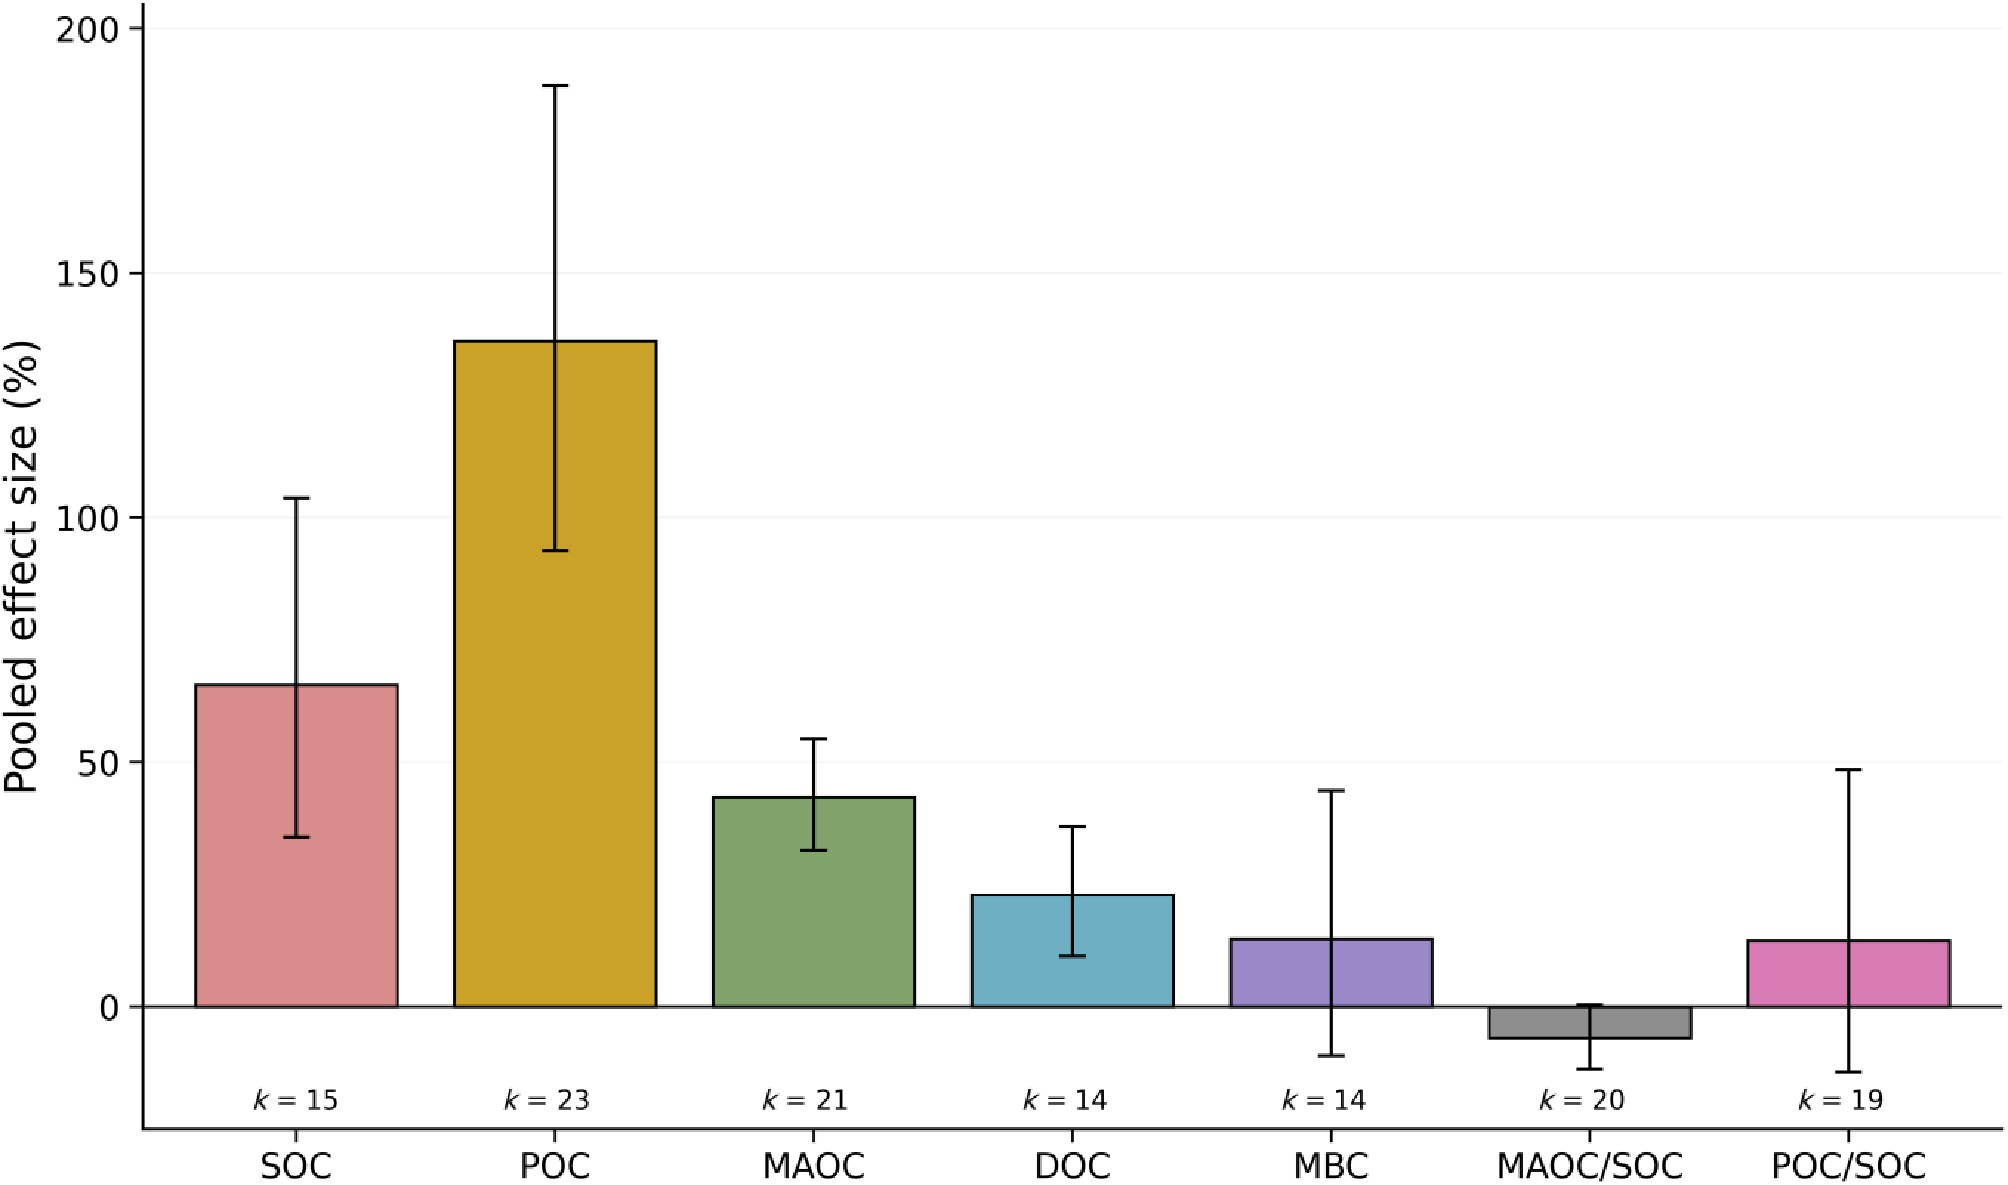
Figure 1.
The comprehensive impact of biochar on soil organic carbon pools and allocation ratios. The mean effect sizes (%) from the comprehensive meta-analysis of biochar amendment on soil organic carbon (SOC), particulate organic carbon (POC), mineral-associated organic carbon (MAOC), dissolved organic carbon (DOC), and microbial biomass carbon (MBC), along with alterations in SOC distribution represented as POC/SOC and MAOC/SOC. The bars represent the mean effect, while the error bars indicate the 95% confidence intervals. k indicates the number of independent studies. Exact Cochran's Q and I2 values for these pooled outcomes are reported in Supplementary Table S2.
-
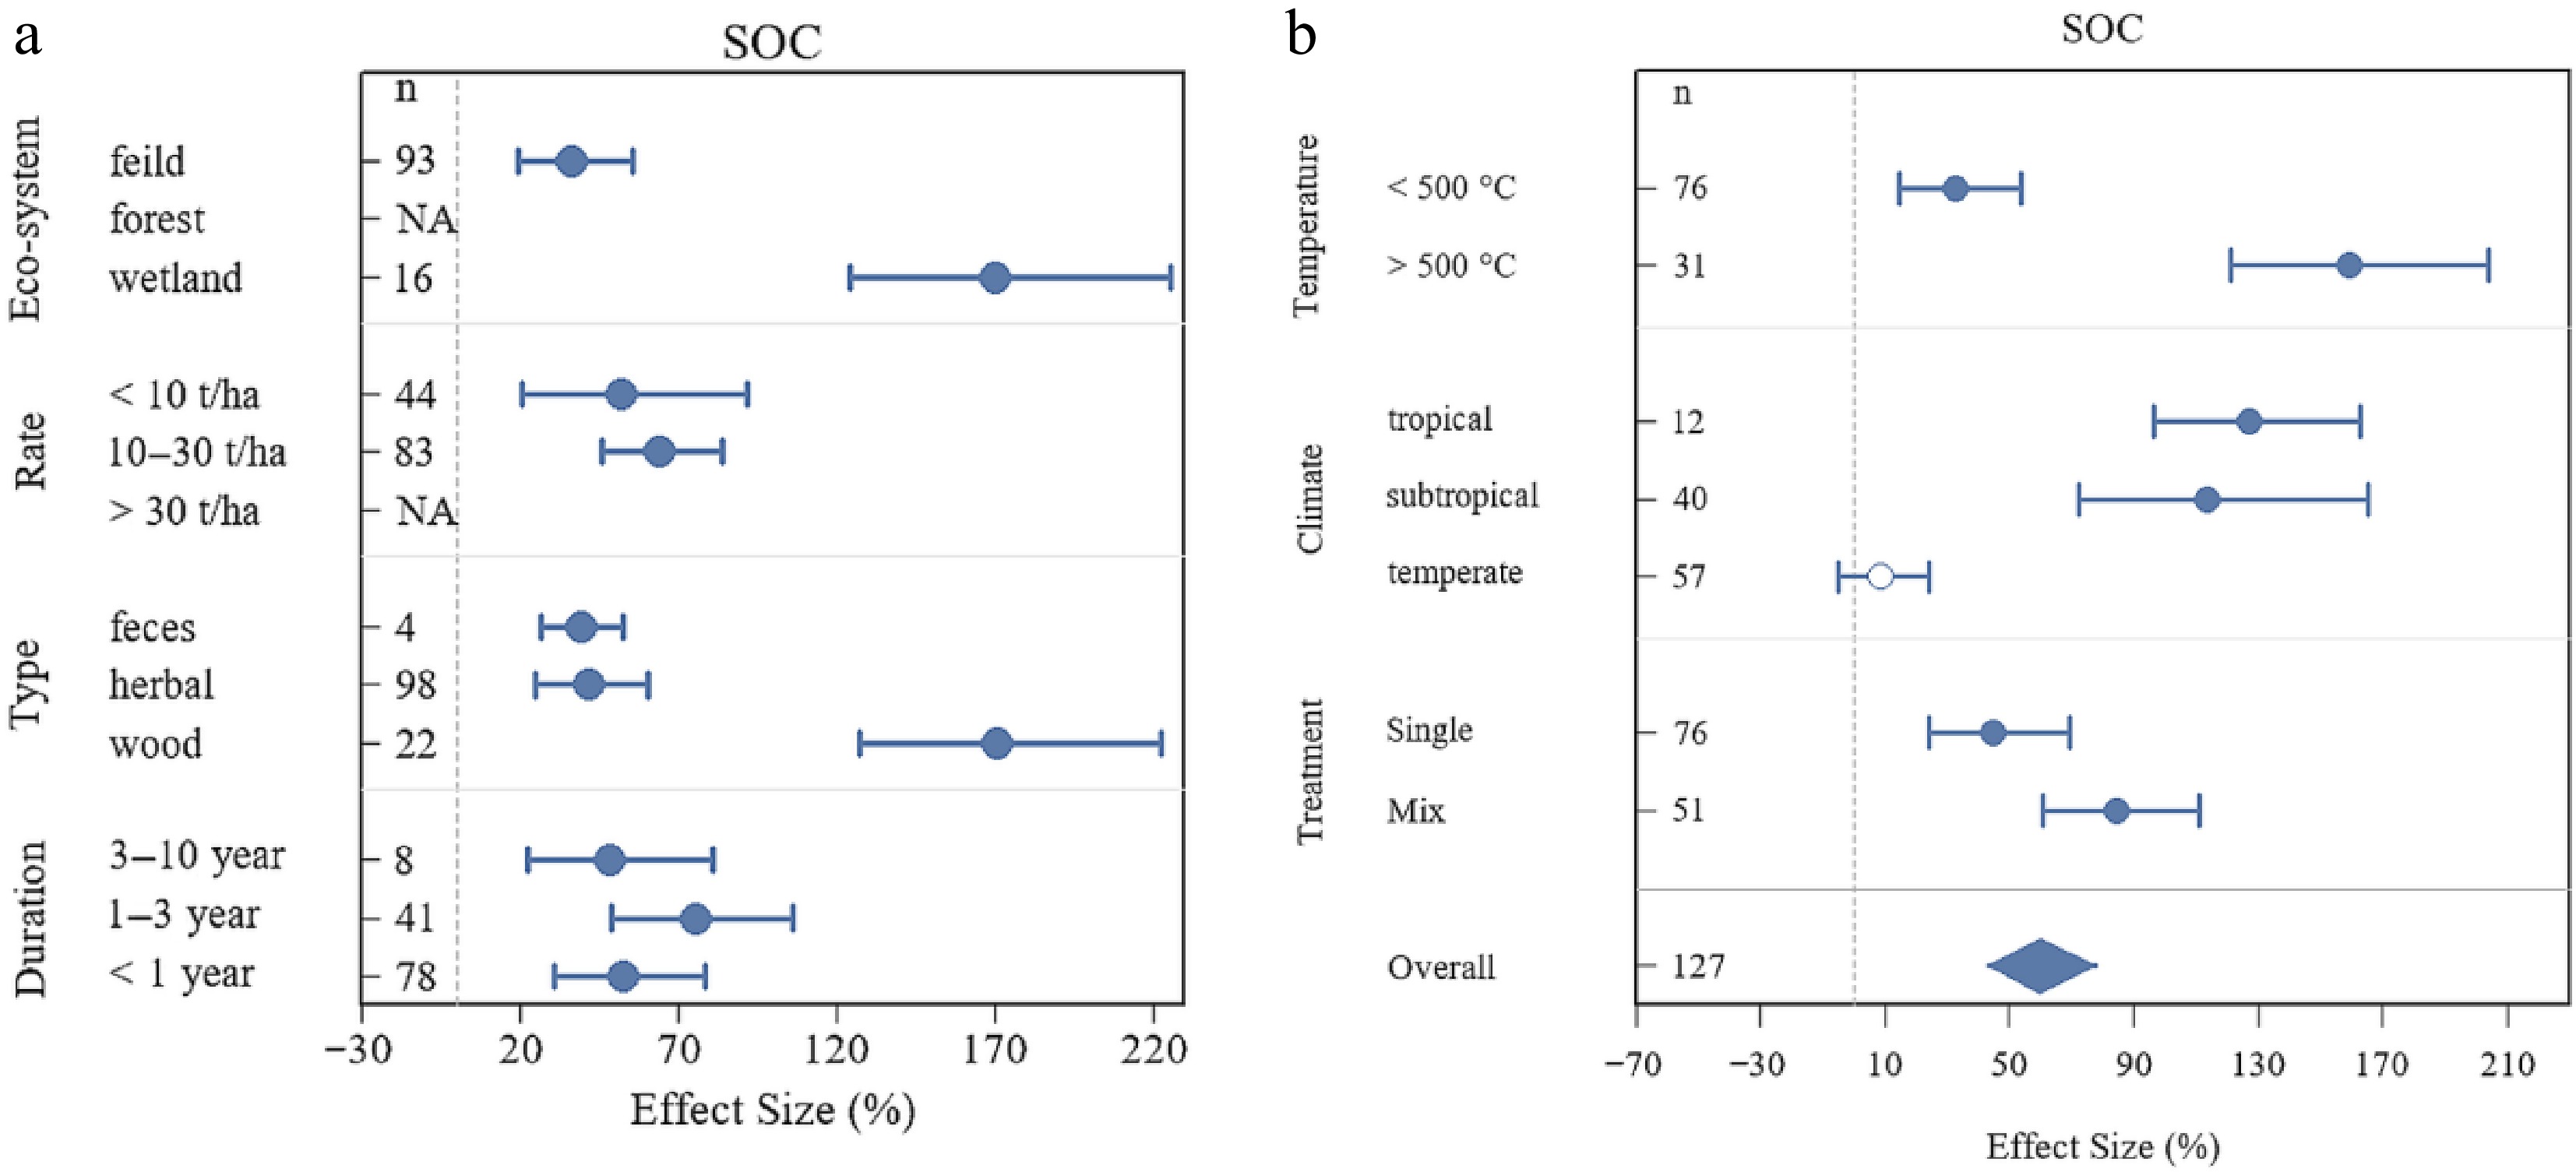
Figure 2.
Responses of soil organic carbon (SOC) to biochar across moderator groups. Forest plots summarizing subgroup meta-analyses of SOC responses to biochar by ecosystem type, application rate, feedstock type, experimental duration, pyrolysis temperature, climate zone, and treatment regime. Points indicate subgroup mean effect sizes, horizontal bars indicate 95% confidence intervals, and diamonds indicate the overall effect size. The vertical dashed line indicates no effect (0%). n indicates the number of paired treatment–control comparisons. Exact outcome-level heterogeneity statistics (Q and I2) are reported in Supplementary Table S2.
-
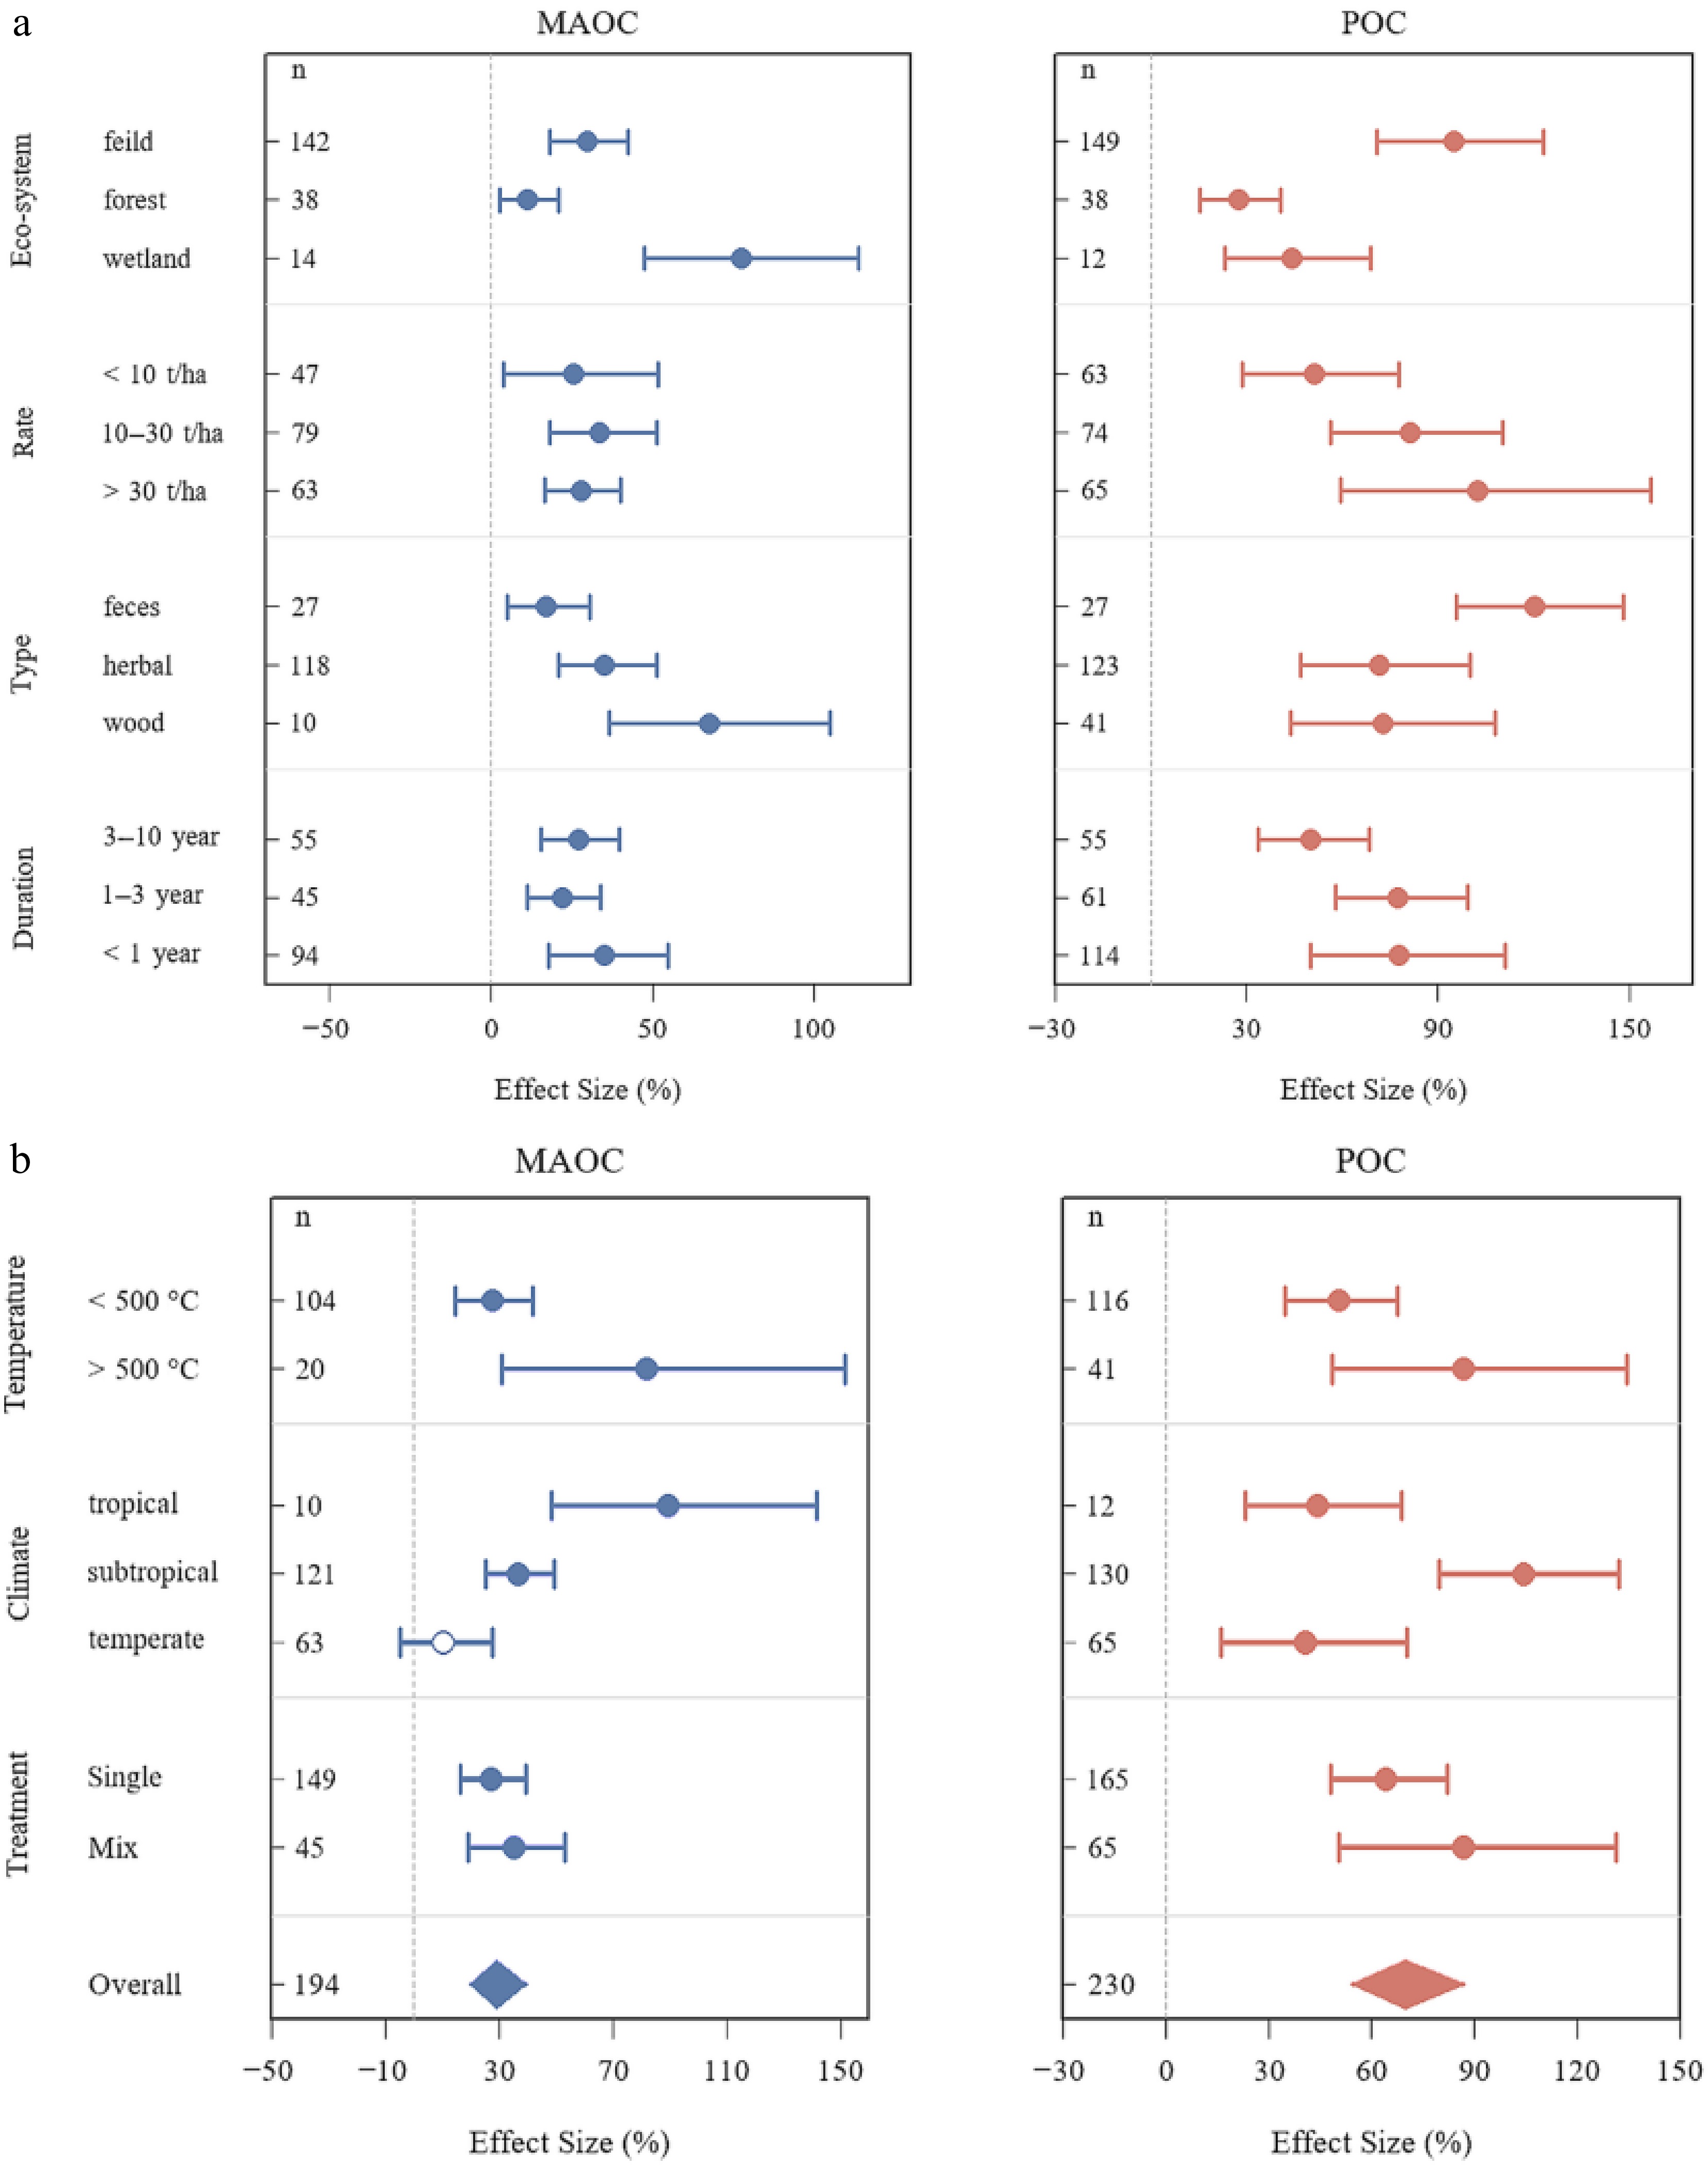
Figure 3.
Responses of mineral-associated organic carbon (MAOC) and particulate organic carbon (POC) to biochar across moderator groups. Subgroup meta-analyses showing the effects of biochar on MAOC and POC. Panels summarize responses by ecosystem type, application rate, feedstock type, experimental duration, pyrolysis temperature, climate zone, and treatment regime. Points represent subgroup mean effect sizes, horizontal bars indicate 95% confidence intervals, and diamonds indicate the overall effect size. The vertical dashed line denotes 0% effect. n indicates the number of paired treatment–control comparisons. Exact outcome-level heterogeneity statistics (Q and I2) are reported in Supplementary Table S2.
-
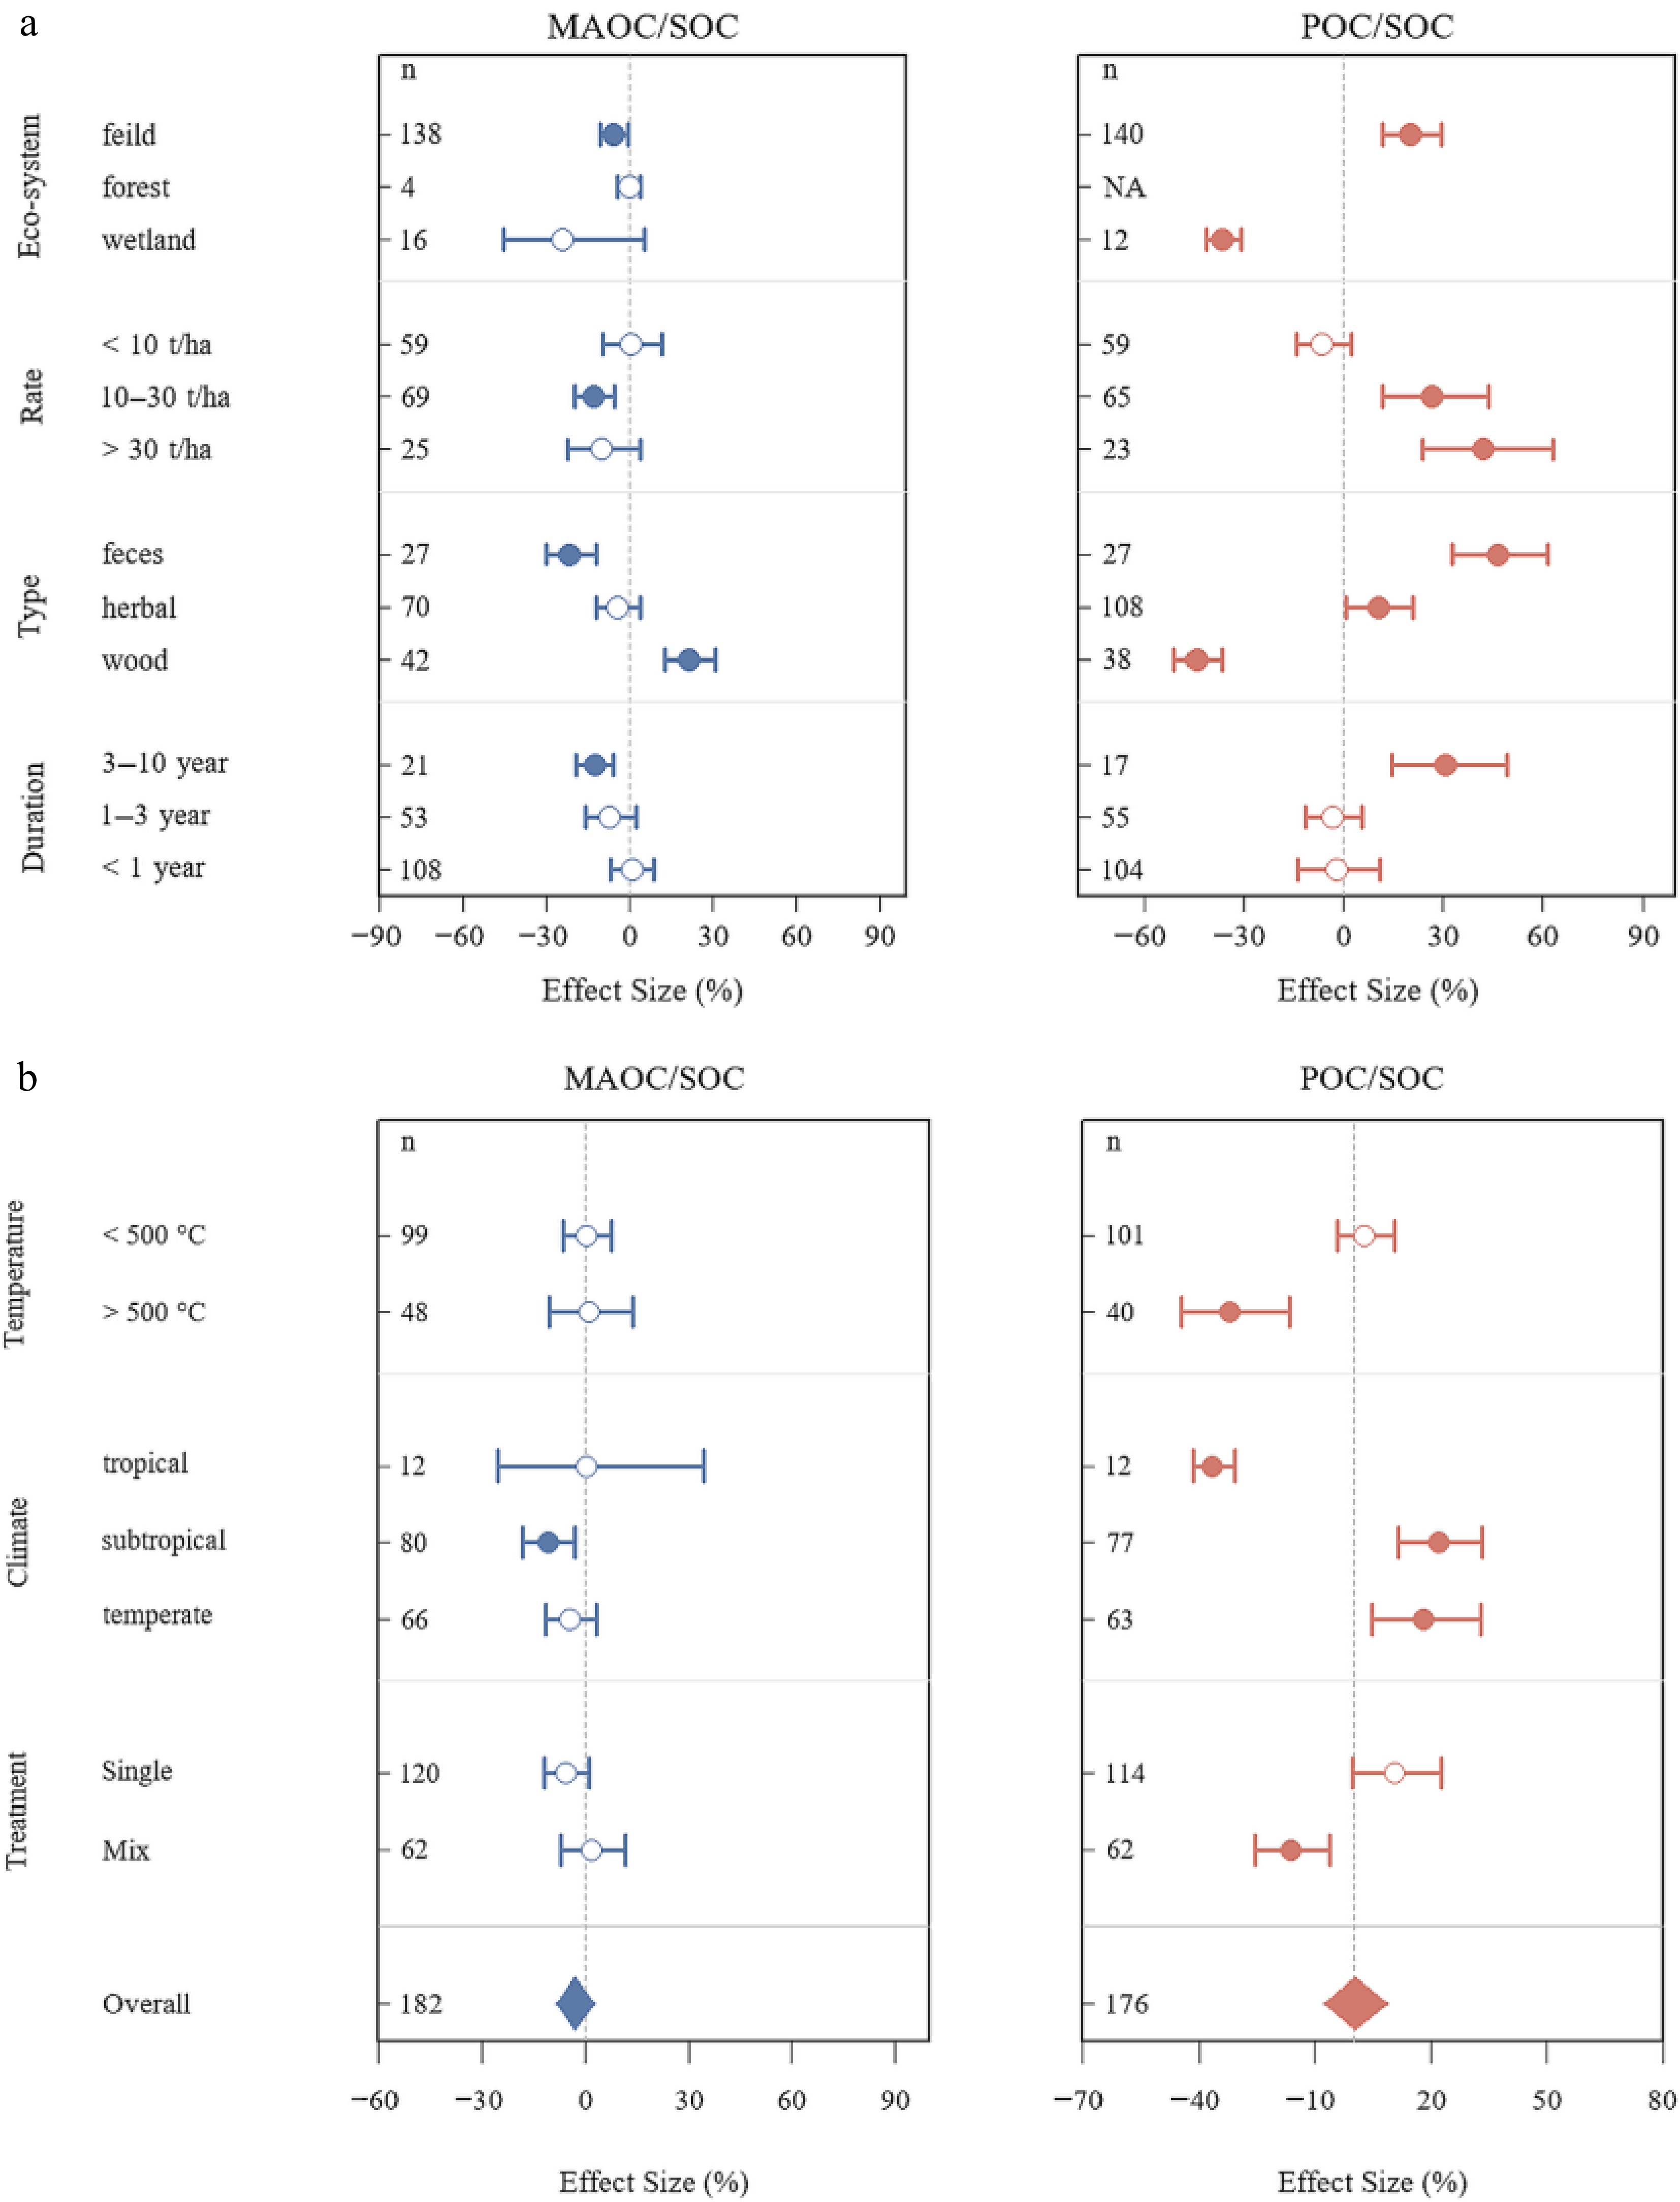
Figure 4.
Responses of SOC allocation ratios to biochar across moderator groups. Subgroup meta-analyses showing the effects of biochar on MAOC/SOC and POC/SOC. Panels summarize responses by ecosystem type, application rate, feedstock type, experimental duration, pyrolysis temperature, climate zone, and treatment regime. Points represent subgroup mean effect sizes, horizontal bars indicate 95% confidence intervals, and diamonds indicate the overall effect size. The vertical dashed line denotes 0% effect. n indicates the number of paired treatment–control comparisons. Exact outcome-level heterogeneity statistics (Q and I2) are reported in Supplementary Table S2.
-
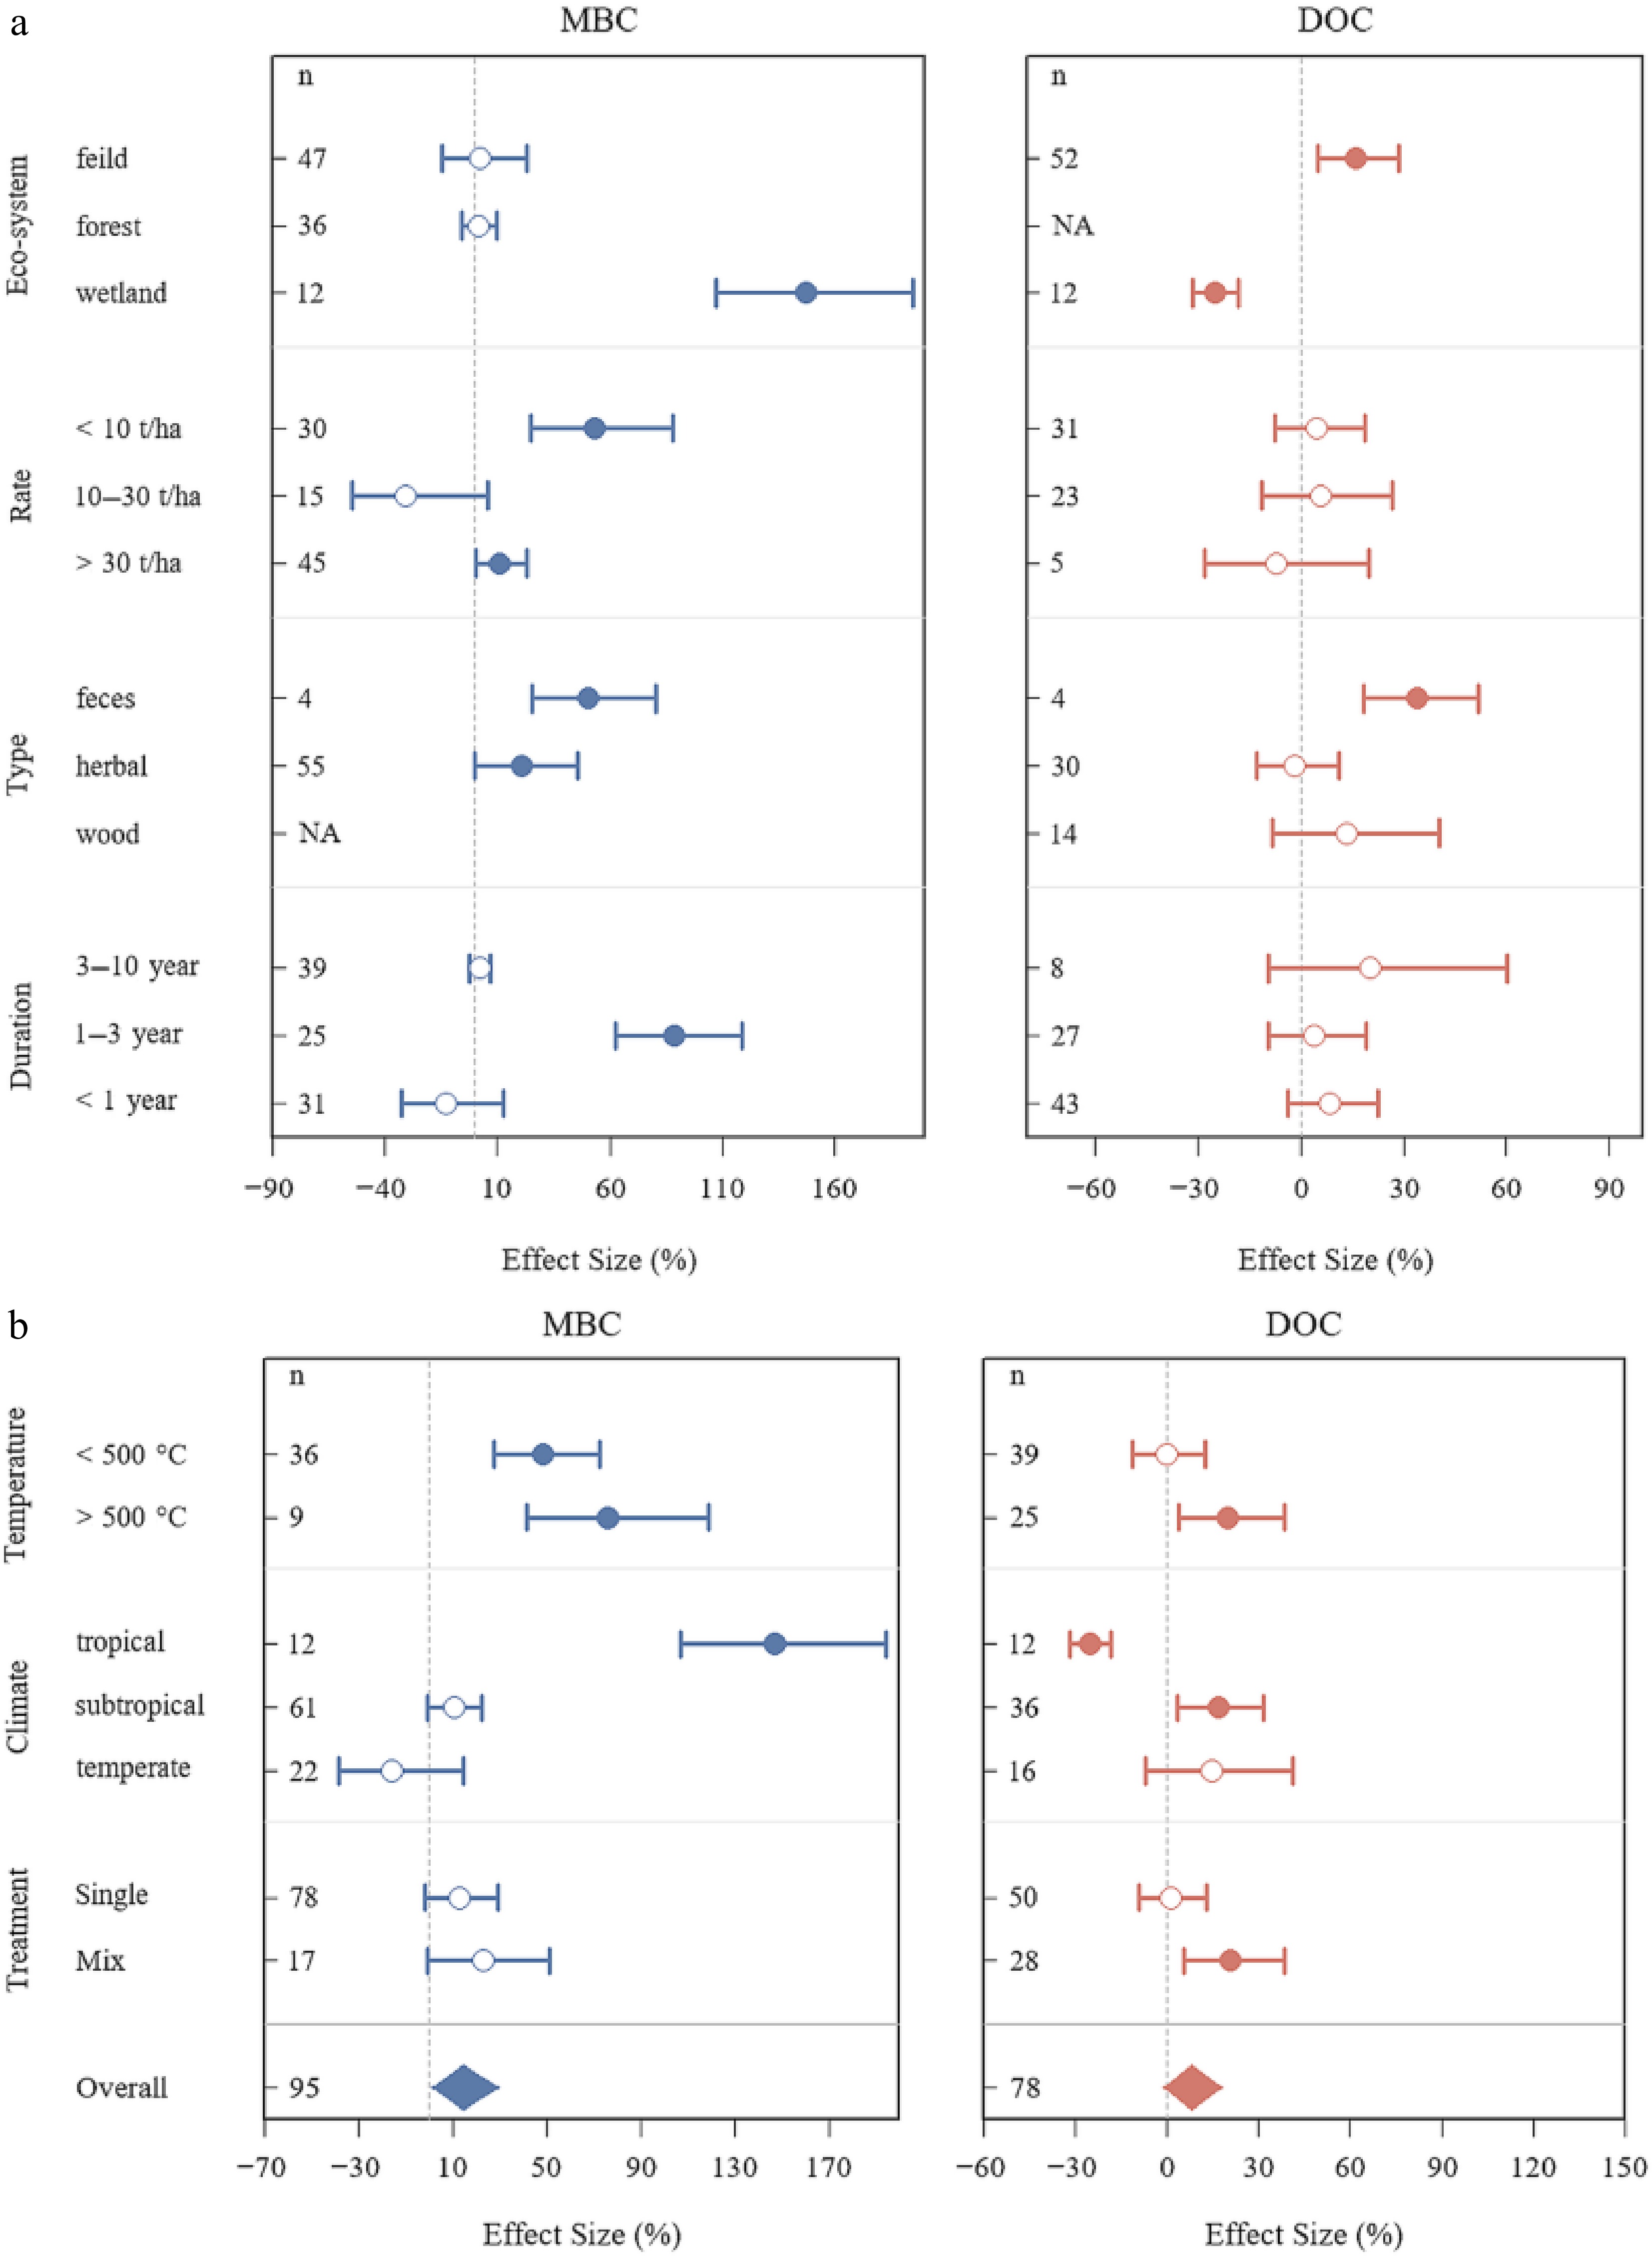
Figure 5.
Responses of microbial biomass carbon (MBC) and dissolved organic carbon (DOC) to biochar across moderator groups. Subgroup meta-analyses showing the effects of biochar on MBC and DOC. Panels summarize responses by ecosystem type, application rate, feedstock type, experimental duration, pyrolysis temperature, climate zone, and treatment regime. Points represent subgroup mean effect sizes, horizontal bars indicate 95% confidence intervals, and diamonds indicate the overall effect size. The vertical dashed line denotes 0% effect. n indicates the number of paired treatment–control comparisons. Exact outcome-level heterogeneity statistics (Q and I2) are reported in Supplementary Table S2.
-
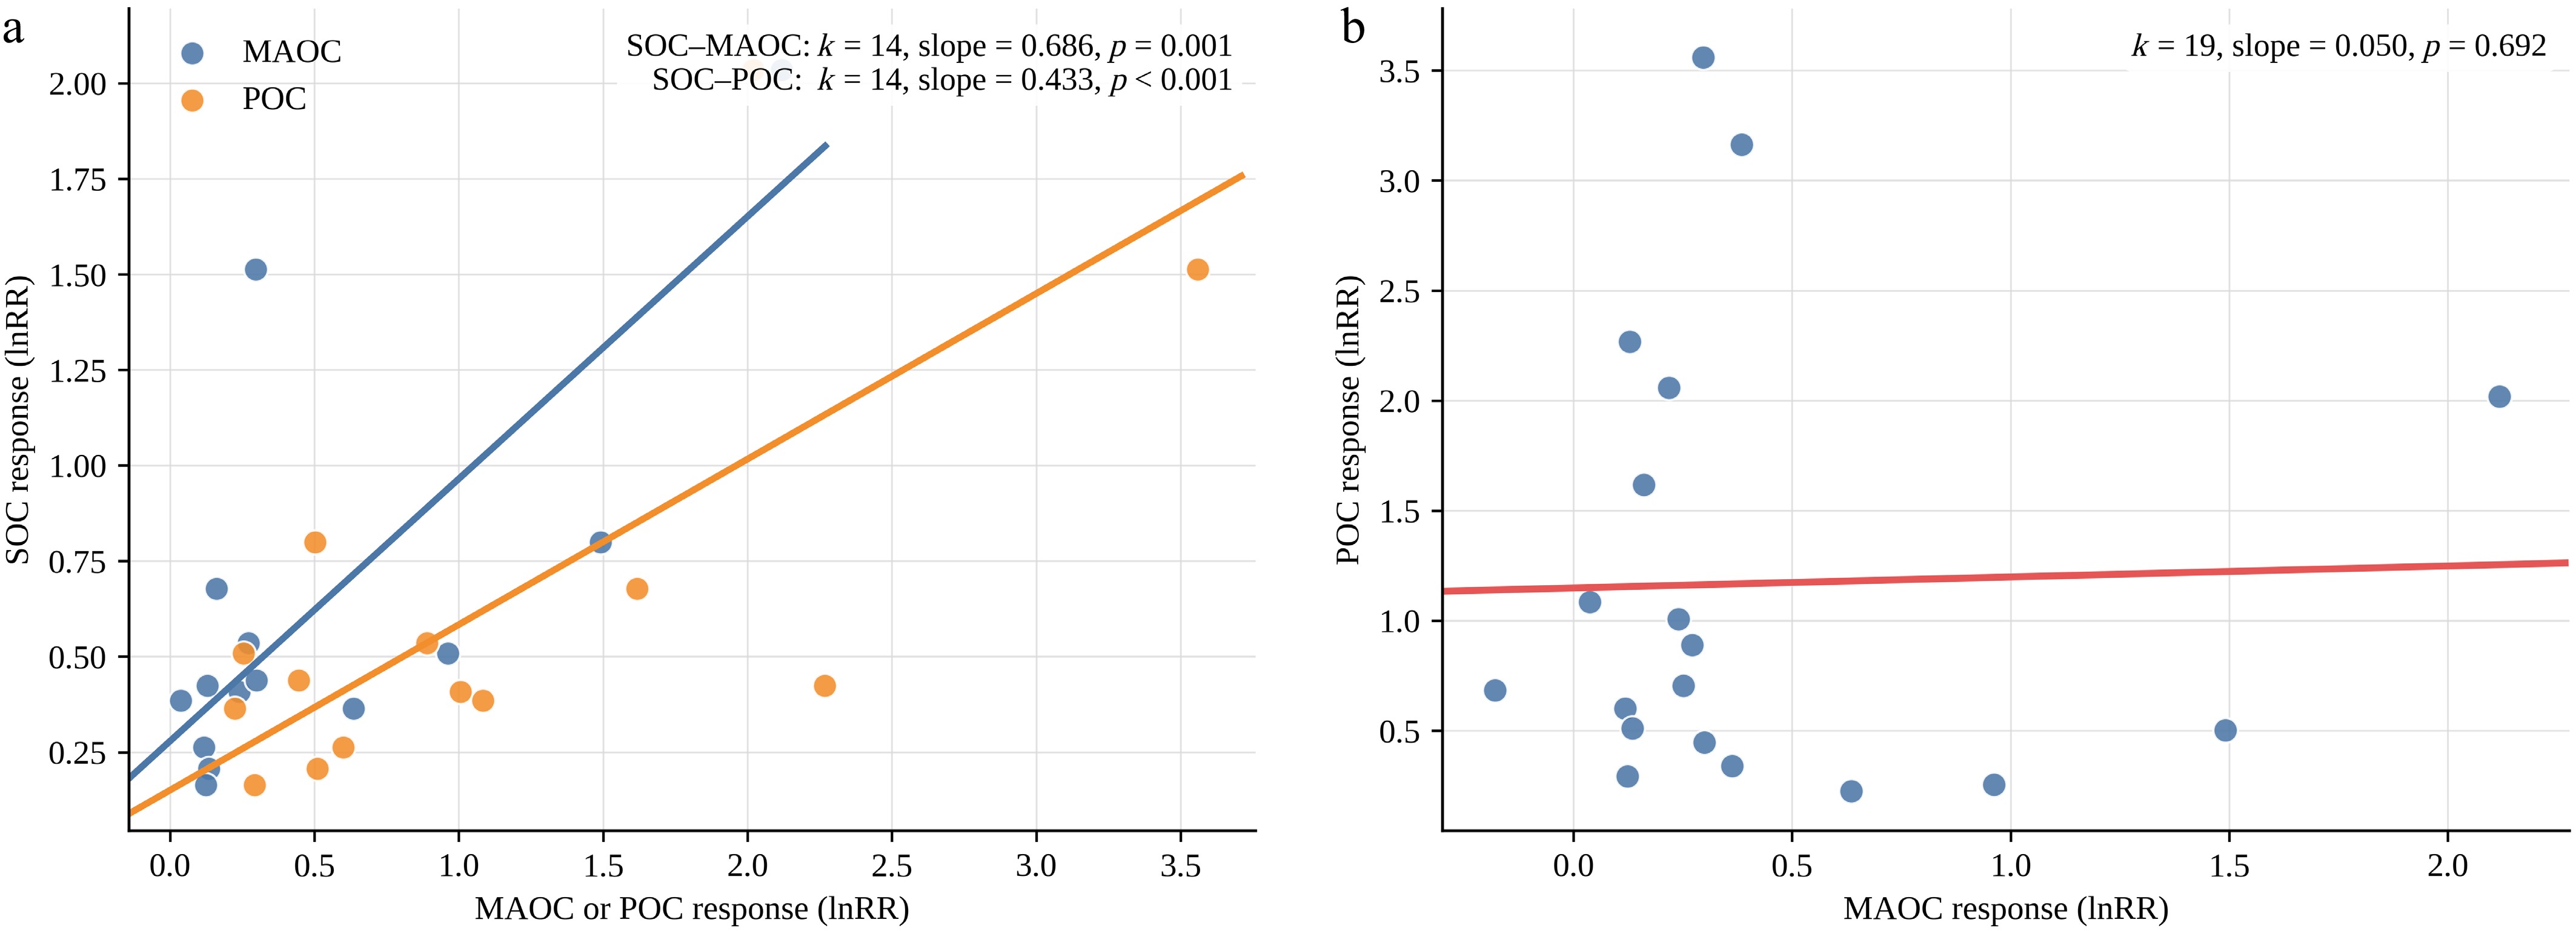
Figure 6.
Study-level mixed-effects meta-regression among SOC, MAOC, and POC responses. SOC was positively related to MAOC and POC responses, whereas the MAOC–POC relationship remained weak and non-significant. The fitted lines provide a descriptive visualization of study-level aggregated patterns among SOC, MAOC, and POC. They are included to illustrate the overall relationship rather than to provide formal mechanistic evidence or independent statistical inference.
-
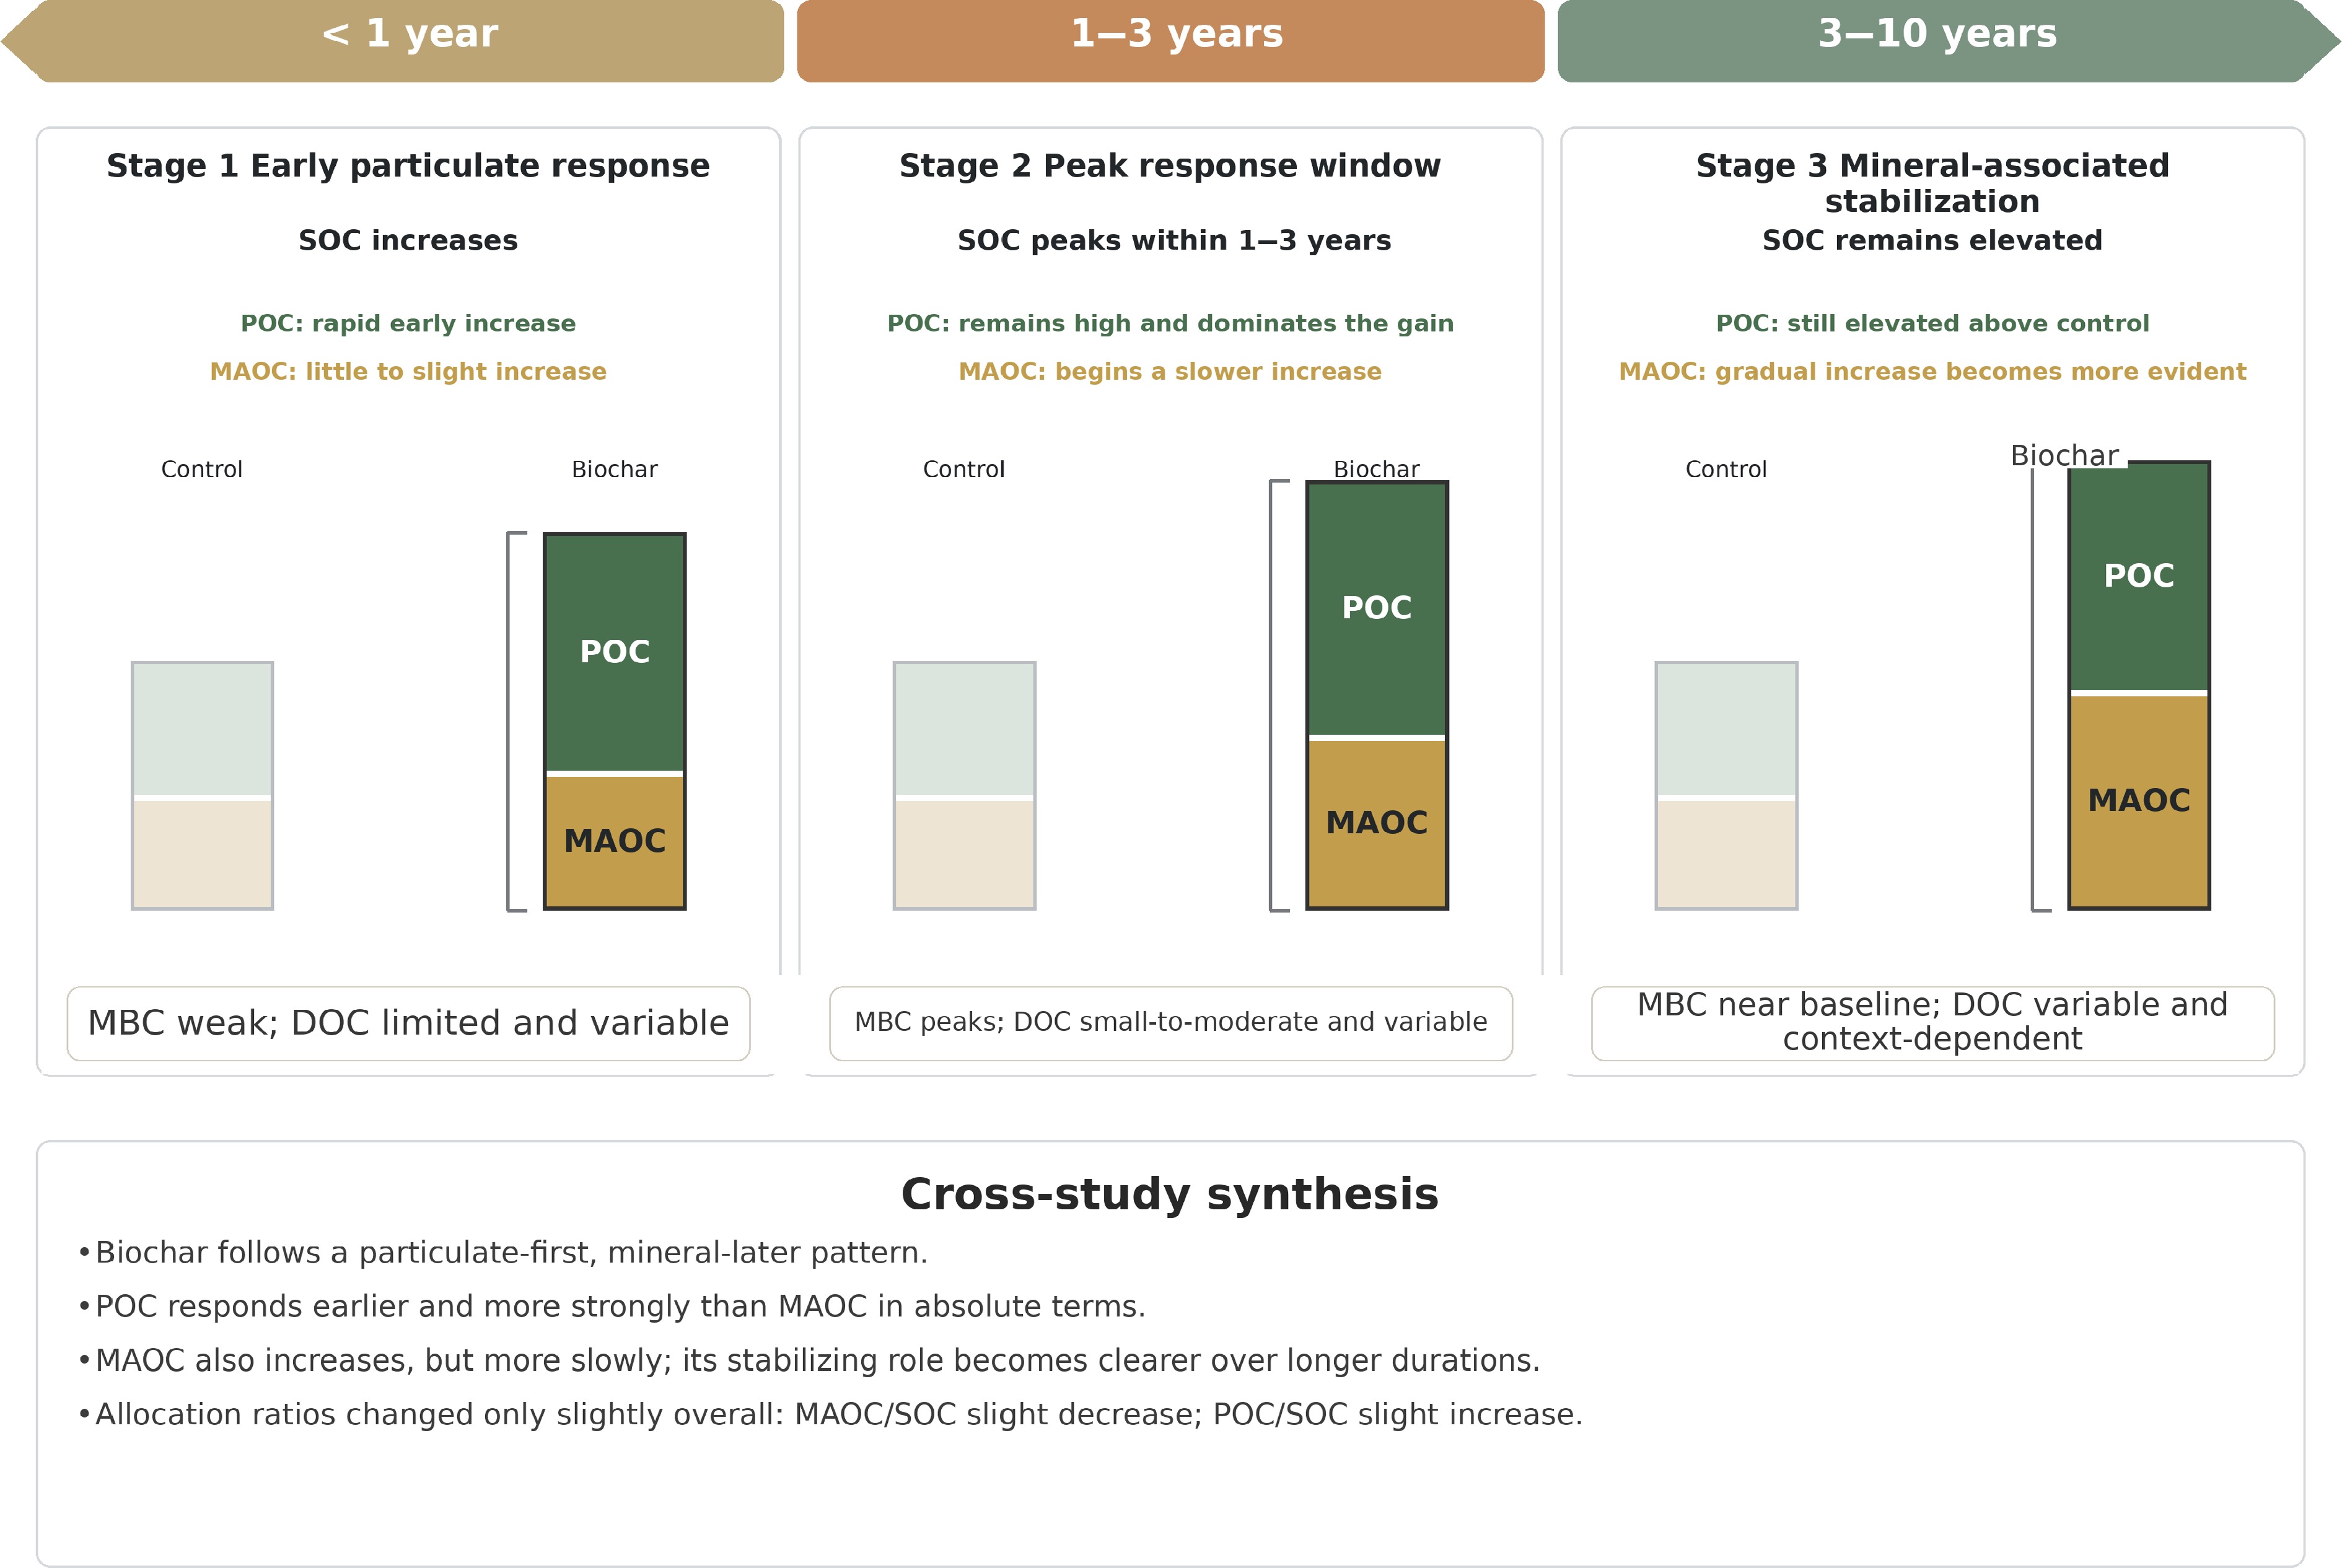
Figure 7.
Conceptual synthesis of time-dependent responses of soil organic carbon fractions to biochar amendment. The height of the stacked column indicates SOC stock, whereas the upper (POC) and lower (MAOC) segments denote absolute pool sizes (schematic, not to scale). The schematic illustrates a rapid early increase in POC, a transient microbial activation phase, and a slower rise in MAOC over time.
Figures
(7)
Tables
(0)