-
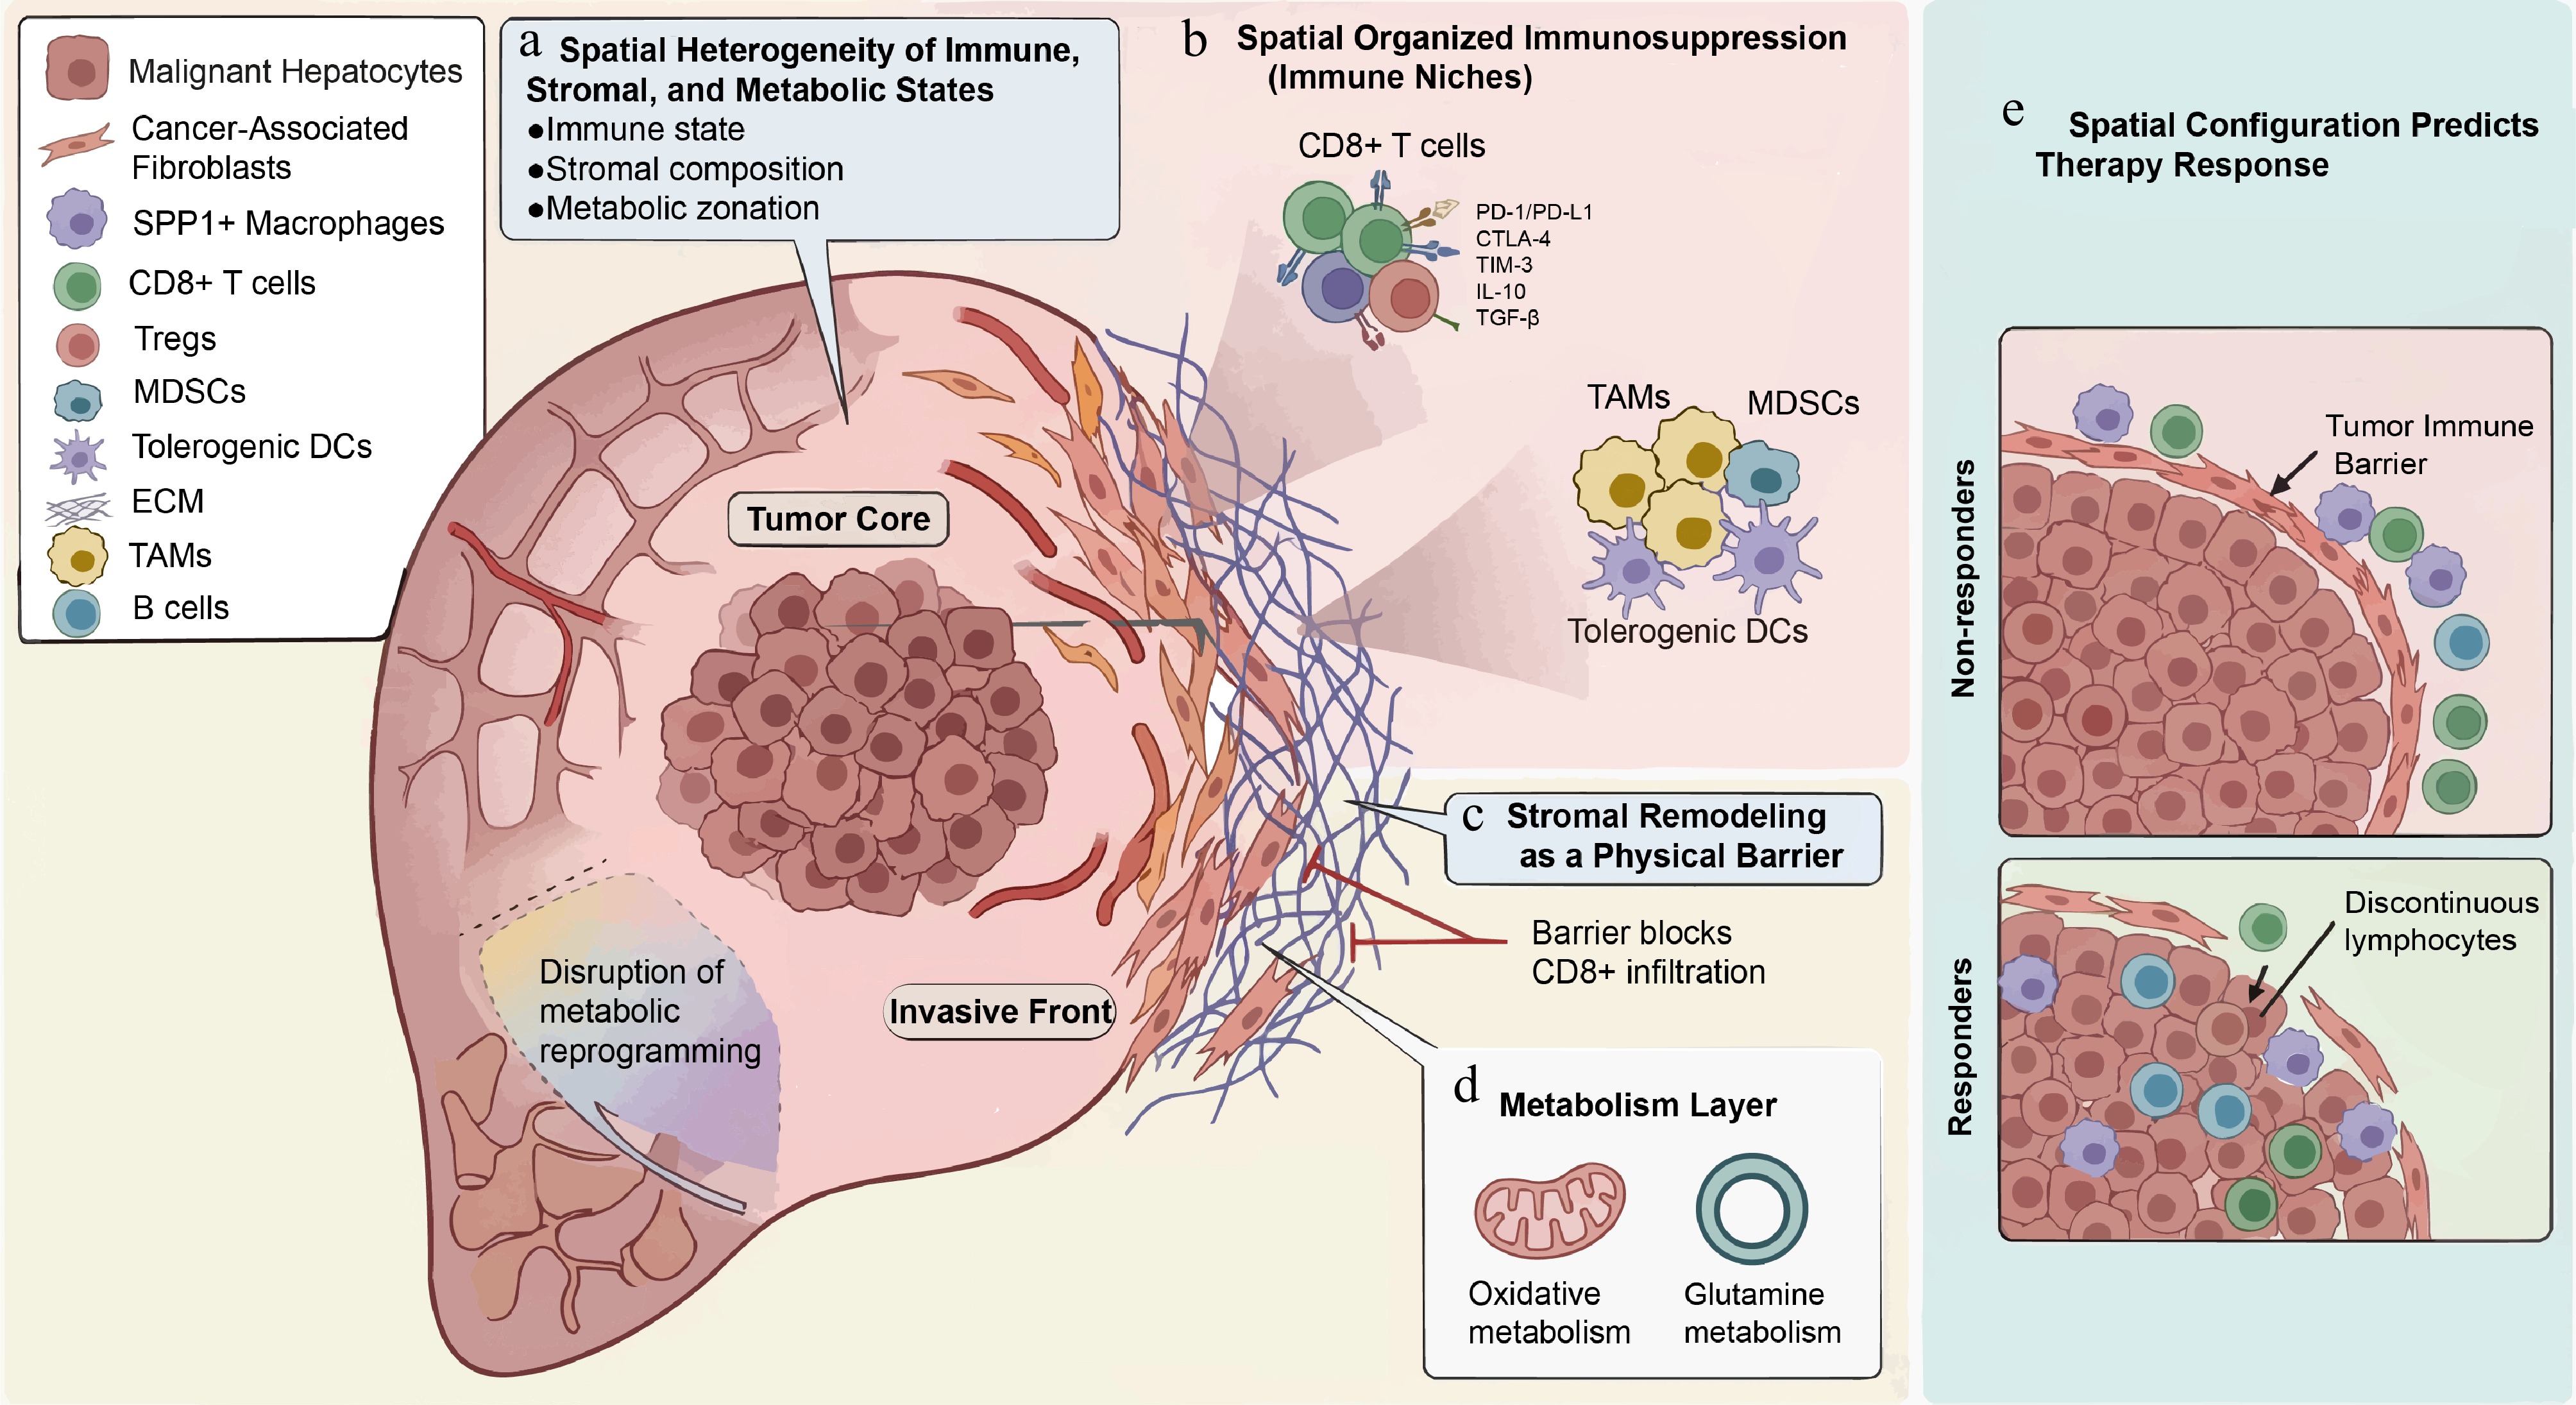
Figure 1.
The spatial architecture of HCC dictates its diverse microenvironments and impacts therapeutic efficacy. (a) Spatial heterogeneity of the tumor microenvironment. Anisotropic, non-uniform spatial distribution of malignant subclones, specialized stromal subpopulations, and metabolic zones across the tumor core, invasive front, and adjacent stroma. (b) Spatial organization of immunosuppression. Cellular localization of immune-suppressive niches. (c) Stromal barrier and lymphocyte exclusion. Integrated spatial transcriptomics and mIHC identifying dense extracellular matrix (ECM) deposition and aligned collagen at the invasive front. (d) Metabolic rewiring and localized stress gradients. Distortion of native hepatic metabolic zonation via hyper-activated glycolysis and altered lipid/glutamine flux, generating microscale metabolic stress zones (high lactate accumulation) that compromise effector cell mitochondrial function. (e) Spatial configurations predict therapy response.
-
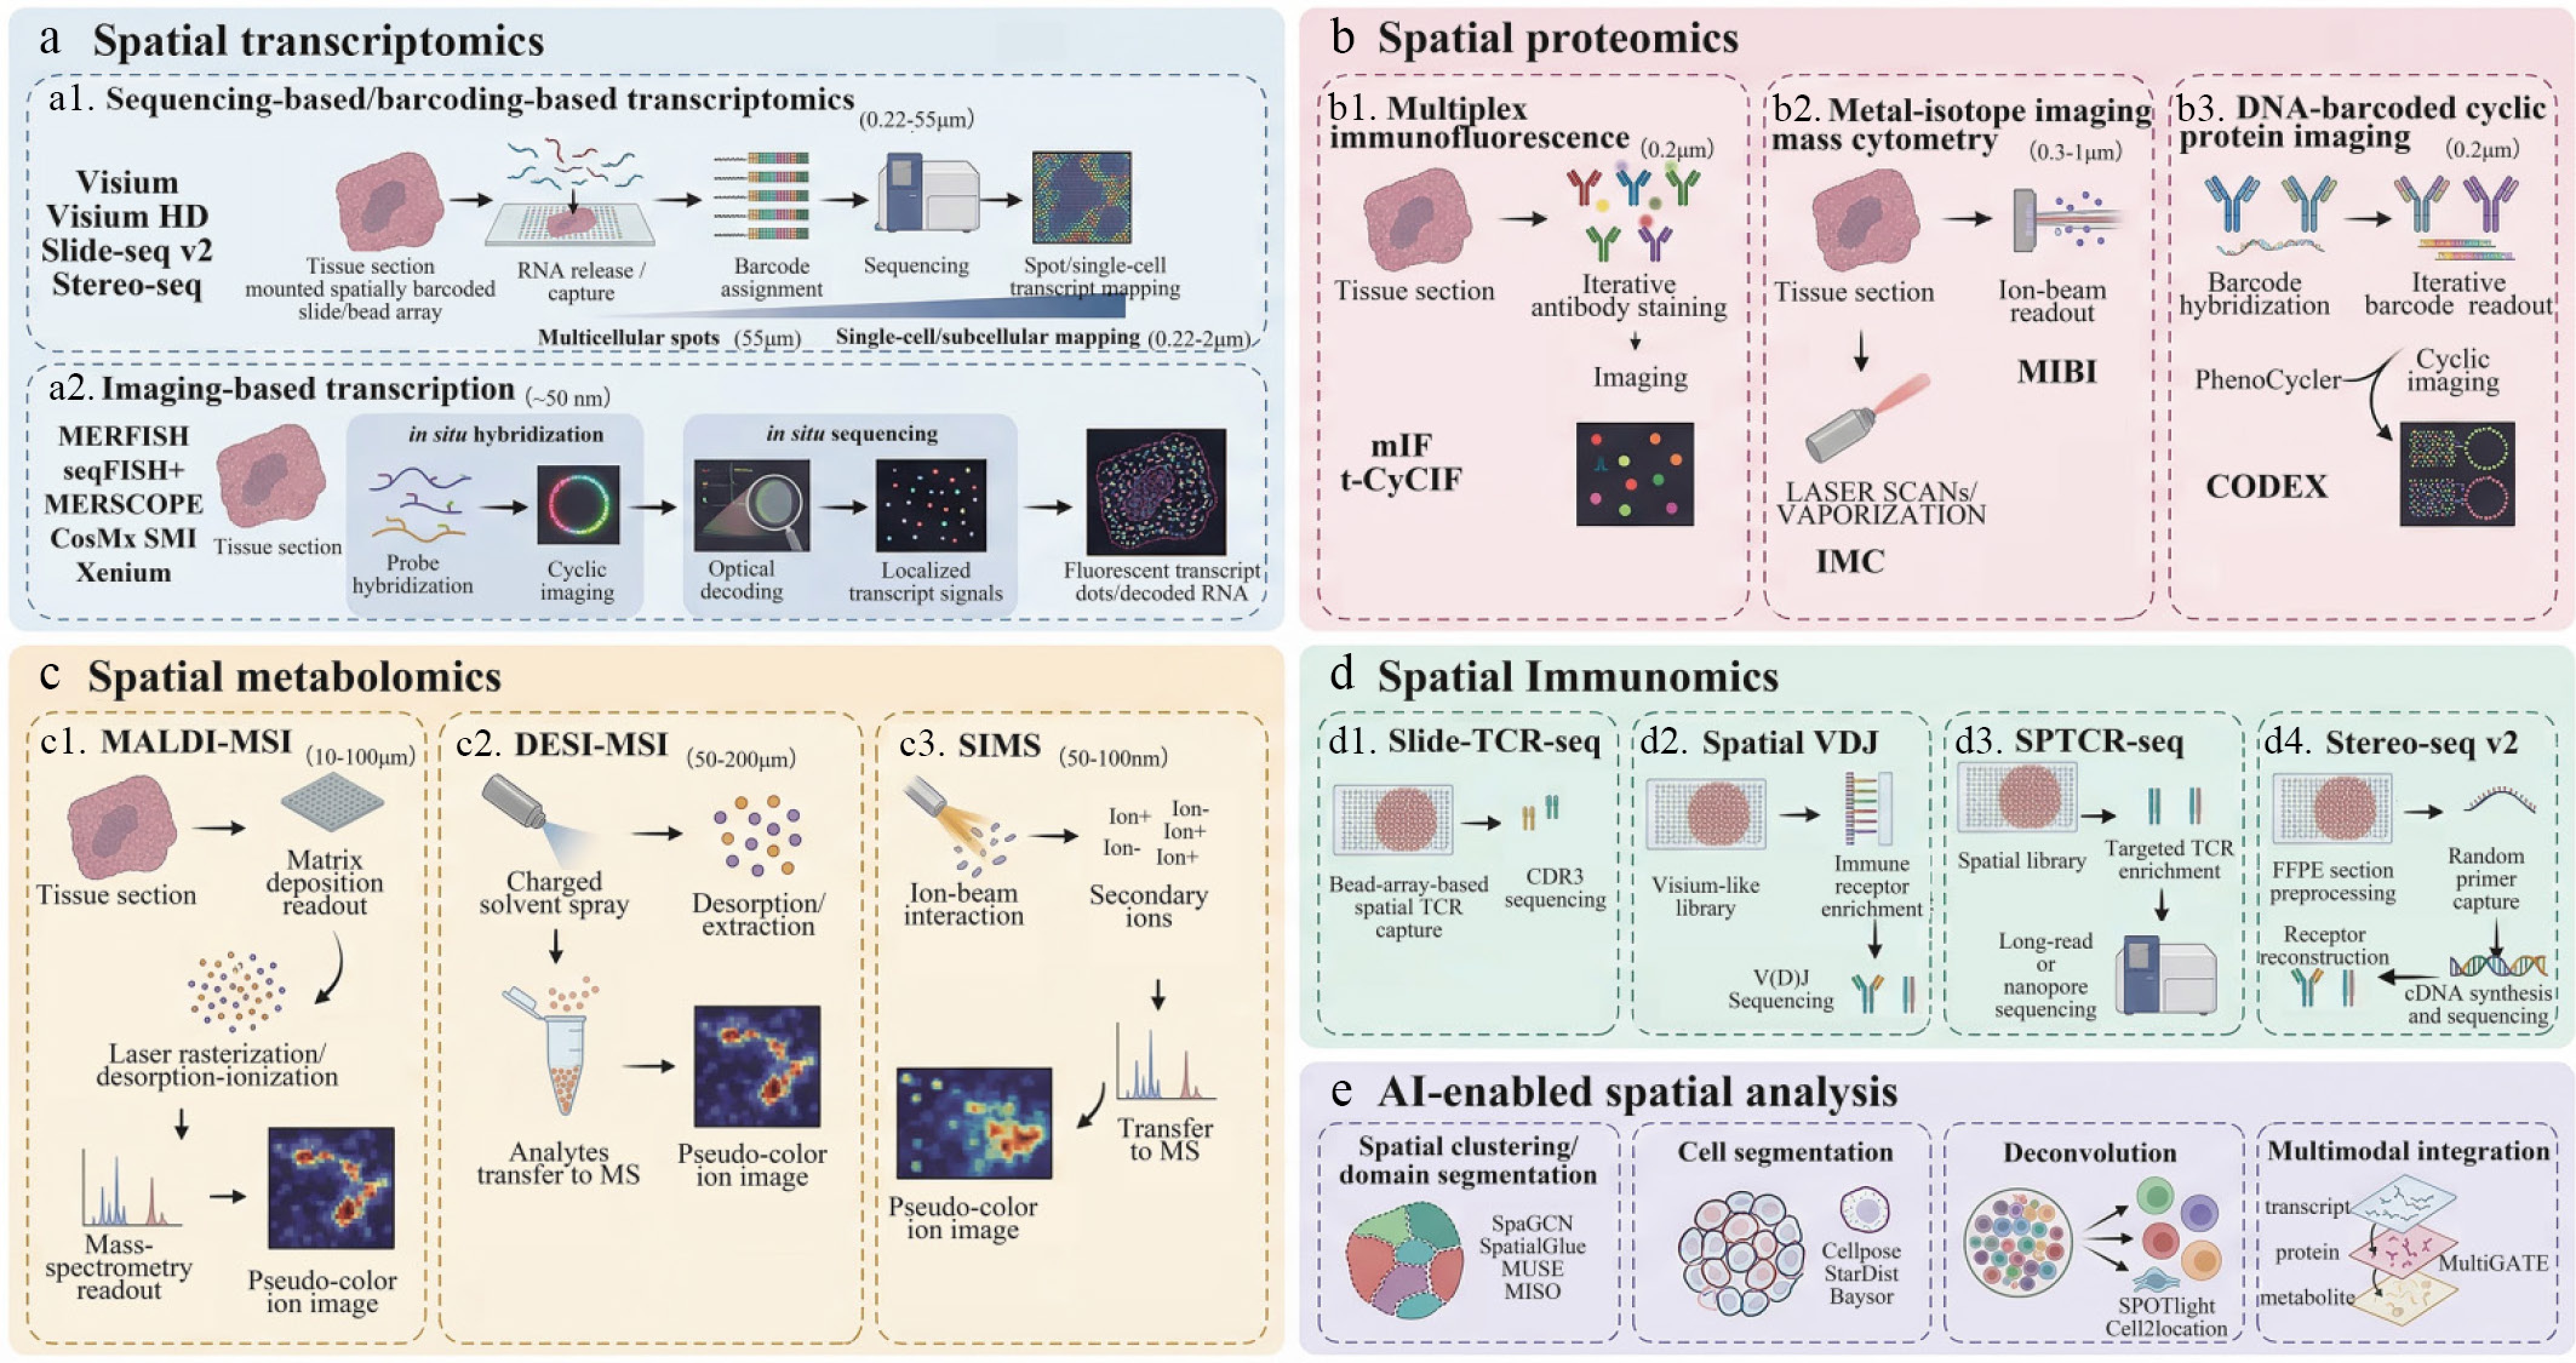
Figure 2.
Overview of spatial omics technologies in hepatocellular carcinoma. This schematic summarizes major spatial omics platforms and computational strategies for resolving spatial heterogeneity in HCC. (a) Spatial transcriptomics maps RNA expression in situ using sequencing/barcoding-based methods (for example, Visium, Visium HD, and Slide-seq v2) or imaging-based approaches (such as MERFISH, seqFISH+, MERSCOPE, CosMx SMI, and Xenium), enabling spatial reconstruction from multicellular to near single-cell or subcellular resolution. (b) Spatial proteomics profiles protein distribution through multiplex immunofluorescence, metal-isotope imaging mass cytometry, and DNA-barcoded cyclic protein imaging. (c) Spatial metabolomics maps metabolites and lipids using MALDI-MSI, DESI-MSI, and SIMS, revealing metabolic gradients across tumor, stromal, hypoxic, necrotic, and perivascular regions. (d) Spatial immune repertoire profiling localizes TCR/BCR clonotypes through Slide-TCR-seq, Spatial VDJ, SPTCR-seq, and Stereo-seq-based inference. (e) AI-enabled spatial analysis supports spatial clustering, domain segmentation, cell segmentation, deconvolution, and multimodal integration. Together, these approaches provide integrated spatial insight into HCC tissue architecture, tumor microenvironment organization, and clinically relevant biological states.
-
Platform Resolution Throughput Tissue Primary strengths Limitations Applications Spatial transcriptomics Visium v2 55 µm WT FFPE/FF Unbiased capture, standard workflow Coarse resolution Dissecting region-specific immune, stromal, and metabolic partitions[33,66] Visium HD 2 µm WT FFPE/FF Single-cell profiling, untargeted High cost, data sparsity Profiling localized cellular heterogeneity and immune aggregates[15] Stereo-seq 500 nm WT FF Large FOV, sub-micron resolution Limited sensitivity Mapping suppressive invasive front dynamics and progress cues[67] Stereo-seq v2 500 nm WT FF Simultaneous profiling of the V(D)J immune repertoire High sequencing depth reliance Tracing spatial clonal lineages in archived clinical FFPE cohorts[19] GeoMx DSP 10–600 µm Targeted WT FFPE/FF Flexible ROI selection Non-single-cell Compartment-specific (intratumoral vs stromal) profiles[66] Xenium 50 nm Targeted
(≤ 5,000)FFPE/FF High sensitivity and throughput Closed gene panel Mapping subcellular ligand-receptor networks and checkpoints[11] MERFISH 100 nm Targeted
(≤ 1,000+)FFPE/FF High quantitative accuracy Long imaging times Direct visualization and quantification of oncogenic transcripts[20] CosMx SMI < 1 µm Targeted
(≤ 6,000)FFPE/FF True subcellular imaging Segmentation artifacts Isolating metabolic-transcriptomic niches in cell communities[21] Spatial proteomics PhenoCycler 0.2–0.5 µm Targeted (40–100+) FFPE/FF High-plex single-cell screening Iterative fluidics time Elucidating physical barriers formed by CAFs and TAMs[43] IMC 1 µm Targeted (40) FFPE/FF Negligible signal overlap Low SNR for low-expression proteins Mapping multiplexed 2D immune topology in HBV-infected tissues[6] Spatial metabolomics MALDI-MSI 10–100 µm m/z 500–
20,000FF Label-free intact tracking Matrix interference Deconstructing peritumoral lactate gradients and lipid rewiring[48,45] DESI-MSI 50–200 µm m/z 10–
2,000FF Ambient soft ionization Low resolution Rapid label-free metabolic mapping with minimal preparation[49] Abbreviations: WT, whole transcriptome; FF, fresh-frozen; FFPE, formalin-fixed paraffin-embedded; FOV, field of view; ROI, region of interest; IMC, imaging mass cytometry; MSI, mass spectrometry imaging; SNR, signal-to-noise ratio; m/z, mass-to-charge ratio; CAFs, cancer-associated fibroblasts; TAMs, tumor-associated macrophages. Table 1.
Comparison of spatial omics platforms in HCC.
Figures
(2)
Tables
(1)