












-
Primary liver cancer presents one of the most formidable challenges in contemporary oncology, retaining its position as the third leading cause of cancer-related mortality globally and representing approximately 7% to 8% of all oncological deaths. The disease burden exhibits profound geographical disparity, with an exceptionally heavy concentration in Asia; notably, patients from China alone account for more than half of the emerging cases worldwide. The vast majority of these diagnoses, exceeding 80%, are pathologically classified as hepatocellular carcinoma (HCC)[1]. A defining clinical feature of HCC is its remarkably insidious onset, meaning that the disease remains largely asymptomatic in its early developmental stages and is consequently diagnosed at an advanced, often unresectable stage. This diagnostic delay is critically compounded by a pervasive lack of effective early-screening strategies capable of capturing initial malignant transformations. When coupled with a high propensity for therapeutic resistance, these compounding factors culminate in an exceptionally poor overall prognosis for patients, positioning HCC as a paramount public health priority that demands urgent diagnostic and therapeutic innovation.
The clinical and biological complexity of HCC is rooted in the progressive disruption of the liver's native spatial organization, together with systemic remodeling of immune and stromal architectures. In healthy liver tissue, the intrinsic portal–central axis establishes stable gradients of oxygen, nutrients, and metabolites, giving rise to well-defined hepatocyte metabolic zonation and a characteristic transcriptional program[2,3]. This ordered spatial-metabolic framework provides a critical molecular reference for interpreting physiological and pathological states. However, chronic liver injury, fibrosis, and tumorigenesis progressively blur or reprogram this spatial order, complicating the distinction between tumor-specific alterations and background liver disease-associated changes[1,4,5].
The critical necessity of resolving these spatial dynamics has triggered a major methodological paradigm shift away from traditional statistical assumptions and destructive biological assays. For decades, conventional bulk RNA sequencing represented the gold standard for molecular profiling; however, because it captures an averaged gene expression profile across bulk cell populations, it inherently fails to resolve the underlying intra-tumor cellular heterogeneity. To overcome this limitation, the maturation of single-cell RNA sequencing (scRNA-seq) has provided unprecedented resolution into individual cellular transcriptomes, uncovering a vast diversity of rare cell states and sub-clusters within the tumor ecosystem. Nevertheless, scRNA-seq exhibits a fundamental technical limitation: the mandatory requirement for mechanical tissue dissociation and cell suspension preparation results in the complete and irreversible loss of the native spatial context. Consequently, dissociated single-cell approaches cannot capture region-specific spatial domains—such as the highly organized arrangements characterizing the tumor core, the invasive front, or the surrounding fibro-inflammatory stroma—nor can they map the structural microenvironments that govern local immune cell signaling and physical cell-cell interaction networks (Fig. 1).
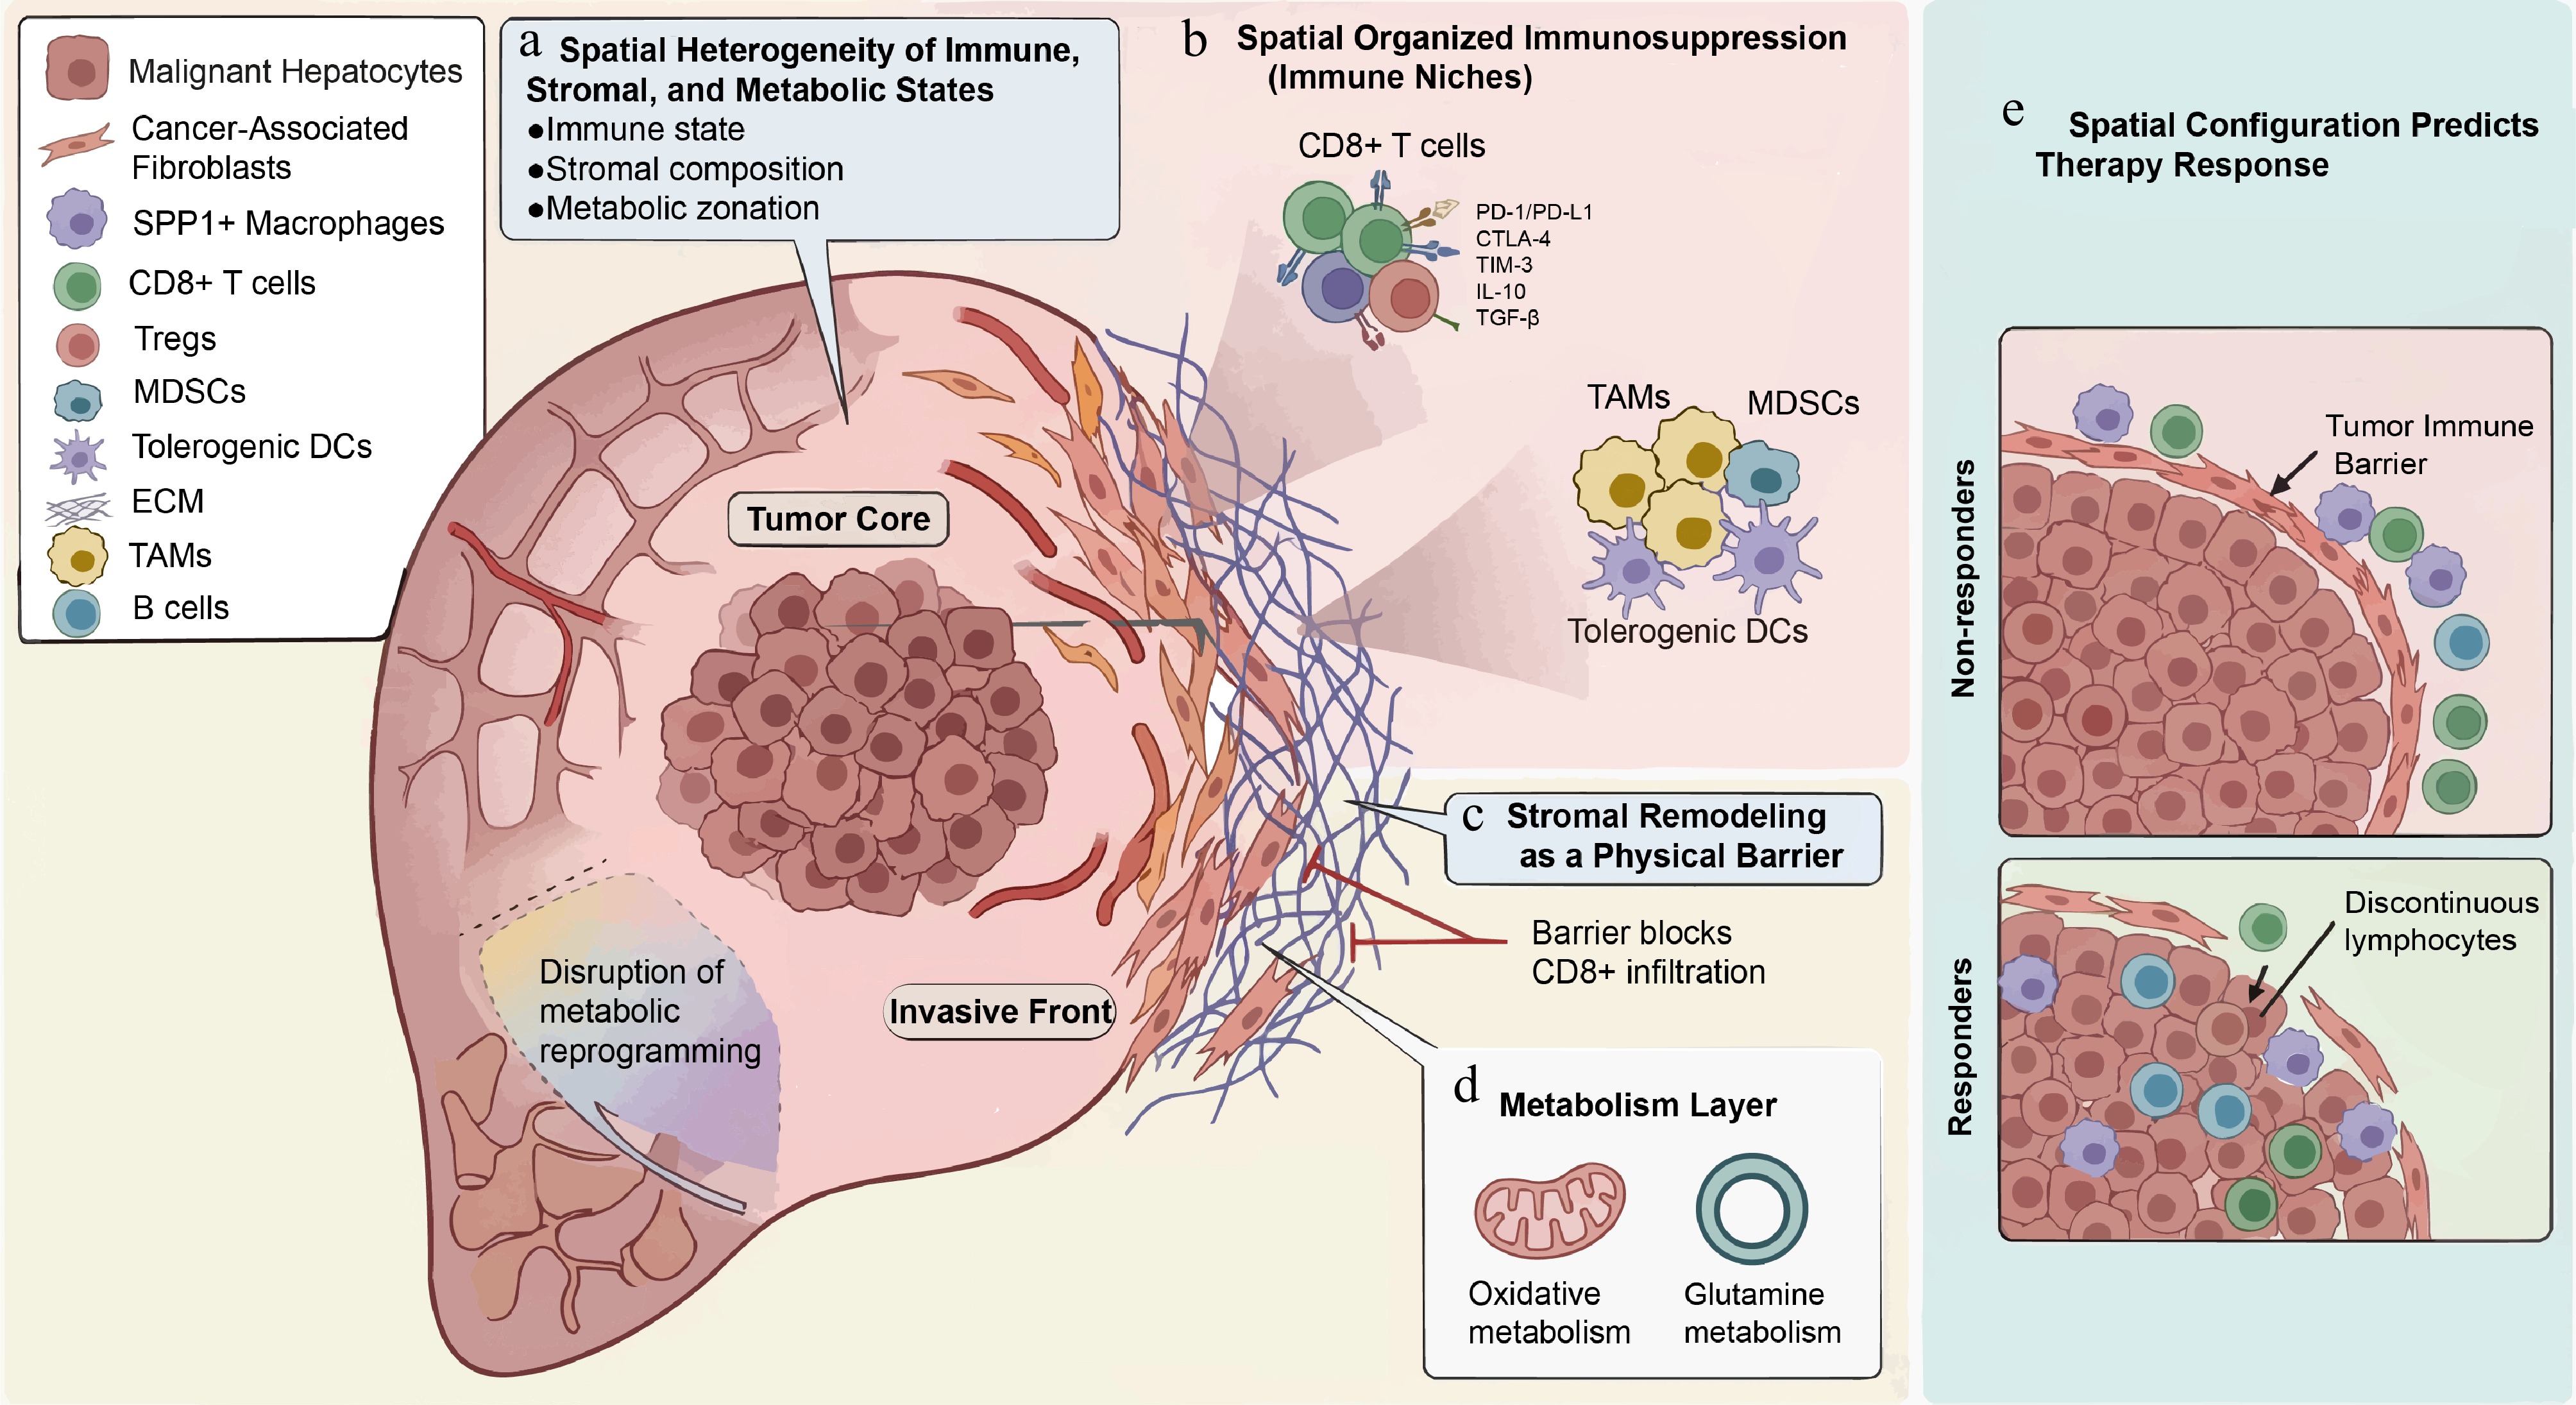
Figure 1.
The spatial architecture of HCC dictates its diverse microenvironments and impacts therapeutic efficacy. (a) Spatial heterogeneity of the tumor microenvironment. Anisotropic, non-uniform spatial distribution of malignant subclones, specialized stromal subpopulations, and metabolic zones across the tumor core, invasive front, and adjacent stroma. (b) Spatial organization of immunosuppression. Cellular localization of immune-suppressive niches. (c) Stromal barrier and lymphocyte exclusion. Integrated spatial transcriptomics and mIHC identifying dense extracellular matrix (ECM) deposition and aligned collagen at the invasive front. (d) Metabolic rewiring and localized stress gradients. Distortion of native hepatic metabolic zonation via hyper-activated glycolysis and altered lipid/glutamine flux, generating microscale metabolic stress zones (high lactate accumulation) that compromise effector cell mitochondrial function. (e) Spatial configurations predict therapy response.
-
A major diagnostic challenge stems from the pronounced spatial heterogeneity of HCC. Distinct immune, metabolic, and stromal states coexist within the tumor core, invasive front, and peritumoral regions[6]. Metabolic zonation that characterizes healthy liver tissue becomes distorted or locally reprogrammed in tumor regions[7−9], leading to heterogeneous expression of glycolytic, oxidative phosphorylation, and glutamine metabolic pathways across spatial compartments. This microenvironmental compartmentalization creates severe sampling bias in conventional clinical assays, as molecular features captured by standard bulk profiling or single-site biopsies often reflect only a fraction of the tumor ecosystem, limiting their representativeness for disease staging, risk stratification, and therapeutic decision-making.
To map these regional dynamics, early iterations of spatial transcriptomics leveraged macro-scale approaches, including laser-capture microdissection (LCM), microarray profiling, and low-multiplex single-molecule fluorescence in situ hybridization (smFISH)[10−12]. While smFISH successfully enabled the subcellular localization of individual transcripts by hybridizing fluorescently labeled probes directly to target RNA, its utility remained severely constrained by a finite number of optical channels, restricting its use to small-scale targeted gene validation rather than unbiased, tissue-wide discovery. The maturation of single-cell transcriptomics and next-generation sequencing (NGS) eventually catalyzed a fundamental paradigm shift. In 2016, Ståhl and colleagues introduced an NGS-enabled platform capable of systematically mapping transcript distributions directly across tissue sections[13]. This landmark achievement established the foundation for high-throughput spatial transcriptomics and spurred rapid innovation across multiple technological frameworks, driving the field's explosive growth within just a few years[14]. Spatial transcriptomics keeps increasing resolutions: early methods operated at 100 µm, the first commercial Visium platform improved resolution to 55 µm, and the most recent Visium HD further reduced spot size to approximately 2 µm[15].
Despite these technological evolutionary steps, early sequencing-based implementations and region-of-interest (ROI) microdissection platforms operated primarily at a multicellular scale. For instance, the prototypical ROI-based GeoMx Digital Spatial Profiling (DSP) platform utilizes photocleavable oligonucleotide-tagged probes to profile RNA and over 570 protein targets within microscopically directed tissue compartments. By steering UV light via digital micromirror devices (DMD), GeoMx cleaves and sequences these barcodes to generate region-level profiles that are exceptionally well-suited for interrogating defined pathological macro-structures. Similarly, first-generation 10x Genomics Visium arrays excel at capturing sweeping transcriptomic gradients across large liver tissue areas, allowing researchers to track how premalignant hepatocytes progressively drift from their native zonation baselines.
However, because these spatial bulk platforms routinely average transcriptomic signals across multi-cellular arrays (typically 50–100 µm), they suffer from distinct structural limitations when confronting the high-density cellular networks characteristic of the HCC invasive front. Within these multi-cellular pixels, the transcriptomic signatures of highly proliferative malignant hepatocytes, activated matrix-secreting cancer-associated fibroblasts (CAFs), and infiltrating lymphocytes become artificially mixed. This lateral diffusion introduces a severe computational 'blurring effect' that obscures critical single-cell features, leaving these platforms inherently constrained in resolving microscale spatial domains, identifying rare cell subpopulations, or mapping localized immune synapses.
Spatial barcoding-based approaches
-
To untangle these dense multi-cellular coordinates and map the exact spatial boundaries governing liver cancer pathogenesis, the transition to true single-cell and subcellular spatial transcriptomics is methodologically imperative. These high-resolution approaches encompass two dominant technological paradigms: high-density NGS-barcoded arrays that preserve whole-transcriptome coverage, and targeted imaging-based in situ hybridization or sequencing (ISH/ISS) platforms that deliver single-molecule clarity.
Among NGS-barcoded platforms, Slide-seq v2 leverages randomly deposited barcoded magnetic beads to achieve single- cell resolution with reduced lateral transcript diffusion, striking a valuable balance between coverage and resolution[16]. Conversely, while platforms like HDST[15] achieve a tighter 2 µm resolution, their practical utility in dense tumor tissues is heavily undermined by severe data sparsity and low capture efficiency[17]. Similarly, the high-coverage, ultra-high-resolution Seq-Scope platform (0.5–0.8 µm) utilizes repurposed Illumina flow cells to capture transcript bursts, yet it remains hindered by a lack of commercialization and a high susceptibility to technical artifacts, such as scratches and data dropout, which are particularly problematic in fragile liver tissues[18].
To overcome these sampling constraints, the 2025 release of Stereo-seq v2 represents a major milestone in high-resolution spatial transcriptomics[19]. By leveraging DNA Nanoball (DNB) patterned arrays generated via rolling circle amplification, Stereo-seq v2 maintains a programmable 0.5 µm subcellular resolution while expanding robust compatibility to formalin-fixed paraffin-embedded (FFPE) clinical samples. Crucially, Stereo-seq v2 bypasses poly(A)-dependent transcript capture through random priming linked to adaptor oligonucleotides. This strategy enables the unbiased capture of low-abundance or degraded RNAs that are frequently missed by poly(A)-dependent methods, while simultaneously mitigating the diffusion artifacts during tissue permeabilization that commonly plague traditional array-based workflows.
Imaging-based approaches
-
While ultra-high-resolution NGS arrays provide a global, whole-transcriptome view of regional tissue architecture, they remain indirect measurements that rely on the vertical diffusion of transcripts onto a physical substrate. To eliminate diffusion artifacts and directly visualize individual transcripts within their native, undistorted microenvironment, targeted imaging-based methods offer a highly complementary and precise alternative.
Modern multiplexed in situ platforms—such as 10x Genomics Xenium, NanoString CosMx Spatial Molecular Imager (SMI), and Vizgen MERSCOPE—leverage automated fluidics and high-resolution microscopy to decode curated, cancer-specific gene panels across large clinical cohorts. MERSCOPE implements an error-robust, combinatorial single-molecule FISH (smFISH) strategy to achieve high-plex single-cell mapping[20], while Xenium in situ utilizes specific padlock probe hybridization and ligation followed by rolling-circle amplification (RCA) to generate high-fidelity optical signatures without destroying tissue architecture[15].
Furthermore, leveraging this enzymatically amplified signal alongside multi-round fluorescent reporter hybridization, CosMx SMI achieves a true subcellular readout down to 50 nanometers. Armed with an expansive panel library extending toward 18,000 targets, CosMx SMI successfully bridges the historic divide between targeted imaging and whole-transcriptome scanning. In the specific context of the HCC invasive front, these single-molecule imaging technologies allow researchers to isolate cellular coordinates with absolute precision.
This single-molecule spatial transcriptomics paradigm offers a combination of spatial resolution and cellular throughput that renders it exceptionally well-suited for large-scale spatial proximity analysis and cellular neighborhood network mapping. In the context of the HCC microenvironment, this technical capability played a decisive role in the discovery of 'Tumor Cell Villages' proposed by Liu et al. Within high-density malignant cell aggregates, conventional imaging techniques routinely fail to determine whether specific transcripts originate from a malignant cell or an adjacent stromal counterpart. Leveraging its extreme spatial resolution alongside in situ protein co-staining and deep learning-based cell segmentation algorithms, CosMx SMI successfully delineated the irregular physical boundaries between malignant hepatocytes and adjacent matrix-secreting cancer-associated fibroblasts (mCAFs). This enabled the in situ identification of the spatial co-localization between SPINK1 (malignant cell-derived) and EGFR (mCAF-expressed) within a tight 40-µm neighborhood. Furthermore, through the unsupervised analysis of spatial transcriptomic data spanning approximately 2.3 million cells, the platform successfully identified 12 discrete malignant transcriptional states, establishing a solid data foundation for subsequent spatial modeling via graph attention networks (GATs)[21].
Consequently, within the research of solid tumors like HCC, these distinct spatial transcriptomics technologies do not simply replace one another; rather, they serve as highly complementary tools dictated by their underlying biophysical principles. Taken together, these technological milestones empower researchers to resolve cellular coordinates with absolute spatial precision, unraveling the intercellular 'spatial sociology' networks that govern tumor fitness and clinical therapeutic response across multiple structural scales.
Spatial proteomics for tumor immune barriers and checkpoint profiling
-
At the immunological level, persistent chronic inflammation and viral antigen exposure establish a baseline of widespread immune dysfunction prior to actual tumor formation. Sustained antigen stimulation drives T-cell exhaustion, characterized by prolonged expression of inhibitory receptors within the tumor microenvironment such as PD-1, CTLA-4, and TIM-3, thereby creating a pro-tumor immunosuppressive landscape[6,7,22,23]. Crucially, spatial omics reveals that immune suppression in HCC is not merely a passive consequence of generalized effector cell depletion; instead, it is a highly orchestrated, spatially organized phenomenon[6,24]. Effector lymphocytes, regulatory T cells (Tregs), tumor-associated macrophages (TAMs), myeloid-derived suppressor cells (MDSCs), and tolerogenic dendritic cells (DCs) frequently co-localize within highly defined microanatomical immune niches. This suppressive co-localization pattern—particularly when Tregs, MDSCs, and SPP1+ TAMs cluster in close physical proximity to CD8+ T cells—enforces functional inhibition and checkpoint signaling despite the physical presence of effector populations[8,25,26], actively neutralizing the host immune response within the tumor core and across key functional compartments[27−31].
This spatially organized immunosuppression is further reinforced and protected by extensive, localized stromal remodeling. Continuous inflammatory and chemokine signaling within the microenvironment activates quiescent hepatic stellate cells, which in turn drive rapid extracellular matrix (ECM) deposition, structural fibrosis, and increased tissue stiffness. Within the complex landscape of the tumor margin, coordinated interactions among these activated stellate cells, CAFs, macrophages, and adjacent endothelial cells promote the structural formation of dense, ECM-rich tumor immune barriers[25,32,33]. These highly organized cellular bands function as critical physical and immunological gatekeepers, strictly restricting effector immune-cell infiltration and impeding therapeutic drug penetration. Consequently, the frequent clinical failure of aggressive immune checkpoint blockade strategies in HCC often reflects the physical inability of primed immune cells to traverse these dense spatial-stromal barriers at the invasive front, rather than a failure of systemic immune activation or baseline priming.
Under the severe hypoxic stress and metabolic distortions characteristic of the HCC core and the invasive front, post- transcriptional silencing, microenvironmental stressors, and localized translational blocks cause a profound disconnect between mRNA synthesis and functional protein expression. Consequently, transcriptional abundance maps captured by spatial transcriptomics often reflect mRNA that is never successfully translated, failing to accurately delineate active signaling cascades. Resolving these operational pathways demands direct, in situ proteomic quantification to map protein-level functional states, checkpoint molecule distributions, and tumor-immune interactions in HCC.
While the absolute number of detectable proteins is fundamentally constrained by antibody availability, panel plexity, and epitope compatibility compared to whole-transcriptome sequencing, spatial proteomics delivers direct readouts of cellular execution and checkpoint networks, emerging as a cornerstone technology for constructing spatial maps of biomolecular architecture within large-scale initiatives such as HuBMAP and the Human Tumor Atlas Network (HTAN)[11,34−39].
Multiplex immunofluorescence technologies
-
To capture these functional states, fluorescence-based imaging methods employ labeled antibodies to visualize protein expression under conventional microscopy. Because traditional low-plex immunofluorescence is limited by the number of spectrally separable fluorophores, high-plex imaging is achieved through iterative cycles of staining, fluorophore inactivation, or signal amplification. Recent advances in multiplex immunofluorescence (mIF) and cyclic immunofluorescence (such as t-CyCIF)[40] enable quantitative detection of dozens of proteins on a single FFPE section, supported by automated fluidics platforms including Akoya Biosciences' PhenoImager series, Miltenyi's MACSima, and Lunaphore's COMET workflows.
Metal-Isotope Mass Cytometry Imaging (IMC/MIBI)
-
However, highly vascularized, fibrotic, and cirrhotic liver sections present a pervasive optical challenge: extreme tissue autofluorescence caused by lipofuscin accumulation and collagen cross-linking, which frequently masks low-abundance checkpoint signals in conventional fluorescence microscopy. To completely bypass this optical noise and eliminate spectral overlap, metal-isotope mass cytometry imaging—represented by Imaging Mass Cytometry (IMC)[41] and Multiplexed Ion Beam Imaging (MIBI)[42]—offers a powerful alternative. These approaches utilize antibodies conjugated to rare-earth lanthanide metal isotopes instead of fluorophores, entirely eliminating fluorescence optics from the readout.
Signal acquisition is achieved through laser ablation or ion-beam sputtering; MIBI uses an oxygen ion beam to sputter the sample and detect secondary ions via time-of-flight mass spectrometry (TOF-MS) with sub-cellular resolutions as high as 0.4 µm, while IMC employs ultraviolet (UV) laser ablation to vaporize tissue pixels for CyTOF analysis at approximately 1 µm resolution. This mass-tag paradigm enables the simultaneous, high-resolution, and autofluorescence-free mapping of over 40 antibodies in a single round of staining, allowing for the precise, uncorrupted in situ quantification of critical overlapping checkpoint molecules—such as PD-1, CTLA-4, and LAG-3—directly within localized immunosuppressive niches. Nonetheless, because ion-beam sputtering and laser ablation irreversibly remove tissue material, this destructive workflow demands the careful restriction of imaging to predefined ROIs.
DNA-barcoded cyclic imaging
-
In addition to mass cytometry-based technologies that rely on metal tags, cyclic imaging platforms based on oligonucleotide barcodes, such as PhenoCycler (formerly CODEX) and SignalStar, offer a complementary workflow[43]. This technology is optimized for high-multiplex profiling of stromal and immune lineages. The foundational workflow of the oligonucleotide-barcoded paradigm involves a single, non-destructive staining step utilizing an expansive panel of antibodies (> 100) covalently coupled to unique DNA barcodes. In contrast to the irreversible tissue vaporization inherent to ion-beam or laser-ablation mass cytometry, or the epitope degradation associated with aggressive chemical bleaching in conventional cyclic immunofluorescence, this framework relies on microfluidic-mediated iterative cycling. Complementary, fluorophore-labeled oligonucleotides are sequentially hybridized, imaged via high-resolution microscopy, and gently removed under mild, non-denaturing fluidic conditions. This biochemical cycling mechanism maintains tissue morphological integrity across cm-scale clinical specimens while circumventing the physical detection limits (typically
$ \leqq $ Spatial metabolomics for metabolic distortion and niche interrogation
-
Beyond physical entrapment, the progression and therapeutic resistance of HCC are dynamically orchestrated by the rigorous spatial reorganization of cellular energy metabolism and nutrient-processing pathways. High-resolution spatial metabolomics has shattered the conventional view of uniform tumor metabolism by revealing that distinct classes of small-molecule metabolites—including lactate, cholesteryl esters, phosphatidylcholines, purines, and nucleotides—form highly organized, region-specific gradients aligned with the tissue architecture[20,44,45]. These structured metabolic distributions are frequently confined to areas characterized by enhanced tumor invasiveness and active angiogenesis, highlighting that metabolic remodeling is inherently constrained by microenvironmental constraints.
Crucially, rather than serving as mere descriptive readouts, these spatially restricted metabolic circuits actively dictate metabolic coupling across cancer cells, infiltrating lymphocytes, and CAFs. Phenotypic coupling processes, such as the lactate–pyruvate cycle, fatty acid-driven bioenergetics, and localized glutamine dependency, directly impose persistent metabolic stress on the surrounding immune landscape. Multimodal spatial omics integration has uncovered that regions enriched in intense glycolytic activity directly coincide with severe T-cell exhaustion, marked by mitochondrial dysfunction and a loss of cytotoxic capacity[46]. Conversely, lipid-rich zones form metabolically driven 'immune-tolerant sanctuaries' that shield malignant cells from host immunosurveillance[47].
Spatial metabolomics integrates metabolomic profiling with imaging technologies to generate in situ maps of small-molecule distributions across tissue sections. In HCC, where hypoxia, nutrient gradients, and stromal remodeling profoundly reshape cellular metabolism, protein-level information alone is often insufficient to capture functional metabolic states. Spatial metabolomics therefore provides a critical extension to spatial proteomics by directly mapping metabolite distributions within tumor, stromal, and peritumoral regions. Mass spectrometry imaging (MSI) techniques, including matrix-assisted laser desorption/ionization mass spectrometry imaging (MALDI-MSI)[48], desorption electrospray ionization mass spectrometry imaging (DESI-MSI)[49], secondary ion mass spectrometry imaging (SIMS)[50], and related modalities, enable the visualization of hundreds of metabolites while preserving their native spatial context. These approaches reveal region-specific metabolic variation across different tissue compartments and cell populations. MSI[51,48] enables the direct, label-free analysis of metabolites within intact sections, and among its variants, MALDI-MSI and DESI-MSI represent the most widely applied techniques for metabolic visualization in biological specimens[48].
The most representative technology is MALDI-MSI. In MALDI-MSI, a uniform matrix layer is first applied to the tissue, after which the sample is rasterized with a laser; the matrix absorbs laser energy to ionize embedded molecules, and the mass spectra from each pixel are subsequently recorded to reconstruct spatial abundance maps. Commonly coupled with time-of-flight (TOF) mass analyzers to infer mass-to-charge ratios, this paradigm is compatible with diverse sample types and can detect tens to hundreds of biomolecules simultaneously. Modern commercial instruments now achieve lateral resolutions of 5–10 µm; for example, systems such as Space M[52] and MicroMS[53]. Because the method does not rely on antibody specificity, it is particularly well suited for unbiased mapping of protein biomarkers or small-molecule drugs within tissues.
In contrast, DESI-MSI is an ambient ionization technique that operates under atmospheric pressure and requires minimal sample preparation. In DESI-MSI, a charged solvent spray is directed onto the tissue surface, where it extracts and desorbs analytes that are subsequently transported into the mass spectrometer. Because DESI relies on a soft ionization mechanism, it allows analysis of intact molecular species while largely preserving tissue morphology. DESI-MSI is particularly attractive for translational and clinical applications, as it avoids matrix deposition and can be readily integrated with conventional histopathological workflows. Typical spatial resolution achieved with DESI-MSI ranges from 50 to 200 µm, although recent instrumental and methodological developments have enabled higher resolution through optimized spray geometry and oversampling strategies[49]. In contrast to the ambient and soft ionization of DESI-MSI, Secondary Ion Mass Spectrometry (SIMS)—specifically Time-of-Flight SIMS (ToF-SIMS)—utilizes a high-energy primary ion beam to achieve subcellular spatial resolution[54]. In SIMS, a focused stream of primary ions (such as
$ Bi_{3}^{+} $ $ C_{60}^{+} $ At the molecular level, this spatial-metabolic coupling is driven by precise intracellular signaling cascades. For instance, tumor cell-expressed PD-L1 has been shown to actively reprogram lipid metabolism via the EGFR/ITGB4/SREBP1c signaling pathway, thereby accelerating lipogenesis to fortify these spatial sanctuaries[47]. In parallel, hepatocellular carcinoma cells locally upregulate SAT1 and secrete N1-acetylspermidine into the surrounding microenvironment. This localized metabolic secretion triggers aberrant SRC-SYK-BTK signaling in adjacent tumor-associated macrophages, polarizing them into a distinct CCL1+ immunosuppressive phenotype. These specialized macrophages subsequently execute the continuous, spatial recruitment of regulatory T cells via the CCL1-CCR8 chemokine axis, effectively locking in an unassailable niche of localized immune evasion[55].
Such observations support a growing conceptual framework in which cancer development and progression are influenced not only by genetic alterations but also by spatial reorganization of cellular energy metabolism and nutrient-processing pathways. In this context, spatial metabolomics has emerged as a powerful approach for interrogating the metabolic ecology of tumors and for identifying metabolism-oriented therapeutic vulnerabilities[56−60]. Importantly, metabolic alterations are not merely downstream consequences of genetic changes; they can also feed back to influence epigenetic regulation, signal transduction, and microenvironmental interactions, thereby contributing to tumor maintenance and evolution at a systems level[60]. Viewed through this metabolic lens, cancer can be understood as a disease shaped by aberrant energy utilization and dynamic interactions with host metabolic networks.
Spatial immunomics for spatial origins and clonal mapping
-
The definitive success of anti-tumor immunity in HCC is fundamentally predicated on the adaptive immune system's capacity to execute targeted, antigen-driven clonal expansion. Within the chronic inflammatory and cirrhotic landscape characteristic of primary liver malignancies, ectopic lymphoid aggregates known as tertiary lymphoid structures (TLSs) frequently assemble in the peritumoral stroma and adjacent margin. These structures serve as critical local microanatomical hubs for lymphocyte priming, somatic hypermutation (SHM), and affinity maturation, often functioning as the principal spatial cradle for TILs[61,62].
However, investigating the precise functional trajectories and spatial origins of these adaptive compartments has exposed a critical methodological impasse. Droplet-based single-cell V(D)J sequencing effectively pairs α/β or heavy/light receptor chains but demands total tissue dissociation, which strips lymphocytes of their anatomical context and severs the link between clonal identity and local microenvironmental niches[63]. Conversely, conventional spatial transcriptomic platforms rely heavily on 3'-end poly(A) capture on physical substrates. Because these array-based strategies sample transcripts near the polyadenylation tail, they systematically fail to sequence the highly variable, distal variable-diversity-joining (V[D]J) recombination regions and the complementarity-determining region 3 (CDR3) loops located further upstream. This technical read-length constraint leaves standard spatial transcriptomics blind to antigen receptor identity, rendering it impossible to map specific T-cell receptor (TCR) and B-cell receptor (BCR) clonotypes to distinct histological zones, or to trace the migratory and evolutionary lineages of adaptive cells across complex liver microanatomical structures.
To resolve this structural blind spot, the emerging field of spatial immunomics integrates spatial barcoding with targeted antigen receptor reconstruction, allowing investigators to map full-length immune repertoires in situ. Slide-TCR-seq[9] is among the earliest approaches to enable spatially resolved analysis of TCRs. This method integrates the Slide-seq v2 platform with RNase H-dependent PCR to capture TCRα and TCRβ CDR3 sequences at an approximate spatial resolution of 10 µm, thereby reconstructing the spatial distribution of T cell clonotypes. By linking TCR clonotype information with local transcriptomic profiles, Slide-TCR-seq allows joint analysis of clonal identity and transcriptional state within defined tissue regions and supports the investigation of intra-clonal and inter-clonal transcriptional variability in tumors and lymphoid tissues. In HCC, this approach is particularly suitable for resolving the fine-scale spatial distribution of T cells across complex liver microanatomical structures, including tumor parenchyma, fibrotic septa, sinusoidal regions, and tumor margins. However, because the method relies on targeted PCR amplification, Slide-TCR-seq primarily captures CDR3 sequence information and does not enable reconstruction of full V(D)J architectures. In addition, its current implementation is limited to TCR analysis.
On barcoding-based spatial transcriptomic platforms, Spatial VDJ offers an alternative strategy for spatial immune-repertoire analysis[64]. This approach builds on cDNA libraries generated by the 10x Genomics Visium spatial transcriptomics platform and applies hybrid-capture enrichment to selectively isolate immune-receptor transcripts. By combining either short-read or long-read sequencing, Spatial VDJ enables spatially resolved reconstruction of full-length V(D)J sequences for both TCRs and BCRs. In addition to recovering the spatial distribution of lymphocyte clonotypes, the method supports BCR heavy- and light-chain pairing as well as analysis of B-cell clonal lineages and somatic hypermutation, thereby extending the applicability of spatial immune-repertoire profiling to studies of humoral immunity. In HCC, Spatial VDJ is particularly well suited for investigating B-cell-associated immune processes, including the presence of TLSs within or adjacent to tumors and the extent to which B cells within TLSs undergo clonal expansion, somatic hypermutation, and lineage diversification. However, the spatial resolution of this approach is constrained by the spot size of the Visium platform, which limits its ability to resolve fine-scale microanatomical features.
SPTCR-seq[65] further extends immune-repertoire analysis on barcoding-based spatial transcriptomic platforms. This method uses optimized hybrid-capture probes targeting TCR transcripts and combines them with nanopore long-read sequencing to enable high-sensitivity reconstruction of full-length TCR sequences. Compared with PCR-based approaches, SPTCR-seq provides improved completeness of TCR V(D)J architecture and higher accuracy in clonotype reconstruction, while remaining applicable across multiple spatial transcriptomic platforms. In HCC, this approach is well suited for characterizing the clonal composition, expansion patterns, and spatial bias of tumor-infiltrating T cells, including assessments of whether specific tumor regions are dominated by highly expanded clonotypes and whether these clonotypes are associated with exhausted phenotypes or immunosuppressive microenvironments. However, the method primarily focuses on TCR analysis, involves relatively high experimental and sequencing costs, and requires more demanding downstream error-correction and computational analysis pipelines.
In contrast to the approaches described above, Stereo-seq[19] does not rely on receptor-targeted enrichment as its primary strategy. Instead, it uses random priming to enable unbiased capture of total RNA, followed by assembly-based reconstruction of immune receptor sequences at ultra-high spatial resolution. This design provides lower sensitivity for reconstructing individual receptor clonotypes than targeted enrichment methods, but it offers distinct advantages in precisely mapping immune clonotypes to fine microanatomical structures, maintaining compatibility with FFPE clinical specimens, and integrating regulatory information from both coding and noncoding transcripts.
By directly coupling antigen receptor sequence integrity with precise spatial coordinates, spatial immunomics provides an uncorrupted view into the adaptive selection forces operating within peritumoral TLSs. These technologies allow researchers to distinguish between true, antigen-driven resident effectors undergoing localized clonal expansion and unengaged, systemically recruited bystander lymphocytes that passively drift through vascular or sinusoidal spaces. When applied to the highly structured architecture of peritumoral TLSs in HCC, full-length spatial V(D)J profiling can cleanly separate the distinct zones of the B-cell follicle. It maps how B-cell clonotypes transition from the naive mantle zones into the active germinal centers, allowing for the direct in situ tracking of SHM kinetics and class-switch recombination[64]. By quantifying the spatial density of point mutations within paired heavy- and light-chain CDR3 loops across consecutive anatomical coordinates, researchers can construct explicit phylogenetic trees that trace lineage diversification directly within the germinal center. Simultaneously, these platforms can measure how these evolving B-cell lineages interface with adjacent CD4+ follicular helper T (TFH) cells and follicular dendritic cells. This spatial proximity analysis establishes the exact physical and transcriptomic thresholds required to drive localized affinity maturation and plasma cell differentiation[64,9]. Ultimately, by mapping these intra-clonal and inter-clonal evolutionary trajectories across explicit physical coordinates, spatial immunomics transforms our understanding of HCC lymphoid niches. It proves that peritumoral TLSs are not merely passive cellular aggregates, but function as highly active, structurally autonomous microenvironments capable of generating fully mature, localized adaptive responses geared toward controlling tumor fitness and dictating clinical immunotherapy outcomes (Table 1).
Table 1. Comparison of spatial omics platforms in HCC.
Platform Resolution Throughput Tissue Primary strengths Limitations Applications Spatial transcriptomics Visium v2 55 µm WT FFPE/FF Unbiased capture, standard workflow Coarse resolution Dissecting region-specific immune, stromal, and metabolic partitions[33,66] Visium HD 2 µm WT FFPE/FF Single-cell profiling, untargeted High cost, data sparsity Profiling localized cellular heterogeneity and immune aggregates[15] Stereo-seq 500 nm WT FF Large FOV, sub-micron resolution Limited sensitivity Mapping suppressive invasive front dynamics and progress cues[67] Stereo-seq v2 500 nm WT FF Simultaneous profiling of the V(D)J immune repertoire High sequencing depth reliance Tracing spatial clonal lineages in archived clinical FFPE cohorts[19] GeoMx DSP 10–600 µm Targeted WT FFPE/FF Flexible ROI selection Non-single-cell Compartment-specific (intratumoral vs stromal) profiles[66] Xenium 50 nm Targeted
(≤ 5,000)FFPE/FF High sensitivity and throughput Closed gene panel Mapping subcellular ligand-receptor networks and checkpoints[11] MERFISH 100 nm Targeted
(≤ 1,000+)FFPE/FF High quantitative accuracy Long imaging times Direct visualization and quantification of oncogenic transcripts[20] CosMx SMI < 1 µm Targeted
(≤ 6,000)FFPE/FF True subcellular imaging Segmentation artifacts Isolating metabolic-transcriptomic niches in cell communities[21] Spatial proteomics PhenoCycler 0.2–0.5 µm Targeted (40–100+) FFPE/FF High-plex single-cell screening Iterative fluidics time Elucidating physical barriers formed by CAFs and TAMs[43] IMC 1 µm Targeted (40) FFPE/FF Negligible signal overlap Low SNR for low-expression proteins Mapping multiplexed 2D immune topology in HBV-infected tissues[6] Spatial metabolomics MALDI-MSI 10–100 µm m/z 500–
20,000FF Label-free intact tracking Matrix interference Deconstructing peritumoral lactate gradients and lipid rewiring[48,45] DESI-MSI 50–200 µm m/z 10–
2,000FF Ambient soft ionization Low resolution Rapid label-free metabolic mapping with minimal preparation[49] Abbreviations: WT, whole transcriptome; FF, fresh-frozen; FFPE, formalin-fixed paraffin-embedded; FOV, field of view; ROI, region of interest; IMC, imaging mass cytometry; MSI, mass spectrometry imaging; SNR, signal-to-noise ratio; m/z, mass-to-charge ratio; CAFs, cancer-associated fibroblasts; TAMs, tumor-associated macrophages. Artificial intelligence in spatial analysis
-
The rapid expansion of spatially resolved transcriptomic, proteomic, and metabolomic technologies has generated datasets characterized by high dimensionality, strong spatial dependency, and complex tissue architecture. Conventional statistical approaches, which often treat observations as independent and rely on linear assumptions, are insufficient to capture the structured heterogeneity and multiscale organization inherent to spatial biological data. Artificial intelligence, and in particular machine learning (ML) along with its specialized subclass deep learning (DL), has therefore become an essential analytical framework for extracting meaningful biological information from spatial datasets.
Spatial clustering
-
Deciphering the spatial architecture of heterogeneous tissue microenvironments represents a cornerstone of spatially resolved transcriptomics (SRT) data analysis. To map these complex spatial domains, researchers strategically choose from four distinct algorithmic paradigms based on structural topology, multimodal integration, and computational constraints.
For biological systems with well-defined structural priors where causal interpretability is paramount, non-neural probabilistic models (e.g., BayesSpace[68], Giotto[69]) represent a statistically rigorous option. Rooted in statistical mechanics, these approaches rely heavily on Markov Random Fields (MRFs) or Hidden Markov Models (HMMs) to explicitly formulate the spatial dependency among neighboring spots, offering high mathematical interpretability and robustness against noise in structured grid layouts, though they struggle to capture high-order non-linear dynamics and encounter scalability bottlenecks on massive datasets. In contrast, when absolute computational efficiency and rapid cohort screening are prioritized, traditional machine learning approaches serve as the pragmatic choice. Represented by conventional clustering (e.g., k-means or spectral clustering) coupled with linear dimensionality reduction (e.g., PCA) that incorporates spatial constraints as Euclidean distances, this paradigm lacks the capacity to abstract subtle, complex non-linear biological variations, yet its minimal computational footprint renders it indispensable for preliminary high-throughput explorations.
As multimodal datasets become increasingly prevalent, deep learning methods (e.g., MUSE[44]) offer a paradigm explicitly centered on multimodal representation fusion. Leveraging deep autoencoders (AEs) or contrastive learning techniques, these algorithms project high-dimensional, non-linear transcriptomic profiles and matched histological images (e.g., H&E staining) into a shared, joint latent space; for intricate tissue architectures where structural morphology heavily dictates cellular states, this strategy provides deep cross-modality contextualization, revealing subtle spatial subpopulations that remain hidden from a single modality. Finally, for studies demanding direct, end-to-end optimization of continuous tissue geometry, graph neural networks (GNNs, e.g., SpaGCN[70]) stand out as a premier architectural choice. By abstracting SRT arrays into non-Euclidean graphs—where spots or cells form nodes and spatial proximity defines edges—GNNs utilize graph convolutions to natively aggregate transcriptomic and geometric information across topological neighborhoods. This paradigm excels remarkably in smoothing localized technical noise and delineating continuous anatomical boundaries, establishing itself as a robust high-resolution tool for dissecting complex tissue heterogeneity.
Cell segmentation
-
Accurate delineation of individual cell boundaries is a critical prerequisite for many downstream spatial analyses, particularly for spatial platforms that achieve single-cell or subcellular resolution. Without reliable cell segmentation, molecular signals originating from neighboring cells may be incorrectly merged, leading to confounding between spatial proximity and molecular similarity.
When high-quality morphological imaging (such as DAPI, cell boundary staining, or immunofluorescence) is available, and smooth boundary contours are prioritized, pure image-driven computer vision models provide a classic, benchmark option. This paradigm has evolved from dedicated semantic segmentation architectures typified by U-Net to versatile, training-free generalized models like Cellpose[30], which leverages simulated vector flow fields. To overcome the massive computational bottleneck encountered when applying pixel-level deep learning inference across thousands of whole-slide images, distributed architectures such as DeepCell Kiosk[31] introduce cloud-native orchestration frameworks (e.g., Kubernetes). Without altering the underlying algorithmic cores, these systems substantially optimize computational scalability, offering a high-throughput pipeline for large-scale clinical cohort analyses. Nevertheless, pure image-driven segmentation remains a 'morphology-first' strategy. In tissue regions plagued by overlapping cellular layers, uneven staining artifacts, or a lack of clear plasma membrane markers, this paradigm is highly susceptible to transcript cross-talk or the artificial omission of real cellular entities.
To completely bypass the absolute reliance on high-quality cell morphology imaging, non-neural probabilistic models offer a distinct, 'molecular feature-first' alternative. Statistical frameworks, most notably exemplified by Baysor[71], abandon pixel-based image segmentation logic entirely. Instead, they model the joint likelihood of single-molecule transcripts within a non-Euclidean spatial point process. By employing Markov Random Fields (MRFs) to jointly optimize spatial cell morphology priors alongside the local expression homogeneity of the transcriptome, Baysor can backward-infer true cellular boundaries directly from raw transcript coordinates—even in extreme scenarios completely lacking nuclear or membrane stains. This approach delivers exceptional statistical robustness when resolving highly interleaved and structurally complex cell types, such as tumor-infiltrating immune cells within dense microenvironments. Advancing this probabilistic framework further, Proseg[72] incorporates cellular physical behaviors derived from biophysical cell simulations directly into spatial boundary inference. By using probabilistic sampling to deduce morphologically plausible physical boundaries, Proseg establishes a novel architectural trade-off that enhances computational efficiency while minimizing the generation of artificial noise bubbles.
With the widespread adoption of subcellular multi-omic datasets, multimodal DL fusion architectures that concurrently model tissue morphology and transcriptomic spatial heterogeneity are becoming the dominant technological route for high-resolution profiling. Within this paradigm, several distinct supervision strategies and architectural pathways have emerged. Under supervised or adaptive learning frameworks, the SCS algorithm[73] deploys a Transformer architecture to adaptively learn multimodal spatial distance representations of each transcript relative to its inferred cell center, successfully breaking through the assignment precision limits of traditional image segmentation at subcellular scales. Complementing this, GeneSegNet[74] introduces a recursive training strategy that effectively mitigates the reliance on noisy, manually annotated training labels that frequently confound conventional DL pipelines.
Importantly, many AI methods used in spatial analysis are modality-agnostic, operating on spatially indexed feature matrices regardless of whether the features represent gene expression, protein abundance, or metabolite intensity. This property facilitates consistent analytical frameworks across spatial transcriptomics, spatial proteomics, and spatial metabolomics, while still allowing modality-specific interpretations at the biological level.
Cell-type deconvolution
-
Deciphering spatial transcriptomics data captured at multi-cellular resolution, such as 10x Genomics Visium and standard Spatial Transcriptomics arrays, requires resolving the mixed transcriptional signals within each sequencing spot. To accurately chart cell-type compositions or achieve single-cell resolution across these heterogeneous mixtures, researchers utilize matched single-cell RNA sequencing datasets as reference panels and strategically choose among distinct mathematical frameworks based on data characteristics and computational constraints.
For analysis scenarios that require explicit modeling of technical biases and high sensitivity toward rare cell populations, probabilistic models rooted in Bayesian inference represent a statistically rigorous option. Approaches like Stereoscope parameterize the gene expression counts from both single-cell and spatial modalities within a probabilistic framework by assuming a negative binomial distribution to infer the latent proportions of each cell type per spot[38]. Extending this probabilistic framework, cell2location implements a hierarchical Bayesian model with comprehensive prior distributions to accommodate platform-specific technical variations, which allows the model to borrow statistical strength across spatial locations to map fine-grained cellular subtypes, although this heavy reliance on complex hierarchical configurations inherently incurs substantial computational costs during variational inference or Markov Chain Monte Carlo sampling on large cohorts[75]. When the analytical focus shifts toward absolute computational scalability, architectural interpretability, and direct molecular feature extraction, methods leveraging matrix factorization or targeted regression offer a pragmatic alternative. The SPOTlight algorithm employs a seeded non-negative matrix factorization architecture to identify cell-type-specific or state-specific topic profiles from single-cell references, subsequently utilizing non-negative least squares regression to fit these topics into spatial profiles to determine cellular proportions[76]. Operating under a maximum likelihood framework, RCTD incorporates a technology-specific platform effect parameter to explicitly correct for systemic discrepancies between single-cell and spatial sequencing technologies, and its mathematical formulation allows for spot-independent parallel computation, making it highly efficient for high-throughput exploration of massive tissue sections[27].
Instead of estimating cellular proportions within mixed spots, aligning entire single-cell transcriptomes onto spatial coordinates to reconstruct a single-cell resolution spatial atlas represents a different modality-alignment choice. Tangram implements a DL strategy coupled with spatial alignment to cast mapping as an optimization task that maximizes the correlation between spatial profiles and single-cell entities. By utilizing specialized objective functions, this algorithm systematically assigns single cells to their optimal spatial coordinates, which enables the spatial imputation of unmeasured genes and transcends the limitation of proportion estimation to provide an alternative pathway for studying continuous tissue architecture and localized cellular interactions at single-cell resolution[28].
Multimodal integration
-
The critical imperative for multi-omics integration stems from its unique capacity to systematically bridge the spatial and regulatory disconnect across genomic alterations, transcriptomic drifts, functional proteomic executions, and metabolic rewiring inherent to the highly heterogeneous architecture of HCC. Within complex solid tumor ecosystems, single-omics modalities are inherently constrained by an incomplete view of biological causality. By leveraging computational co-registration and in situ spatial topological alignment, multi-omics frameworks seamlessly integrate micro-scale suppressive networks—such as interlocking immune checkpoint axes and localized metabolic stress niches—with macro-scale anatomical barriers, notably extracellular matrix structures and cancer-associated fibroblast networks that orchestrate physical lymphocyte exclusion. This systems-biology paradigm delivers an uncorrupted view of the in situ evolutionary dynamics and intercellular circuitries driving therapeutic resistance, thereby establishing a translationally viable roadmap for precision oncology.
In the field of spatial transcriptomics and spatial proteomics, only a limited number of platforms currently enable true co-measurement on the same tissue section, such as the DSP. SM-Omics[77] provides an end-to-end, fully automated sequencing-based spatial multi-omics framework that integrates spatial transcriptome profiling with antibody-derived protein detection through DNA-barcoded antibodies, enabling simultaneous in situ quantification of mRNA and protein epitopes at single-cell resolution. In parallel, DBiTplus[78] (Deterministic Barcoding in Tissue Plus) represents a microfluidics-based spatial barcoding strategy that enables multiplexed spatial co-localization analysis of transcriptomic and proteomic features on the same tissue section. This method employs two sets of orthogonally arranged microfluidic channels to sequentially deliver distinct DNA spatial barcodes onto the tissue surface, thereby assigning precise spatial coordinates to mRNA molecules and antibody-conjugated oligonucleotide tags without reliance on optical imaging-based decoding. DBiTplus achieves single-cell-scale spatial resolution while preserving tissue morphology and is compatible with standard high-throughput sequencing workflows.
Spatial transcriptomics-metabolomics integration is most commonly achieved through same-section or serial-section workflows that combine sequencing-based spatial transcriptomics platforms (e.g., Spatial Multimodal Analysis[79]) with MSI modalities such as MALDI-MSI or DESI-MSI. In this workflow, fresh-frozen samples are mounted onto spatially barcoded slides, followed by MALDI-MSI to capture high-resolution, label-free metabolite distributions while preserving tissue morphology. Crucially, matrix deposition and laser parameters are optimized to maintain RNA integrity, allowing the tissue to subsequently undergo sequencing-based spatial transcriptomic profiling on identical spatial coordinates. This sequential same-section design establishes a direct spatial correspondence between gene-expression profiles and metabolite intensities at the level of individual capture spots. Computationally, SMA integrates these modalities through spatial co-registration, joint dimensionality reduction, and correlation- or graph-based modeling to identify region-specific transcriptional-metabolic coupling, metabolic gradients aligned with tissue architecture, and spatially restricted functional niches.
While these platforms and workflows enable the acquisition of spatial multi-omics data, extracting coherent biological insights from heterogeneous modalities requires dedicated computational frameworks capable of jointly modeling spatial context and cross-modality relationships. MultiGATE[80] addresses this need by providing a graph neural network-based deep learning framework for spatial multi-omics integration and regulatory inference. Rather than relying on unified molecular indexing, MultiGATE operates on pre-generated spatial transcriptomic, epigenomic, or proteomic datasets, constructing feature-level graphs to model cross-modality regulatory interactions and spatial graphs to encode neighborhood dependencies among spots or cells. Through a dual-layer graph attention mechanism, MultiGATE learns shared low-dimensional representations while simultaneously inferring spatially resolved regulatory relationships between molecular features. This computational strategy complements experimental multi-omics platforms by enabling unified analysis, spatial domain identification, and mechanistic interpretation of heterogeneous spatial datasets (Fig. 2).
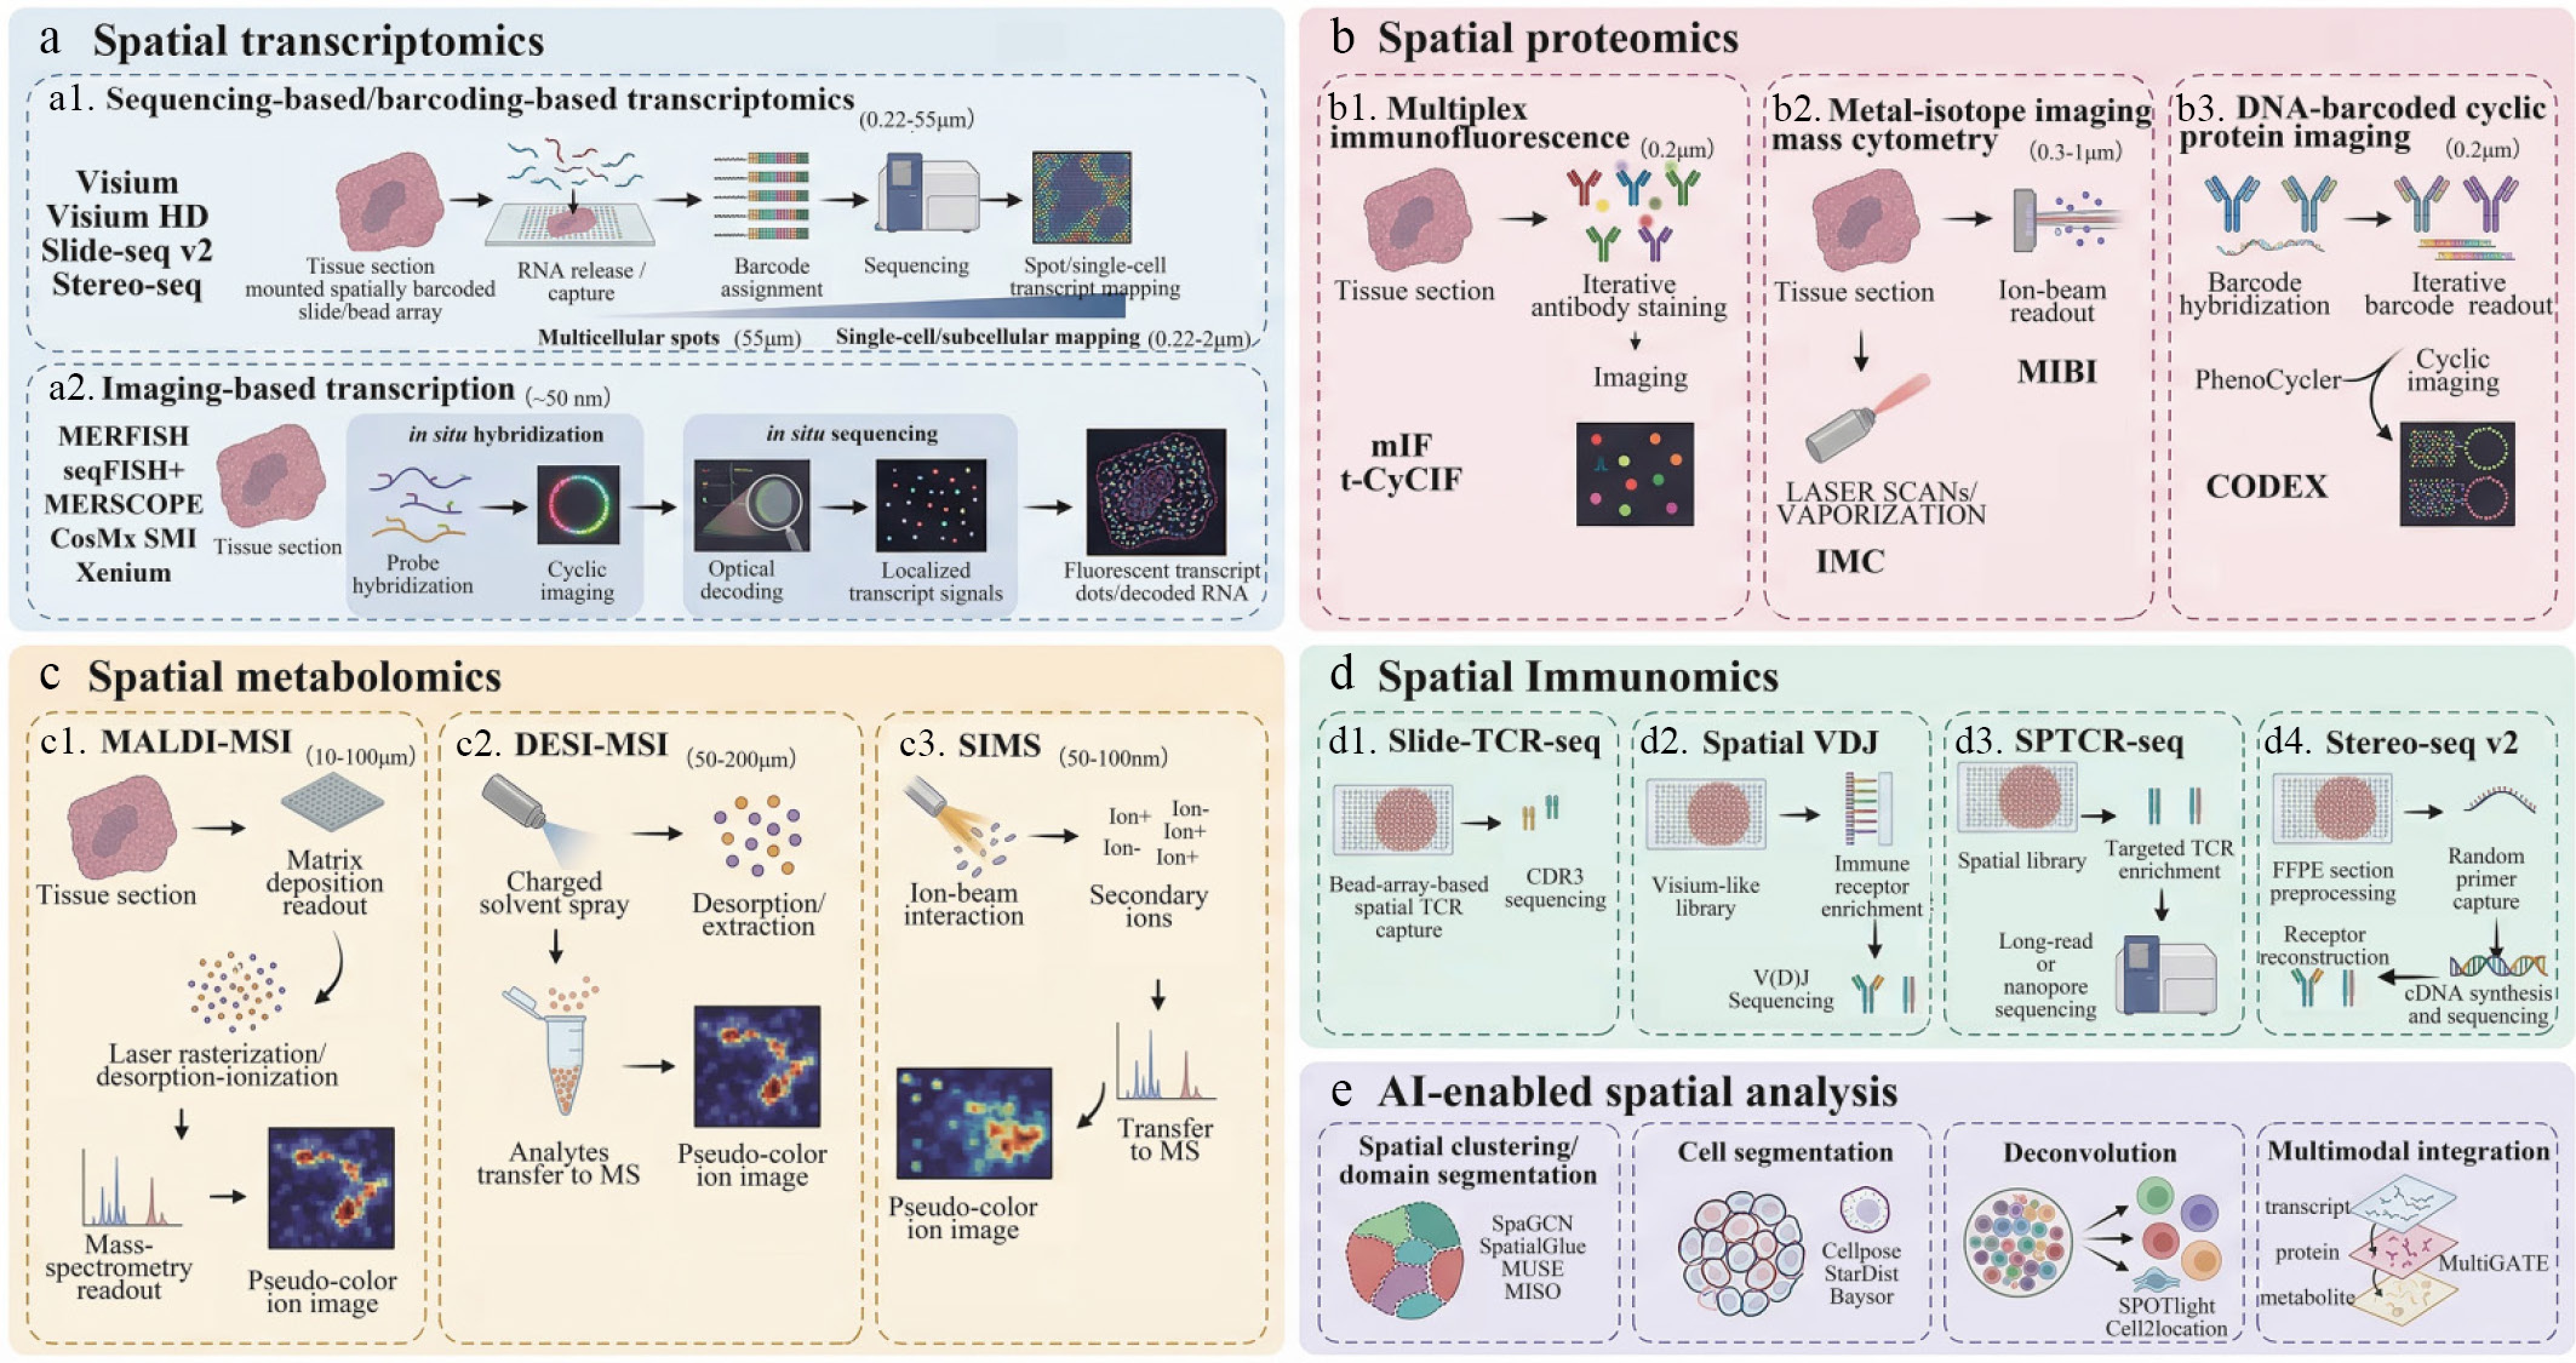
Figure 2.
Overview of spatial omics technologies in hepatocellular carcinoma. This schematic summarizes major spatial omics platforms and computational strategies for resolving spatial heterogeneity in HCC. (a) Spatial transcriptomics maps RNA expression in situ using sequencing/barcoding-based methods (for example, Visium, Visium HD, and Slide-seq v2) or imaging-based approaches (such as MERFISH, seqFISH+, MERSCOPE, CosMx SMI, and Xenium), enabling spatial reconstruction from multicellular to near single-cell or subcellular resolution. (b) Spatial proteomics profiles protein distribution through multiplex immunofluorescence, metal-isotope imaging mass cytometry, and DNA-barcoded cyclic protein imaging. (c) Spatial metabolomics maps metabolites and lipids using MALDI-MSI, DESI-MSI, and SIMS, revealing metabolic gradients across tumor, stromal, hypoxic, necrotic, and perivascular regions. (d) Spatial immune repertoire profiling localizes TCR/BCR clonotypes through Slide-TCR-seq, Spatial VDJ, SPTCR-seq, and Stereo-seq-based inference. (e) AI-enabled spatial analysis supports spatial clustering, domain segmentation, cell segmentation, deconvolution, and multimodal integration. Together, these approaches provide integrated spatial insight into HCC tissue architecture, tumor microenvironment organization, and clinically relevant biological states.
-
Despite the rapid evolution of spatial multi-omics technologies, which now offer substantial resolution for dissecting the structural and functional heterogeneity of complex tissues such as liver cancer, their broad application and deep biological interpretation continue to face substantial challenges. Technical and analytical bottlenecks remain at every stage, from sample acquisition and experimental platforms to computational analysis and downstream biological interpretation.
One of the central obstacles lies in the constraints of tissue sampling and spatial resolution. Spatial omics data are highly dependent on the quality, thickness, and spatial coverage of tissue sections, and organs such as the liver possess intricate 3D architectures that are difficult to fully reconstruct from 2D slices. Moreover, high-resolution platforms such as MERFISH, CosMx, and Xenium are costly and low-throughput, limiting their feasibility for large-cohort studies, whereas lower-resolution approaches like Visium cannot reliably distinguish transcriptional signals from adjacent cells. Thus, achieving an optimal balance among resolution, throughput, and cost remains a critical challenge for the future development of spatial omics technologies.
A second major challenge arises from the computational complexity of multi-omics integration. Different modalities exhibit pronounced batch effects, platform-specific noise, and quantitative non-linearities, requiring sophisticated algorithms for cross-modal alignment. At the spatial level, distinguishing technical artifacts and stochastic cellular variation from biologically meaningful spatial patterns remains difficult. This process often demands detailed pathological expertise and extensive biological knowledge, making spatial data analysis one of the most interdisciplinary frontiers of modern computational biology.
In addition, limited reproducibility and lack of standardization currently constrain the scalability of spatial research. Experimental workflows, segmentation algorithms, annotation strategies, and spatial statistical models differ substantially across research groups, hindering direct comparison of datasets. Establishing standardized data formats, analytical pipelines, and shared resources will therefore be essential for advancing spatial multi-omics toward clinical translation and population-scale research.
Opportunities
-
Looking ahead, several emerging technological innovations continue to advance spatial biology. First, spatial omics is progressing from 2D tissue sections toward 3D spatial omics[81−83], where sequential imaging and volumetric reconstruction enable spatial resolution that more closely reflects the true architecture of intact tissues. Second, the concept of in vivo spatial omics is beginning to take shape, raising the possibility that future technologies could monitor gene expression, protein modifications, and metabolic activity of individual cells in real time, analogous to a molecular live imaging system, thereby advancing spatial biology into a truly spatiotemporal framework. Third, as data accumulate from model organisms and human cohorts, spatial omics is poised to illuminate the disease continuum spanning hepatitis, fatty liver disease, fibrosis, and liver cancer, while also offering insights into cross-species differences in antitumor immunity and contributing foundational knowledge on immune system evolution[84].
Both spatial transcriptomics and spatial proteomics have been recognized as Methods of the Year by Nature Methods, and spatial metabolomics is likewise emerging as a highly promising and transformative approach. Within the TME, persistent metabolic stress and nutrient competition restrict the energy supply of effector T cells and disrupt redox homeostasis, ultimately driving them toward exhaustion, characterized by mitochondrial dysfunction, impaired glycolysis, and loss of cytotoxic capacity. Recent applications of spatial metabolomics have provided a new technical avenue for dissecting these metabolism–immunity interactions. By jointly mapping metabolite distributions and cellular spatial organization at the tissue level, spatial metabolomics reveals how metabolic heterogeneity constrains immune-cell function within the TME. For example, localized accumulation of lactate, lipids, and amino-acid metabolites in distinct tumor regions such as hypoxic zones, perivascular niches, and necrotic areas may precisely correspond to T-cell dysfunction, enrichment of immunosuppressive cell populations, and differential responses to immunotherapy.
In the translational landscape of HCC, AI-based predictive models are increasingly moving beyond conventional sample-level biomarkers toward spatially informed representations of the tumor microenvironment. By integrating region-specific molecular features with anatomically defined compartments—such as the tumor core, invasive margin, and adjacent stroma—these models capture immune and tumor states that are organized in space rather than uniformly distributed. A representative example is the spatial immune scoring framework that quantifies the in situ expression of immune-related genes, including SPON2, ZFP36L2, ZFP36, VIM, and HLA-DRB1, across distinct histological regions. Building on this concept, the TIMES scoring system integrates tile-level mIHC measurements from both intratumoral and stromal compartments, combines multiple biomarkers through a two-step spatial aggregation, and employs an XGBoost algorithm to generate a patient-specific HCC recurrence risk score, reportedly achieving over 95% prediction accuracy for specific multi-marker combinations[66].
However, the translational potential and clinical robustness of such space-aware predictive pipelines warrant cautious and critical interrogation. At present, most existing frameworks remain methodologically constrained by retrospective designs and relatively modest sample sizes, which inherently inflates the risk of overfitting when deploying parameter-dense machine learning algorithms or gradient-boosting trees. Although models like the TIMES system demonstrate exceptional metrics during internal cross-validation, their true generalization capacity across highly heterogeneous HCC cohorts remains technically ambiguous due to a pervasive lack of large-scale, prospective, and geographically distinct external validation datasets. Furthermore, inter-center variations in tissue preparation, antibody affinity staining batches, and digital tile sampling strategies introduce confounding technical noise that challenges model stability. Consequently, establishing standardized, multi-center quality control pipelines and strictly validating predictive robustness across low-resolution or noisy real-world specimens remain paramount architectural hurdles before these spatially informed representations can be reliably implemented into clinical prognostic stratification.
More broadly, AI enables disease prediction models to accommodate nonlinear relationships, spatial dependency, and multiscale organization inherent to HCC tissues. Graph-based learning, representation learning, and spatial feature aggregation allow predictive frameworks to integrate molecular signals with physical proximity, immune neighborhood structure, and tissue architecture. These capabilities are particularly relevant for modeling immune exclusion, spatially restricted immune suppression, and region-specific therapeutic vulnerability, all of which are central to HCC progression and treatment response. Looking forward, AI-driven predictive modeling in HCC is expected to increasingly incorporate multimodal spatial data, including spatial transcriptomics, spatial proteomics, spatial metabolomics, and histopathological imaging. Rather than serving solely as risk classifiers, future models are likely to function as integrative systems that link spatial molecular states to clinical outcomes, therapeutic response, and disease evolution. In this context, AI-based spatial prediction frameworks may play a central role in precision stratification, recurrence risk assessment, and decision support for personalized management of HCC.
-
Over the past decade, spatial multi-omics has successfully shifted the field of liver cancer research from broad cell-type cataloging to the high-resolution, in situ mapping of the HCC microenvironment. The integration of spatial transcriptomics and proteomics has established the foundational architecture of region-specific tumor compartments, definitively showcasing how specialized cellular neighborhoods cooperate to orchestrate malignant progression. Despite these unprecedented milestones in physical atlas drafting, several unresolved questions and technological bottlenecks must be addressed before this framework can achieve full clinical translation.
Computationally and methodologically, the field faces significant scalability constraints. Current spatial transcriptomics and proteomics are severely hindered by cell-segmentation artifacts in histologically dense, cirrhotic liver tissues, matrix interference in label-free spatial metabolomics, and stochastic noise across multi-modal registration. Spatial immunomics is constrained by lower capture efficiencies and localized stochastic noise, which complicates the accurate tracing of antigen-specific lymphocyte expansion at the critical tumor invasive front. Crucially, the lack of standardized analytical workflows and cross-platform benchmarking across disparate spatial multi-omics technologies continues to generate batch effects, limiting data reproducibility across independent clinical cohorts.
To bridge the gap to precision immuno-oncology, future efforts must shift from descriptive, two-dimensional retrospective studies toward 3D and longitudinal spatiotemporal modeling. Crucially, the systematic coupling of spatial multi-omics with digital whole-slide pathology and radiographic clinical imaging, alongside prospective validation in therapeutic cohorts, will offer scalable and actionable stratifiers for post-resection monitoring and personalized treatment escalation.
The authors gratefully acknowledge the support and encouragement from their colleagues during the preparation of this review. No specific funding was received for this work.
-
During the preparation of this work, the authors used Gemini (version: May 2026) for language refinement, text polishing, and figure enhancement. The authors reviewed and edited all content produced with the assistance of this tool, verified its accuracy, and take full responsibility for the integrity and originality of the final manuscript. This work represents the authors' own intellectual contribution, and no AI tool is credited as an author.
-
The authors confirm their contributions to the paper as follows: manuscript preparation and methodological analysis: Gu Y; conceptualization, supervision, manuscript logical structuring and revision: Jia G. All authors reviewed the results and approved the final version of the manuscript.
-
Data sharing not applicable to this article as no datasets were generated or analysed during the current study.
-
The authors declare that they have no conflict of interest.
- Copyright: © 2026 by the author(s). Published by Maximum Academic Press, Fayetteville, GA. This article is an open access article distributed under Creative Commons Attribution License (CC BY 4.0), visit https://creativecommons.org/licenses/by/4.0/.
-
About this article
Cite this article
Gu Y, Jia G. 2026. AI-powered spatial multi-omics discerns spatial patterns within immune microenvironment of hepatocellular carcinoma. Genomics Communications 3: e017 doi: 10.48130/gcomm-0026-0016 

AI-powered spatial multi-omics discerns spatial patterns within immune microenvironment of hepatocellular carcinoma
- Received: 14 April 2026
- Revised: 08 June 2026
- Accepted: 23 June 2026
- Published online: 27 July 2026
Abstract: The clinical management and long-term survival of hepatocellular carcinoma (HCC) are severely constrained by its insidious silent onset, pronounced spatial heterogeneity, and profound immunotherapeutic resistance. Traditional diagnostic and bulk sequencing strategies fail to capture these region-specific topographies, obscuring the critical landmarks that dictate disease progression and therapeutic failure. Recent paradigm shifts in spatial multi-omics—encompassing ultra-high-resolution transcriptomics, high-plex proteomics, label-free mass spectrometry metabolomics, and single-cell immune repertoire profiling—now permit direct, multi-layered biomolecular mapping within intact liver tissue architectures. In parallel, artificial intelligence has become an integral computational framework, driving precise cell segmentation, automated tissue-domain identification, and cross-modality data integration. By systematically coupling histopathological features with spatially resolved molecular states, AI-powered spatial multi-omics has successfully decoded advanced oncogenic mechanisms, including the myeloid-stromal interlocked 'Tumor Immune Barrier' at the invasive front and localized glycolytic metabolic zonation that drive effector cell exhaustion. Translating these multi-layered tissue geometries into space-aware predictive scoring systems establishes robust, patient-specific stratifiers for immunotherapy response and post-resection recurrence monitoring. Ultimately, this integrative analytical paradigm redefines our systemic understanding of the HCC microenvironment ecosystem, unlocking scalable avenues for clinical precision oncology.