-
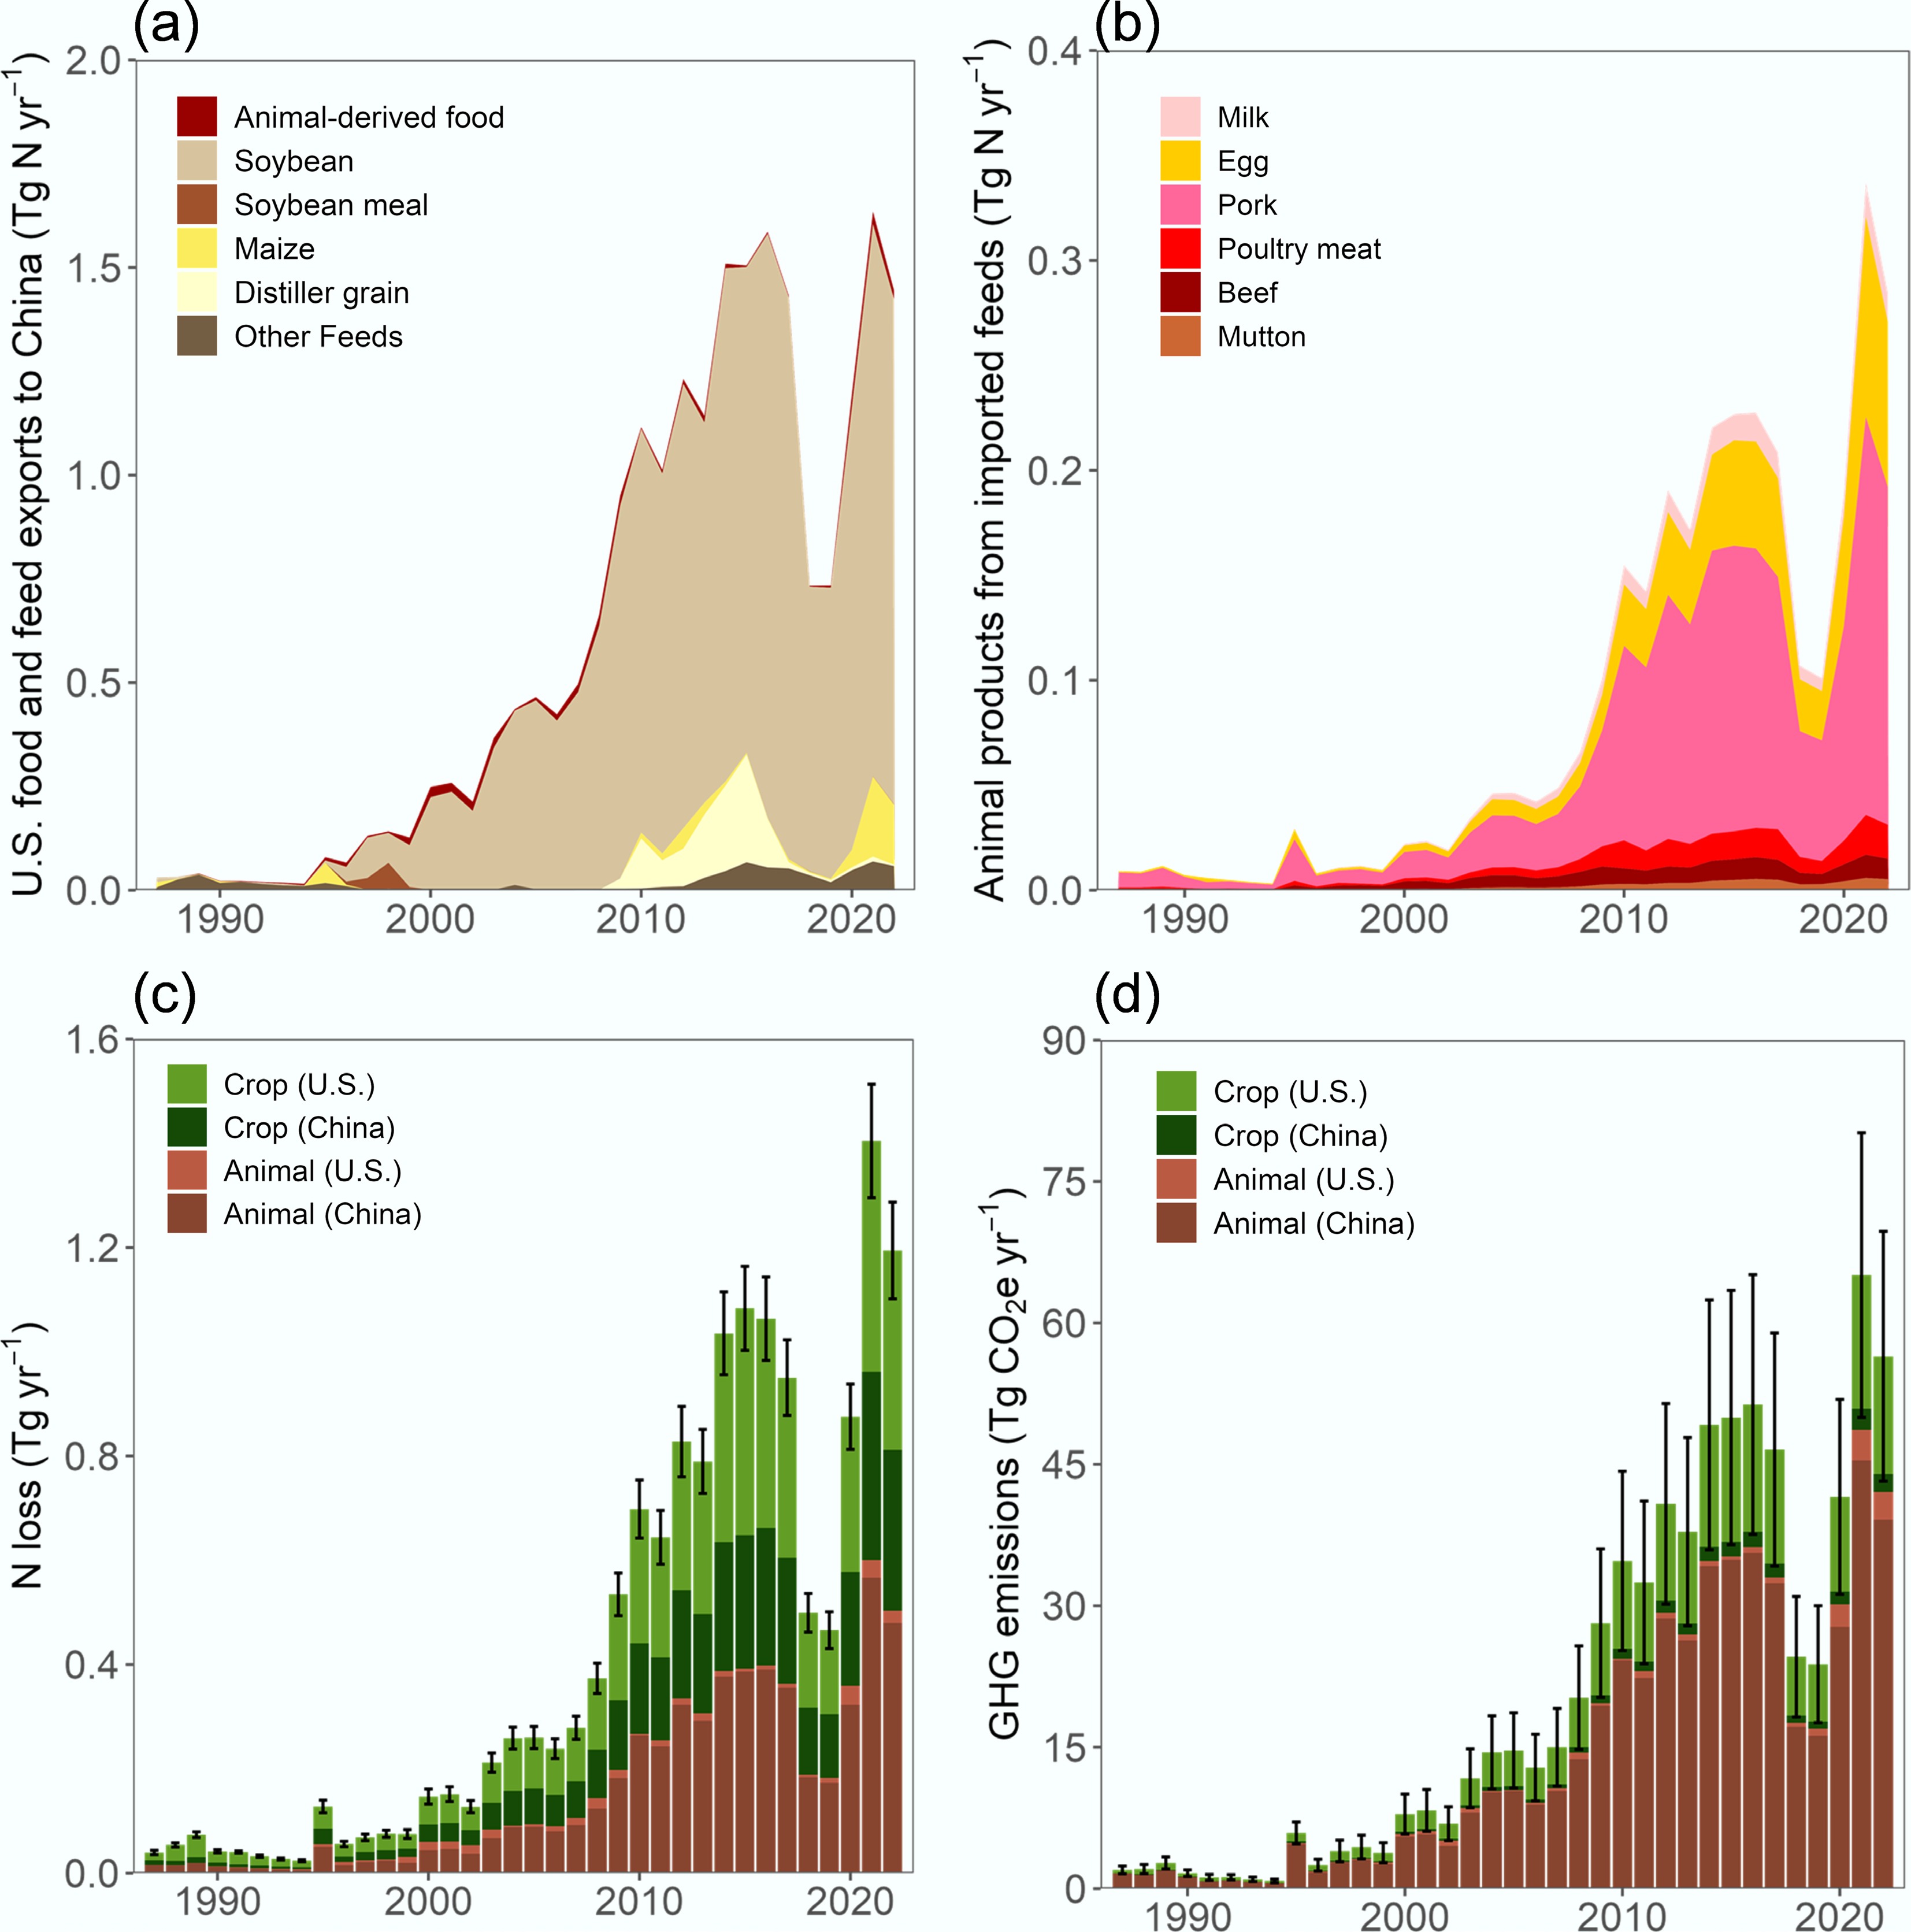
Figure 1.
U.S. exports of feed and food products to China, associated livestock production, and related environmental impacts in the U.S. and China during 1987–2022. (a) N contained in U.S. feed and food exports to China (Tg N yr−1). (b) Animal production in China supported by imported U.S. feed products (Tg N yr−1). (c) N losses (Tg N yr−1) and (d) GHG emissions (Tg CO2e yr−1) associated with crop and livestock production linked to bilateral trade between the two countries.
-
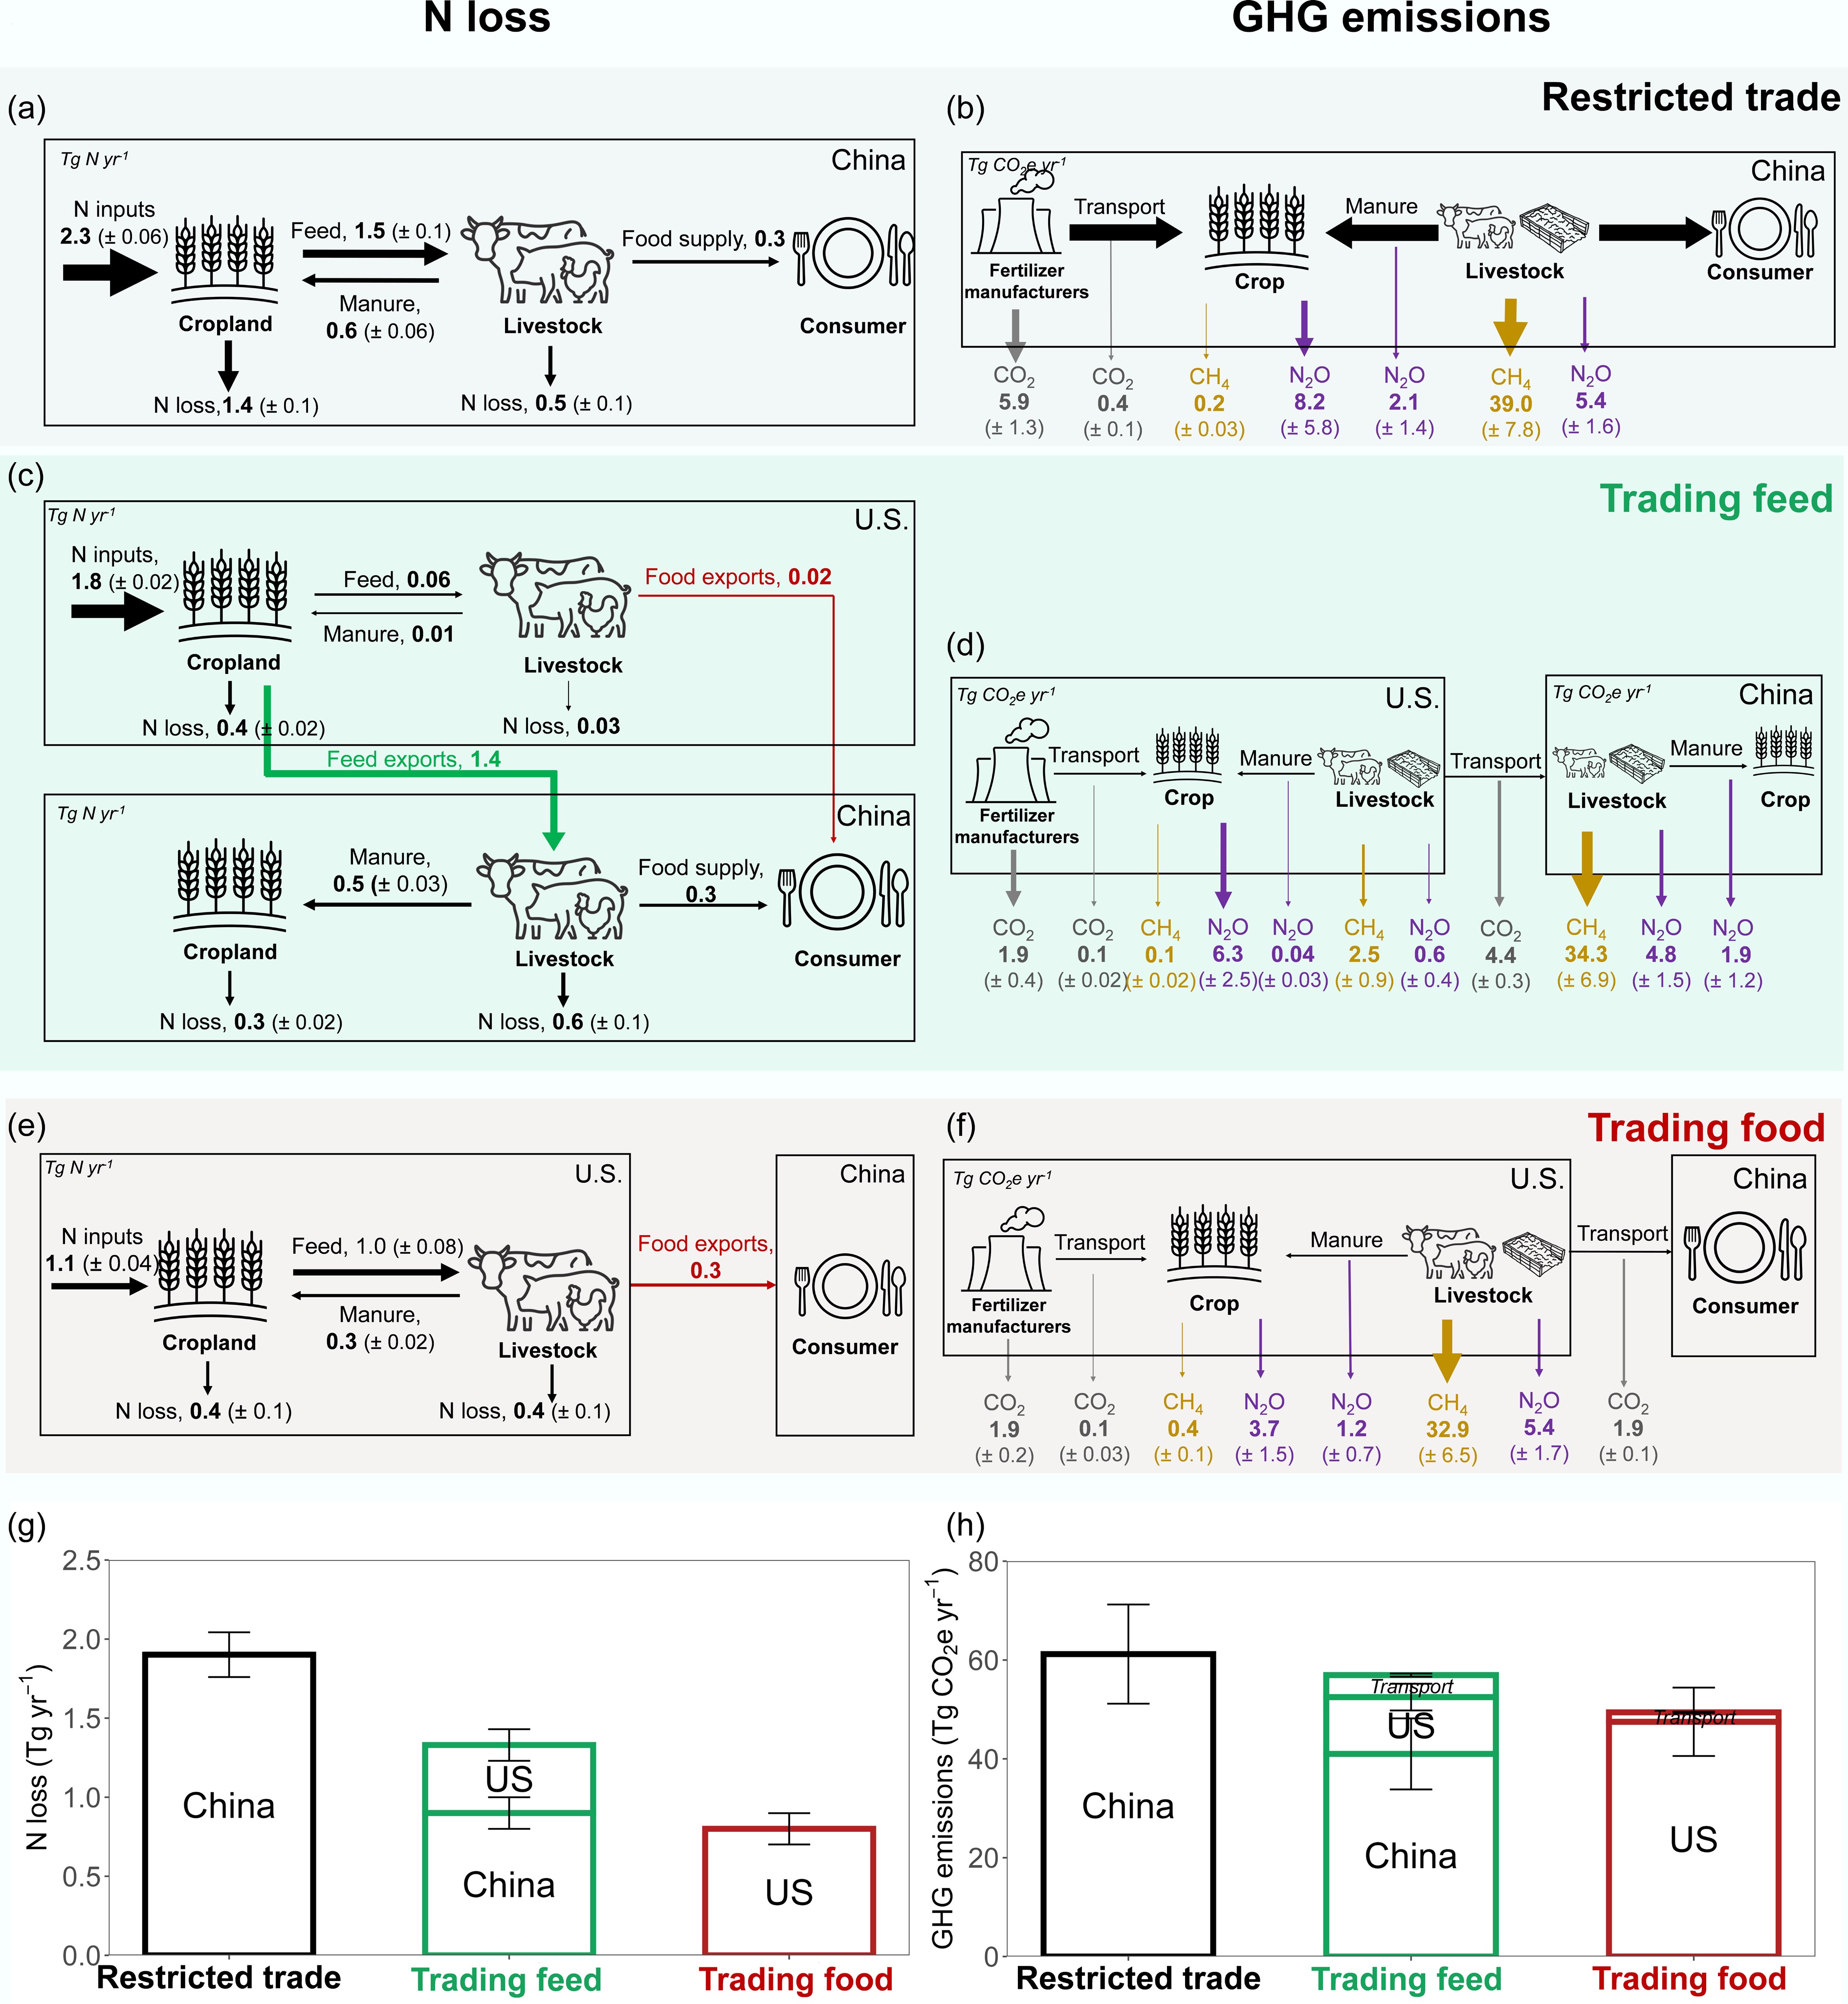
Figure 2.
N losses and GHG emissions associated with crop and livestock production under restricted trade, trading feed, and trading food scenarios between China and the U.S. N flows (Tg N yr−1) from crop and livestock production systems under (a) restricted trade (no feed or food trade between China and the U.S.), (b) trading feed, and (c) trading food scenarios. GHG emissions (Tg CO2e yr−1) from crop and livestock production systems under (d) restricted trade, (e) trading feed, and (f) trading food scenarios. (g), (h) Total global N loss and GHG emissions under the three trade scenarios, separated into contributions from China and the U.S. Transport-related GHG emissions shown in (h) represent emissions generated from international trade between the two countries and are not assigned to either China or the U.S. (c), (e), Red and green flows denote traded food and feed products, respectively. (d), (f), Grey, purple, and brown arrows indicate CO2, N2O, and CH4 emissions (expressed as CO2e using global warming potentials of 273 for N2O and 27 for CH4).
-
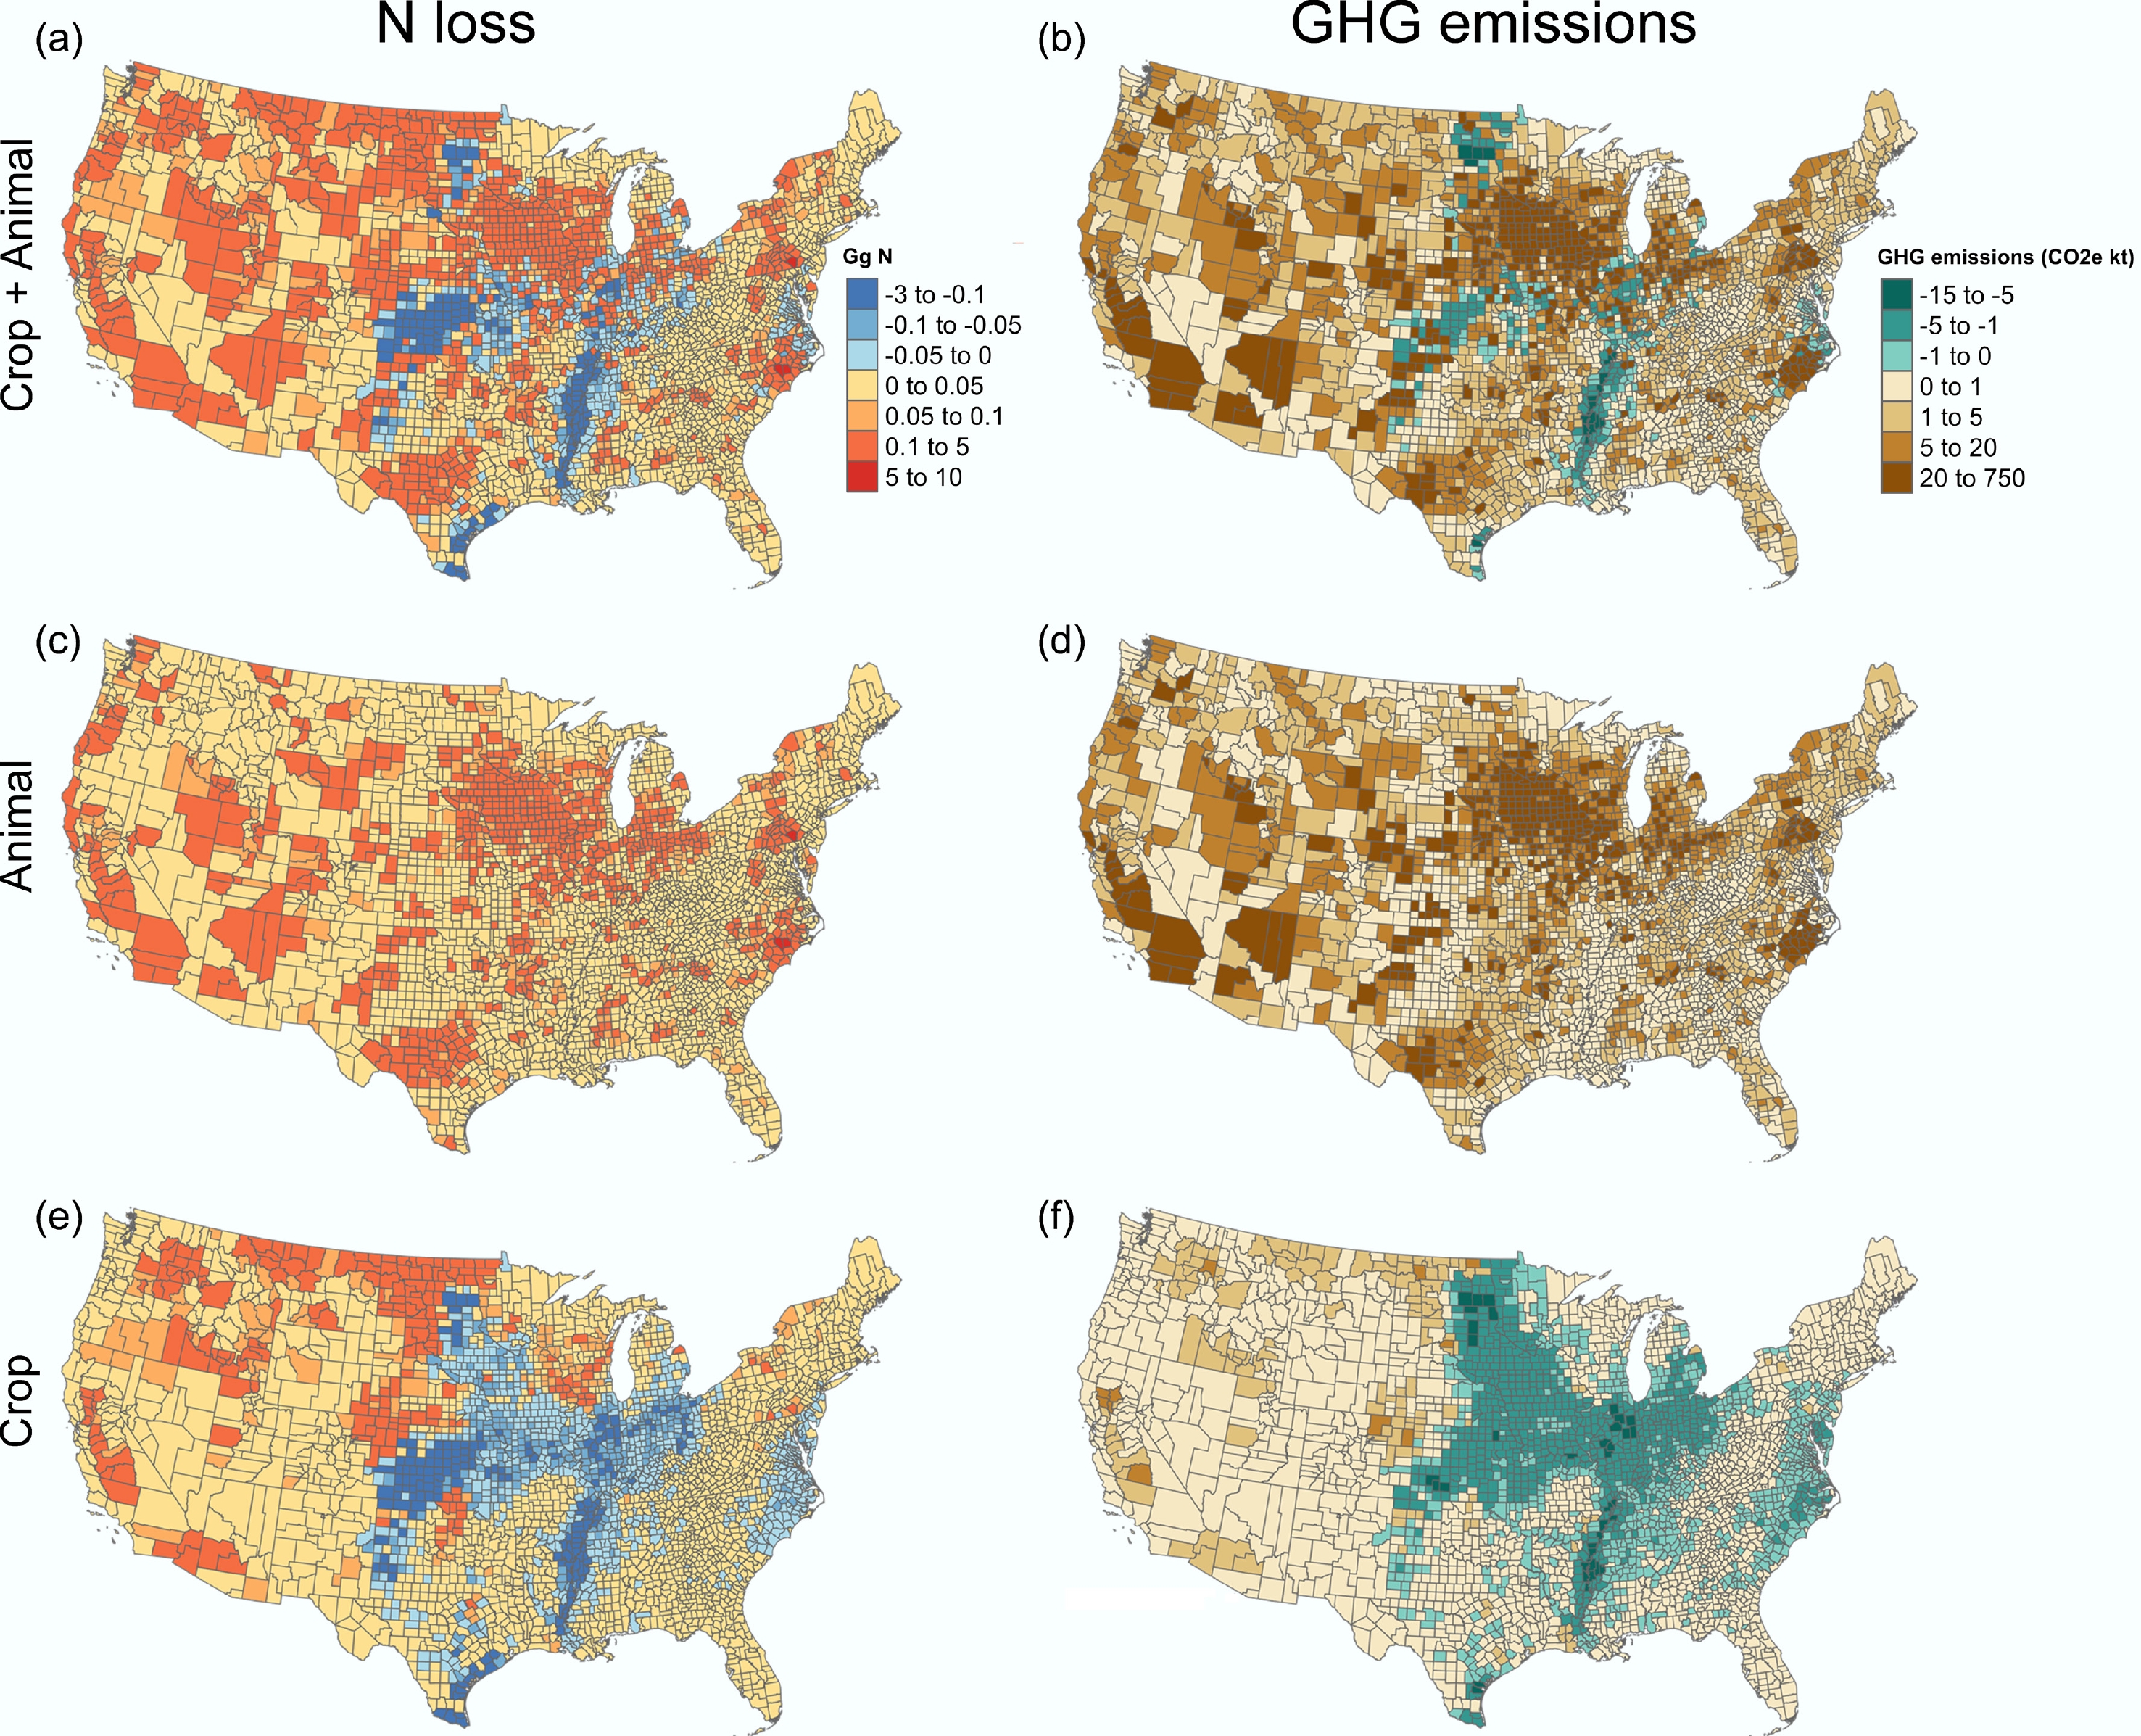
Figure 3.
County-level changes in environmental impacts across the U.S. under a scenario in which the U.S. exports animal-derived food products rather than feed products to China. Changes in N losses (Gg) associated with (a) combined crop and animal production, (c) animal production, and (e) crop production. Changes in GHG emissions (CO2e kt) associated with (b) combined crop and animal production, (d) animal production, and (f) crop production. Values represent differences between the trading food scenario and the current feed-dominant U.S.−China trade scenario used as the baseline.
-
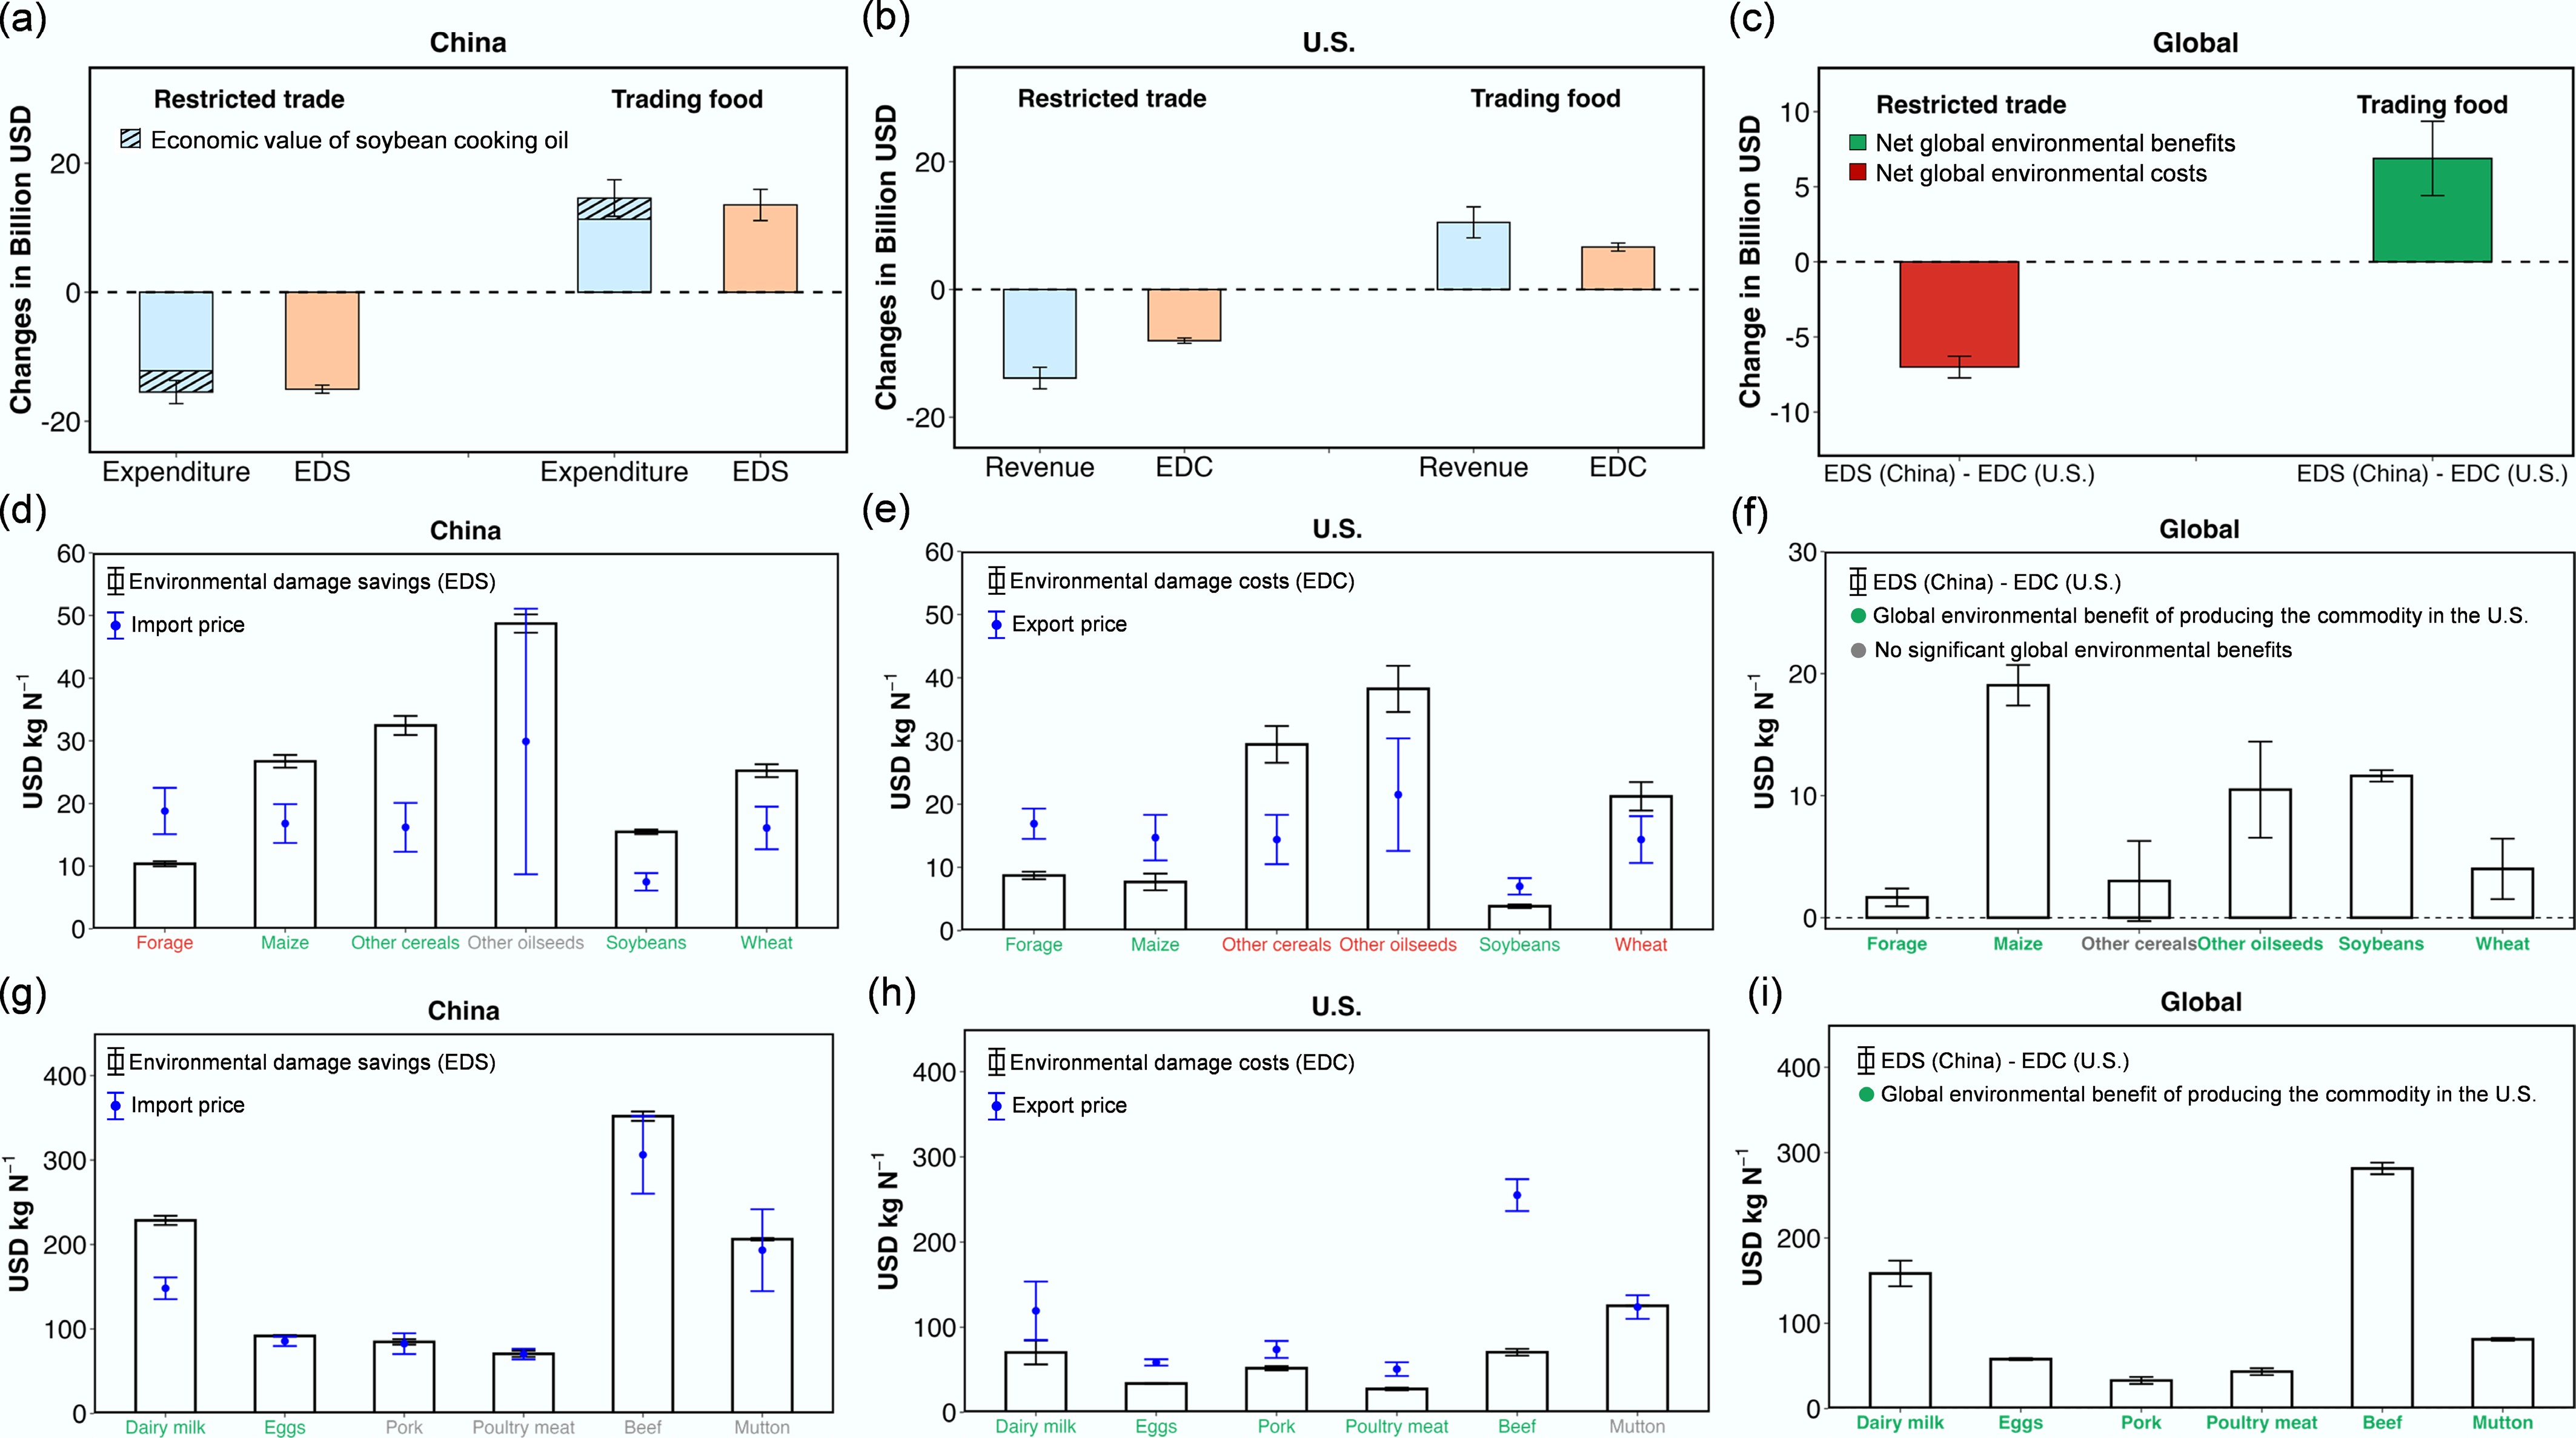
Figure 4.
Changes in monetized environmental and economic impacts under restricted trade and trading food scenarios relative to the current feed-dominant trade scenario (baseline) for China, the U.S., and the global system, including commodity-level comparisons among feed and food products. (a)–(c) Changes in trade-related economic impacts and environmental impacts under restricted trade and trading food scenarios compared with the baseline feed-dominant trade scenario for China, the U.S., and the globe. (d)–(f) Impacts associated with different feed products, while panels (g)–(i) show impacts associated with different food products across China, the U.S., and the globe. All values are expressed in billion US dollars. In panels (d)–(i), products highlighted in green along the x-axis indicate a net benefit at the country or global level. At the country level, a net benefit occurs when import expenditures are lower than environmental damage savings (EDS) in China, or when export revenues exceed environmental damage costs (EDC) in the U.S. At the global scale, a net benefit indicates that EDS in China surpasses EDC in the U.S. Products highlighted in red indicate a net cost, whereas grey denotes no statistically significant net benefit or net cost.
-
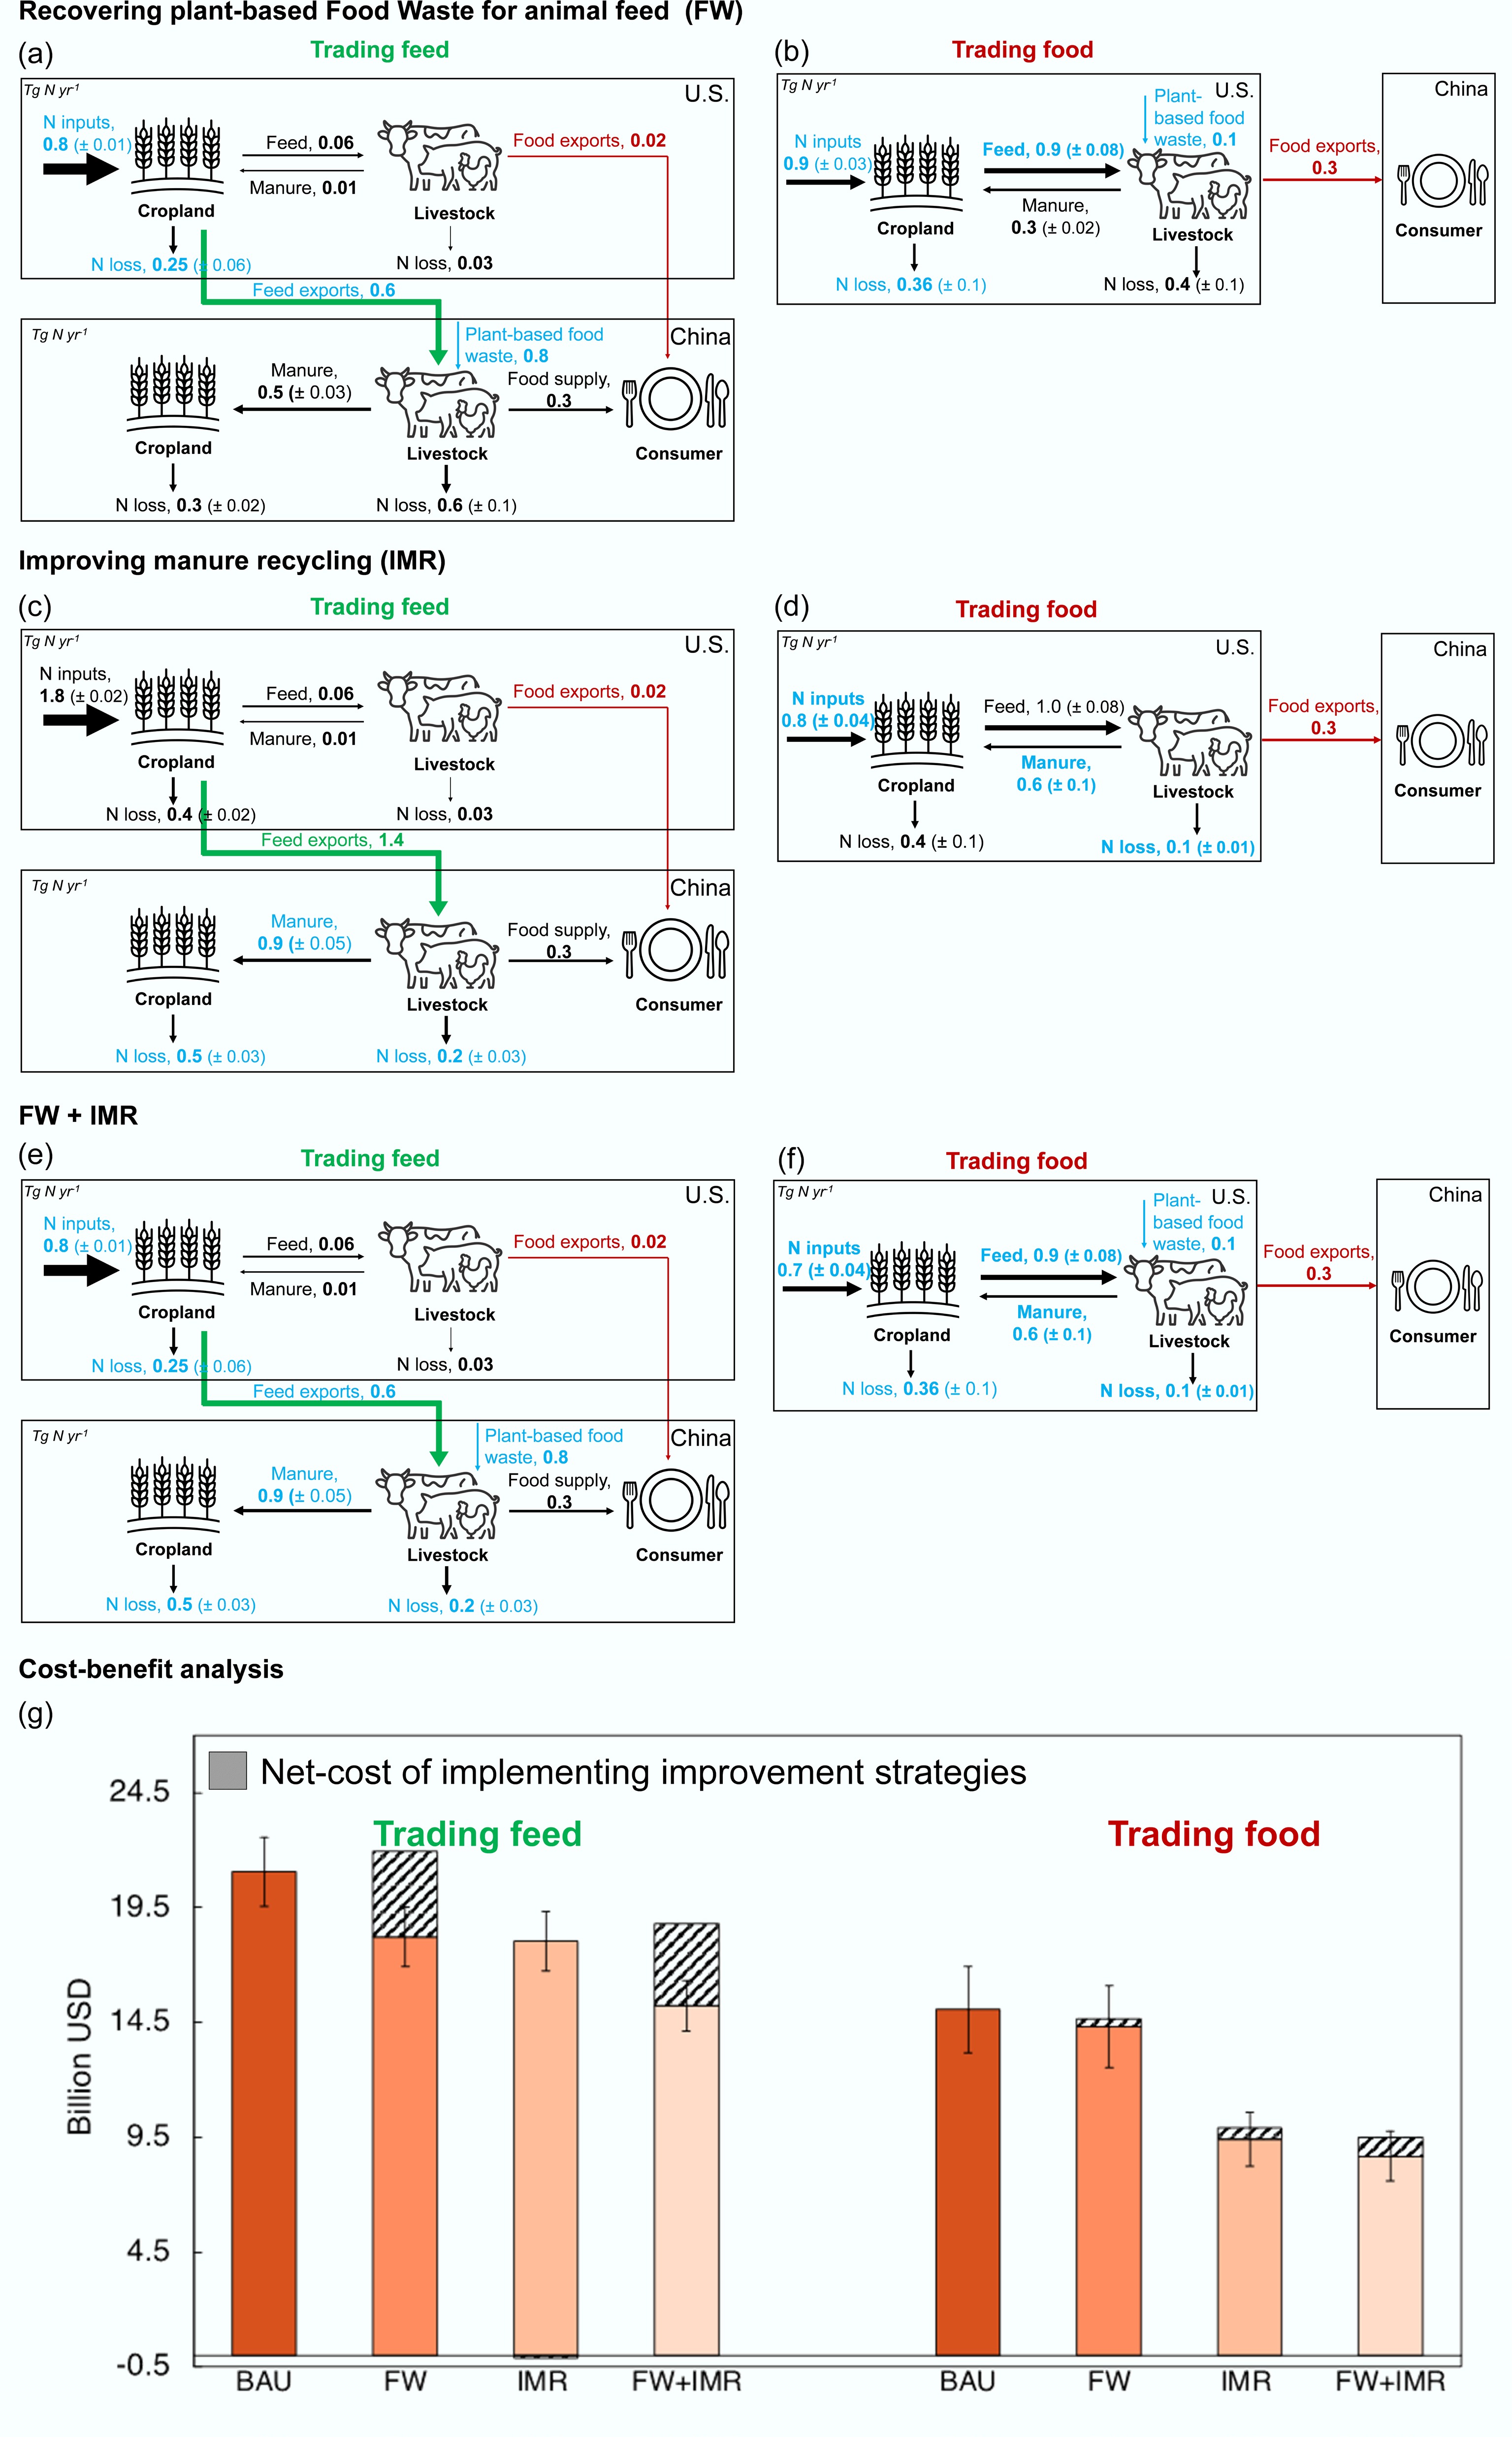
Figure 5.
Impacts of improved management strategies on N loss and associated environmental damage costs (EDC) in China and the U.S. under trading feed and trading food scenarios. N flows (Tg N yr−1) within crop and livestock production systems are illustrated for (a), (b) recovering N from plant-based human food waste as animal feed (FW); (c), (d) increasing manure recycling (IMR); and (e), (f) the combined application of FW and IMR, each assessed under trading feed and trading food scenarios. N flows influenced by improvement strategies are highlighted in blue. (g) Comparison of the environmental damage costs (billion USD) under the business-as-usual (BAU) and improved nutrient recycling strategies (FW, IMR, and FW + IMR) for the trading feed and trading food scenarios. Net costs were calculated by considering changes in environmental damage costs associated with N loss and implementation costs, while accounting for the economic value of recovered nutrients.
Figures
(5)
Tables
(0)