












-
Global trade in food and agricultural commodities has become increasingly important for supporting economic development and food security, while raising growing concerns regarding associated environmental and resource pressures[1−4]. During the last 25 years, the total value of globally traded agricultural and food products increased more than threefold, reaching nearly US
${\$} $ ${\$} $ Trade in feed and food products between China and the U.S. has major implications for both economic activity and environmental sustainability. The current feed-oriented trade may help reduce global environmental burdens because crop production in the U.S. generally operates with higher nitrogen use efficiency (NUE). However, this trade pattern can also further separate crop and livestock systems, limiting opportunities to recycle manure nutrients generated from imported feed back to cropland as substitutes for synthetic fertilizers used in feed production[12]. With current feed and manure management technologies, adjusting trade portfolios between the two countries has the potential to enhance global supply chain efficiency and reduce environmental impacts.
Previous research evaluating the environmental implications of agricultural trade has mainly concentrated on crop trade, with mitigation approaches typically emphasizing adjustments in crop trade structures or reductions in animal protein consumption to lower environmental burdens in exporting regions[1,13−15]. In comparison, limited attention has been given to how changes in trade portfolios that include both crop and livestock commodities influence environmental and economic outcomes, particularly within the context of bilateral trade between China and the U.S. As international trade becomes increasingly important for maintaining food security while addressing escalating environmental pressures, there is a growing need for quantitative assessments of agricultural trade consequences. Evaluating trade in feed crops and animal-derived food products between countries can provide insights for policymakers seeking to develop trade strategies that better support food security and environmental sustainability at both national and global scales.
In this study, we evaluated the environmental and economic outcomes associated with three trade scenarios between China and the U.S.: restricted trade (no feed or food trade), the existing trading feed scenario, and the trading food scenario. The analysis was based on 2022 trade data combined with parameters compiled from established databases and published literature. We further translated environmental impacts to the county scale to investigate how shifts in trade portfolios could generate spatially heterogeneous effects across the U.S., considering the current geographic distribution of crop and livestock production systems. In addition, we quantified economic trade-offs by comparing trade-related revenues or expenditures alongside environmental damage costs and savings associated with N loss under each scenario, including their broader global environmental implications. We also assessed mitigation potential of N loss and associated environmental damage costs reduction under improved nutrient recycling practices, including the use of plant-based human food waste as animal feed, improved manure recycling, and the combined implementation of both approaches.
-
Trade quantities of feed crops and animal-derived food commodities traded between China and the U.S. were obtained from the FAOSTAT Detailed Trade Matrix database (
www.fao.org/faostat/en/#data/TM )[16]. N content of each feed crop and animal product was obtained from Lassaletta et al.[17]. Information describing livestock production systems in China, including animal NUE, feed formulae, feed conversion ratio (FCR), and animal inventories, was gathered from the published study[18−20]. For the U.S., animal feed consumption data were sourced from IFEEDER (www.ifeeder.org/research/feed-ingredient-consumption-report )[21], while production quantities of animal products were obtained from FAOSTAT. Crop NUE values for China and the U.S. were based on estimates for 2010–2015 reported by Zhang et al.[22] and Gu et al.[23] (Supplementary Table S1). Livestock-specific manure recovery rates for cropland application were derived from Zhu et al.[24] for China and Wang et al.[25] for the U.S. (Supplementary Table S2).Emission intensities for GHG generated through enteric fermentation and manure management in livestock systems for both China and the U.S. were obtained from Global Livestock Environmental Assessment Model (GLEAM,
https://foodandagricultureorganization.shinyapps.io/GLEAMV3_Public/ )[26] (Supplementary Table S3). Estimates of GHG emissions from rice cultivation were sourced from the U.S. Agriculture and Forestry Greenhouse Gas Inventory for the U.S.[27] and from FAOSTAT for China (Supplementary Table S4). Direct N2O emissions from crop N inputs were calculated using the IPCC (2006) default emission factor 0.01 kg N2O kg N−1 [28]. Indirect N2O emissions associated with N volatilization and N loss through leaching or runoff were estimated separately. Volatilized N was assumed to equal 10% of total N inputs and multiplied by an emission factor of 0.01 kg N2O kg N−1, while N lost via leaching and runoff was multiplied by an emission factor of 0.0075 kg N2O–N kg N−1[28]. Fertilizer manufacturing and transportation emissions were estimated using an emission factor from Menegat et al.[29]. GHG emissions associated with residue burning of corn, wheat, and soybean were estimated using crop-specific residue burning fractions and emission factors obtained from the FAOSTAT Emissions Totals database (www.fao.org/faostat/en/#data/GT )[16] (Supplementary Table S4).We also incorporated GHG emissions from international maritime transport of feed and food commodities traded between China and the U.S. using published estimates from a previous study[30] (Supplementary Table S5). Economic assessments under different trading scenarios were based on commodity-specific import and export prices. Trade price data were collected from Customs statistics in China (
https://stats.customs.gov.cn/indexEn )[31] and Global Agricultural Trade System in the U.S. (GATS,https://apps.fas.usda.gov/gats/default.aspx )[32] (Supplementary Tables S6 and S7).Accounting for imported crop products in feed use and re-exports
-
All imported crop products used in the analysis were limited to those allocated for animal feed. Feed ratios for each crop type were derived from the FAOSTAT Food Balance Sheets[16], calculated as the share of products used as feed relative to total supply (Supplementary Table S8). For products such as distillers' grains, oilseed cakes, and forage crops, we assumed complete allocation to animal feed. For imported crop products such as soybean, we recognized dual end uses: (1) processing into edible oil for human consumption; and (2) diversion of crushing by-products (e.g., soybean meal) to animal feed. Accordingly, we defined the feed ratio as the sum of oilseeds consumed directly as feed and those processed for oil production, divided by the total supply. This is because the end oil product contains no N, and all N is retained in the resulting oilseed meal and ultimately used as feed. Regarding potential re-exports of the U.S. agricultural products, this study focuses exclusively on trade between mainland China and the U.S. According to UN Comtrade[33], there are no records indicating that imported feed or food products from the U.S. are re-exported from China to other countries. Re-exports were therefore not considered in the current analysis.
Counterfactual scenario analysis
-
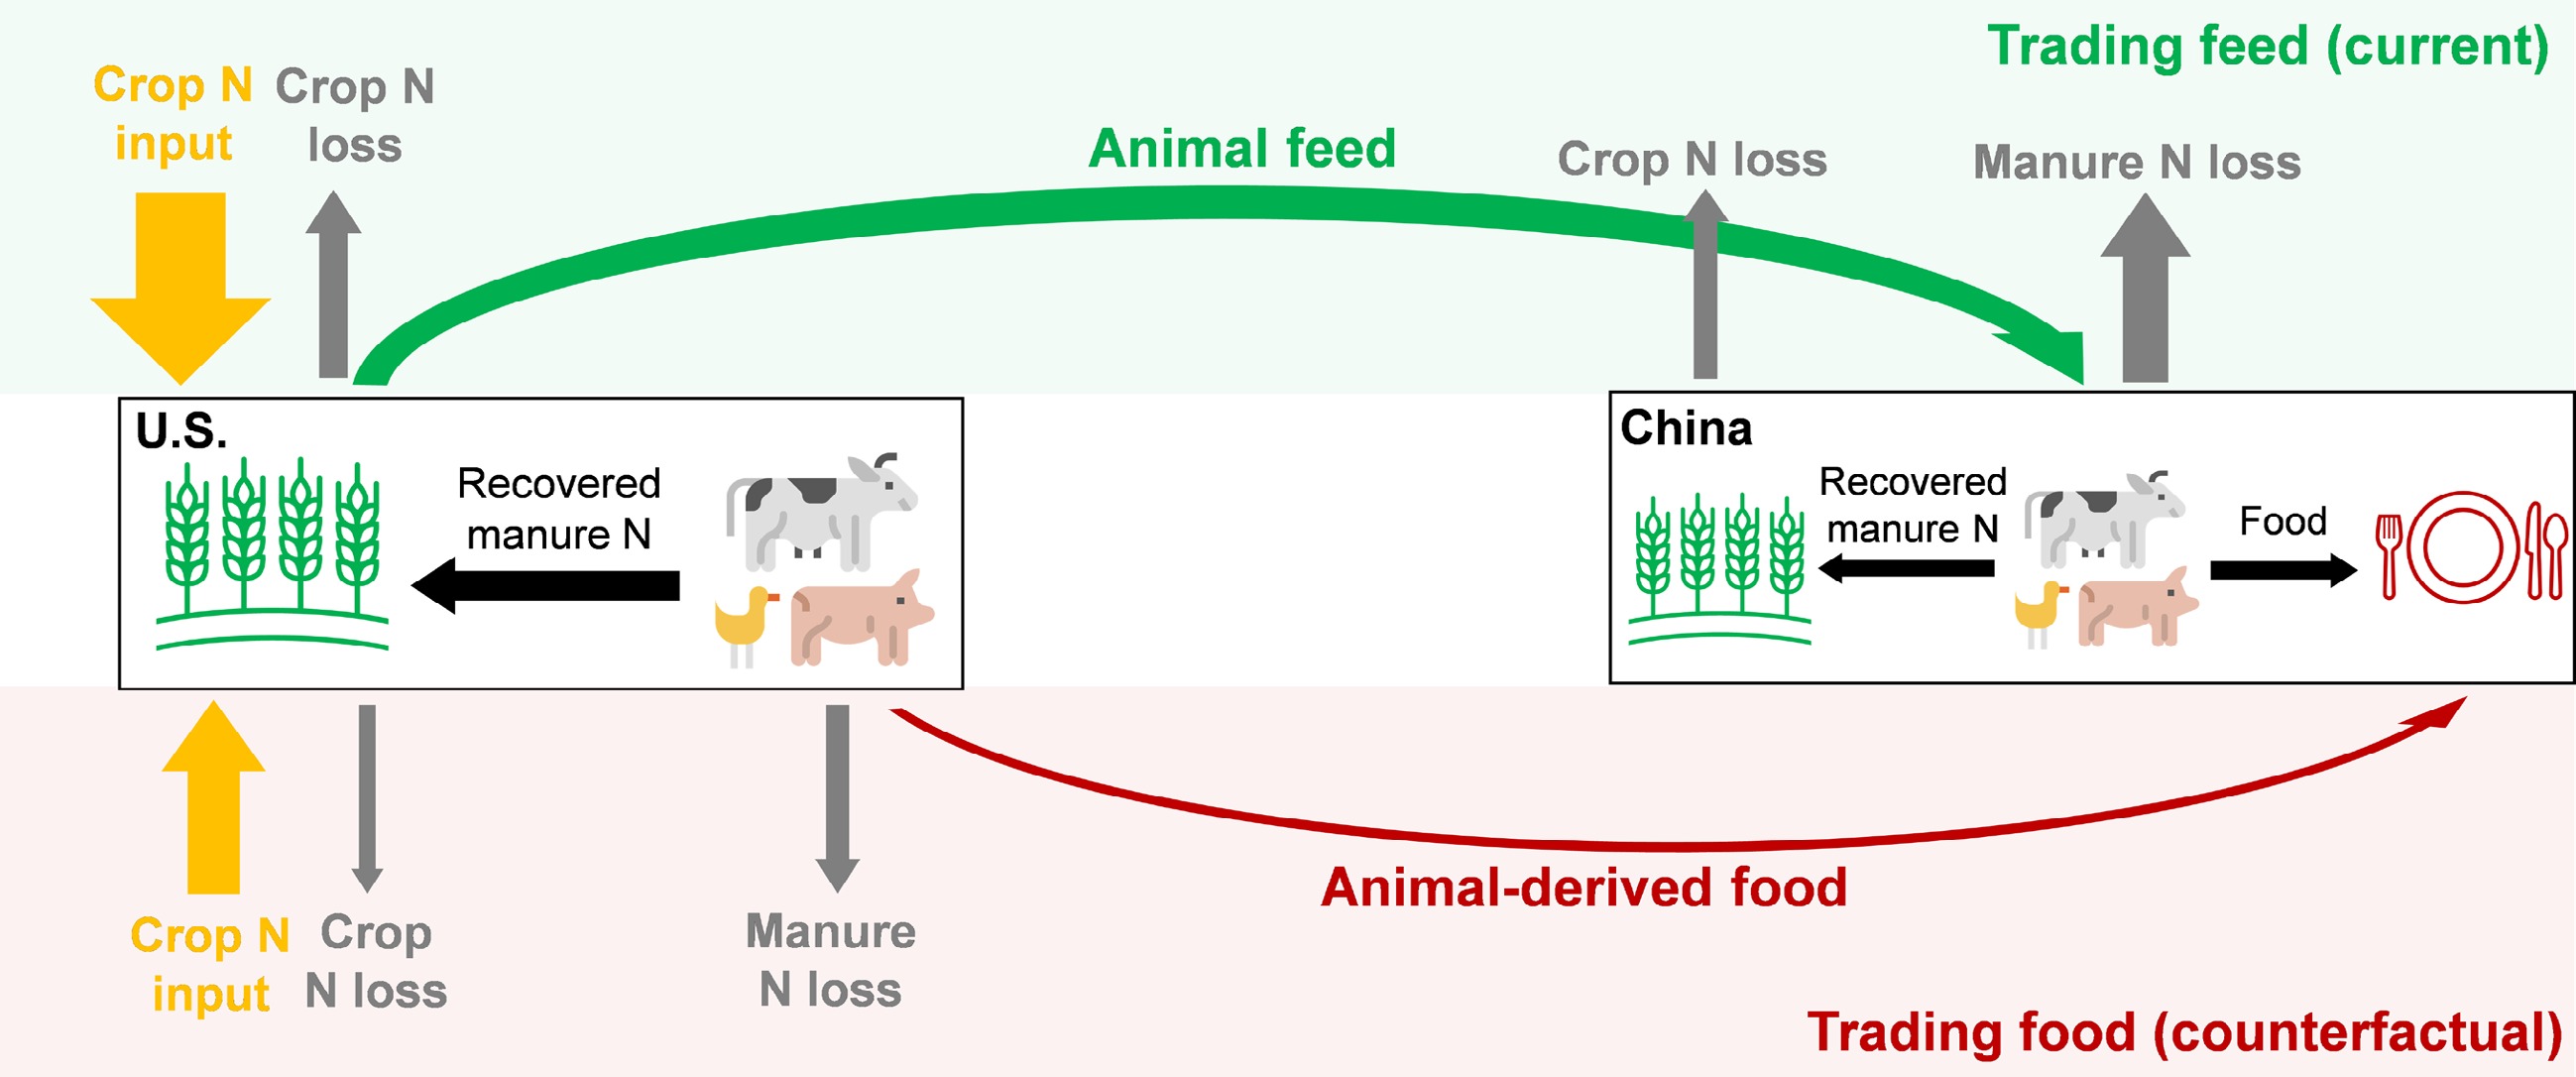
We developed two counterfactual trade scenarios compared to the current feed-dominant trade situation: (1) the restricted trade scenario and (2) the trading food scenario. In the restricted trade scenario, feed N currently imported from the U.S., and the corresponding animal N products that these feed crops support are instead assumed to be produced domestically within China, thereby eliminating agricultural trade between the two countries. In the trading food scenario, the equivalent quantities of imported feed N and resulting animal N products are assumed to be produced in the U.S., with consumer-oriented animal products exported to China. Here, animal-derived food includes both raw products (e.g., frozen meat) and processed products (e.g., bacon, sausage, and milk powder) according to the commodity-level items recorded in the trade database. We assume that these products are transported under temperature-controlled conditions during international trade. These two counterfactual scenarios help understand how current feed-dominant trade and shifting trade portfolios between the two countries affect the environmental consequences and economic benefits from a new perspective. Consequently, crop and livestock NUEs and manure recycling rates reflect U.S. conditions under the trading food scenario, whereas in the restricted trade scenario, they reflect China's conditions. A detailed description of the methodology used to convert imported feed N into animal N products is provided in the Supplementary Text 1.
N loss from crop and livestock production systems
-
N loss estimates from crop and livestock production in China and the U.S. were constrained to the feed crop and animal N products traded between the two countries under three trade scenarios. Specifically, N loss from crop production is defined as the difference between crop N inputs and harvested crop N products. For each scenario, we first estimated the required feed crop N depending on country-specific livestock NUE (Supplementary Table S9). Then, total crop N inputs were estimated by dividing the N content in feed crops by the average crop-specific NUE:
$ \text{Crop N loss}_{i,k}=\sum\limits_{j=1}^8\dfrac{\text{Crop N products}_{i,j,k}}{\text{Crop NUE}_{j,k}}-\sum\limits_{j=1}^8\text{Crop N products}_{j,k} $ (1) where, Crop N lossi,k represents N loss from crop production under trade scenario (i) in country (k); Crop N productsi,j,k represents required feed crop (j) under trade scenario (i) in country (k); Crop NUEj,k refers to crop NUE for crop (j) by country (k). Feed crops comprise soybean, maize, wheat, rice, other cereals, other oilseeds, hay, and tubers.
For livestock production, N inputs are feed N intake, estimated by dividing animal N products (meat, milk, and eggs) by country-specific animal NUE. N loss is defined as the difference between feed N intake and the sum of livestock N products and manure N recovered for cropland application:
$ \begin{split} \text{Livestock N loss}_{i,k}=\; & \sum\limits_{l=1}^6\frac{\text{Livestock N products}_l}{\mathrm{ }\text{Livestock NUE}_{l,k}} \\ &-\sum\limits_{l=1}^6\text{Livestock N products}_l\\&-\sum\limits_{l=1}^6\text{Manure N recovery}_{l,k} \end{split} $ (2) where, Livestock N lossi,k represents N loss from livestock production under trade scenario (i) in country (k); Livestock N productsl represents N content in livestock type (l), which are consistent across three trade scenarios; Livestock NUEl,k refers to NUE for livestock (l) by country (k);
$ \sum\nolimits_{l=1}^{6}{\text{Manure N recovery}}_{l,k} $ GHG emissions from crop and livestock production systems
-
GHG emissions associated with crop and livestock production systems in this study include: (1) manufacturing and transportation of synthetic fertilizer; (2) agricultural soils from N inputs; (3) rice cultivation and crop residue burning; (4) enteric fermentation; (5) manure management; and (6) international shipping from transporting feed crops and animal products. GHG emissions are converted to carbon dioxide (CO2) using 100-year Global Warming Potentials (GWPs) reported in the Intergovernmental Panel on Climate Change (IPCC) Sixth Assessment Report (CH4 = 27, N2O = 273)[28]. A detailed description of specific sources is provided in Supplementary Table S10.
County-level environmental impact assessment
-
We downscaled changes in U.S. crop and livestock production under the trading food scenario relative to the current trading feed to the county level, assuming that the production changes in each county were proportional to its share of total national production, as described in Eq. (3). County-level crop and livestock production data were obtained from USDA-NASS (
https://quickstats.nass.usda.gov/ )[34].$\begin{split}&{\text{Crop and animal production}}_{j,l,ct}\\=\;& \dfrac{{\text{Crop and animal production}}_{j,l,,ct}}{\sum\nolimits_{ct=1}^{3107}{\text{Crop and animal production}}_{j,l,ct}}\\&\times {\text{Changes in crop and animal N products}}_{j,l}\end{split} $ (3) where, Crop and animal productionj,l,ct is crop and livestock N production by crop (j) and livestock type (l) in 2017 in county (ct), and Changes in crop and animal N productsj,l is the difference in total N contents in crop (j) and livestock product (l) between trading food scenario, and current feed-dominant trade at national level.
Cost–benefit analysis
-
In addition to environmental impacts, we also evaluated economic impacts for both countries and the globe under the two counterfactual trading scenarios.
Trade-related economic impacts
China
-
Under the restricted trade and trading food scenarios, using the current trading feed as the baseline, changes in trade expenditure (billion USD) were estimated as a sum, across animal product types, of import quantities (kg N) multiplied by corresponding import price (US
${\$} $ U.S.
-
Using the current feed-dominant trade as the baseline, changes in trade revenue (billion USD) were estimated as the sum, across animal product types, of export quantities (kg N) multiplied by their corresponding export prices (USD kg N−1), or set to zero under the restricted trade scenario, minus the revenue from feed exports, as defined in Eq. (4):
$\begin{split} \text{Changes in trade value}=\;&{\text{Trade value}}_{\text{counterfactual}}\\&-\sum\limits_{j}{price}_{j,\text{feed}}\times {quantity}_{j,\text{feed}} \end{split}$ (4) $ {\text{Trade value}}_{\text{counterfactual}}=\left\{\begin{array}{ll} 0&(\mathrm{restricted}\;\mathrm{trade})\\ \displaystyle\sum\limits_{l}{price}_{l,\text{food}}\times {quantity}_{l,\text{food}}&(\mathrm{trading}\;\mathrm{food}) \end{array}\right. $ where, 'Changes in trade value' denotes changes in trade value (expenditure for China and revenue for the U.S.), 'price' is in USD kg−1 N (import for China and export for the U.S.), and 'quantity' is trade quantity (kg N). Subscripts j and l refer to feed crops and animal products, respectively.
Monetized environmental impacts
China
-
In addition to trade-related economic impacts, the monetized impacts of per unit of N loss were calculated based on damage costs of different reactive nitrogen (Nr) forms on the ecosystem, human health, and climate and their respective share of total N loss, using Gross National Income (GNI) per capita in China and the U.S. in 2020[37−41]. More information about damage costs of specific reactive N compounds for the two countries can be found in Supplementary Table S11. Using trading feed as the baseline, under a restricted trade scenario, there are increased costs arising from producing all feed crops and animal products in China. By contrast, under the trading food scenario, production is shifted to the U.S., resulting in reduced environmental damage costs for China. These avoided costs are referred to as Environmental Damage Savings (EDS, billion USD), representing the environmental benefits, calculated using changes in N loss from crop and animal production, applying monetized impacts per unit (USD kg N−1) of N loss in China from literature according to Eq. (5):
$ \begin{split}\text{EDS}=\;&{\text{Monetized environmental impacts}}_{\text{counterfactual,China}}\\&-{\text{N loss damage cost}}_{\text{China}}\times {\text{N loss}}_{\text{China, feed}} \end{split}$ (5) $ \begin{split}&{\text{Monetized environmental impacts}}_{\text{counterfactual,China}}\\=\;&\left\{\begin{array}{ll} {\text{N loss damage cost}}_{\text{China}}\times {\text{N loss}}_{\text{feed and food,China}}&(\mathrm{restricted}\;\mathrm{trade})\\ 0&(\mathrm{trading\;food}) \end{array}\right.\end{split}$ U.S.
-
In the U.S., under the restricted trade scenario, there are no environmental damage costs. By contrast, under a trading food scenario, both crop and animal production are shifted to the U.S., resulting in increased damage costs. These increased costs are referred to as Environmental Damage Costs (EDC, billion USD), calculated using changes in N loss from crop and animal production, applying monetized impacts per unit (USD kg N−1) of N loss in the U.S. from literature according to Eq. (6):
$ \begin{split}\mathrm{EDC}=\;&{\mathrm{Monetized}\;\mathrm{environmental}\;\text{impacts}}_{\mathrm{counterfactual},\mathrm{U}.\mathrm{S}.}\\&-{\mathrm{N}\;\mathrm{loss}\;\mathrm{damage}\;\text{cost}}_{\mathrm{U}.\mathrm{S}.}\times {\mathrm{N}\;\text{loss}}_{\mathrm{U}.\mathrm{S}.,\;\text{feed}}\end{split} $ (6) $ \begin{split}&{\mathrm{Monetized}\;\mathrm{environmental}\;\text{impacts}}_{\mathrm{counterfactual},\mathrm{U}.\mathrm{S}.}\\=\;&\left\{\begin{array}{ll} 0&(\mathrm{restricted}\;\mathrm{trade})\\ {\mathrm{N}\;\mathrm{loss}\;\mathrm{damage}\;\text{cost}}_{\mathrm{U}.\mathrm{S}.}\times {\mathrm{N}\;\text{loss}}_{\mathrm{feed}\;\mathrm{and}\;\mathrm{food},\;\mathrm{U}.\mathrm{S}.}&(\mathrm{trading}\;\mathrm{food}) \end{array}\right.\end{split} $ Globe
-
Global-level economic impacts were assessed from an environmental perspective, accounting for environmental damage costs and savings from N loss in both countries. Under the restricted trade scenario, global environmental damages include N loss from producing both feed crops and animal products in China. In the current feed-dominant trade baseline, impacts include damages from animal production in China and predominantly feed crop production in the U.S. Under the trading food scenario, environmental damages include producing both feed crops and animal products in the U.S. Changes in global economic impacts were calculated for the restricted and trading food scenarios relative to the current feed-dominant trade baseline.
Optimized management scenario analysis
-
The environmental and economic impacts of the trading feed and food scenarios between the U.S. and China were evaluated under current manure and food waste recovery conditions in China and the U.S., respectively, (business-as-usual: BAU). We further assessed three improvement strategies: (1) incorporating plant-based human food waste into livestock feed (FW); (2) improving manure recycling with a target recovery rate of 80% of excreted manure (IMR); and (3) the combined implementation of FW and IMR. Then, we assessed environmental and economic impacts under these optimized management scenarios compared to BAU trading feed and food (Supplementary Tables S24 and S25).
BAU
-
Under the BAU trading feed and food scenarios, current manure recovery rates associated with these trade portfolios in the U.S. and China are estimated at 47% and 52%, respectively. In the U.S., there is currently negligible amount of human food waste used for animal feed[42]. In contrast, food waste feeding still occurs in backyard poultry and pig production systems in China[18].
FW scenario
-
In the FW scenario, for the U.S., we assessed the potential mitigation impacts of recycling plant-based human food waste generated in the residential sector as animal feed[43]. We focused exclusively on plant-based human food waste, as animal-sourced food waste may present biosecurity risks associated with disease-causing pathogens, including those related to foot-and-mouth disease and African swine fever[44]. We estimated the N content of residential plant-based food waste (0.1 Tg N), including grains, oilseeds, roots and tubers, fruit, and vegetables[18,45−47], and assumed that this could partially substitute for feed N from corn. For China, we estimated the amount of plant-based food waste lost at the consumption stage based on Jia et al.[48] and assumed that the recovered N would partially substitute feed N currently supplied by soybean. Under this scenario, reduced soybean demand in China would partially decrease soybean imports from the U.S., thereby lowering cropland N inputs associated with soybean production in the U.S. For the cost–benefit analysis, besides environmental damage costs derived from N loss, we considered: (1) food waste management costs: dry-based treatment for animal feeding, including collection, transport, and treatment estimated at US
${\$} $ ${\$} $ IMR scenario
-
The IMR scenario was designed to evaluate the potential of reducing external N inputs through enhanced internal nutrient recycling. In the U.S, manure recovery rates are relatively high for poultry systems but lower for pigs and cattle[25]. Livestock-specific manure recovery rates are provided in Supplementary Table S2. Under this scenario, we assumed a target recovery rate of 80% of excreted manure in both countries. This target is also broadly aligned with existing policy goals[50] on improving livestock manure utilization. In addition, we conducted sensitivity analyses under higher recovery targets (e.g., 90% and 100%), presented in the Supplementary Text 2 and Supplementary Fig. S1. For the cost–benefit analysis, besides reduction in environmental damage costs derived from N loss, we considered: (1) manure management costs. In the U.S., the estimated daily operating cost[51] of a mobile full-scale manure treatment system is approximately US
${\$} $ ${\$} $ ${\$} $ ${\$} $ FW + IMR scenario
-
The FW + IMR scenario evaluates the combined impacts of adopting improvement strategies in both the FW and IMR scenarios.
Uncertainty analysis
-
We estimated uncertainties in environmental and economic impacts across the three trade scenarios using Monte Carlo simulations (n = 500). Uncertainties were derived from empirically observed variability reported in datasets and the literature, including coefficients of variation (CVs) and standard deviations for crop and livestock NUE[19−22,55], manure recovery rates[24,25], emission factors[26−30,56], and trade price data[31,32]. For N loss, uncertainties were propagated from crop and livestock NUE, as well as manure recovery rates. For GHG emissions, uncertainties were propagated from both activity data and emission factors across upstream, on-farm, and post-farm emission sources. Emission factor uncertainties were derived from the 2006 IPCC Guidelines for National Greenhouse Gas Inventories[28] and related studies[26−30,56]. Uncertainties in economic impacts were derived from variation in import and export prices data per feed and food type over the period 2015–2022, using data from the customs statistics[31] and global agricultural trade[32] datasets (Supplementary Tables S9 and S10). Uncertainties in monetized environmental impacts were derived from crop and livestock NUE, generating ranges for N loss associated with producing 1 kg of N product. The results are presented as the mean values ± 1 s.d. Detailed descriptions of uncertainty propagation are provided in the Supplementary Text 3.
-
Over the past 35 years, agricultural trade between the U.S. and China has expanded substantially. Despite a sharp decline during the U.S.–China trade war, when traded soybeans and associated environmental impacts were reduced by nearly half in 2018 and 2019 (Fig. 1a, c, and d), trade volumes rebounded rapidly thereafter. The 2020 Phase One Trade Agreement marked a major turning point, with China committing to purchase an additional
${\$} $ 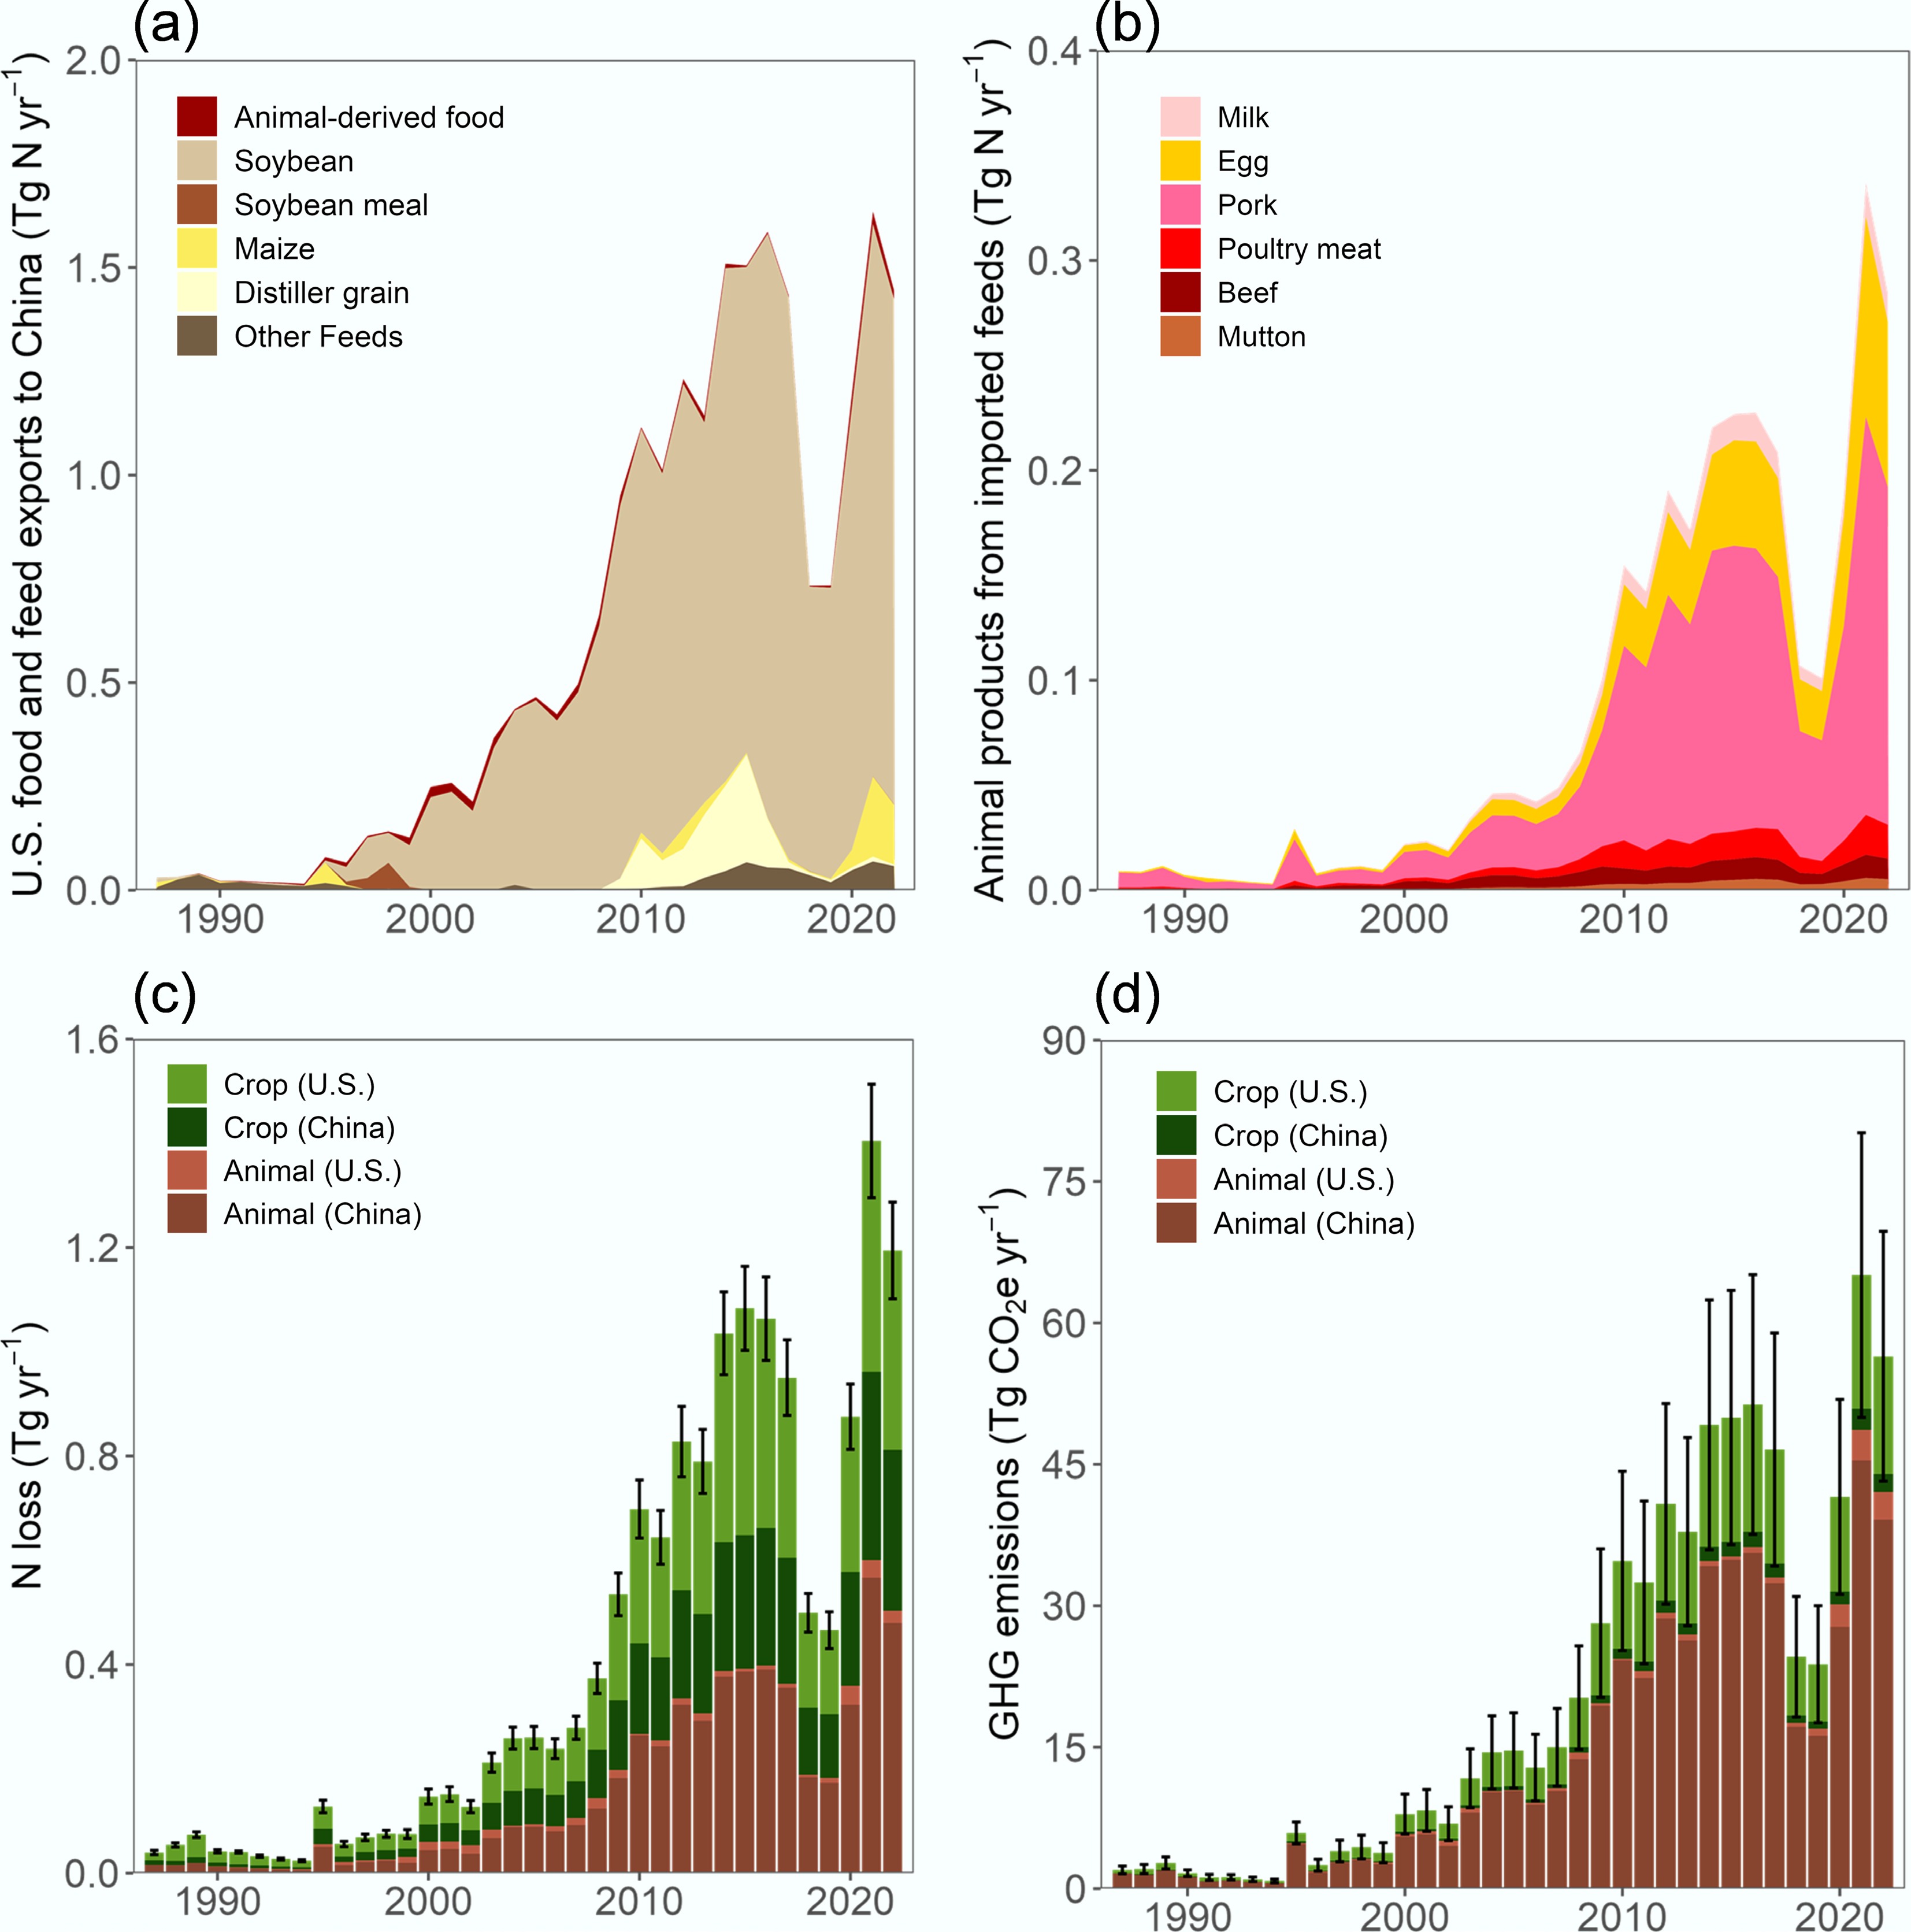
Figure 1.
U.S. exports of feed and food products to China, associated livestock production, and related environmental impacts in the U.S. and China during 1987–2022. (a) N contained in U.S. feed and food exports to China (Tg N yr−1). (b) Animal production in China supported by imported U.S. feed products (Tg N yr−1). (c) N losses (Tg N yr−1) and (d) GHG emissions (Tg CO2e yr−1) associated with crop and livestock production linked to bilateral trade between the two countries.
Trade-related environmental impacts also increased markedly over time. Combined N loss and GHG emissions occurring in both China and the U.S. rose from 0.04 ± 0.004 Tg N and 2.0 ± 0.4 Tg CO2e in 1987 to 1.2 ± 0.1 Tg N and 56.5 ± 13.2 Tg CO2e in 2022 (Fig. 1c, d). N loss associated with bilateral trade occurred predominantly in crop production and was comparable between the two countries (Fig. 1c). Although animal production contributed a smaller share of total N loss relative to crop production, GHG emissions from manure management and enteric fermentation exceeded those from crop production and occurred mainly in China, reflecting the minimal import of animal-derived food products from the U.S. (Fig. 1a, c, and d).
Under current feed production and manure management technologies, shifting trade portfolios between the U.S. and China could improve global supply chain efficiency and reduce environmental impacts, largely due to the higher efficiencies in crop and livestock production in the U.S. Specifically, livestock NUE (feed conversion ratio) is 3%–20% higher in the U.S. than in China, depending on livestock type, thereby reducing the amount of feed N required and associated N loss from feed production (Supplementary Fig. S2b).
In addition, crop NUE in the U.S. is in the range of 2%–30% higher than in China, which could further decrease N loss during crop uptake and N2O emissions from N inputs to produce feed (Supplementary Fig. S2a). Higher livestock NUE in the U.S. also results in lower manure N excretion for the same level of livestock production compared to China. Furthermore, better manure management practices and higher feed quality contribute to lower GHG emission intensity from manure management and enteric fermentation in the U.S. than in China, ranging from 0.6 to 64.8 kg CO2e kg−1 protein depending on livestock type (Supplementary Fig. S3).
Environmental impacts under different trading scenarios
-
The dominance of feed crop-based agricultural trade between the U.S. and China generated substantial environmental impacts in both nations. In 2022, production associated with these traded commodities required 1.8 Tg N of cropland inputs in the U.S. (Fig. 2c), of which 1.2 Tg N originated from biological nitrogen fixation (BNF) associated with soybean cultivation. Overall, the current feed-dominated trade resulted in 1.3 ± 0.1 Tg N loss to the environment, including 0.4 Tg N occurring in the U.S. and 0.9 Tg N in China (Fig. 2c, g). In China, where crop NUE is approximately 50%, about half of the recycled manure N applied to cropland may ultimately be lost into the environment. As a result, 0.3 ± 0.02 Tg N was lost during crop uptake (Fig. 2c). Unrecycled manure led to an additional 0.6 ± 0.1 Tg N loss (Fig. 2c). In contrast, under the restricted trade scenario in which China produces both feed and livestock products domestically, cropland inputs would require an additional 0.5 ± 0.06 Tg N due to lower crop NUE, leading to a 0.6 Tg increase in total N loss (Fig. 2a, g).
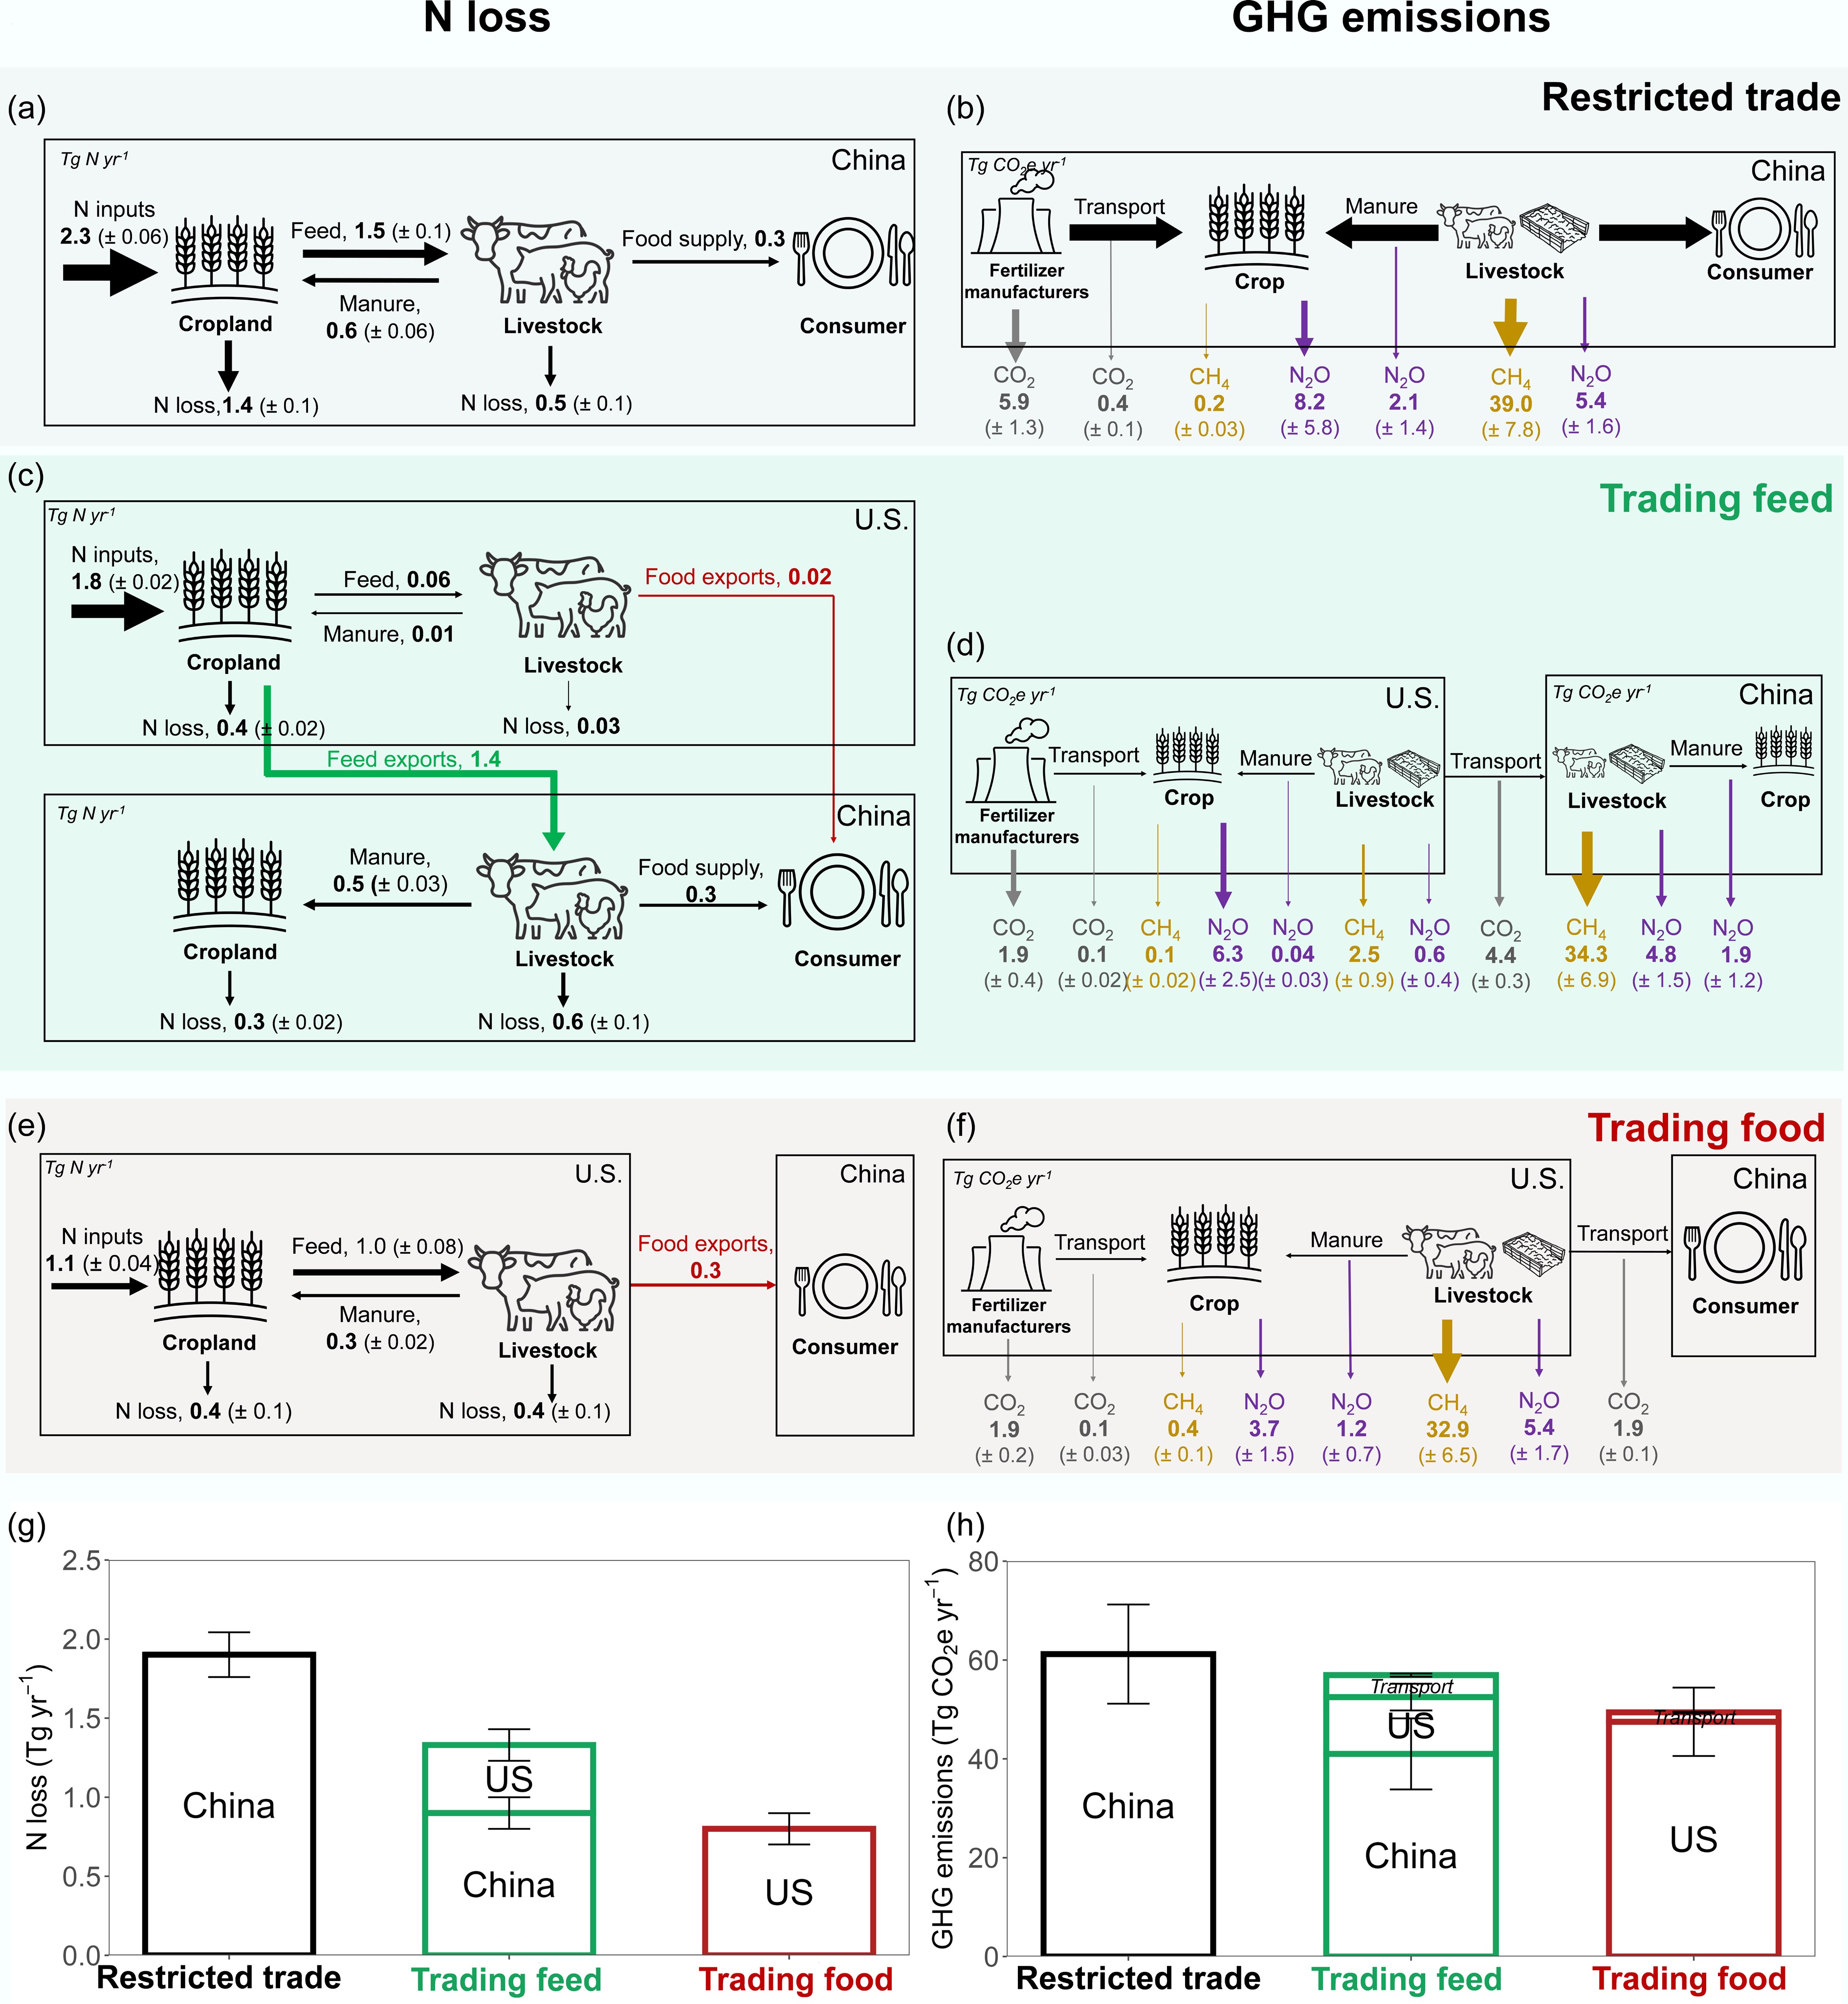
Figure 2.
N losses and GHG emissions associated with crop and livestock production under restricted trade, trading feed, and trading food scenarios between China and the U.S. N flows (Tg N yr−1) from crop and livestock production systems under (a) restricted trade (no feed or food trade between China and the U.S.), (b) trading feed, and (c) trading food scenarios. GHG emissions (Tg CO2e yr−1) from crop and livestock production systems under (d) restricted trade, (e) trading feed, and (f) trading food scenarios. (g), (h) Total global N loss and GHG emissions under the three trade scenarios, separated into contributions from China and the U.S. Transport-related GHG emissions shown in (h) represent emissions generated from international trade between the two countries and are not assigned to either China or the U.S. (c), (e), Red and green flows denote traded food and feed products, respectively. (d), (f), Grey, purple, and brown arrows indicate CO2, N2O, and CH4 emissions (expressed as CO2e using global warming potentials of 273 for N2O and 27 for CH4).
Meanwhile, agricultural production associated with current U.S.–China trade generated an estimated 57 ± 8 Tg CO2e of GHG emissions (Fig. 2d, h). China accounted for the majority of these emissions, contributing 41 ± 7 Tg CO2e, largely driven by livestock production. Among these emissions, enteric fermentation and manure management contributed 39 ± 7 Tg CO2e, while manure application to cropland generated an additional 1.9 ± 1.2 Tg CO2e (Fig. 2d).
Emissions occurring within the U.S. totalled 11.5 ± 2.7 Tg CO2e, including 2 ± 0.4 Tg CO2e from fertilizer manufacturing and transportation, 6.3 ± 2.5 Tg CO2e from agricultural soils, and 3.1 ± 1.0 Tg CO2e from livestock production (Fig. 2d, h). International transportation of traded commodities further contributed 4.4 ± 0.3 Tg CO2e emissions (Fig. 2d, h). Under the restricted trade scenario, greater demand for synthetic fertilizer would produce 3.3 ± 0.7 Tg CO2e more emissions from fertilizer manufacturing and transport compared to trading feed (Fig. 2b, d). Although domestic production would eliminate emissions from international shipping, higher emission intensities associated with manure management and enteric fermentation in China would result in 2.2 ± 0.4 Tg CO2e higher emissions for producing the same amount of animal products imported from the U.S. in 2022 (Fig. 2b, d).
Overall, current trading feed lowers global N loss and GHG emissions by 0.6 ± 0.2 Tg N and 4.3 ± 0.4 Tg CO2e, respectively, compared to the restricted trade scenario (Fig. 2g, h). However, transitioning to trading food instead of feed could further reduce environmental impacts (Fig. 2g, h). Under the trading food scenario, N inputs would decrease from 1.8 ± 0.02 Tg N to 1.1 ± 0.04 Tg N (Fig. 2c, e), driven by both higher manure nutrients recycled for feed crop production and lower overall feed demand. In this scenario, as livestock production is displaced to the U.S., manure used for feed crop production increases from 0.01 to 0.3 Tg N (Fig. 2c, e). In addition, producing 0.3 Tg N of animal products requires 1.5 Tg N of feed in China but only 1.0 Tg N in the U.S., further reducing N inputs (Fig. 2c, e).
Transitioning from trading feed to trading food could further reduce total GHG emissions from the current 57 ± 8 to 48 ± 7 Tg CO2e (Fig. 2h). This reduction results from an increase of 34 ± 5 Tg CO2e in the U.S. and a larger decrease of 41 ± 7 Tg CO2e in China (Fig. 2h). Although livestock-related emissions rise in the U.S. under the trading food scenario, they remain lower than the emissions generated when equivalent livestock production occurs in China under the trading feed system (Fig. 2d, f). In particular, emissions from enteric fermentation and manure management would be reduced by 3.9 ± 0.7 Tg CO2e (Fig. 2d, f). Emissions from N inputs to agricultural soils would also be reduced by 3.3 ± 1.3 Tg CO2e, while CH4 emissions from crop residue burning increase by 0.3 ± 0.08 Tg CO2e because corn residue is burned at a higher rate than soybean residue (Fig. 2d, f). Although refrigerated shipping of animal-derived food products increases the emission intensity of maritime transport, the substantially lower trade volume under the trading food scenario could still reduce transportation-related GHG emissions by 2.5 ± 0.4 Tg CO2e (Fig. 2d, f).
Environmental impacts on the subnational scale
-
Transitioning from feed exports to food exports would, overall, increase environmental pressures within the U.S., although the magnitude of impacts would differ considerably across regions, with some showing reduced environmental impacts (Fig. 3a, b). Under the trading food scenario, livestock products currently supported by U.S. feed exports to China are assumed to be produced directly in the U.S. The resulting increase in livestock production is spatially distributed according to each county's existing contribution to national production. As a result, environmental burdens are concentrated mainly in areas with intensive livestock production, especially regions dominated by pork, beef, and milk production (Fig. 3c, d).
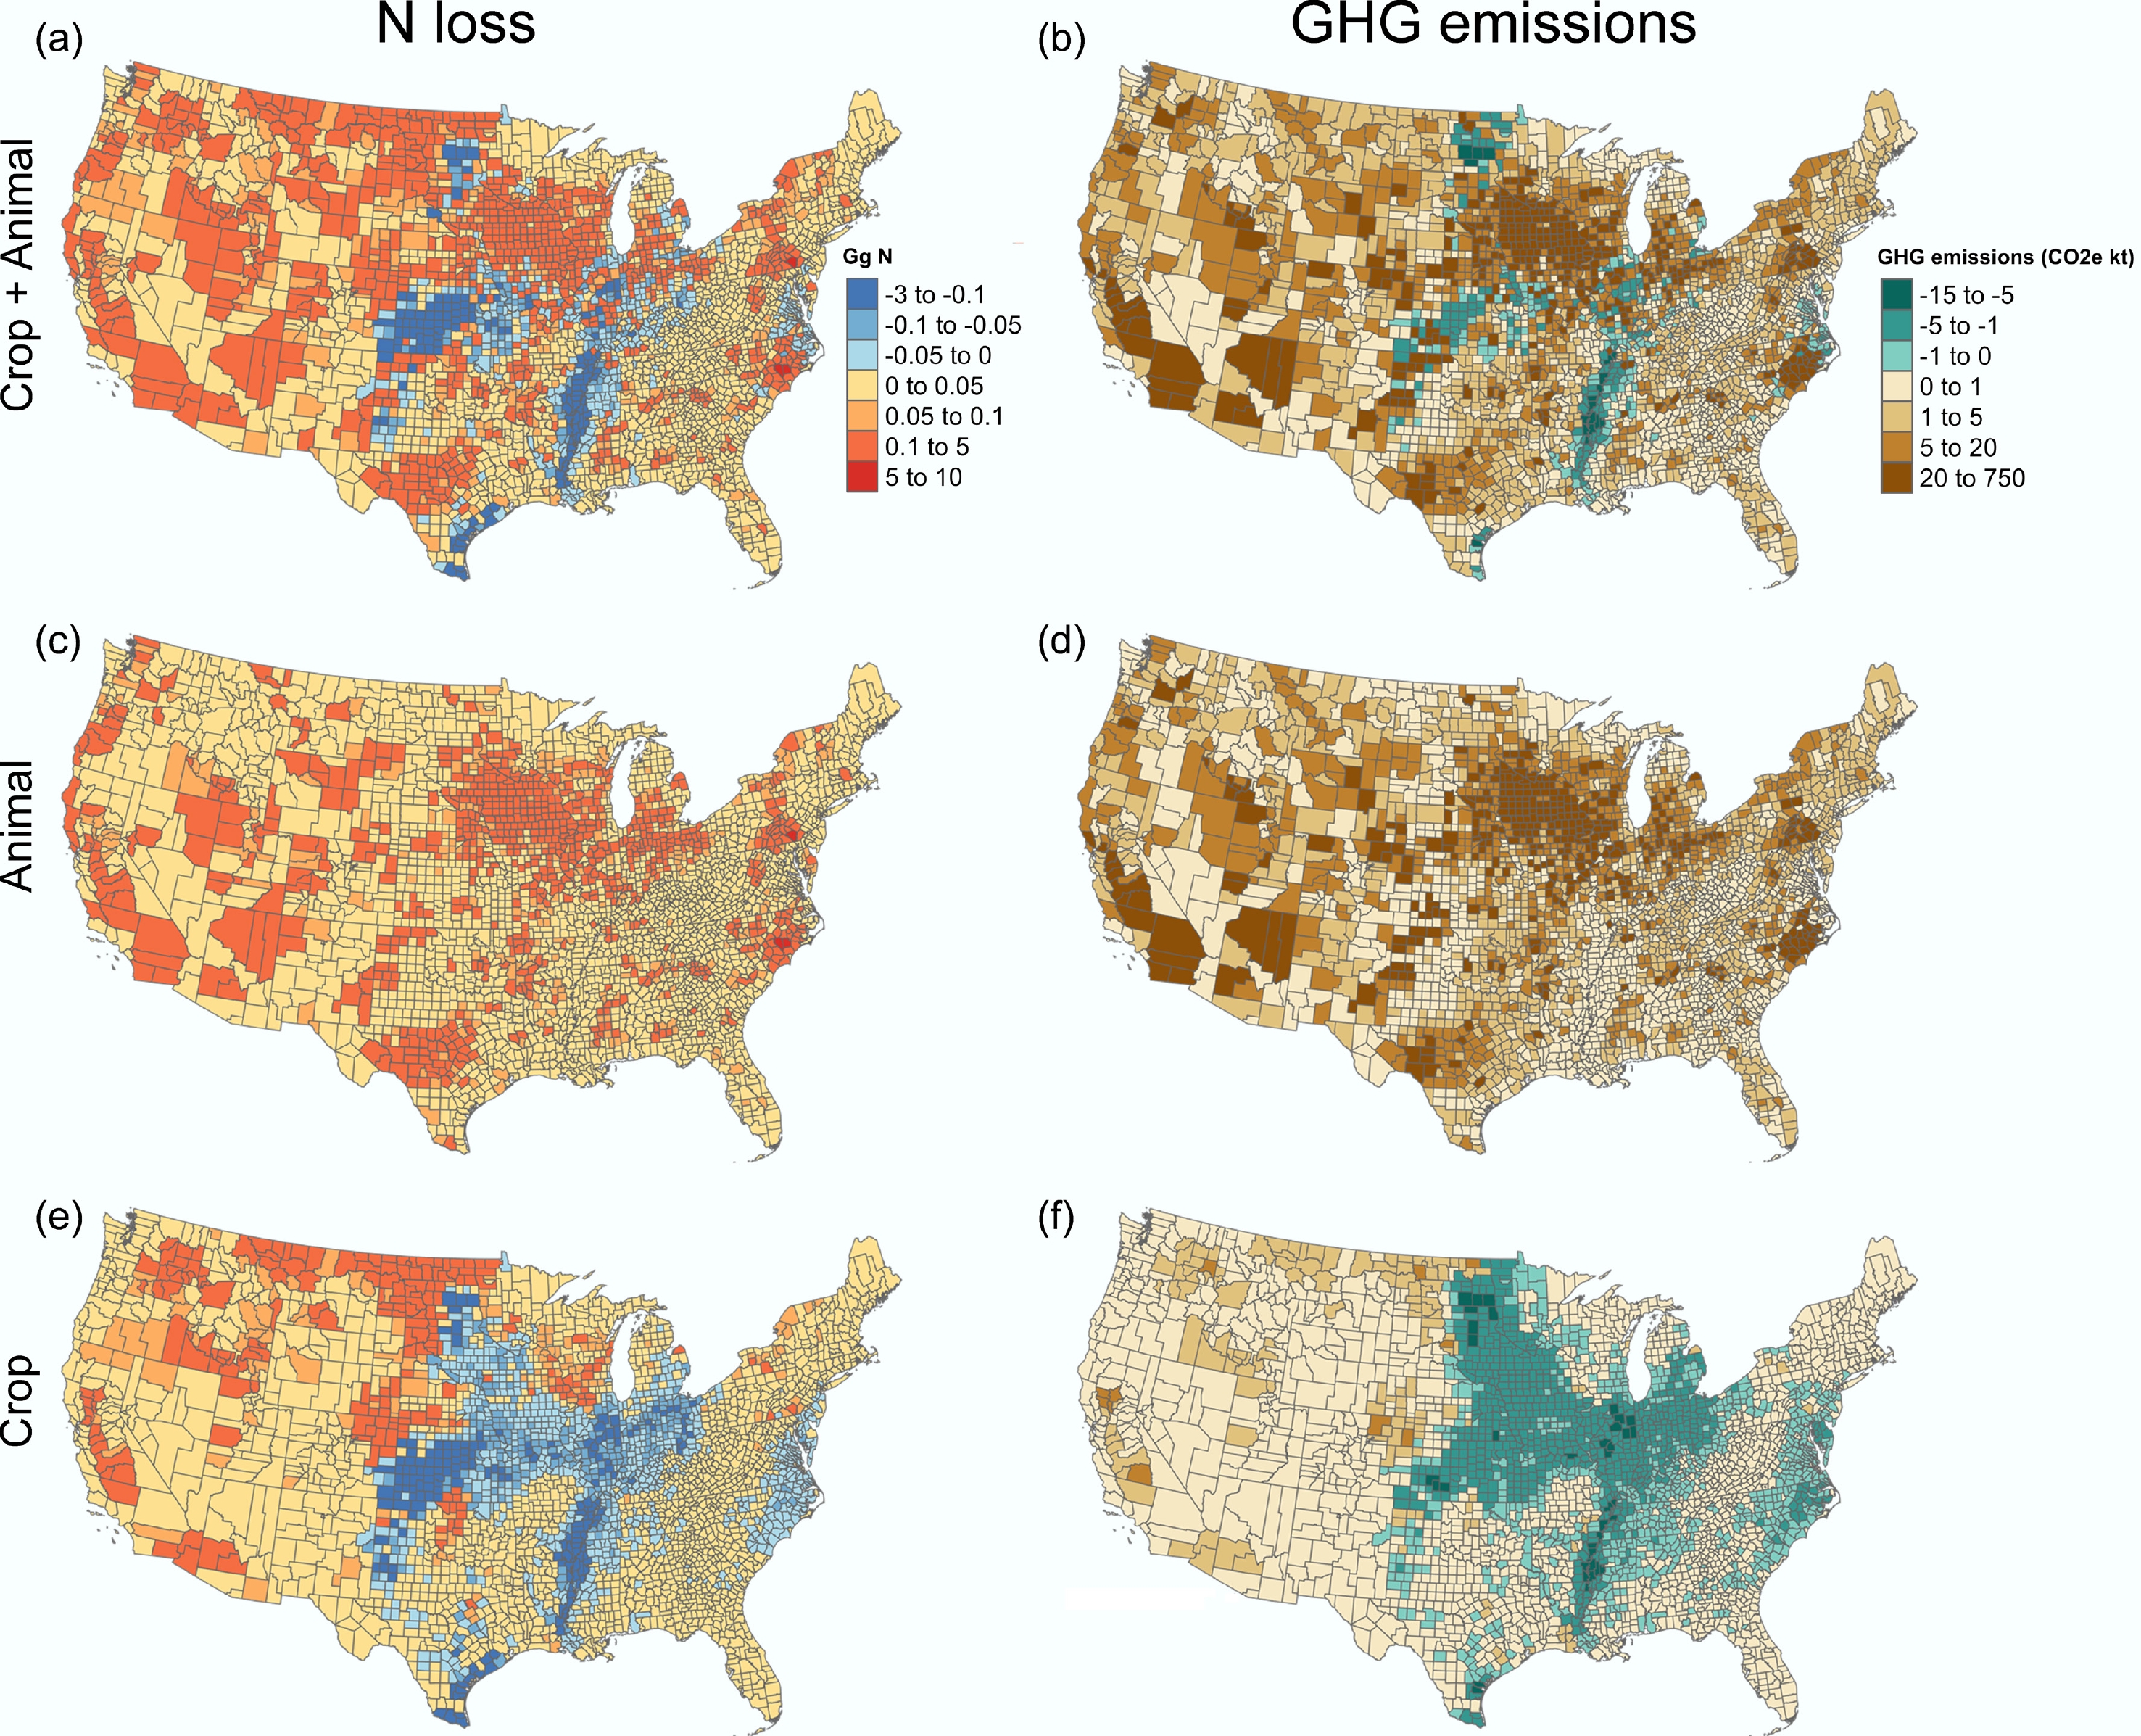
Figure 3.
County-level changes in environmental impacts across the U.S. under a scenario in which the U.S. exports animal-derived food products rather than feed products to China. Changes in N losses (Gg) associated with (a) combined crop and animal production, (c) animal production, and (e) crop production. Changes in GHG emissions (CO2e kt) associated with (b) combined crop and animal production, (d) animal production, and (f) crop production. Values represent differences between the trading food scenario and the current feed-dominant U.S.−China trade scenario used as the baseline.
The projected increase in pork production (161 Gg N) was estimated to raise total US N loss and GHG emissions by more than 445 Gg N and 24 Tg CO2e, with the largest increases occurring in major pork-producing hubs such as Iowa and eastern North Carolina (Fig. 3c, d; Supplementary Figs S4 and S5). Likewise, increased beef (10 Gg N) and milk production (14 Gg N) led to larger environmental impacts in counties with high cattle and dairy herd density, including California, Texas, Oklahoma, Kansas, Montana, Colorado, and Wyoming (Fig. 3c, d; Supplementary Figs S4 and S5). Beef and dairy systems generate more pronounced environmental impacts than pork because of lower feed conversion efficiency (beef: 27% ± 6%; milk: 26% ± 5%) and higher GHG emission intensities (beef: 72 ± 24 kg CO2e kg−1 protein; milk: 28 ± 8 kg CO2e kg−1 protein) relative to pork production (NUE: 32 ± 5%; GHG emission intensity: 19 ± 5 kg CO2e kg−1 protein) (Fig. 3c, d; Supplementary Figs S2 and S3).
In contrast to the broad increases in environmental impacts associated with expanded livestock production, total feed demand declined from 1.4 to 1.0 Tg N, reducing environmental pressures in major feed-producing regions such as the Midwest and the Lower Mississippi River Basin (Fig. 3e, f; Supplementary Fig. S5). The overall decrease in feed requirements primarily reflects the higher livestock NUE in the U.S. compared to China. Nevertheless, these reductions were spatially uneven because livestock feed compositions differ substantially between the two countries, leading to contrasting impacts on feed crop production (Supplementary Fig. S6). Soybean feed plays a larger role in China's livestock sector, whereas corn constitutes the predominant livestock feed in the U.S.[18,21]. (Supplementary Tables S12–S23). In addition, although wheat contributes a relatively small fraction of livestock feed in both countries, its share in U.S. livestock feed is approximately 5% higher than in China. As a result, total soybean feed demand decreases from 1,218 to 359 Gg N, while corn and wheat demand increase from 144 and 3 to 449 and 43 Gg N, respectively. Consequently, in the trading food scenario, counties dominated by soybean production generally experience lower environmental impacts, whereas regions with extensive corn and wheat cultivation tend to show increased impacts.
Economic incentives for trade and portfolio shifts
-
The environmental ramifications arise not only from whether trade occurs, but also from the type of products traded between China and the U.S., and each scenario entails trade-offs with economic consequences. Using the current feed-dominant trade as the baseline, a shift to restricted trade would increase environmental damage costs by US
${\$} $ ${\$} $ ${\$} $ 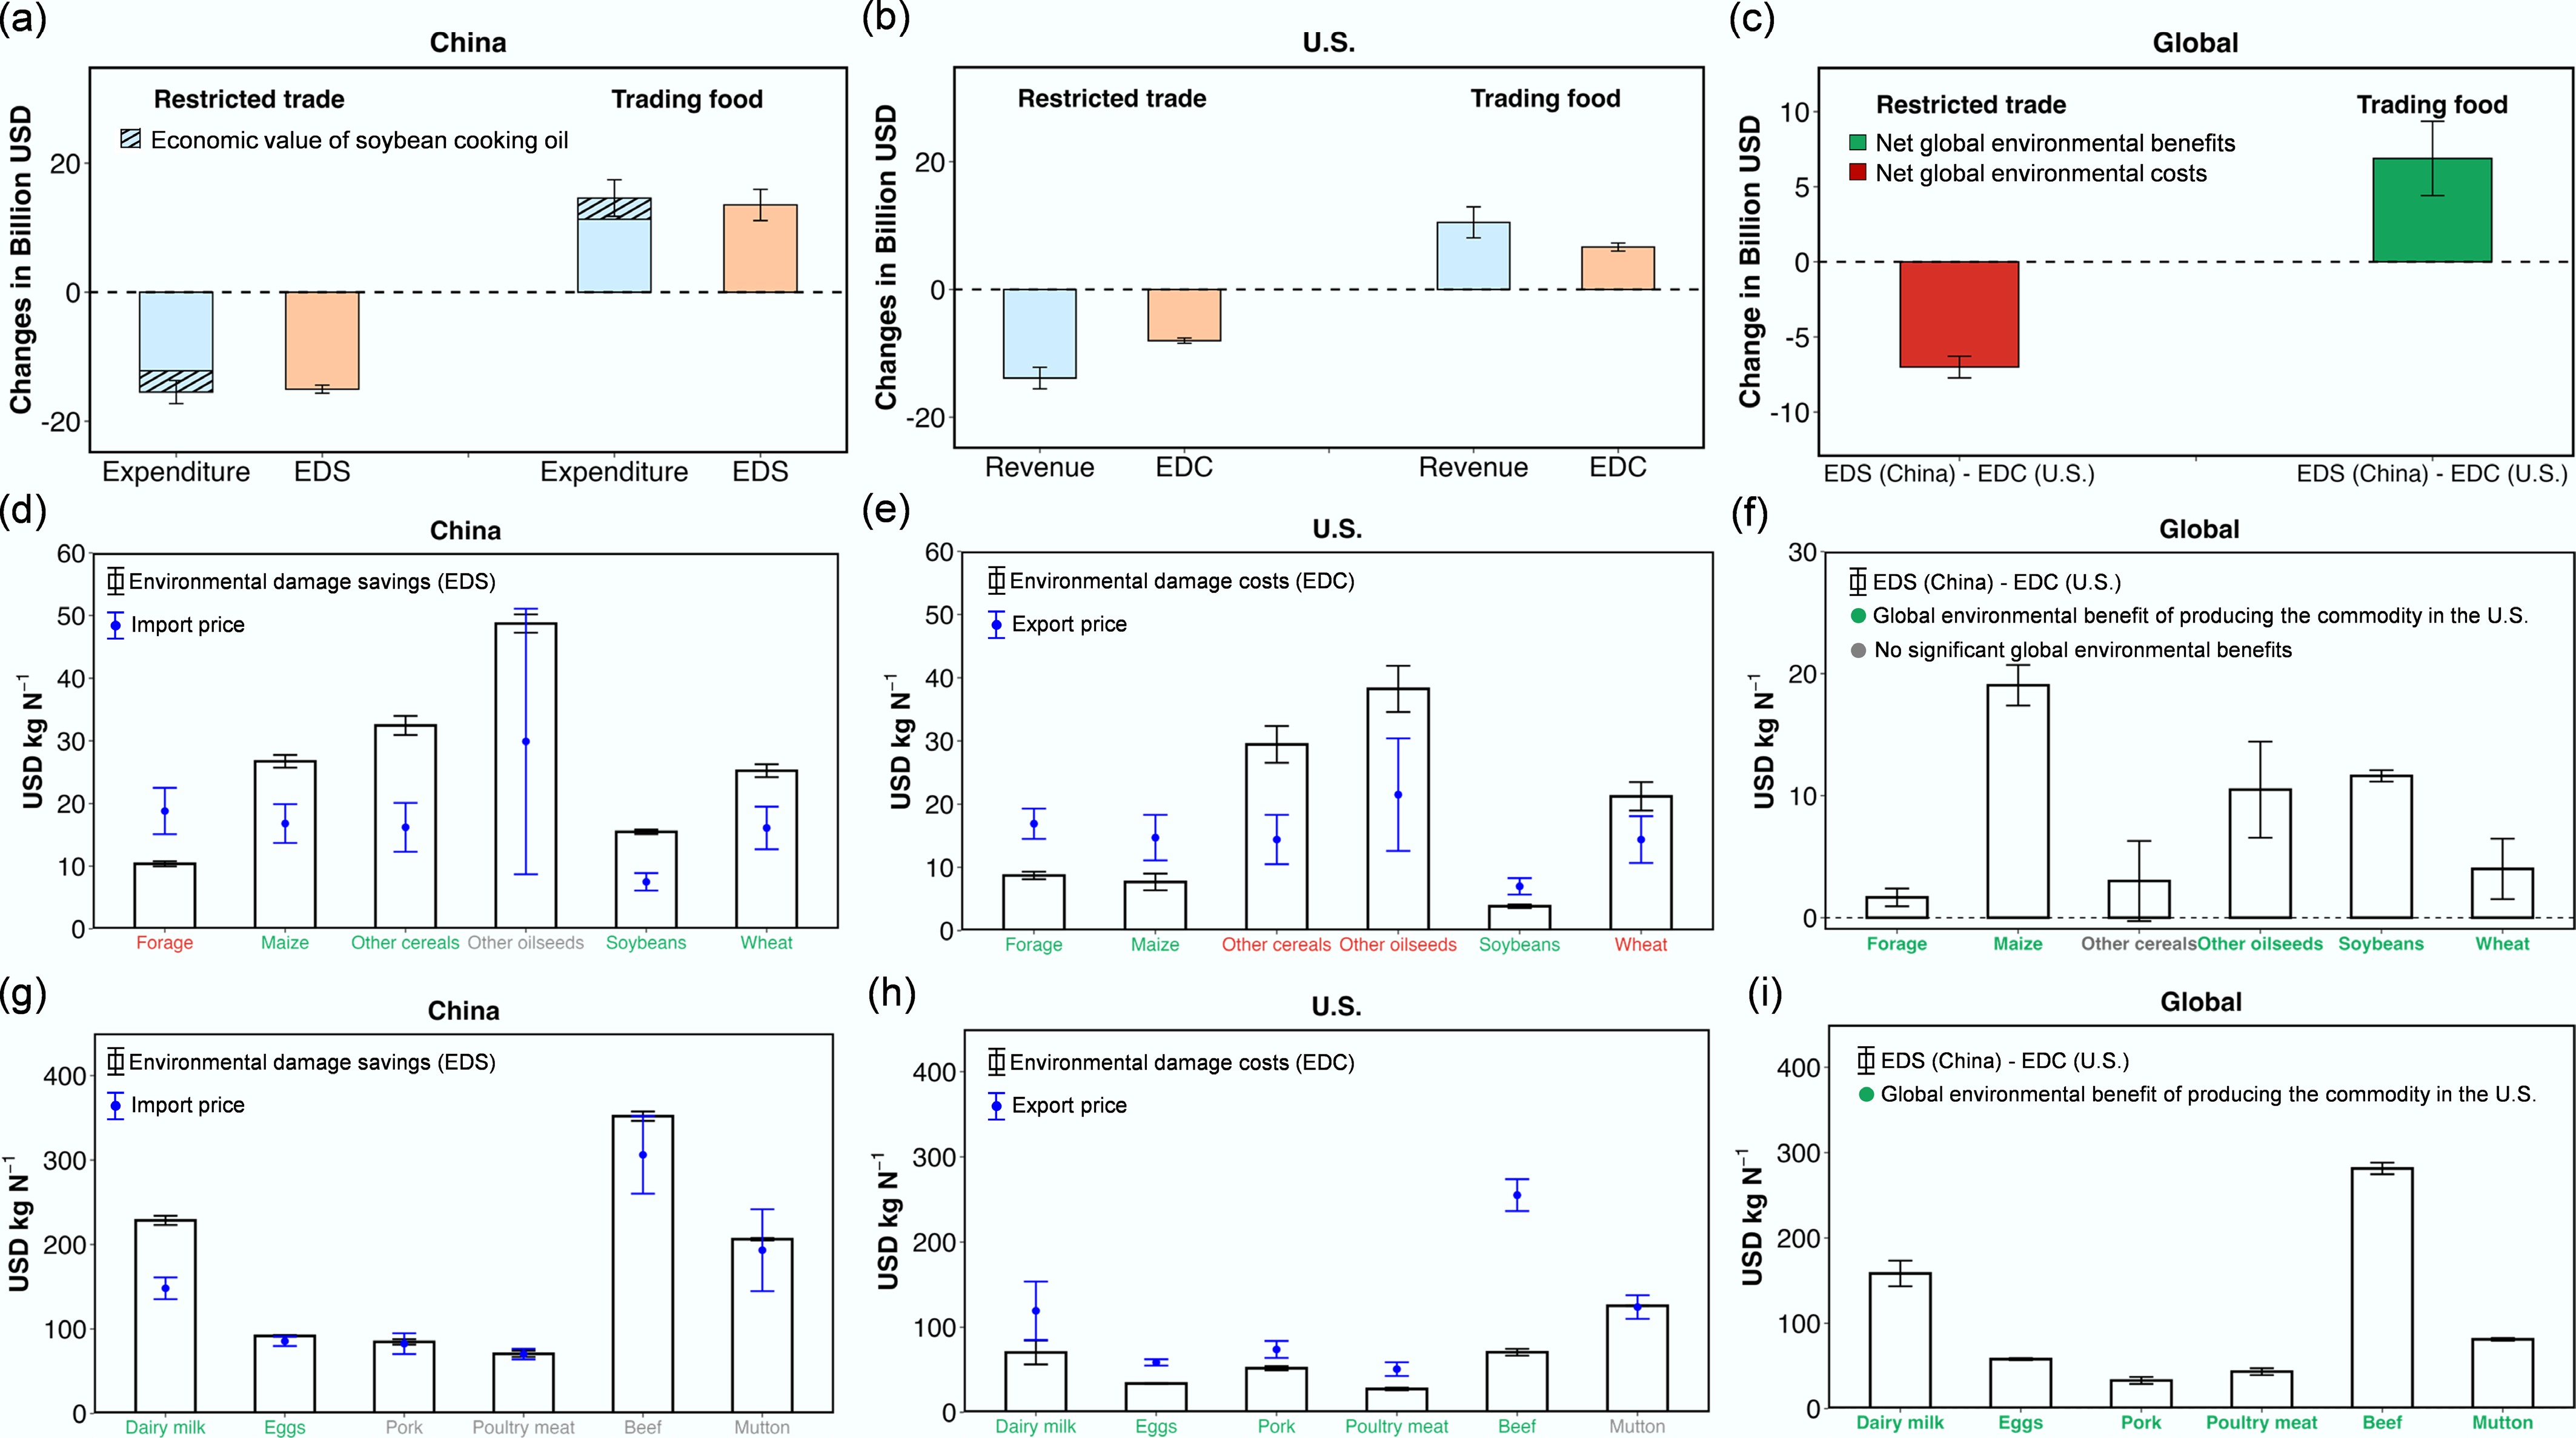
Figure 4.
Changes in monetized environmental and economic impacts under restricted trade and trading food scenarios relative to the current feed-dominant trade scenario (baseline) for China, the U.S., and the global system, including commodity-level comparisons among feed and food products. (a)–(c) Changes in trade-related economic impacts and environmental impacts under restricted trade and trading food scenarios compared with the baseline feed-dominant trade scenario for China, the U.S., and the globe. (d)–(f) Impacts associated with different feed products, while panels (g)–(i) show impacts associated with different food products across China, the U.S., and the globe. All values are expressed in billion US dollars. In panels (d)–(i), products highlighted in green along the x-axis indicate a net benefit at the country or global level. At the country level, a net benefit occurs when import expenditures are lower than environmental damage savings (EDS) in China, or when export revenues exceed environmental damage costs (EDC) in the U.S. At the global scale, a net benefit indicates that EDS in China surpasses EDC in the U.S. Products highlighted in red indicate a net cost, whereas grey denotes no statistically significant net benefit or net cost.
Shifting from trading feed to trading food could increase China's trade expenditure by US
${\$} $ ${\$} $ ${\$} $ ${\$} $ ${\$} $ ${\$} $ ${\$} $ In addition, both economic and environmental impacts differed considerably among the various traded commodities. At the global level, trading food products yields net environmental benefits across all types of animal products, spanning from US
${\$} $ ${\$} $ ${\$} $ Measures for reducing environmental impacts of the trading food scenario
-
Beyond trade portfolio shifts, we also evaluated the mitigation potential of improving nutrient recycling practices in both China and the U.S., along with the associated economic impacts, under the current feed-dominant trade and trading food scenarios. Specifically, we explored three strategies: recovering N from plant-based human food waste (FW), increasing manure recycling (IMR), and implementing a combination of both (FW + IMR).
In the FW scenario, recovering plant-based human food waste for animal feed could substitute 0.1 and 0.8 Tg N of feed grain in the U.S. and China, respectively (Fig. 5a, b). This substitution could reduce cropland N input by 56% and 20% and N loss from feed production by 37.5% and 10%, respectively, relative to the Business-As-Usual (BAU) trading feed and trading food scenarios (Fig. 5a, b). These reductions corresponded to the estimated cost savings of US
${\$} $ ${\$} $ ${\$} $ ${\$} $ 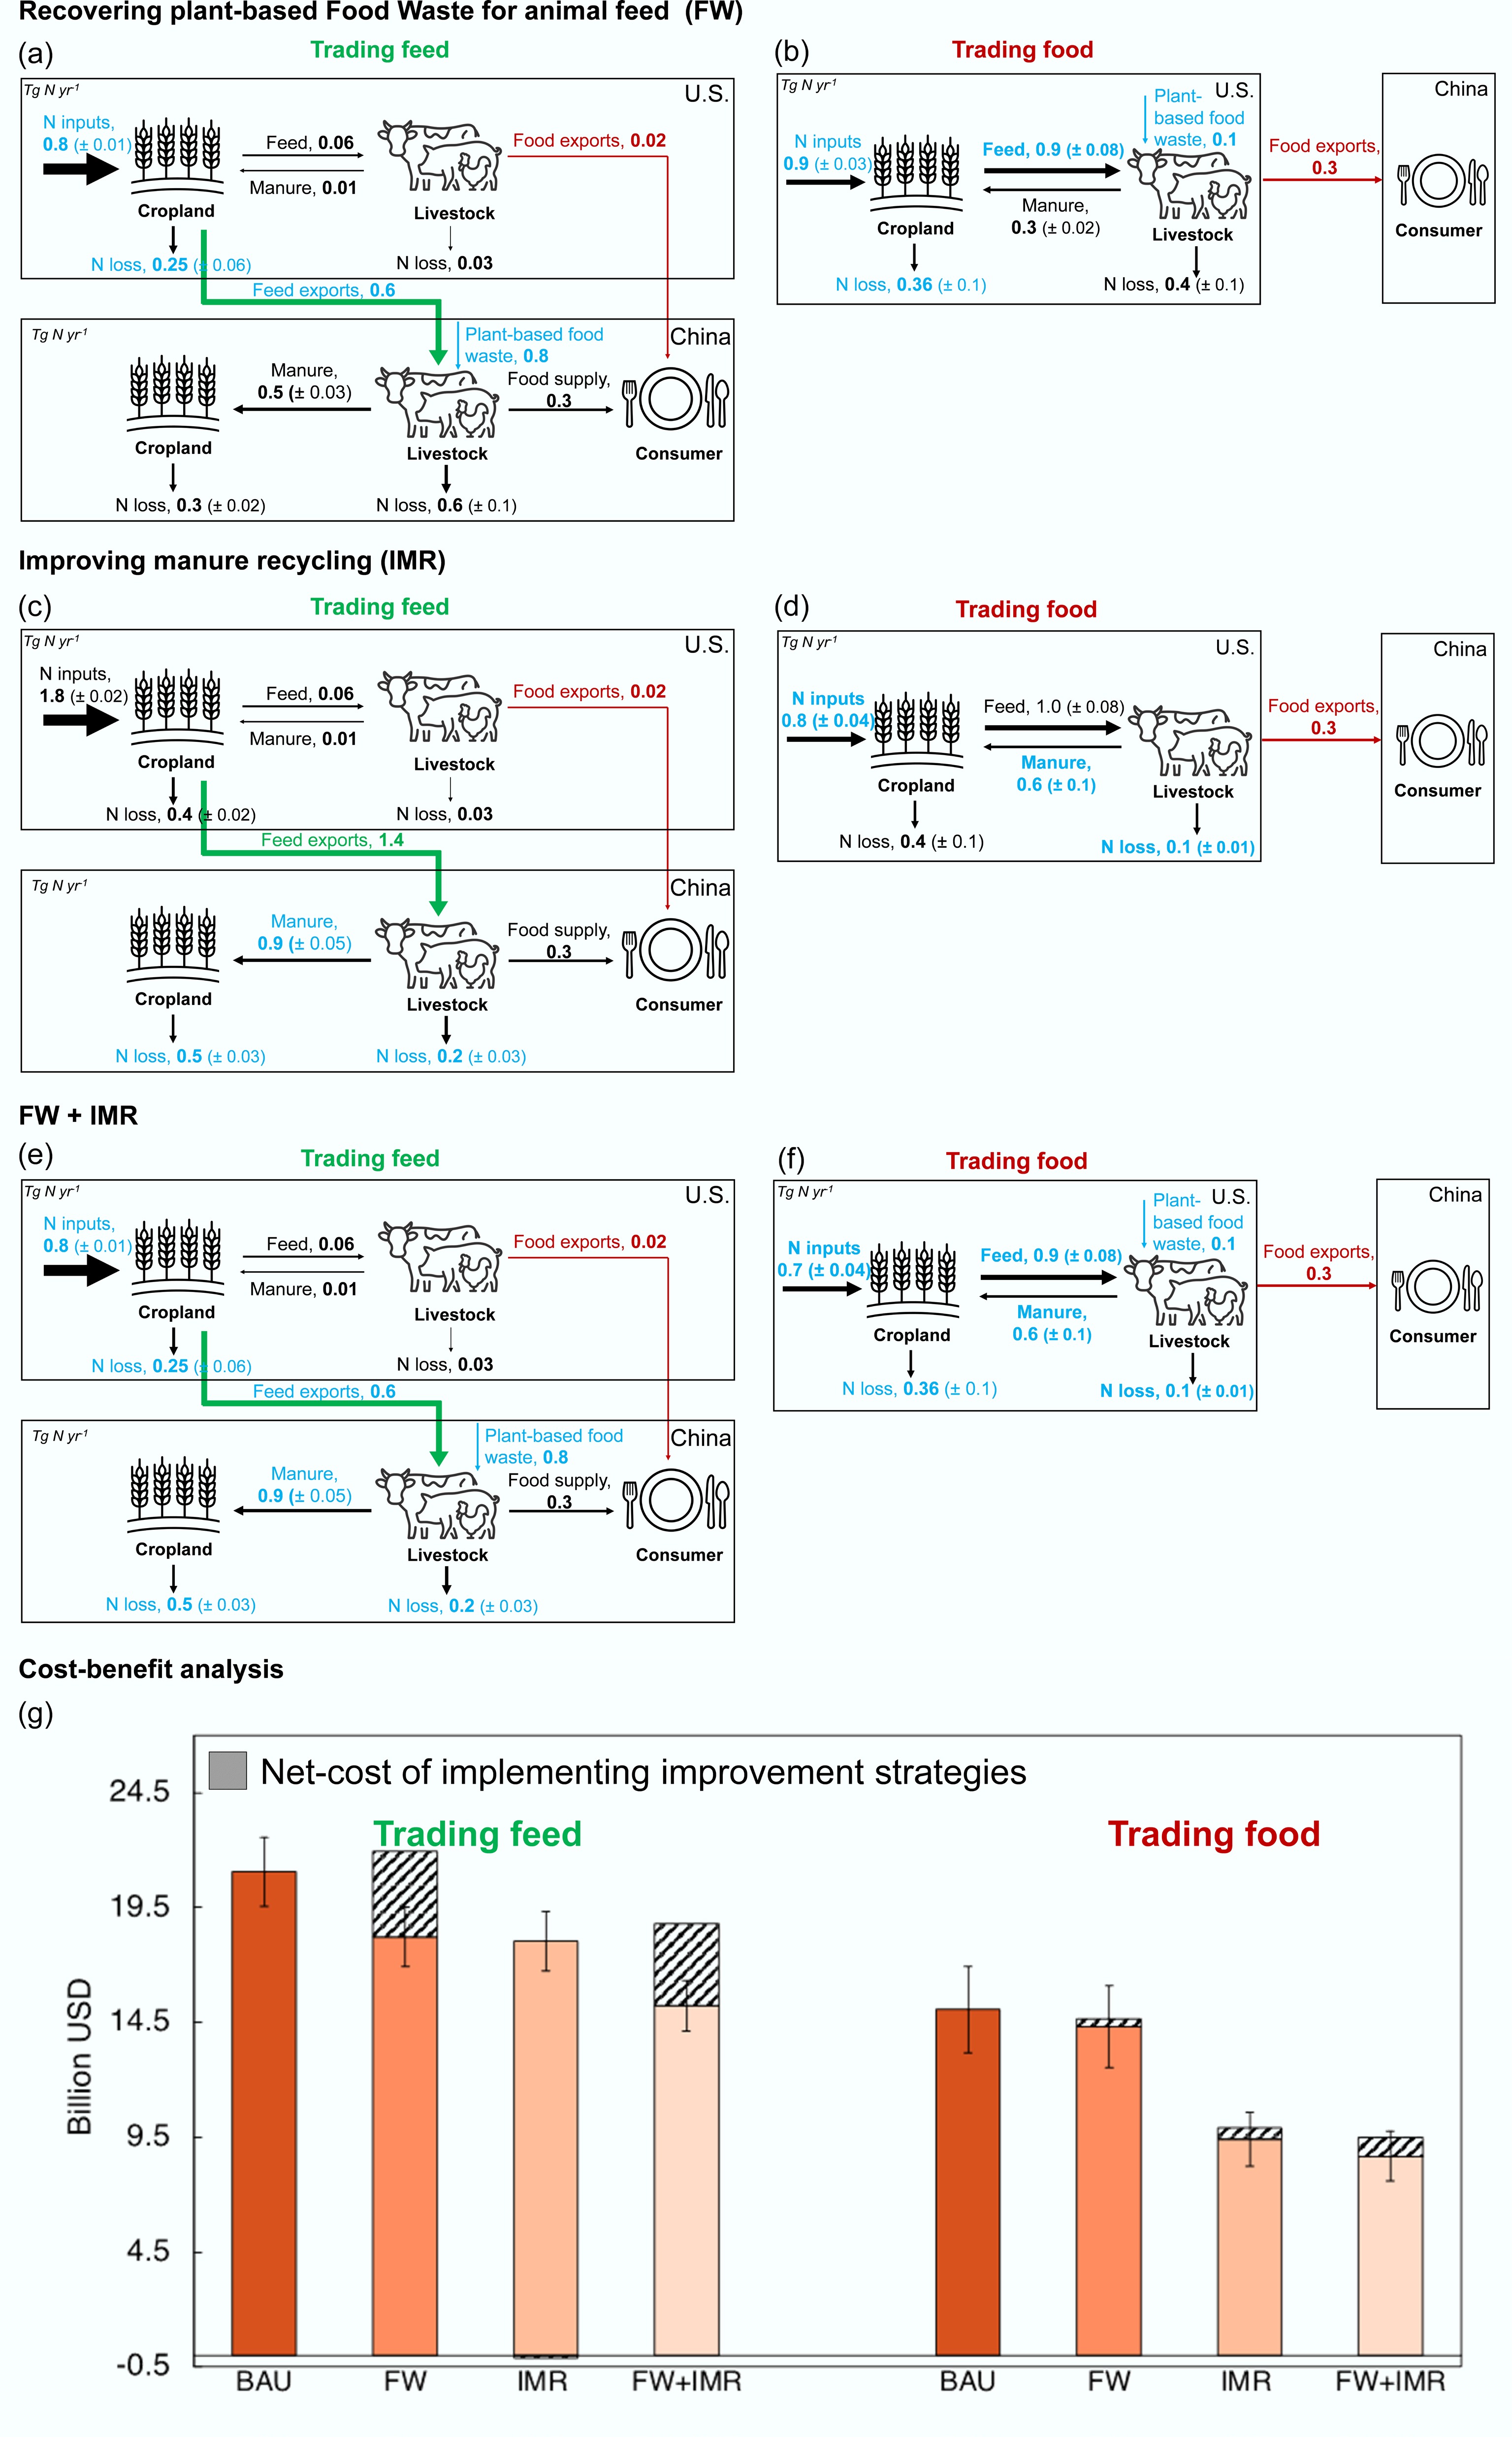
Figure 5.
Impacts of improved management strategies on N loss and associated environmental damage costs (EDC) in China and the U.S. under trading feed and trading food scenarios. N flows (Tg N yr−1) within crop and livestock production systems are illustrated for (a), (b) recovering N from plant-based human food waste as animal feed (FW); (c), (d) increasing manure recycling (IMR); and (e), (f) the combined application of FW and IMR, each assessed under trading feed and trading food scenarios. N flows influenced by improvement strategies are highlighted in blue. (g) Comparison of the environmental damage costs (billion USD) under the business-as-usual (BAU) and improved nutrient recycling strategies (FW, IMR, and FW + IMR) for the trading feed and trading food scenarios. Net costs were calculated by considering changes in environmental damage costs associated with N loss and implementation costs, while accounting for the economic value of recovered nutrients.
In the IMR scenario, we assumed an 80% manure recovery rate based on government guidance targeting 80% manure utilization by 2025[50]. Combined with future advances in technologies and policy changes, this could enable the additional recovery of 0.4 and 0.3 Tg N of manure in China and the U.S., respectively (Fig. 5c, d). The resulting reduction in manure N loss could decrease environmental damage costs by US
${\$} $ ${\$} $ ${\$} $ ${\$} $ The combined FW and IMR approach could reduce N loss from crop and livestock production by 26% and 43% under the trading feed and food scenarios, respectively (Fig. 5e, f). Although these strategies demonstrate substantial mitigation potential in China, EDC remained the lowest (US
${\$} $ -
Historically, trade policies between nations have been shaped primarily by economic priorities and geopolitical relationships. Our study quantitatively assesses how shifts in trade portfolios involving both crop and livestock commodities affect environmental and economic outcomes in bilateral agricultural trade between China and the U.S. Specifically, we found that the current feed-dominant trade between China and the U.S. already provides environmental benefits and that even greater benefits could be achieved if more animal-derived food products were traded. Meanwhile, the trading food scenario brings crop and livestock production systems spatially closer, increasing the potential for manure nutrient recycling. Under the current trading feed scenario, recycled manure contributes only about 0.01 Tg N to the 1.8 Tg N cropland inputs associated with traded products, compared with 0.3 Tg N out of 1.4 Tg N under the trading food scenario. Our intention is not to advocate for expanding animal product exports from the U.S. to China, but rather to quantify the potential economic and environmental implications for both countries and the global environment if such a transition were to occur. Our findings are broadly consistent with previous studies showing that agricultural trade can mitigate global environmental impacts by reallocating production to regions with higher production efficiency. Previous studies estimated that N loss associated with producing these exports in the U.S. were about 0.3 Tg N in 2010 and 0.5 Tg N in 2015[9], while corresponding on-farm GHG emissions were estimated at 33–46 Tg CO2e yr−1[8], comparable to the magnitudes estimated in this study. Meanwhile, this study advances previous analysis by explicitly incorporating N use dynamics across interconnected crop and livestock systems in both countries.
Facilitating shifts in agricultural trade portfolios between the two countries presents both opportunities and challenges. First, in terms of political dynamics, as China has emerged as the world's second-largest economy after the U.S., strategic competition between the two nations has intensified. From China's perspective, strengthening food self-sufficiency and reducing dependence on U.S. food supplies are important national priorities. However, achieving self-sufficiency in animal-derived food production remains under development due to substantial financial investment and structural transformation required within the grain industry[59−61]. Meanwhile, given that animal production supported by current U.S. feed imports accounts for 10% of animal-derived food consumption in China[17], maintaining agricultural trade at current levels is unlikely to pose substantial risks to China's food system resilience. In fact, a shift from feed to food imports could provide additional advantages. Such a transition could free up land for staple crop production, reduce NH3 emissions from livestock operations, improve air quality, and reinforce staple crop production, all of which align with government objectives[62,63]. However, these land-use changes could also unintentionally lower food and land prices and stimulate feed crop and livestock production. These potential risks may be mitigated through targeted policy measures designed to prevent unintended consequences.
Second, such trade shifts also face food safety concerns and strong consumer preferences for fresh rather than frozen meat. Addressing these challenges will be important for enabling such a trade transition while maintaining China's food culture and safety standards. For instance, greater investment in cold chain infrastructure could increase consumer acceptance of frozen and prepackaged food products, thereby supporting future growth in food imports[63]. In addition, improving the transparency, consistency, and stability of China's food safety regulations and enforcement, particularly for consumer-oriented food imports, could help alleviate exporters' concerns and foster more stable long-term trade relations[64]. The feasibility and social acceptability of such changes, particularly with respect to rural employment, remain uncertain.
Third, potential increases in environmental impacts within the U.S. may present important barriers to transitioning toward greater animal-derived food trade. We estimated that N loss and GHG emissions will increase by 0.4 ± 0.1 Tg N and 34 ± 5 Tg CO2e under the trading food scenario compared with the current trading feed scenario. However, strategies such as utilizing plant-based human food waste as animal feed and enhancing livestock manure recycling could substantially offset these increases, resulting in N losses comparable to those under the current trading feed scenario (Supplementary Fig. S7). Despite their mitigation potential, implementing these strategies may face practical challenges[25,42]. For example, using recovered food waste in animal feed is constrained by food safety concerns, although studies suggest these risks can be mitigated through heat treatment and regulatory oversight[65]. Similarly, increasing manure recycling requires improved manure management technologies and stronger coordination between geographically separated animal and crop production systems[25]. Future studies should further evaluate the feasibility and cost–benefits of these nutrient recycling practices by considering regulatory environments, infrastructure requirements, farmer adoption costs, and broader socio-economic impacts. At the same time, engaging stakeholders across the entire agri-food supply chain is essential for developing effective strategies that promote and support the adoption of nutrient recycling practices.
Overall, maintaining and optimizing agricultural trade between the U.S. and China is important not only for the two countries but also for global food system sustainability. Future studies are needed to better understand how cultural, political, and economic constraints may affect the feasibility of alternative agricultural trade configurations and the policy mechanisms required to support them. Nevertheless, the methodology developed in this study could also be applied to assess the impacts of a partial transition in trade portfolios. We have provided the 'usertool' spreadsheet in the Supplementary Information, allowing readers to explore and run customized partial transition scenarios. Facilitating this transition while minimizing environmental impacts will require stronger dialogue and cooperation among China, the U.S., and other major trading partners. For example, trade-related revenues could support joint technological innovation and collaborative research and development, generating mutual environmental and economic benefits while promoting more efficient cross-border resource use and reducing environmental burdens along global supply chains.
-
This study focuses exclusively on a hypothetical scenario in which U.S.–China feed trade in 2022 is replaced by trade in animal products. We recognize that China's future import potential is shaped by multiple factors. For example, the implementation of the Phase One Trade Agreement contributed to record-high U.S. exports to China in recent years[10], including the removal of several restrictions on beef and pork imports[58]. However, the volatile nature of the U.S.–China trade relationship and China's continued investment in domestic pork production capacity[60] may influence future trade dynamics. While evaluating the impacts of these developments is beyond the scope of this study, the methodological framework presented here could support future analyses.
In addition to assessing environmental impacts, we also estimated the economic outcomes of trade. For trade-related economic impacts, we assumed constant average import and export prices based on historical trade records and did not explicitly account for market feedback. Shifting from feed to food trade could induce price adjustments, market saturation effects, and broader general equilibrium responses in both domestic and global markets. Nevertheless, the additional animal product exports estimated in this study represent only around 1.3% of the total global animal product market[66], suggesting that overall market impacts may remain limited, although responses could still vary among commodities depending on differences in market structure and demand elasticity. Future work incorporating partial or general equilibrium models would help quantify these market-mediated effects more comprehensively. In addition, we estimated monetized environmental impacts from N loss to enable comparison with trade-related economic outcomes. However, these estimates are subject to uncertainties and do not fully capture all costs and benefits associated with such a trade shift.
Environmental damage costs from N loss were estimated using Gross National Income (GNI) per capita in 2020 to reflect differences in economic and social development between countries[37]. As economic conditions evolve, the implications of U.S.–China trade impacts may change. Transitioning toward food trade could also increase costs in the U.S. due to higher labor, energy, and machinery requirements, as well as the need for additional investment in livestock production facilities. In contrast, such a shift could adversely affect employment in China's livestock sector. Furthermore, GHG emissions were not monetized in the present analysis, and potential increases in energy demand associated with cold chain transportation under food trade scenarios were also not considered. For China, in addition to lower environmental damage costs from reduced N loss, trading food may also generate other benefits, such as avoided land-use change, reduced biodiversity loss, and lower water consumption. Although these impacts are beyond the scope of this analysis, they represent important areas for future research.
The county-level assessment relies on the 2017 census of agriculture to represent the geographic distribution of crop and livestock production[34], with the assumption that increases in feed and food production under the trading food scenario would follow existing production patterns. The spatial heterogeneity observed across counties likely reflects a combination of socioeconomic, biophysical, infrastructural, and policy factors that shape the distribution and intensity of crop and livestock production. For example, livestock operations tend to concentrate in regions with abundant feed availability (e.g., corn and soybean production), well-developed transportation infrastructure, and proximity to major markets. Meanwhile, environmental conditions such as water and land availability, and economic factors including land and energy costs, may also influence the spatial distribution of production[67−70]. Future studies should further investigate how these factors shape the spatial distribution of crop and livestock production and how these insights can guide spatial planning strategies to further reduce environmental impacts.
-
Evaluating the environmental and economic outcomes of agricultural trade between China and the U.S. suggests that existing feed-dominant trade avoids global N loss by 0.6 ± 0.2 Tg (corresponding to environmental damage costs around US
${\$} $ -
It accompanies this paper at: https://doi.org/10.48130/nc-0026-0011.
-
Not applicable.
-
The authors confirm their contributions to the paper as follows: Yanyu Wang: study conception and design, data collection, data analysis, and manuscript drafting and editing; Baojing Gu: interpretation of results and manuscript review and editing; Xin Zhang: study conception and design, supervision, and manuscript review and editing. All authors contributed to the interpretation of the results and approved the final version of the manuscript.
-
Data supporting the findings of this study are available within the article and its Supplementary Information files. Source data are provided with this paper. In addition, we provide a spreadsheet-based tool (https://github.com/yanyu0729/trade-portfolio-tool) that allows users to adjust parameters such as feed quantities, animal and crop NUE, and manure recycling rates to assess the environmental impacts of partial transitions in trade portfolios.
-
This paper was supported by the project 'INFEWS: U.S.−China: Managing agricultural nitrogen to achieve sustainable Food-Energy-Water Nexus in China and the U.S.,' jointly funded by the U.S. National Science Foundation (Grant No. CBET-2025826) and the National Natural Science Foundation of China (Grant No. 42061124001). Zhang was also supported by the U.S. National Science Foundation (Grant Nos. OISE-2330502 and CBET-2047165).
-
The authors declare that they have no conflict of interest.
-
Full list of author information is available at the end of the article.
- The supplementary files can be downloaded from here.
- Copyright: © 2026 by the author(s). Published by Maximum Academic Press, Fayetteville, GA. This article is an open access article distributed under Creative Commons Attribution License (CC BY 4.0), visit https://creativecommons.org/licenses/by/4.0/.
-
About this article
Cite this article
Wang Y, Gu B, Zhang X. 2026. Shifting U.S.−China trade from feed to food reduces global agricultural nitrogen loss and greenhouse gas emissions. Nitrogen Cycling 2: e024 doi: 10.48130/nc-0026-0011 

Shifting U.S.−China trade from feed to food reduces global agricultural nitrogen loss and greenhouse gas emissions
- Received: 12 February 2026
- Revised: 19 May 2026
- Accepted: 14 June 2026
- Published online: 27 July 2026
Abstract: Current U.S.–China agricultural trade is dominated by U.S. exports of feed crops to support China's livestock production. While economically beneficial, this trade pattern also has important environmental implications. Using counterfactual scenario analysis, we show that the current feed trade helps to reduce global nitrogen (N) loss, greenhouse gas (GHG) emissions, and environmental damage costs (EDC) by 32%, 7%, and 26%, respectively, compared with producing the same feed entirely within China. However, more than 40% of the N in imported feed is lost as manure in China, exacerbating domestic N pollution. Shifting from trading feed to food between China and the U.S. could further reduce global N loss, GHG emissions, and EDC by 38%, 17%, and 32%, respectively, while boosting U.S. agricultural trade revenue by US${\$} $10.5 ± 2.4 billion. Although this shift may increase environmental impacts in the U.S., it could enable better coupling between crop and livestock production; moreover, with food waste recycling and improved manure management, these impacts could be reduced to levels comparable to the current situation. These findings highlight how optimizing agricultural trade portfolios while deploying mitigation strategies can strengthen economic benefits alongside environmental sustainability in global agricultural trade.