-
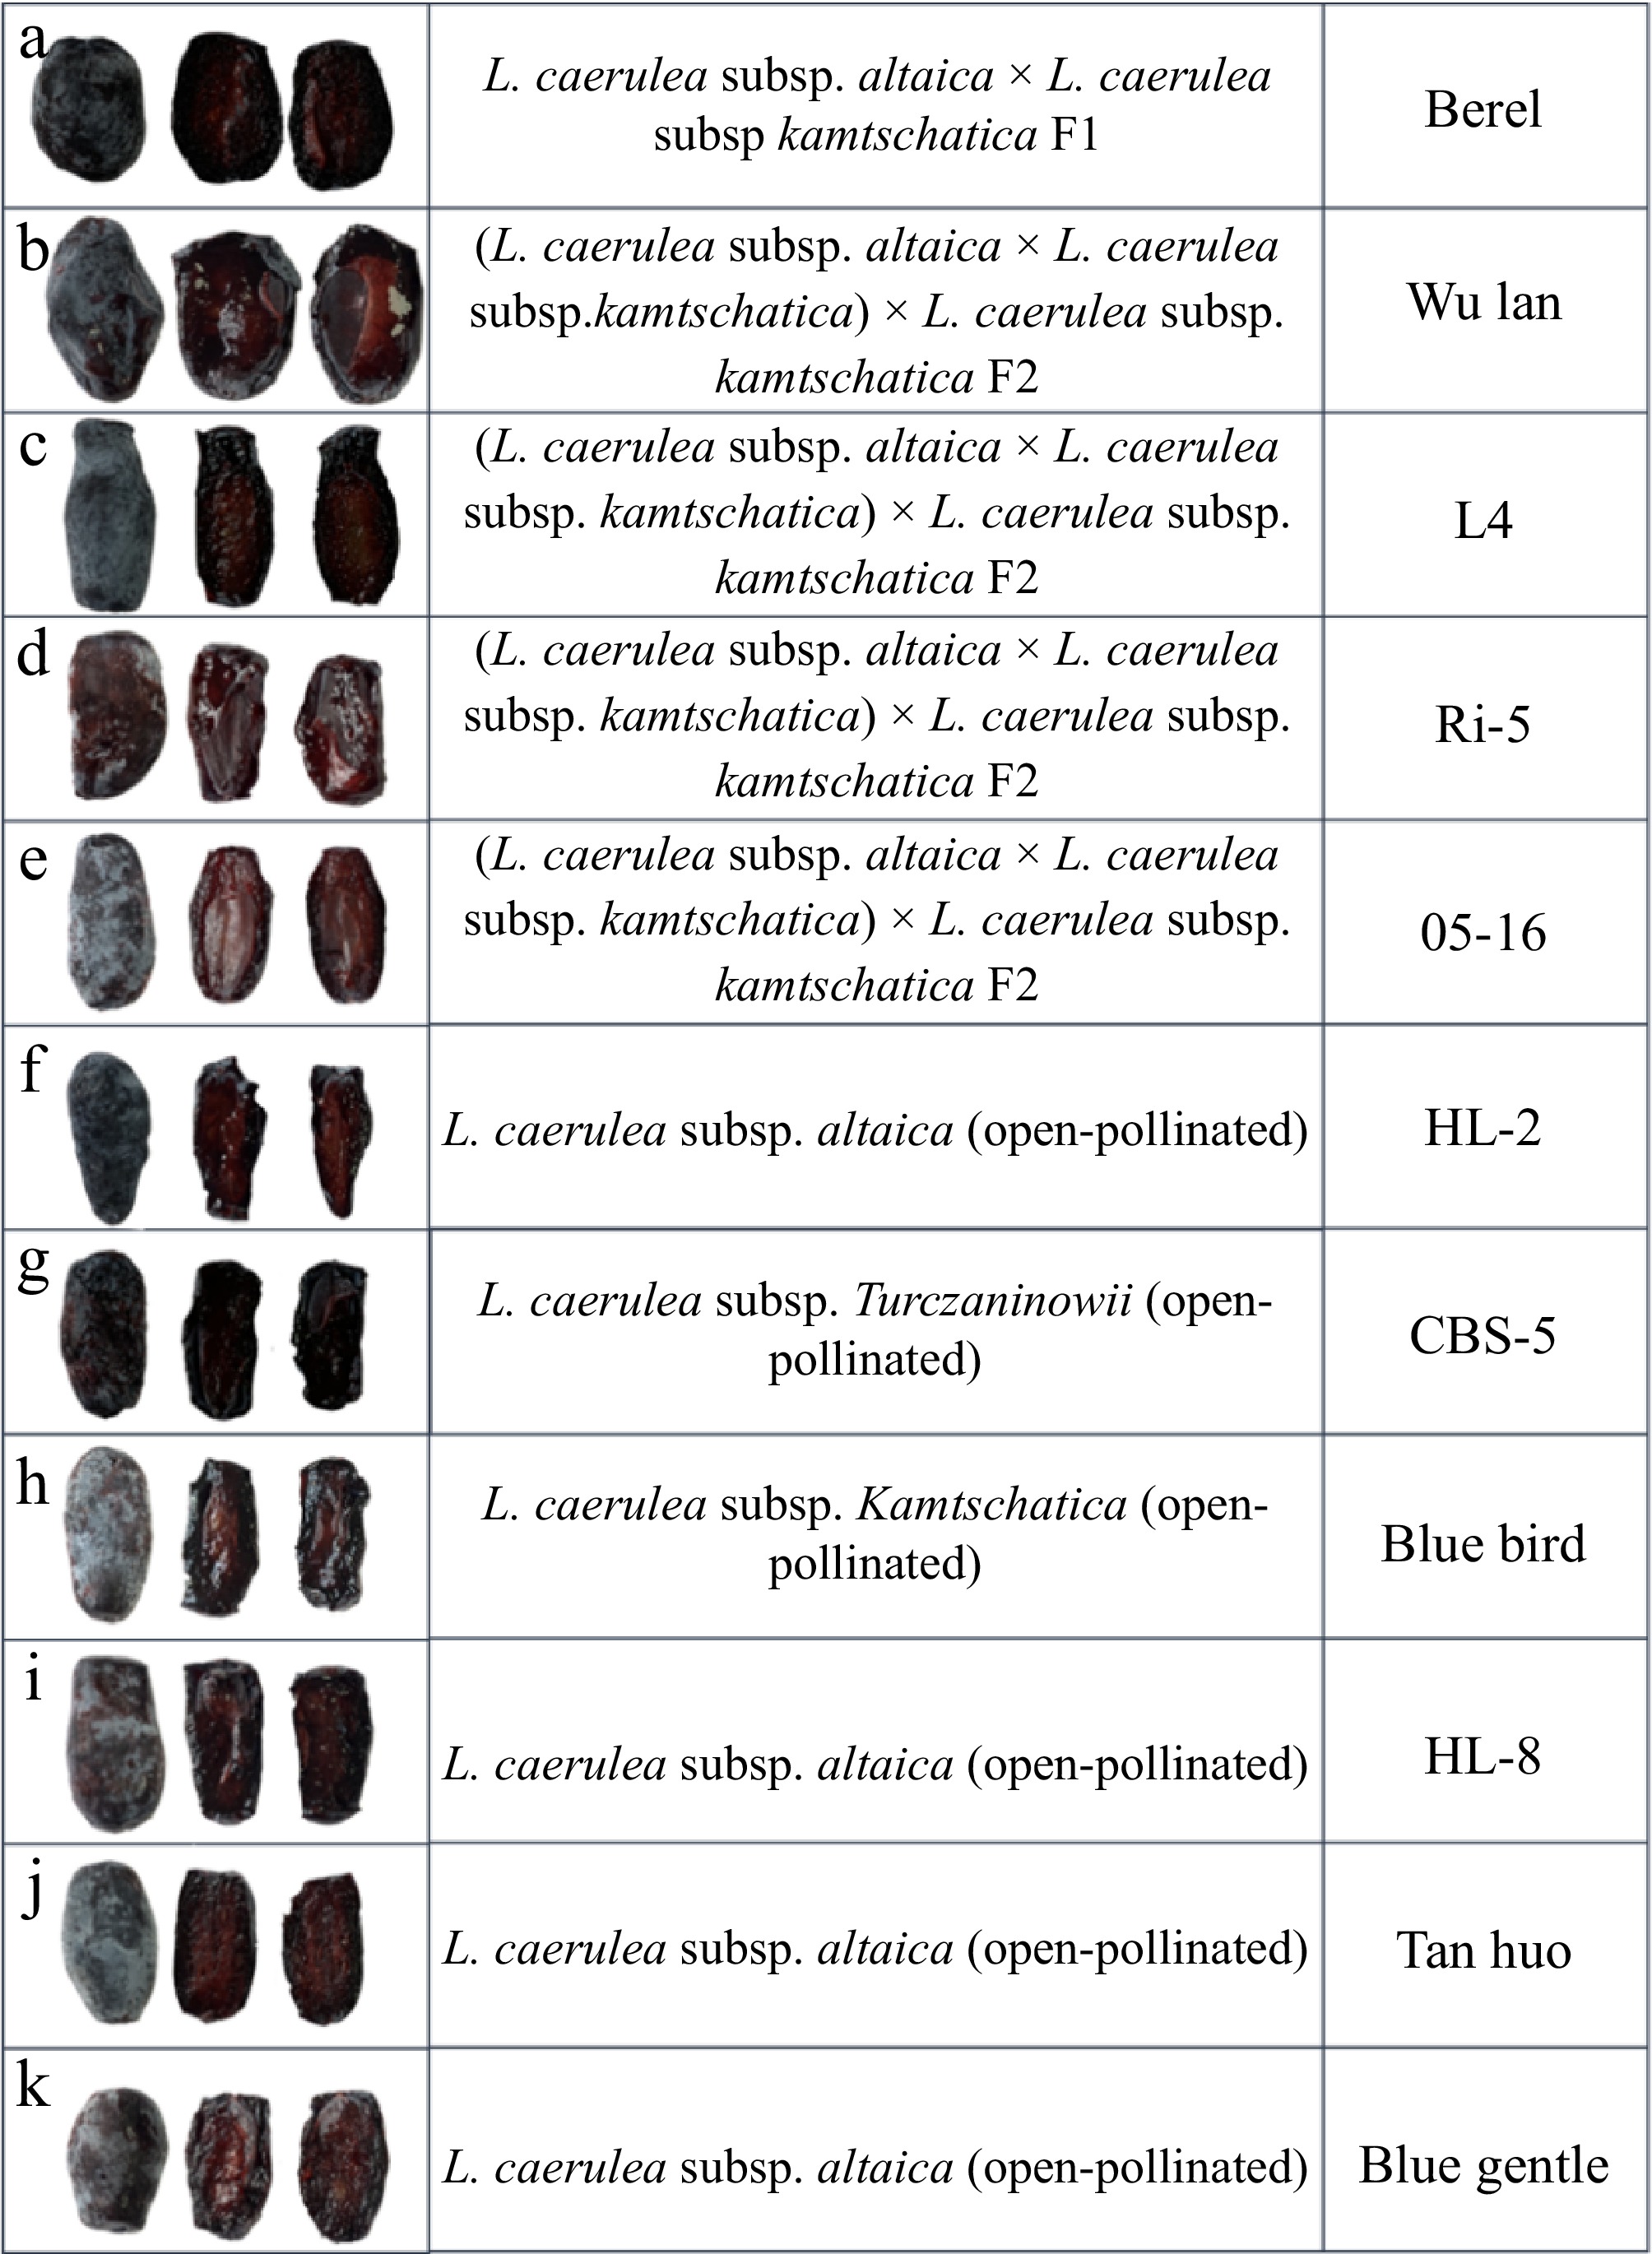
Figure 1.
Overview of blue honeysuckle cultivars and their pedigree information.
-
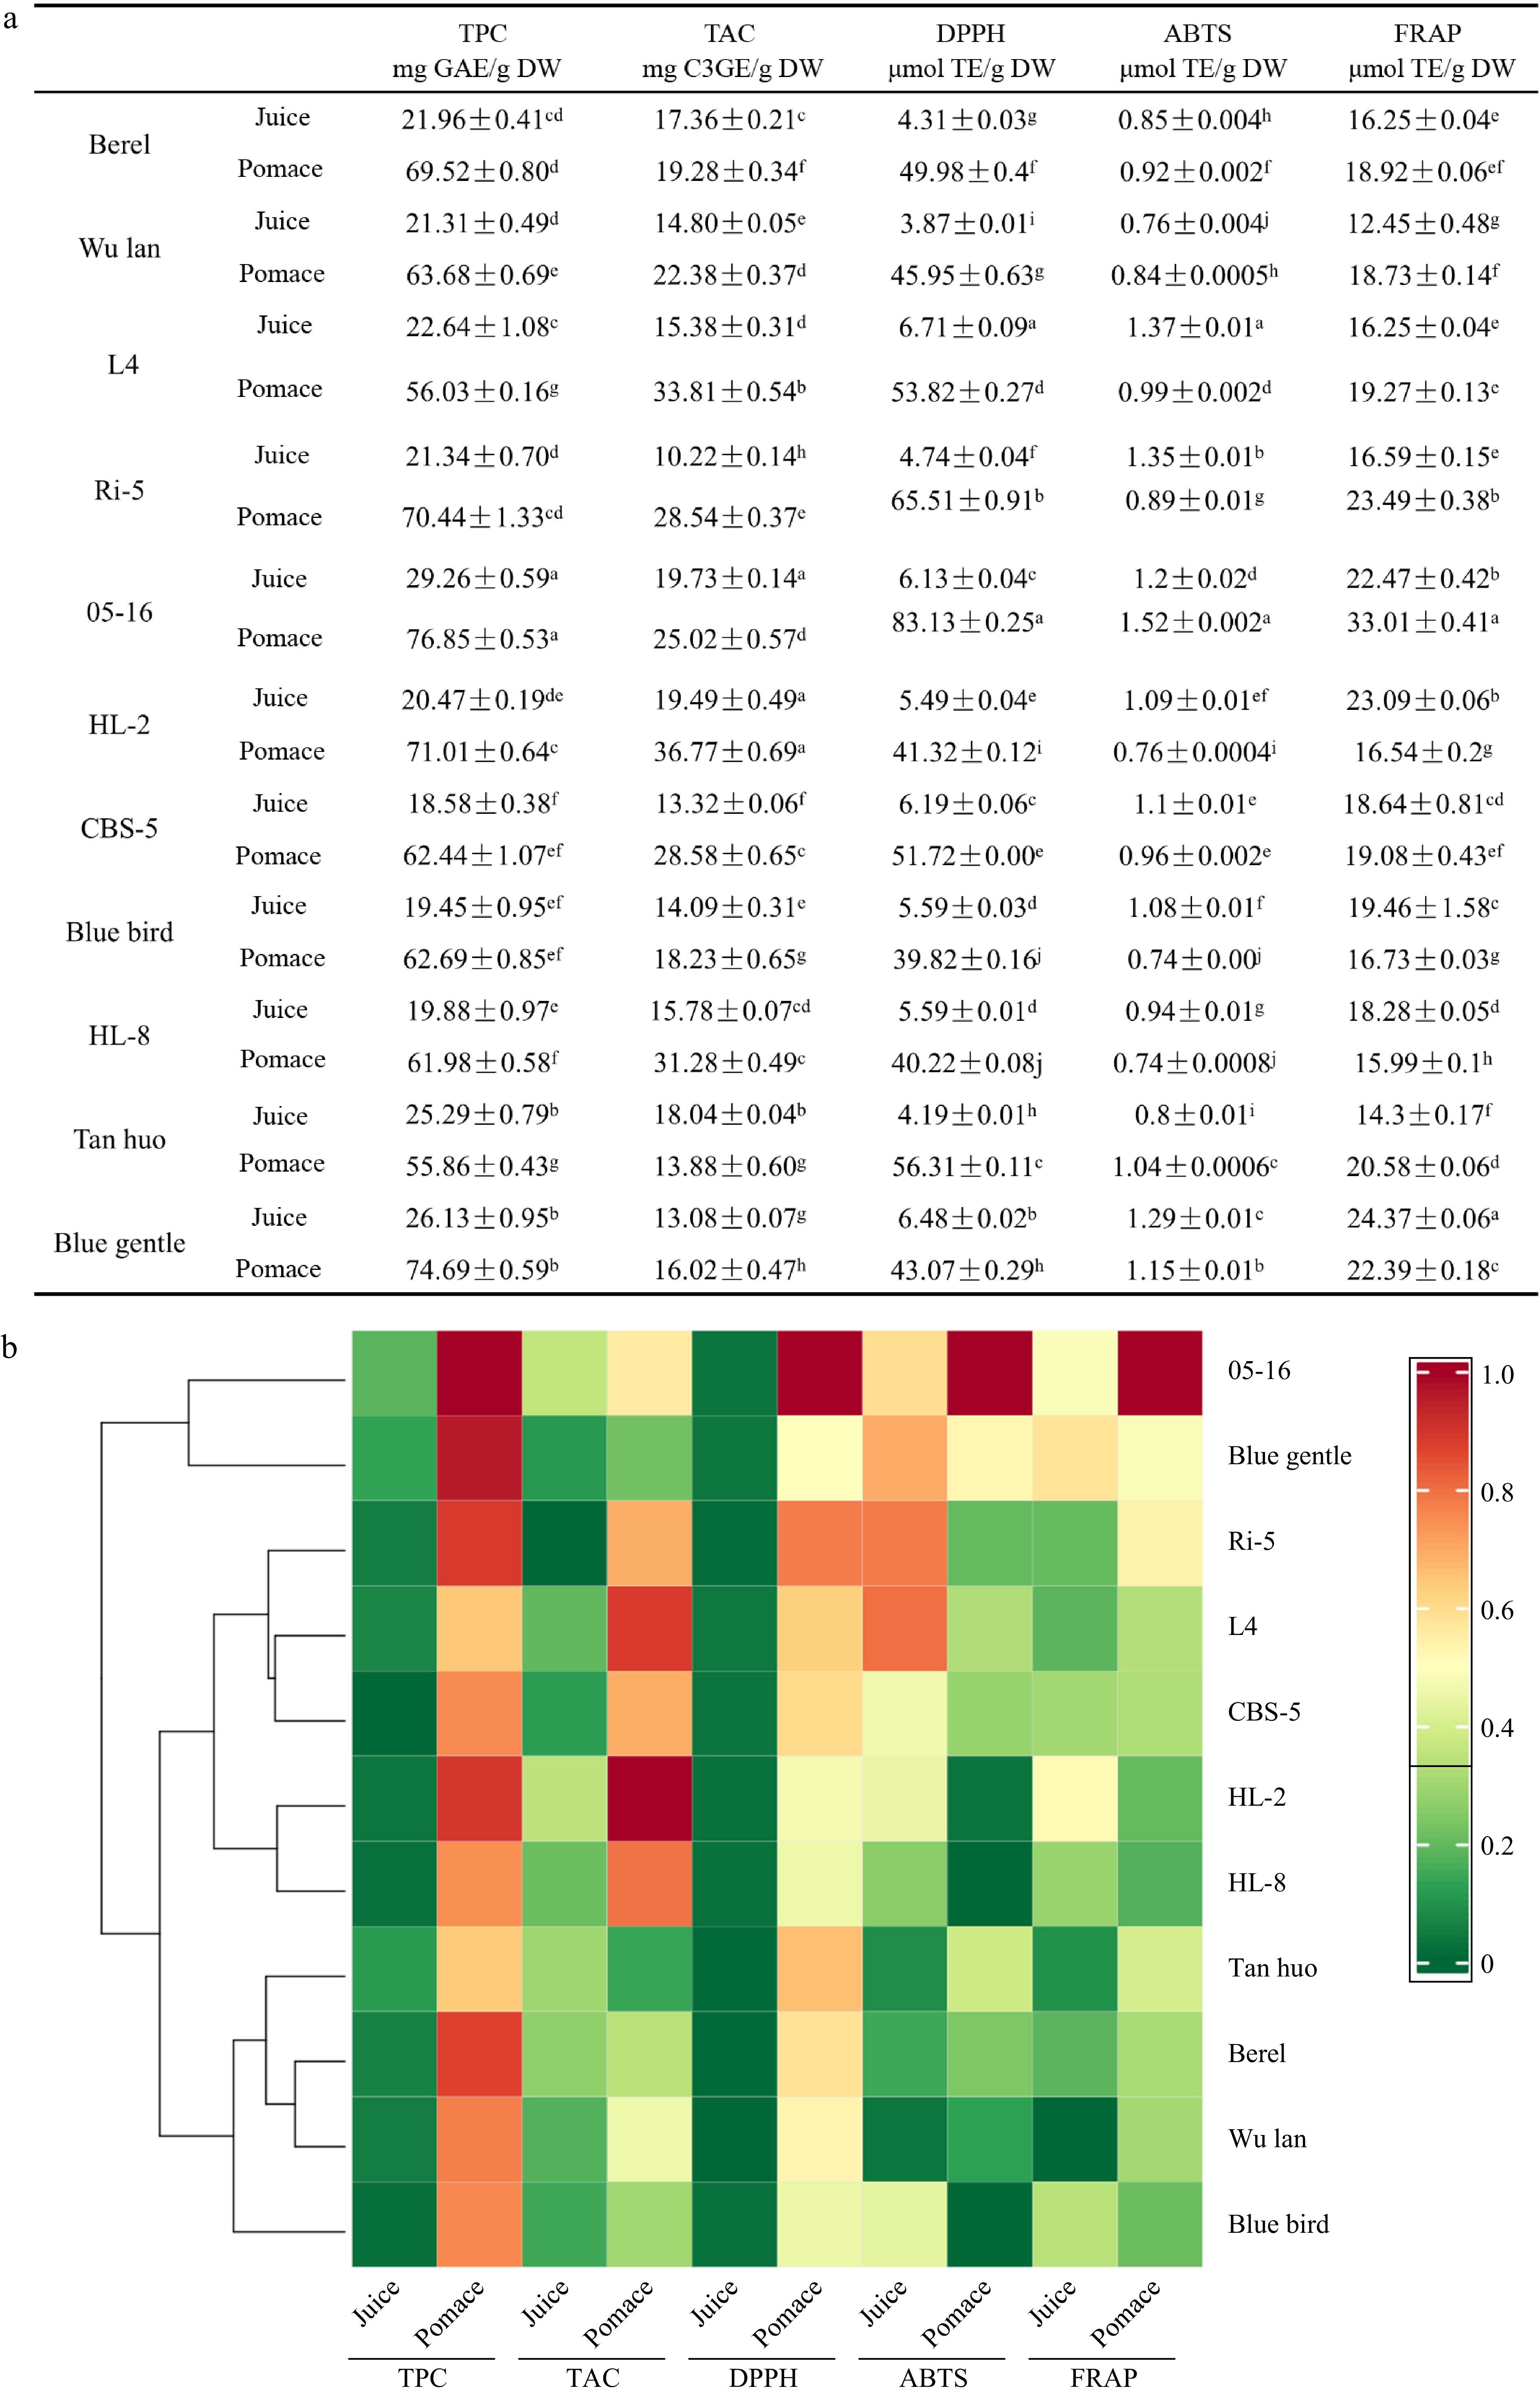
Figure 2.
(a) Values and (b) hierarchical clustering heatmap of TPC, TAC, DPPH, ABTS, and FRAP in juice and pomace of blue honeysuckle. Different lowercase letters indicate significant differences among juices and pomaces of different cultivars analyzed separately, as determined by one-way analysis of variance (ANOVA) at p < 0.05.
-
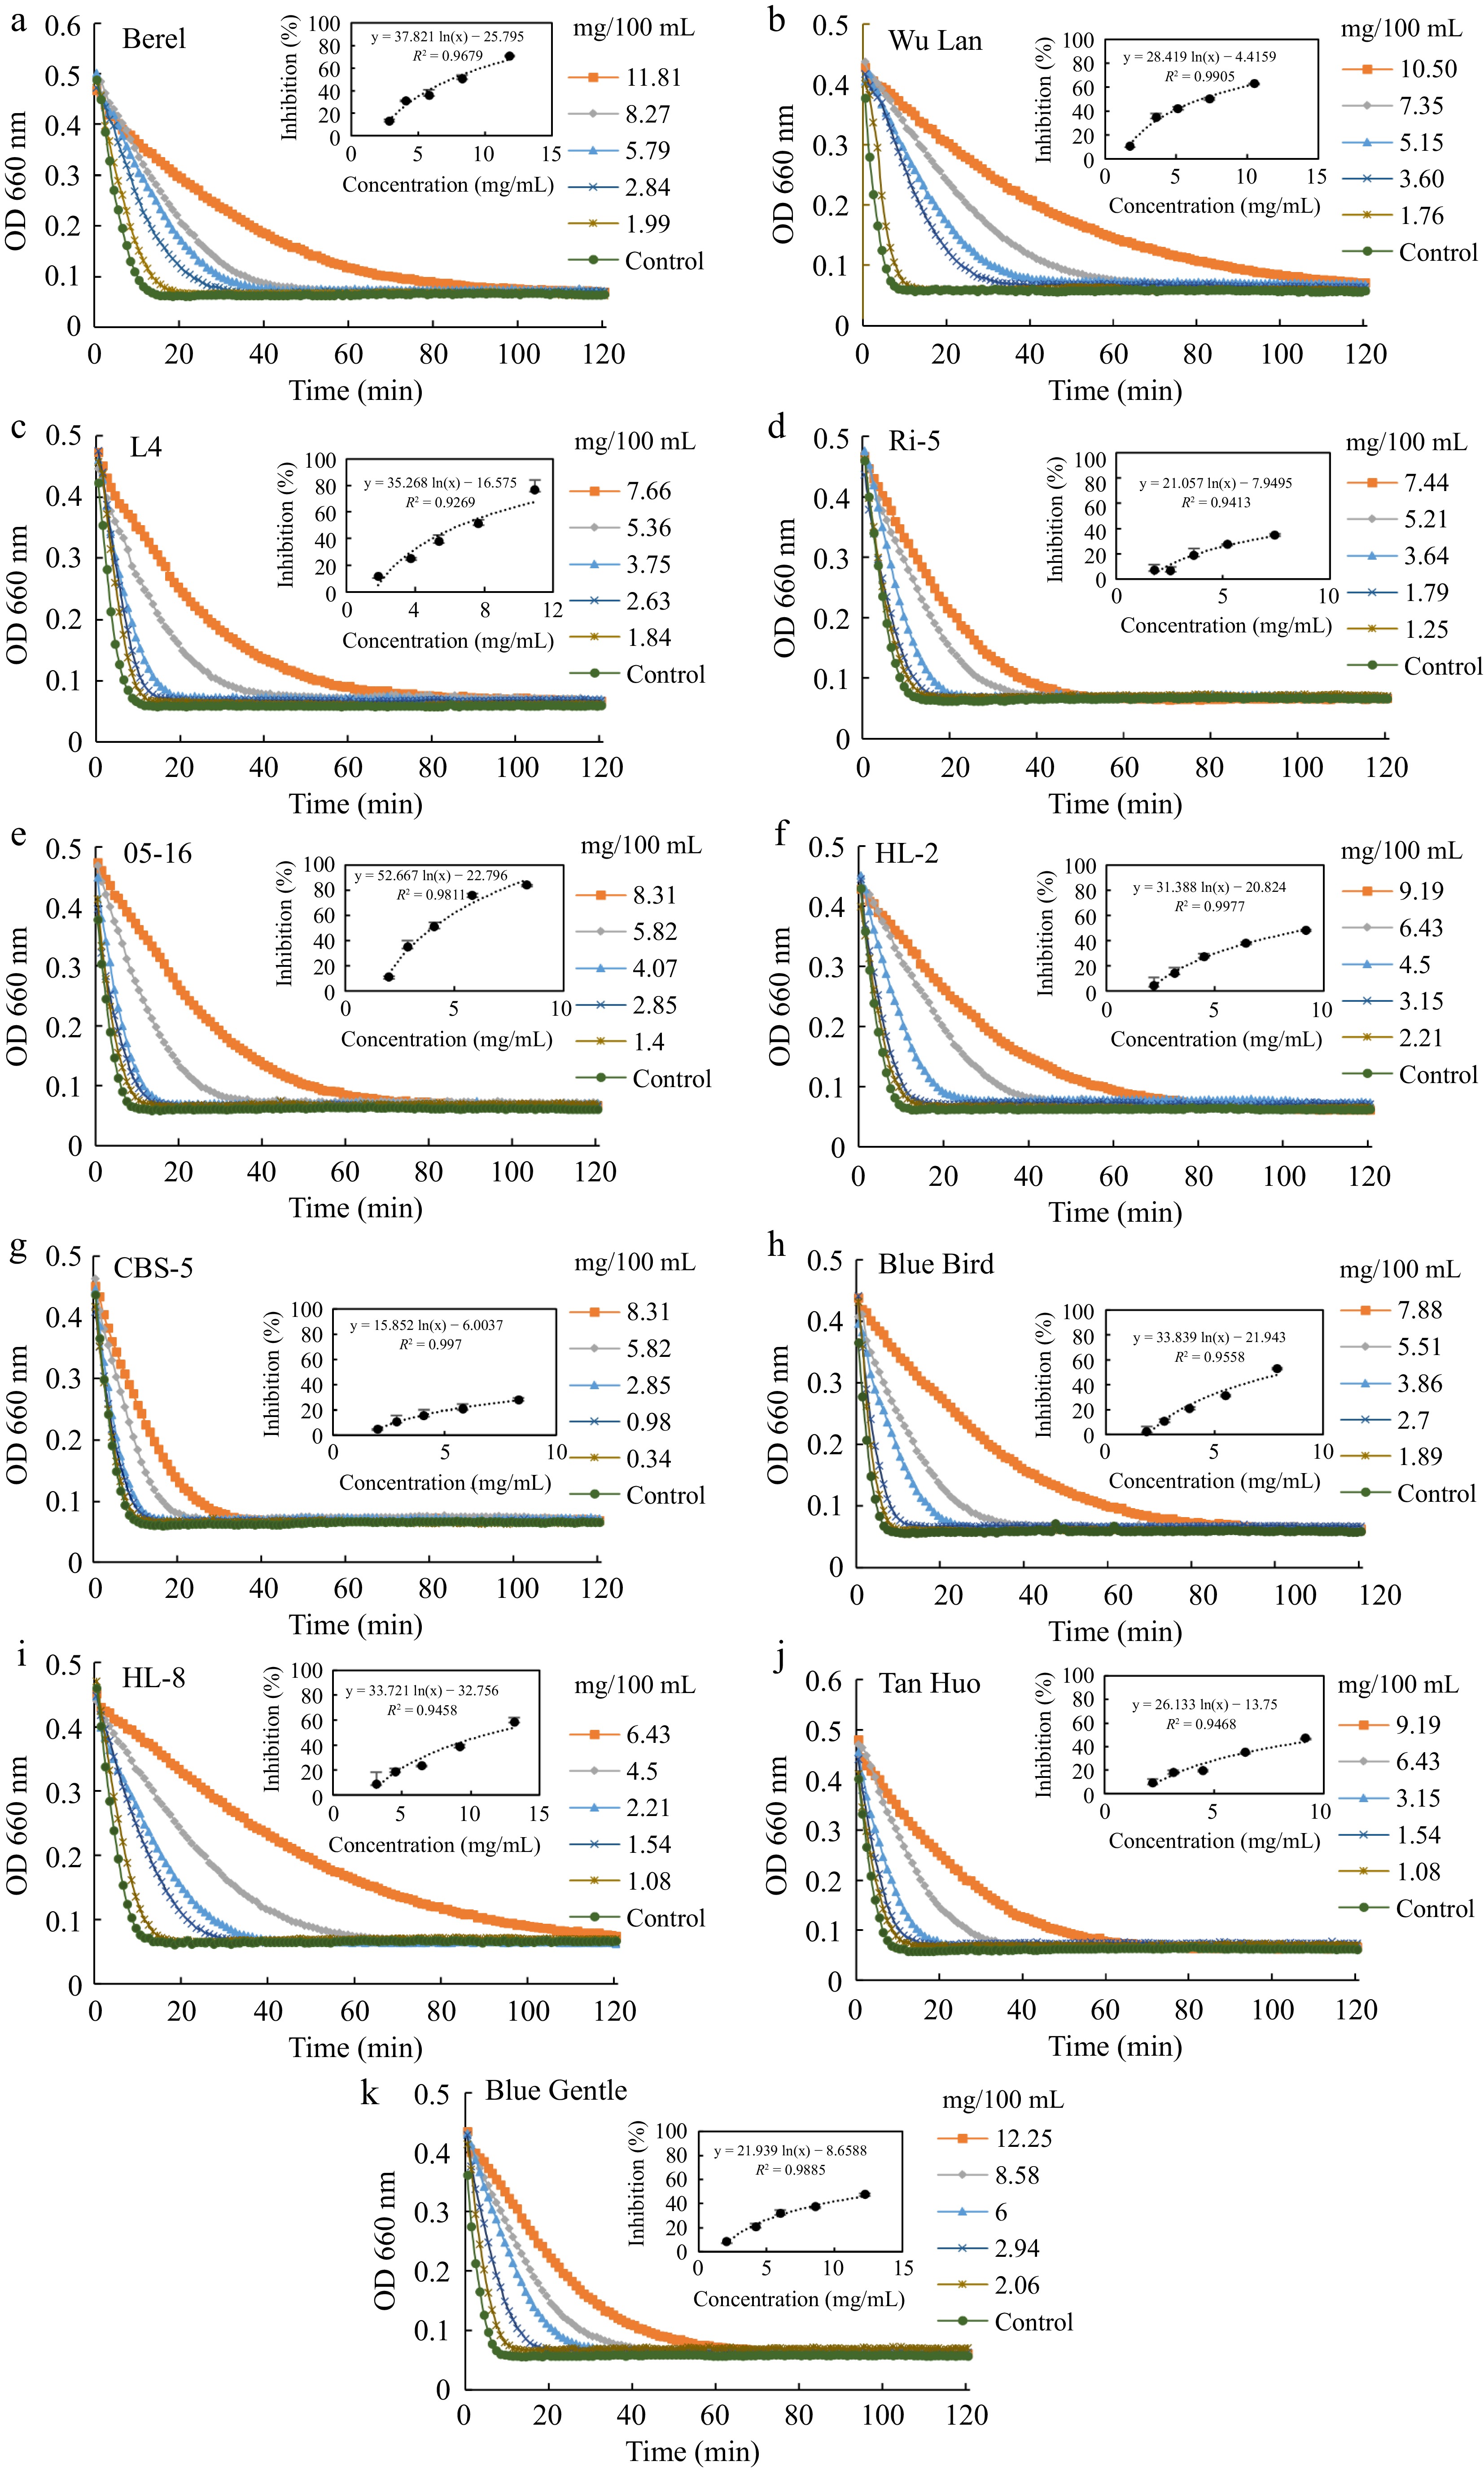
Figure 3.
Inhibitory effects of blue honeysuckle juice from different cultivars on α-amylase activity. (a)–(k) Time-dependent changes in OD660 values reflecting enzymatic activity under different extract concentrations for each cultivar, including (a) Berel, (b) Wu lan, (c) L4, (d) Ri-5, (e) 05-16, (f) HL-2, (g) CBS-5, (h) Blue bird, (i) HL-8, (j) Tan huo, and (k) Blue gentle. Different concentrations of pomace extracts (mg/100 mL) were applied to evaluate their inhibitory effects. The inset graphs show the dose–response relationships between extract concentration and inhibition rate, along with the corresponding regression equations and correlation coefficients (R2). The control represents the enzyme activity without extract addition.
-
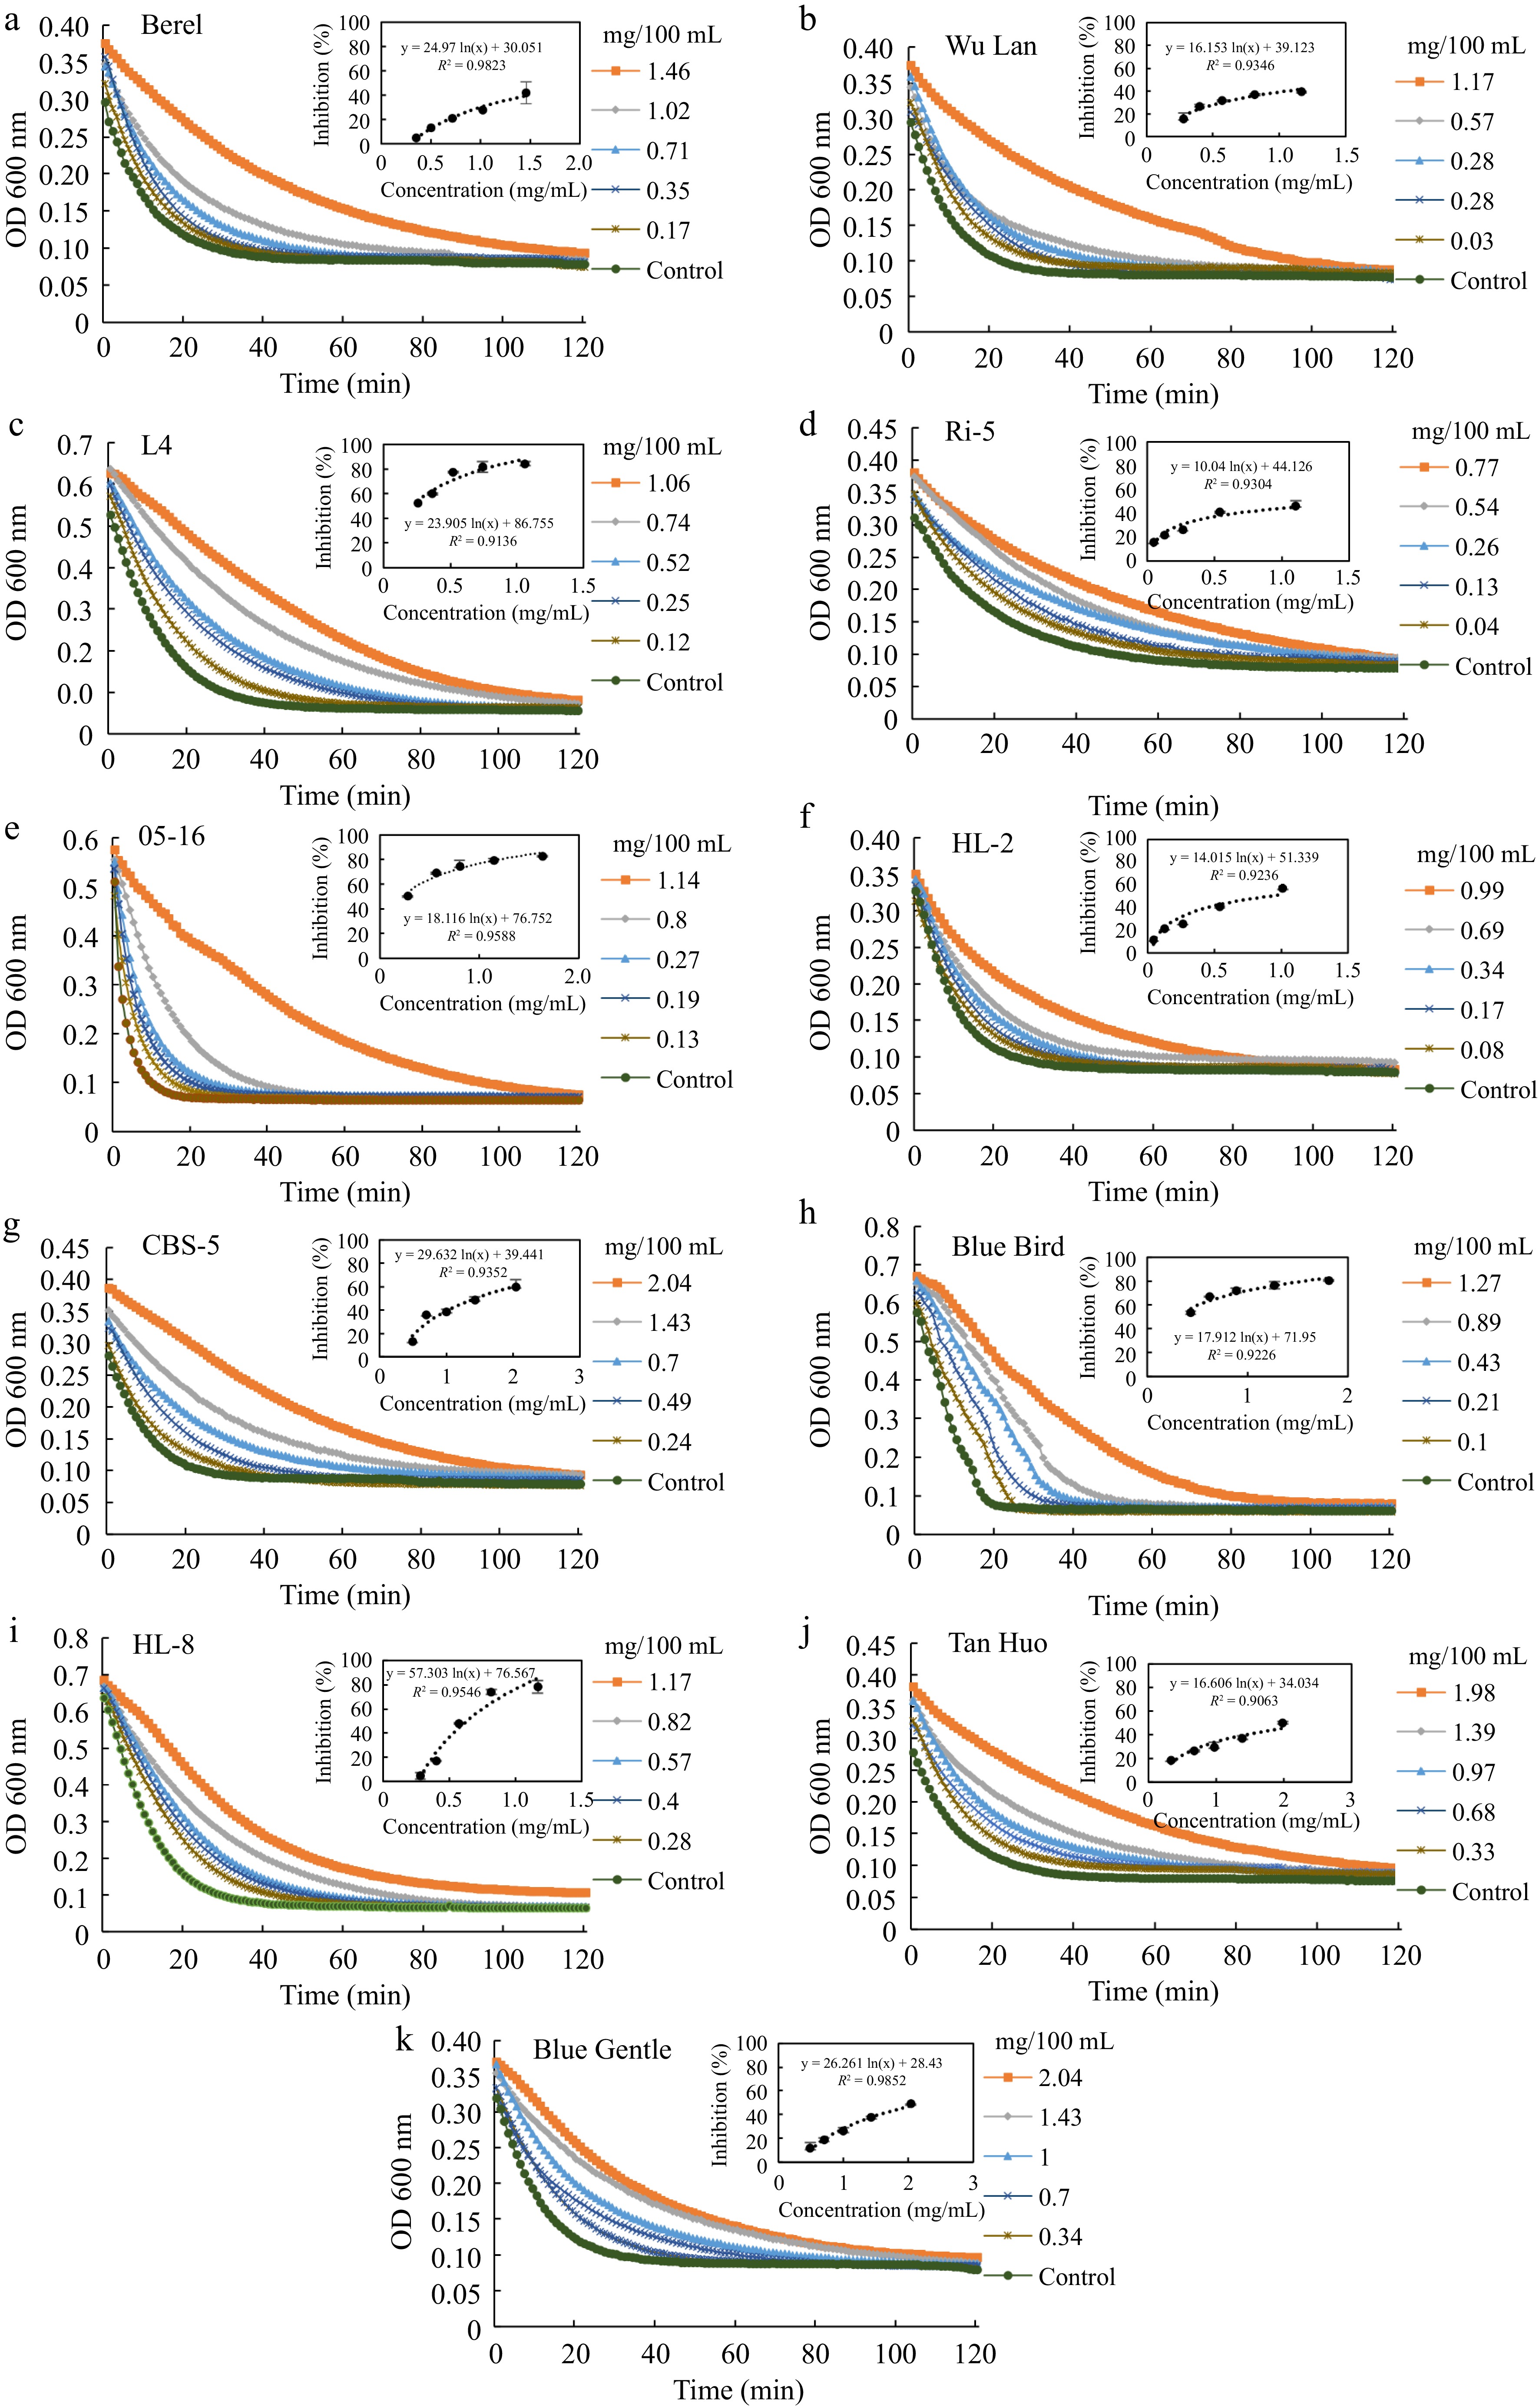
Figure 4.
Inhibitory effects of blue honeysuckle pomace from different cultivars on α-amylase activity. (a)–(k) Time-dependent changes in OD660 values reflecting enzymatic activity under different extract concentrations for each cultivar, including (a) Berel, (b) Wu lan, (c) L4, (d) Ri-5, (e) 05-16, (f) HL-2, (g) CBS-5, (h) Blue bird, (i) HL-8, (j) Tan huo, and (k) Blue gentle. Different concentrations of pomace extracts (mg/100 mL) were applied to evaluate their inhibitory effects. The inset graphs show the dose–response relationships between extract concentration and inhibition rate, along with the corresponding regression equations and correlation coefficients (R2). The control represents the enzyme activity without extract addition.
-
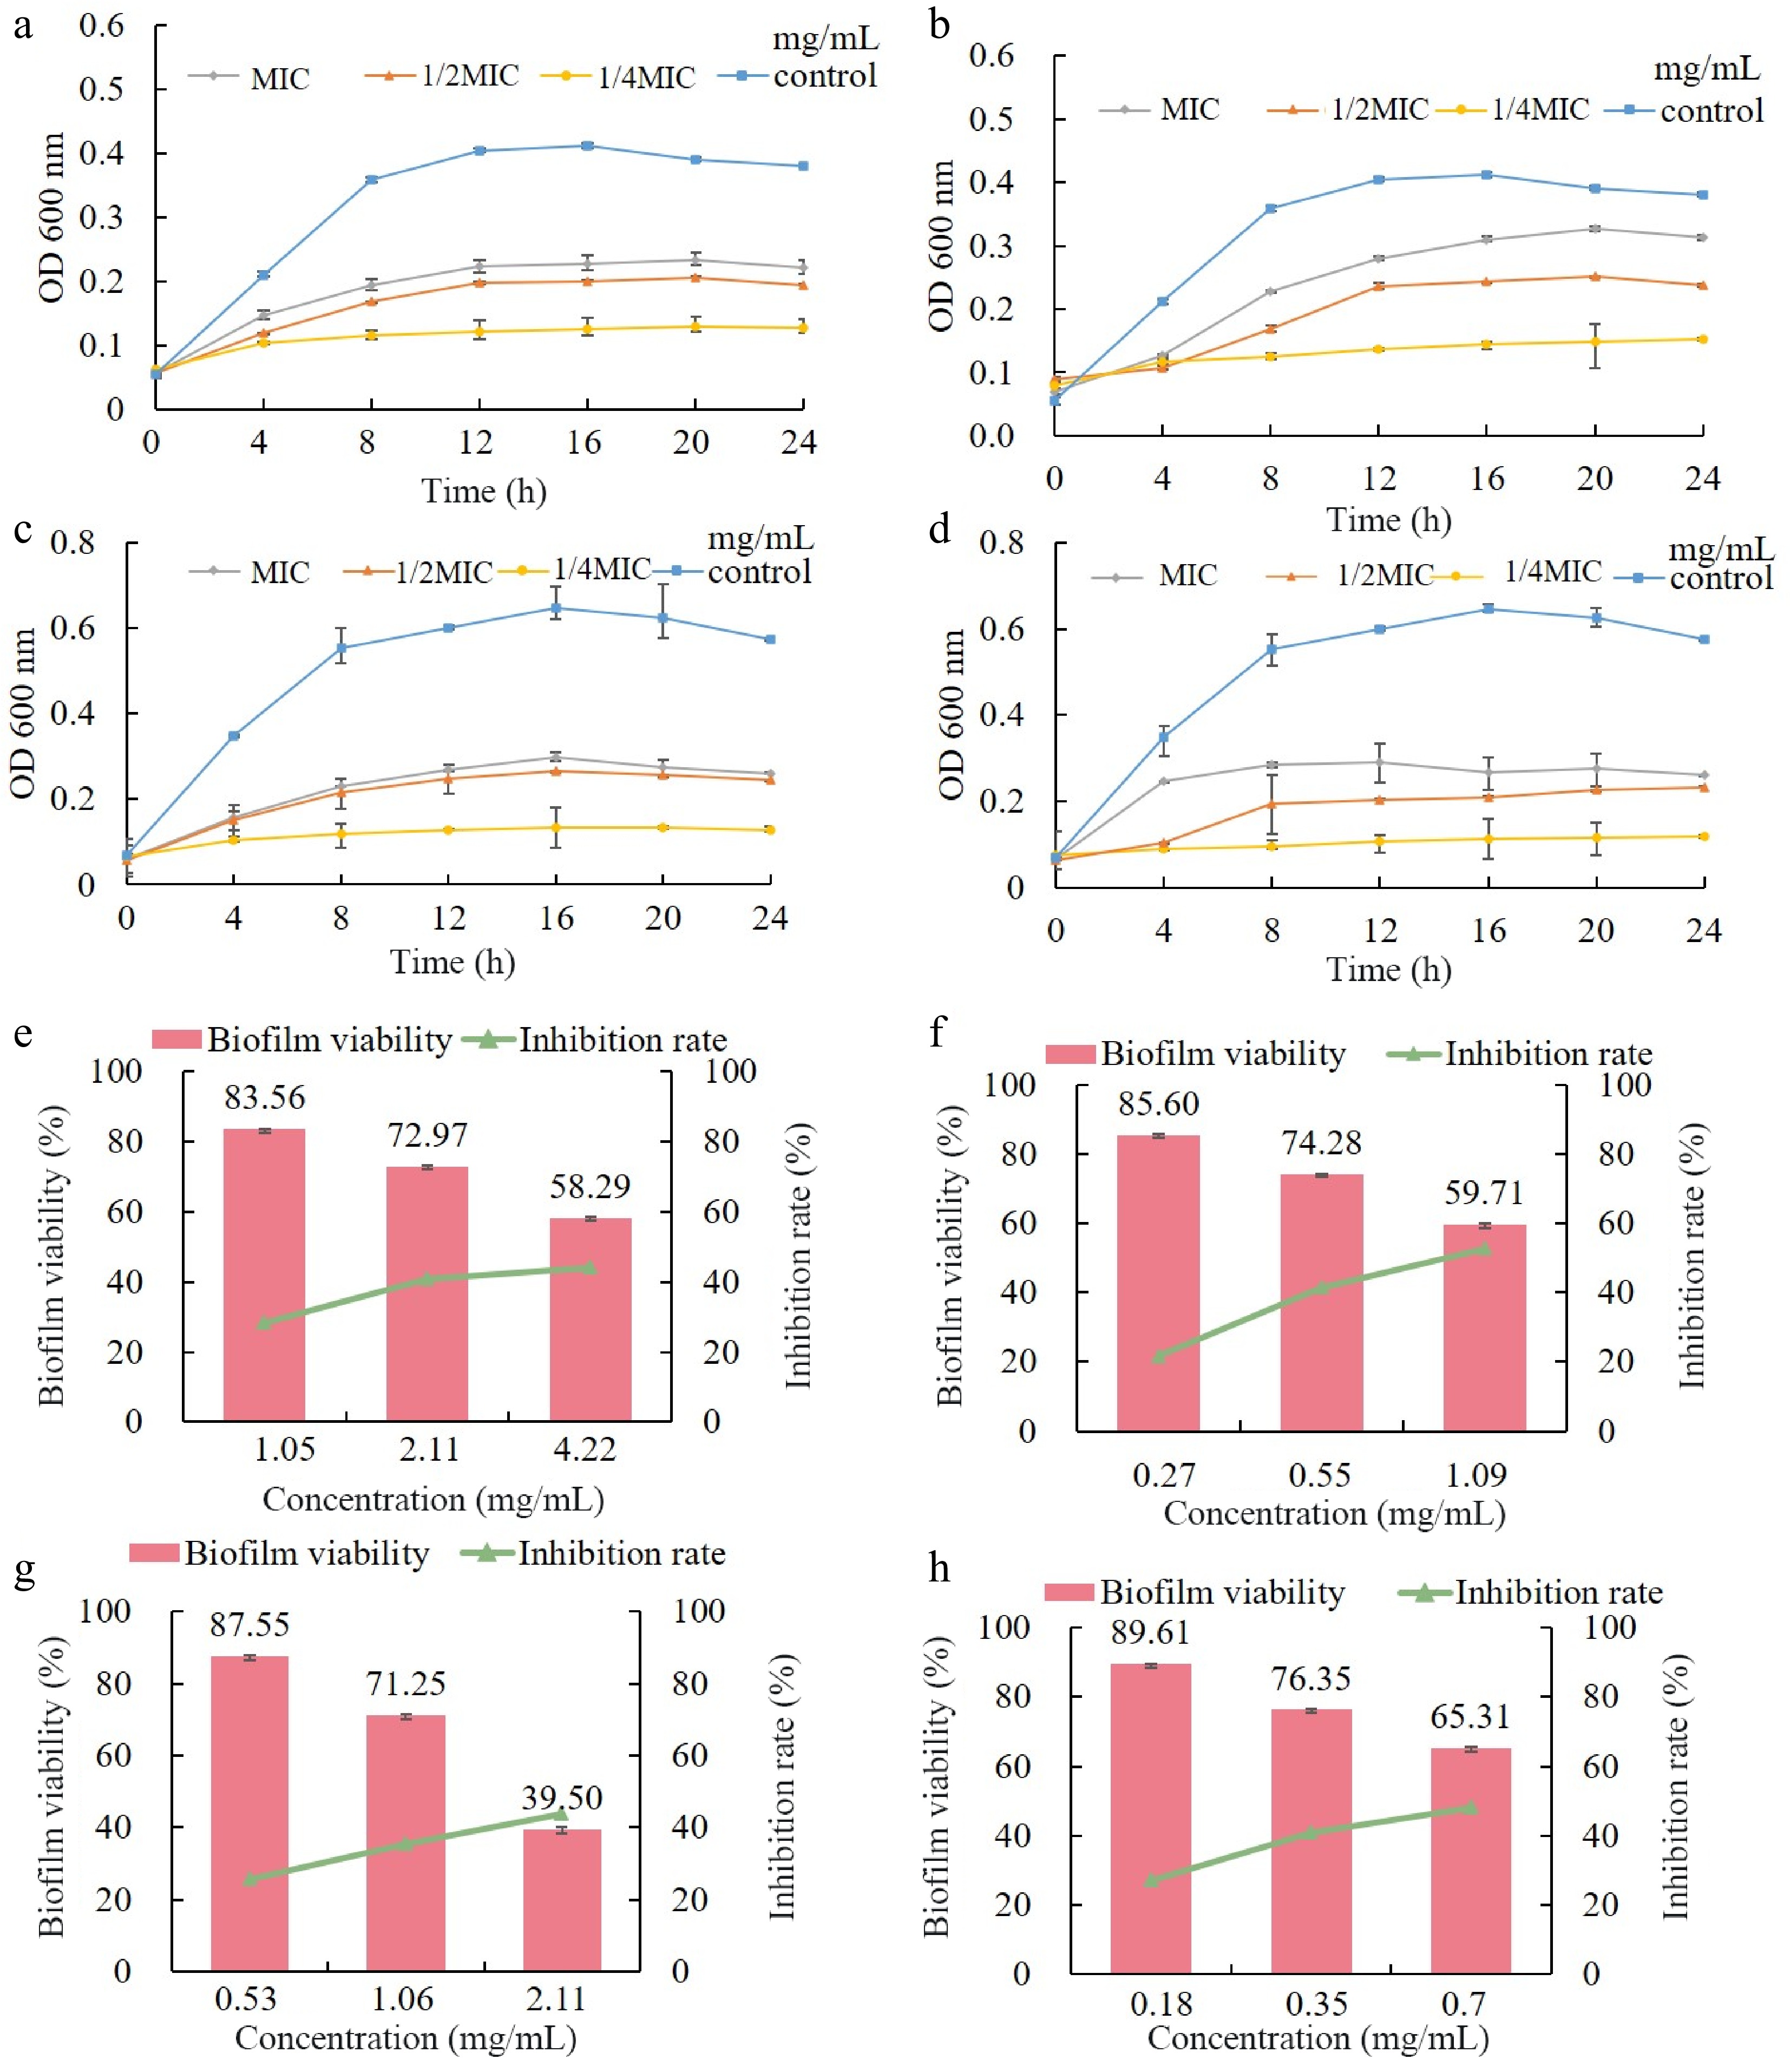
Figure 5.
Time-kill curves of (a) juice and (b) pomace against S. aureus; (c) juice, and (d) pomace against E. coli; the influence of (e) juice, and (f) pomace against S. aureus biofilm; (g) juice, and (h) pomace against E. coli biofilm.
-
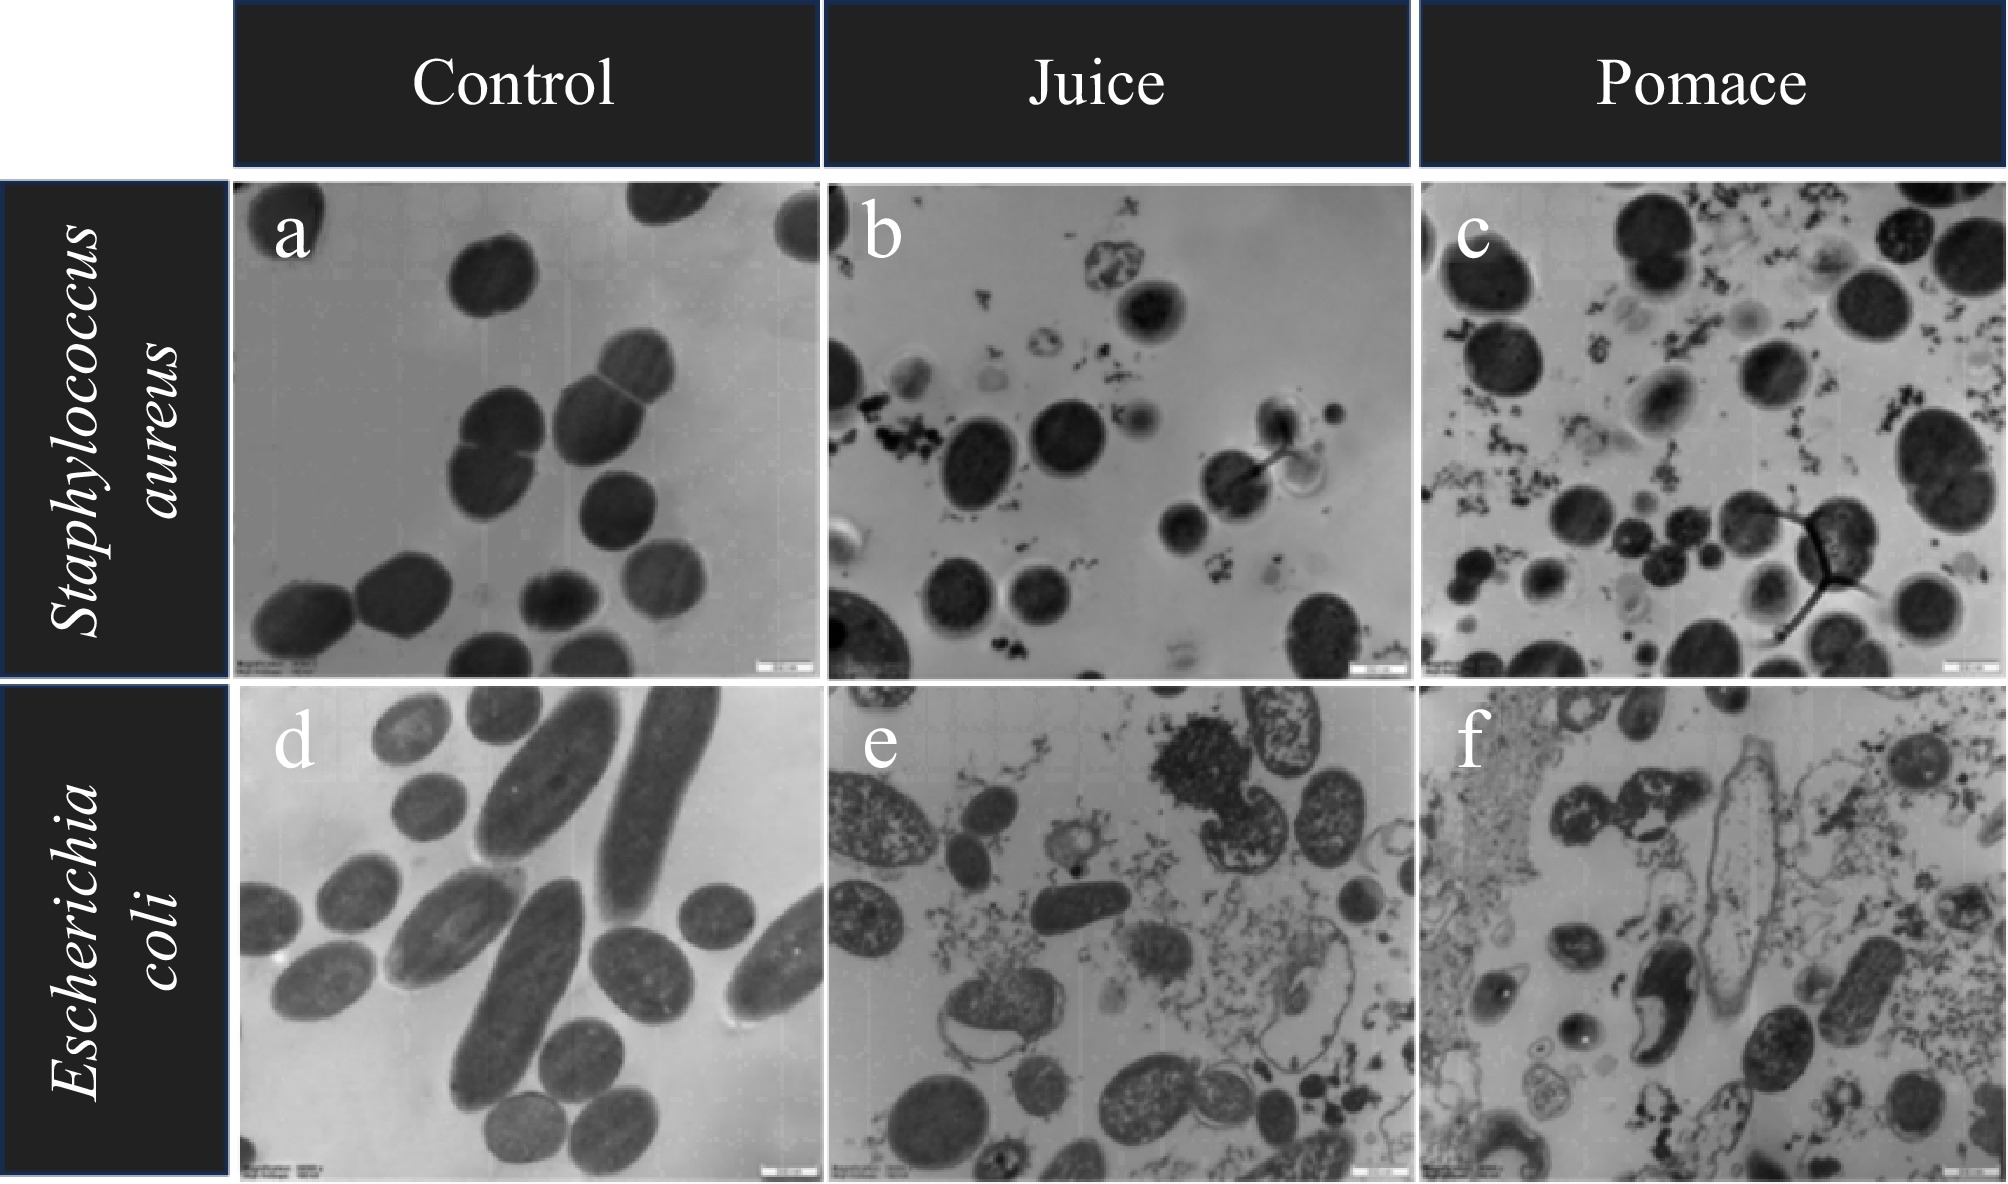
Figure 6.
TEM images of S. aureus (a) untreated, (b) juice-treated, (c) pomace-treated; and E. coli. (d) untreated, (e) juice-treated, (f) pomace-treated. (30,000 ×).
-
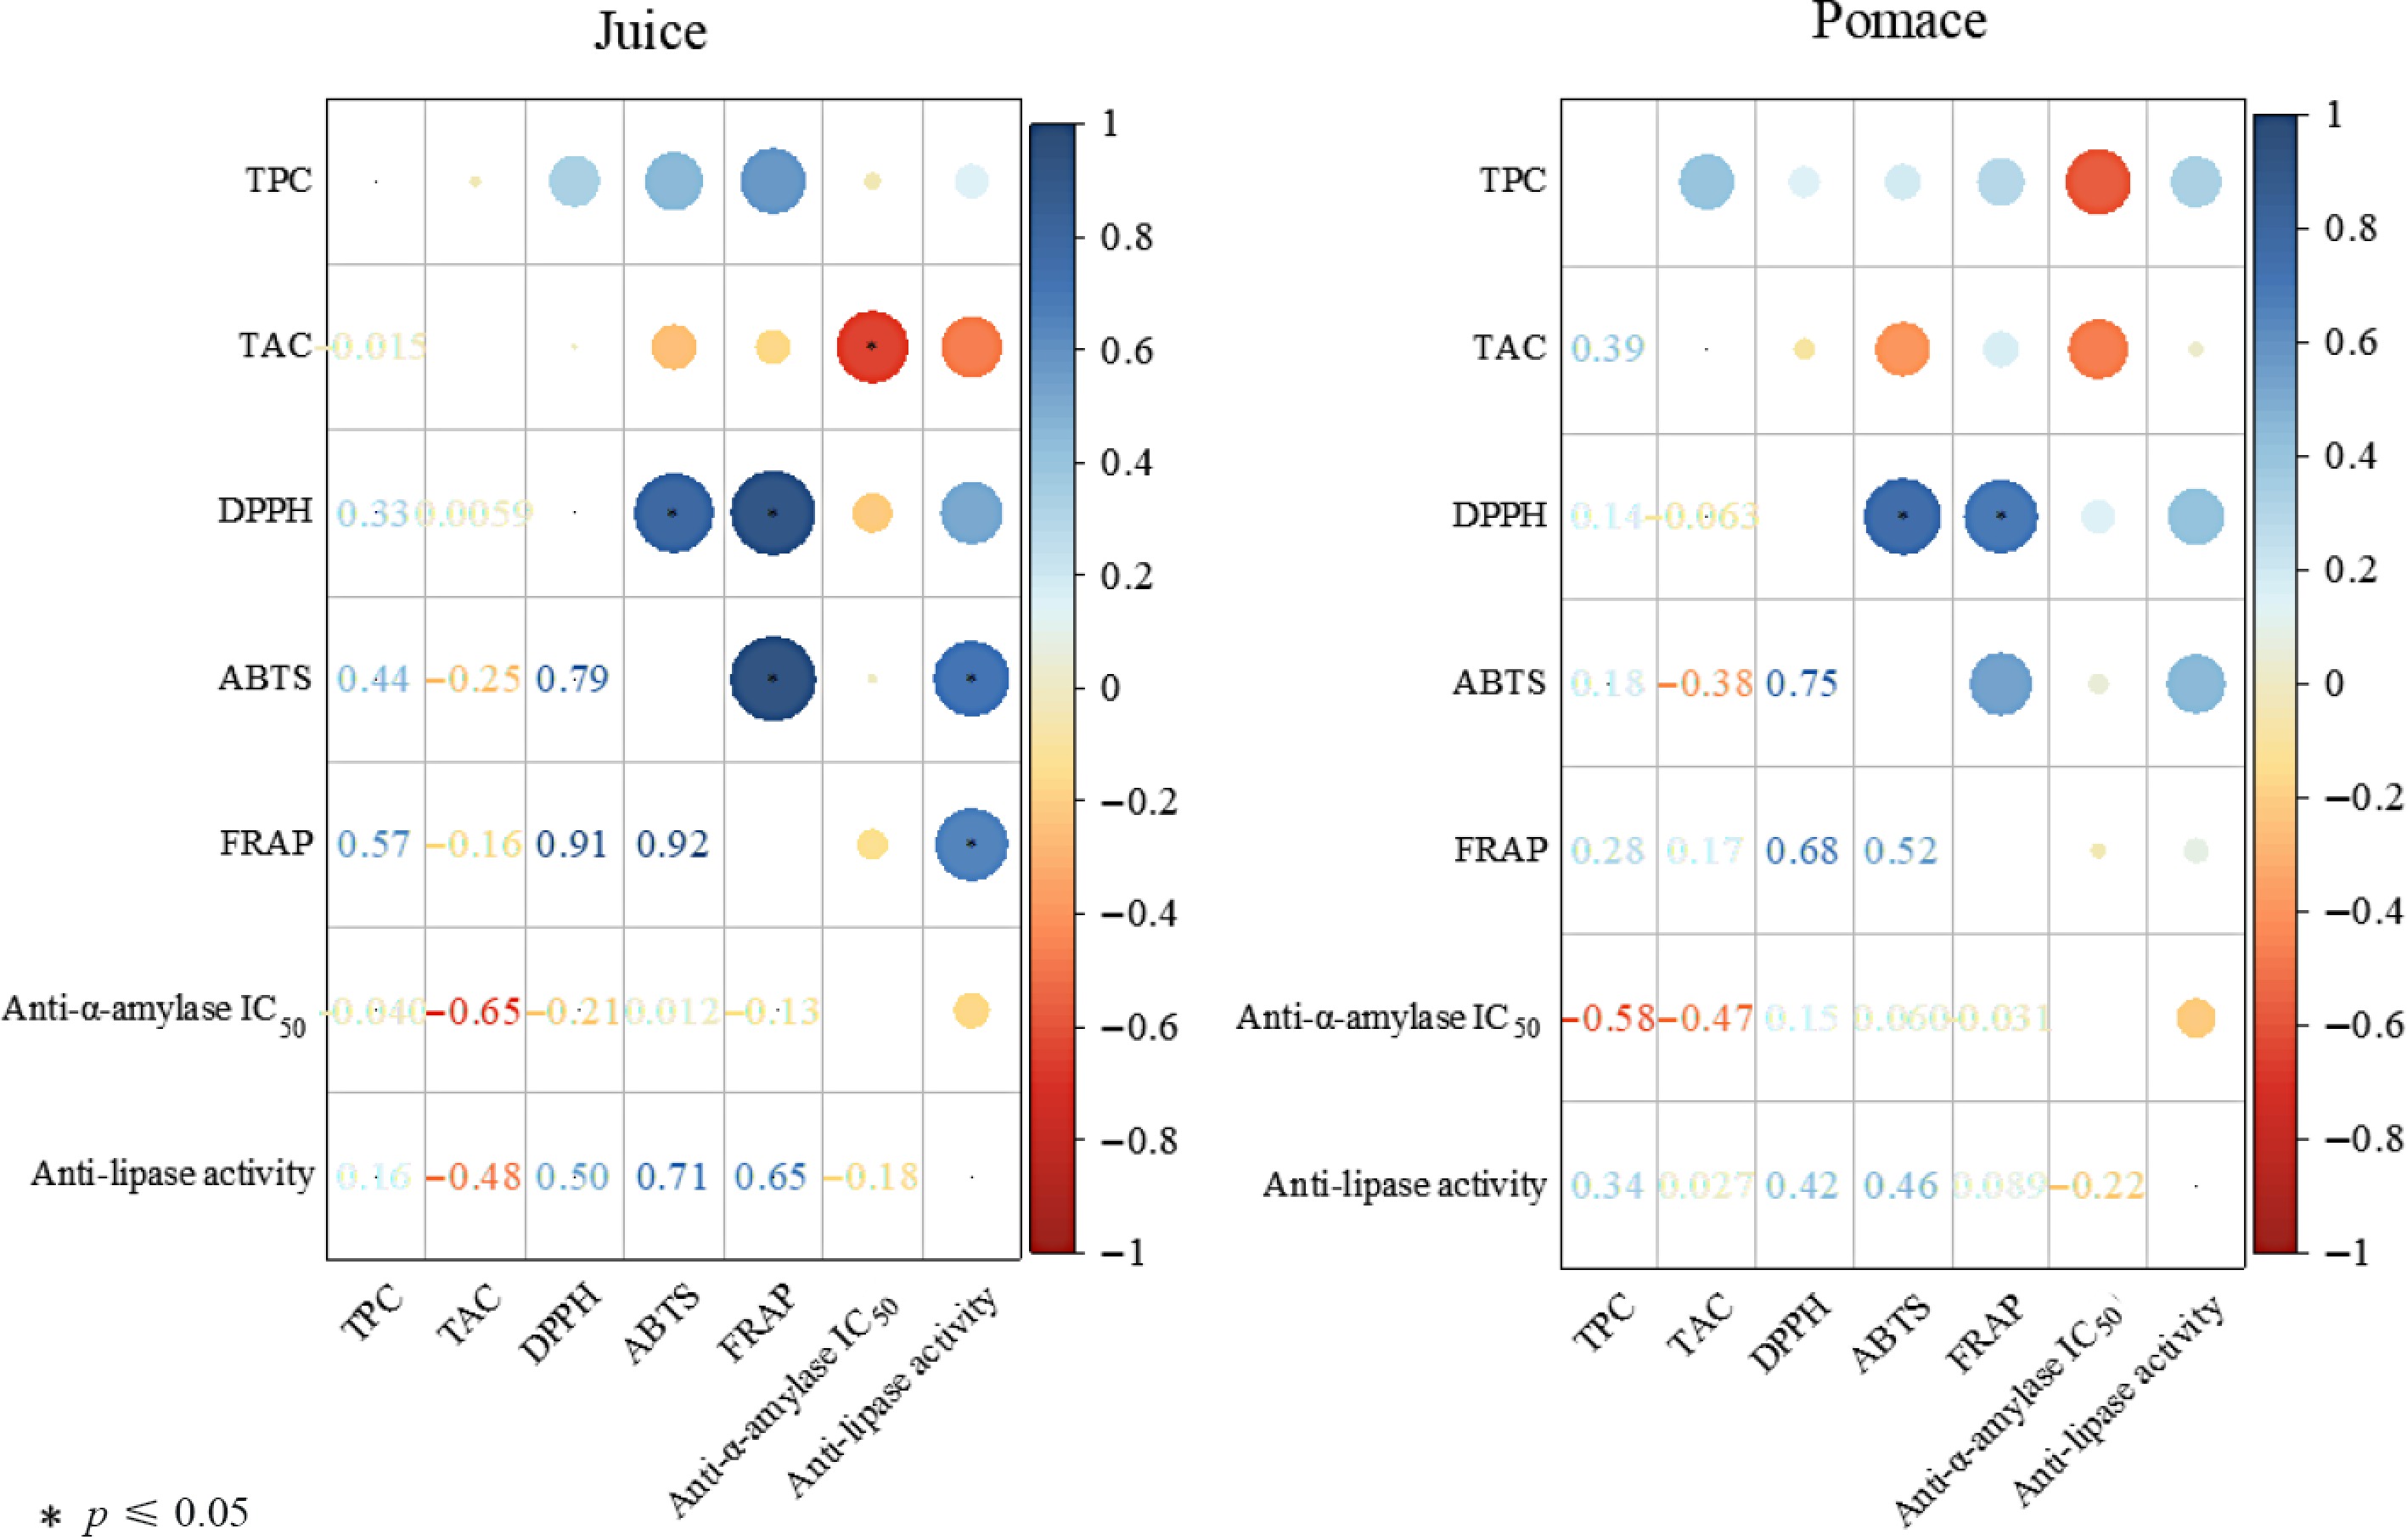
Figure 7.
Correlation analysis among total phenolic content (TPC), total anthocyanin content (TAC), antioxidant activities (DPPH, ABTS, and FRAP), anti-α-amylase IC50, and anti-lipase activity in the juice and pomace of 11 blue honeysuckle cultivars.
-
Varities Anti-α-amylase activity
IC 50 (µg/mL)Anti-lipase activity
(%)Juice Pomace Juice Pomace Berel 72.91 ± 2.08h 22.23 ± 1.05c 26.38 ± 0.46i 44.23 ± 0.57h Wu lan 67.86 ± 1.70i 19.61 ± 0.10d 26.32 ± 0.77j 40.48 ± 0.54j L4 66.04 ± 9.50j 2.02 ± 0.20k 37.12 ± 0.93a 51.12 ± 0.54d Ri-5 156.70 ± 4.99b 9.18 ± 0.10f 30.21 ± 0.95e 46.25 ± 0.90f 05-16 39.84 ± 3.10k 2.15 ± 0.20j 30.90 ± 0.87d 58.74 ± 0.97a HL-2 95.49 ± 1.40f 8.27 ± 0.50g 28.28 ± 0.75f 35.10 ± 0.82k CBS-5 342.25 ± 13.25a 14.28 ± 0.30e 27.88 ± 0.47g 45.57 ± 0.79g Blue bird 144.94 ± 2.10c 2.94 ± 0.56i 16.36 ± 0.51k 54.17 ± 0.99c HL-8 116.36 ± 1.65d 6.29 ± 0.30h 31.88 ± 0.98b 41.03 ± 0.75i Tan huo 114.66 ± 10.10e 26.2 ± 0.20a 26.65 ± 0.80h 49.04 ± 0.90e Blue gentle 83.82 ± 3.40g 22.79 ± 0.40b 31.56 ± 0.52c 54.56 ± 0.61b Note: means of IC50 within columns followed by different letters are significantly different (p < 0.05). Table 1.
Overview of IC50 values against α-amylase and lipase obtained from 11 varieties of blue honeysuckle juice and pomace.
Figures
(7)
Tables
(1)