-
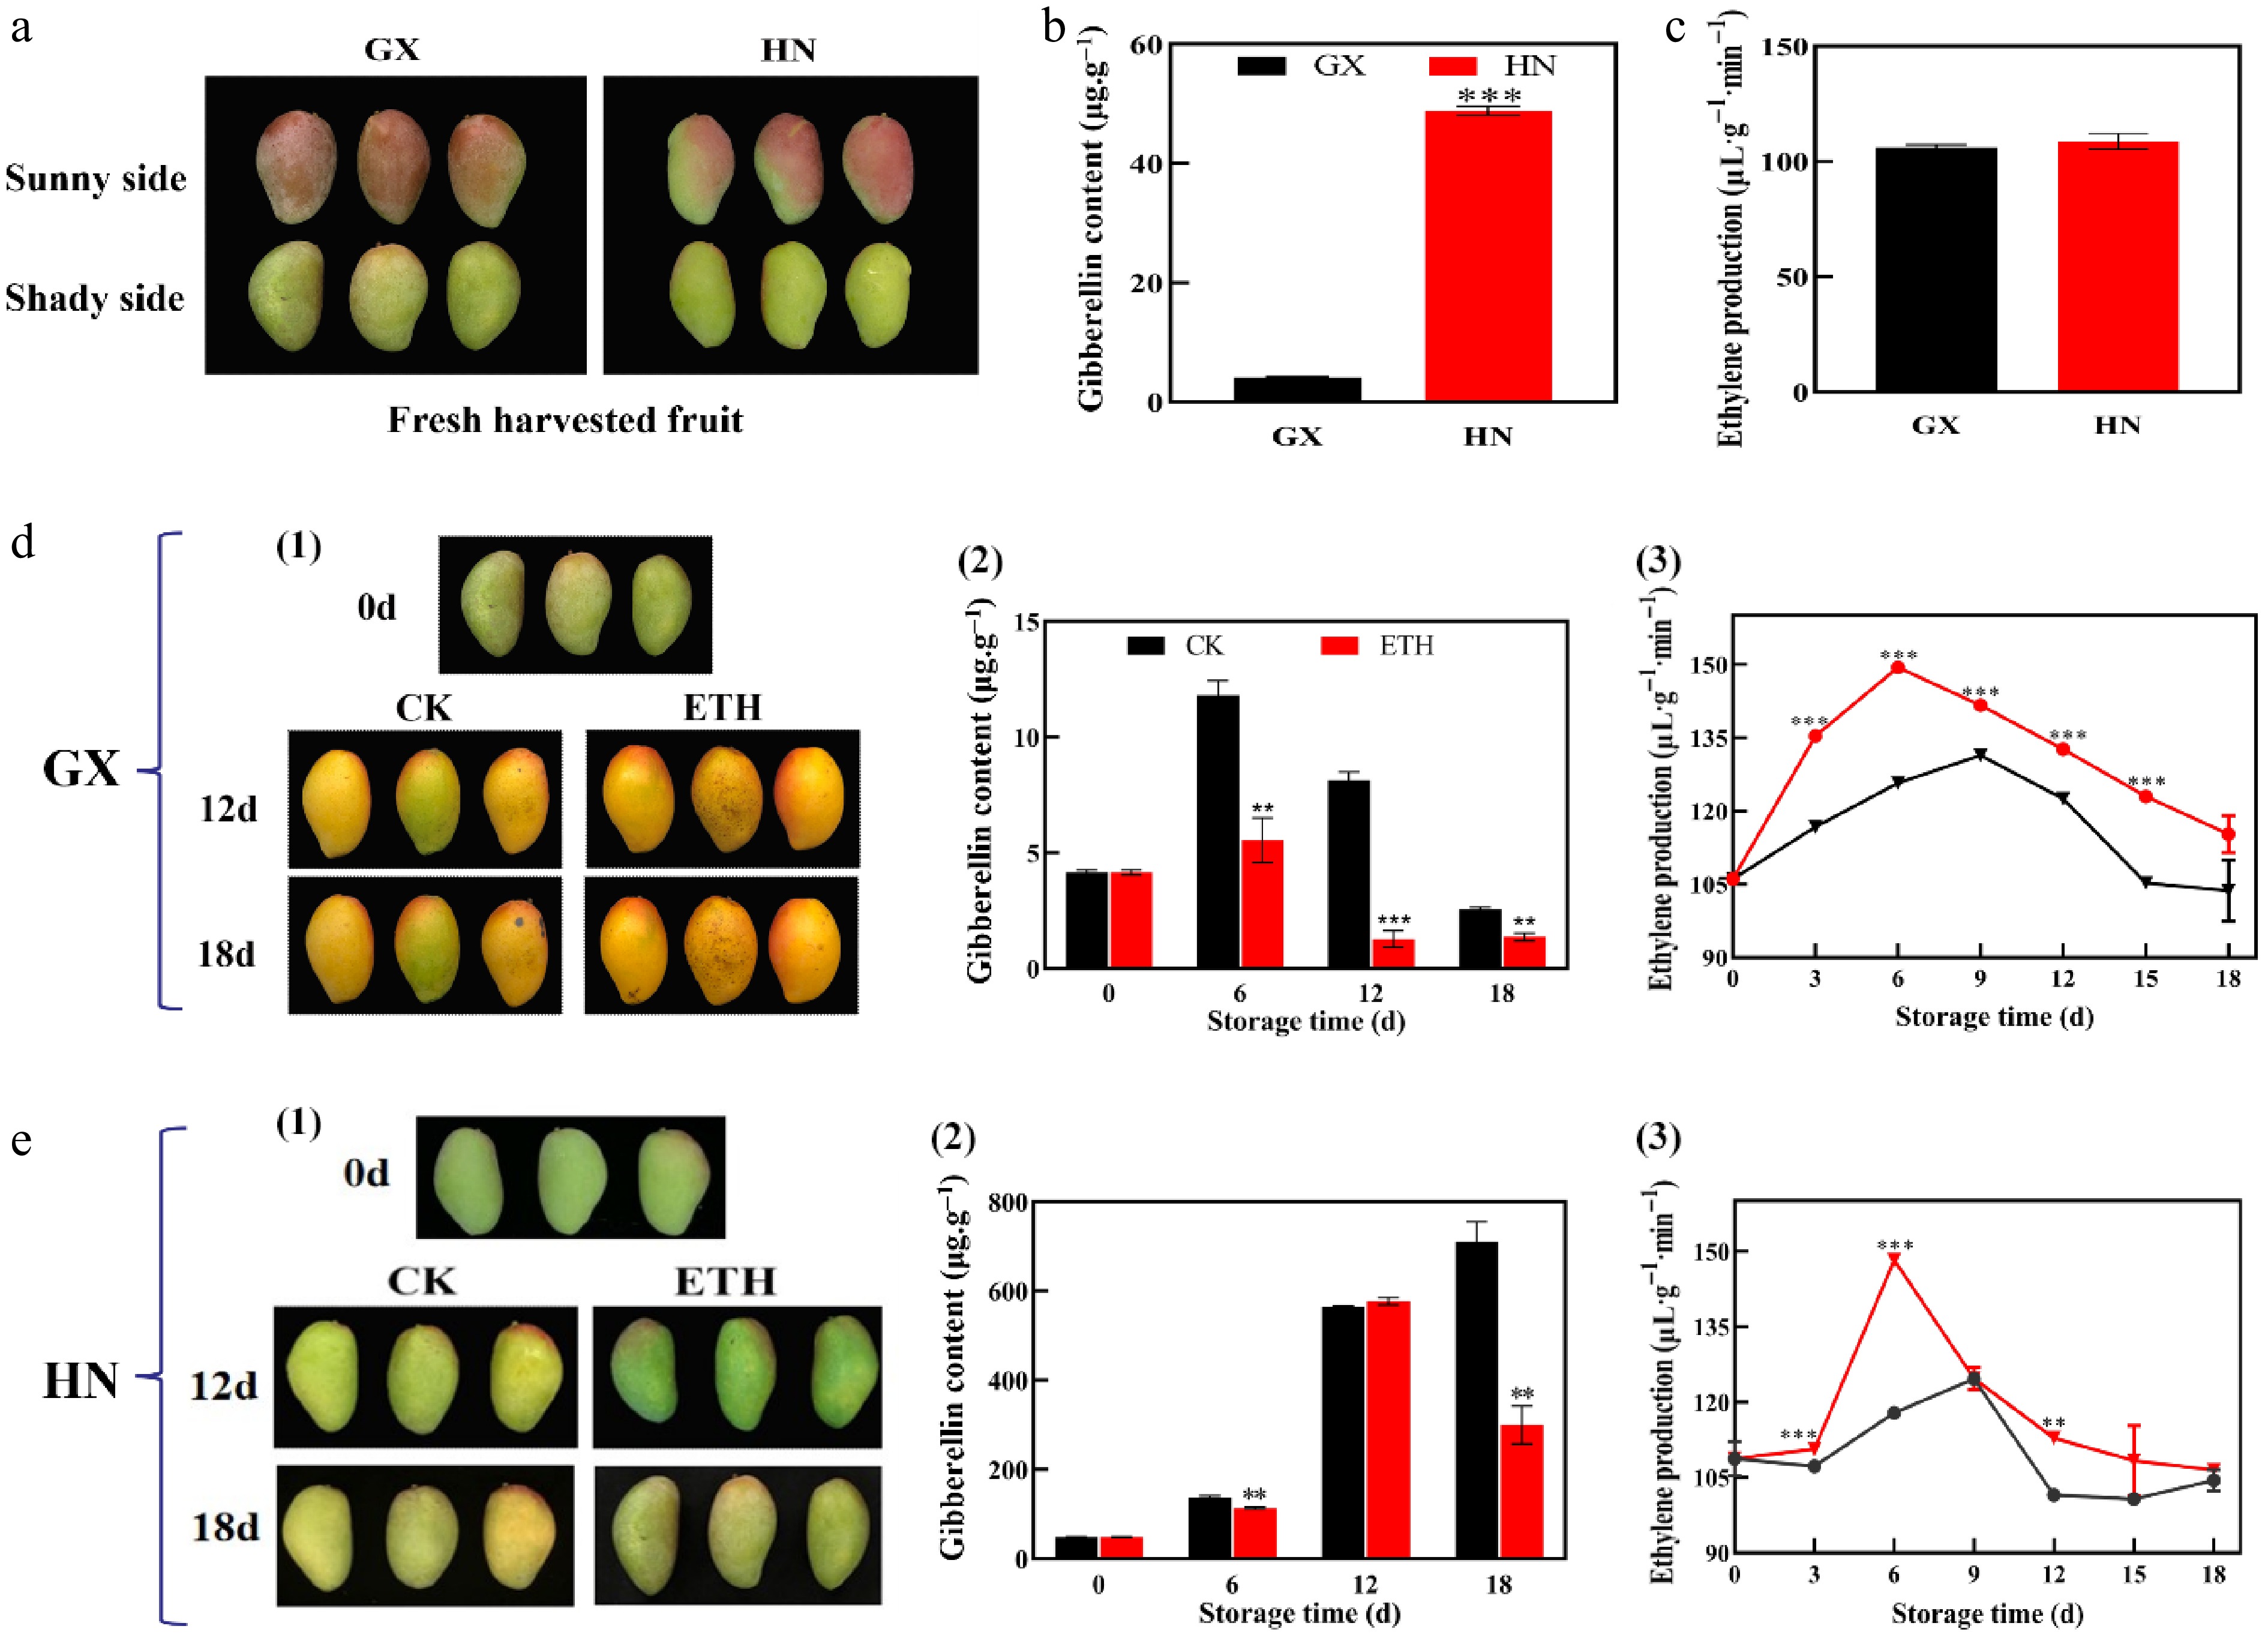
Figure 1.
The initial contents of GA3, ethylene, and their changes during storage of HN and GX mangoes. (a) Appearance and morphology of fresh harvested 'Guifei' mangoes. (b) GA3 content of fresh harvested fruit. (c) Ethylene production of fresh harvested fruit. (d1) Fruit appearance at 0, 12, and 18 d postharvest, (d2) GA3 content, and (d3) ethylene production of GX, and (e) HN mangoes during the storage. The bars represent the standard error in the mean of triplicates. Asterisks over bars indicate differences between treatments with statistical significance set at ** p < 0.01, *** p < 0.001.
-
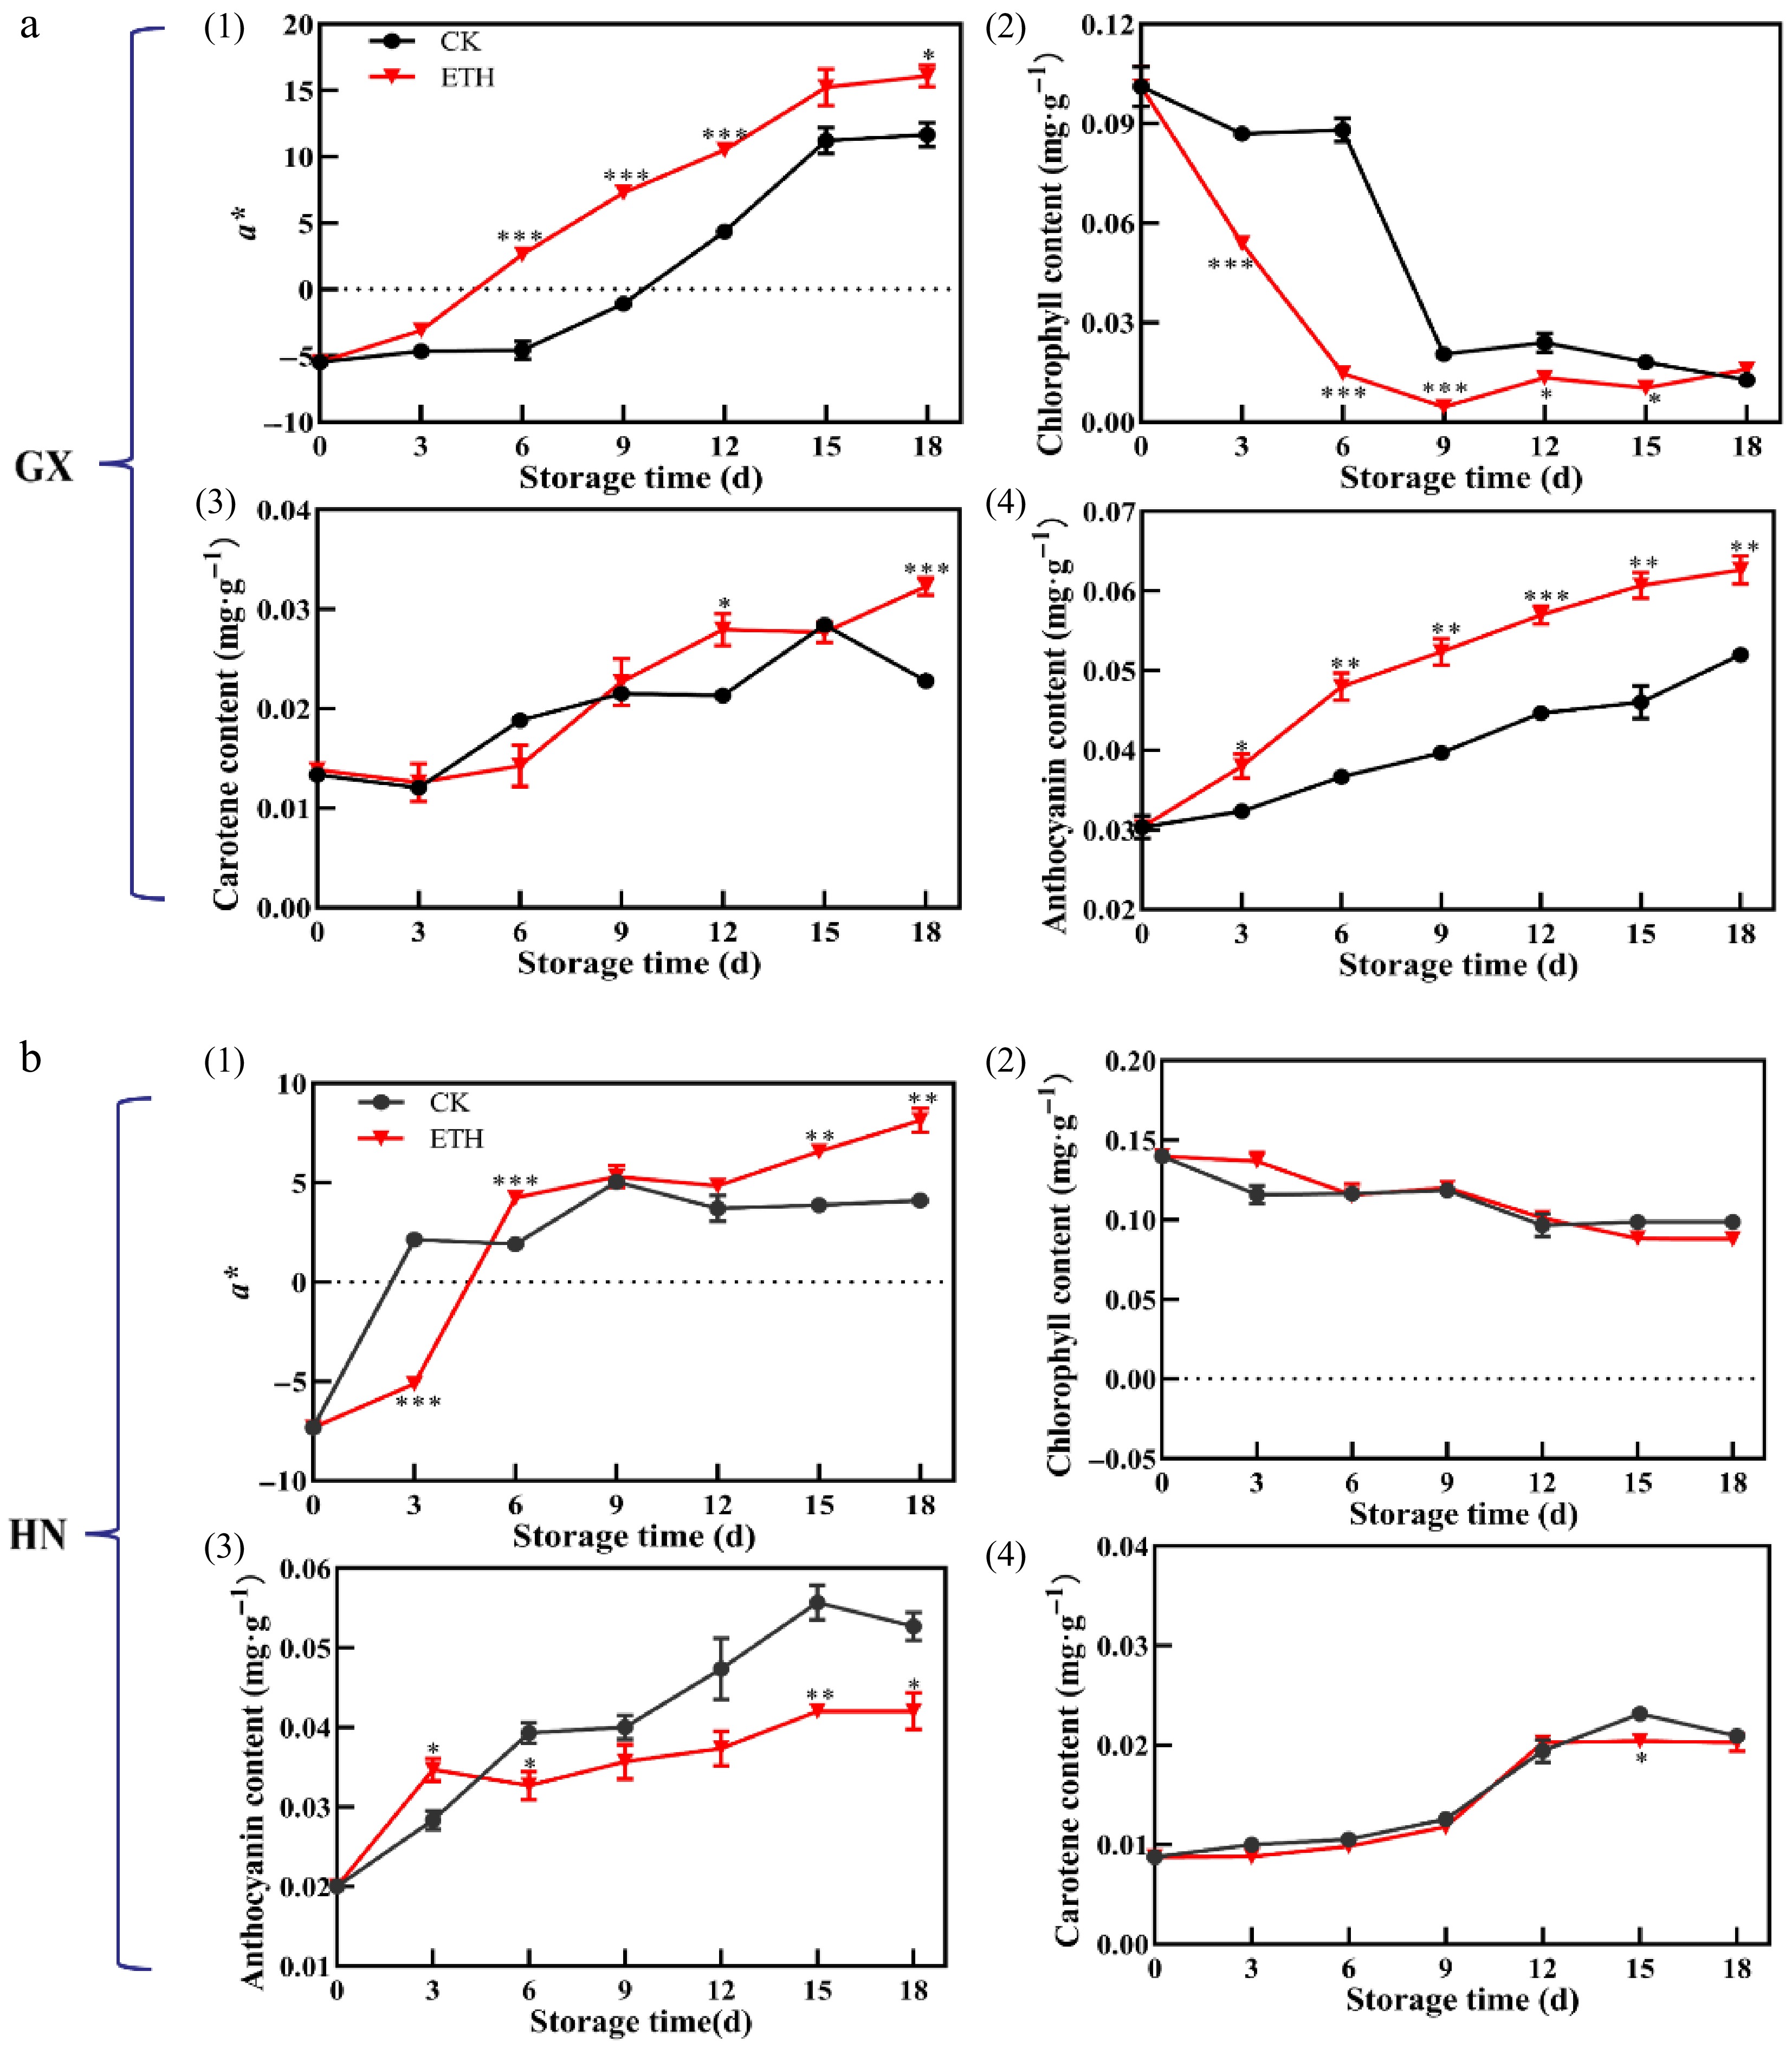
Figure 2.
Changes in peel color and pigment contents during storage of (a) GX and (b) HN mangoes. (1) a* value, (2) chlorophyll content, (3) anthocyanin content, and (4) carotenoid content. The bars represent the standard error in the mean of triplicates. Asterisks over bars indicate differences between treatments with statistical significance set at ** p < 0.01, *** p < 0.001.
-
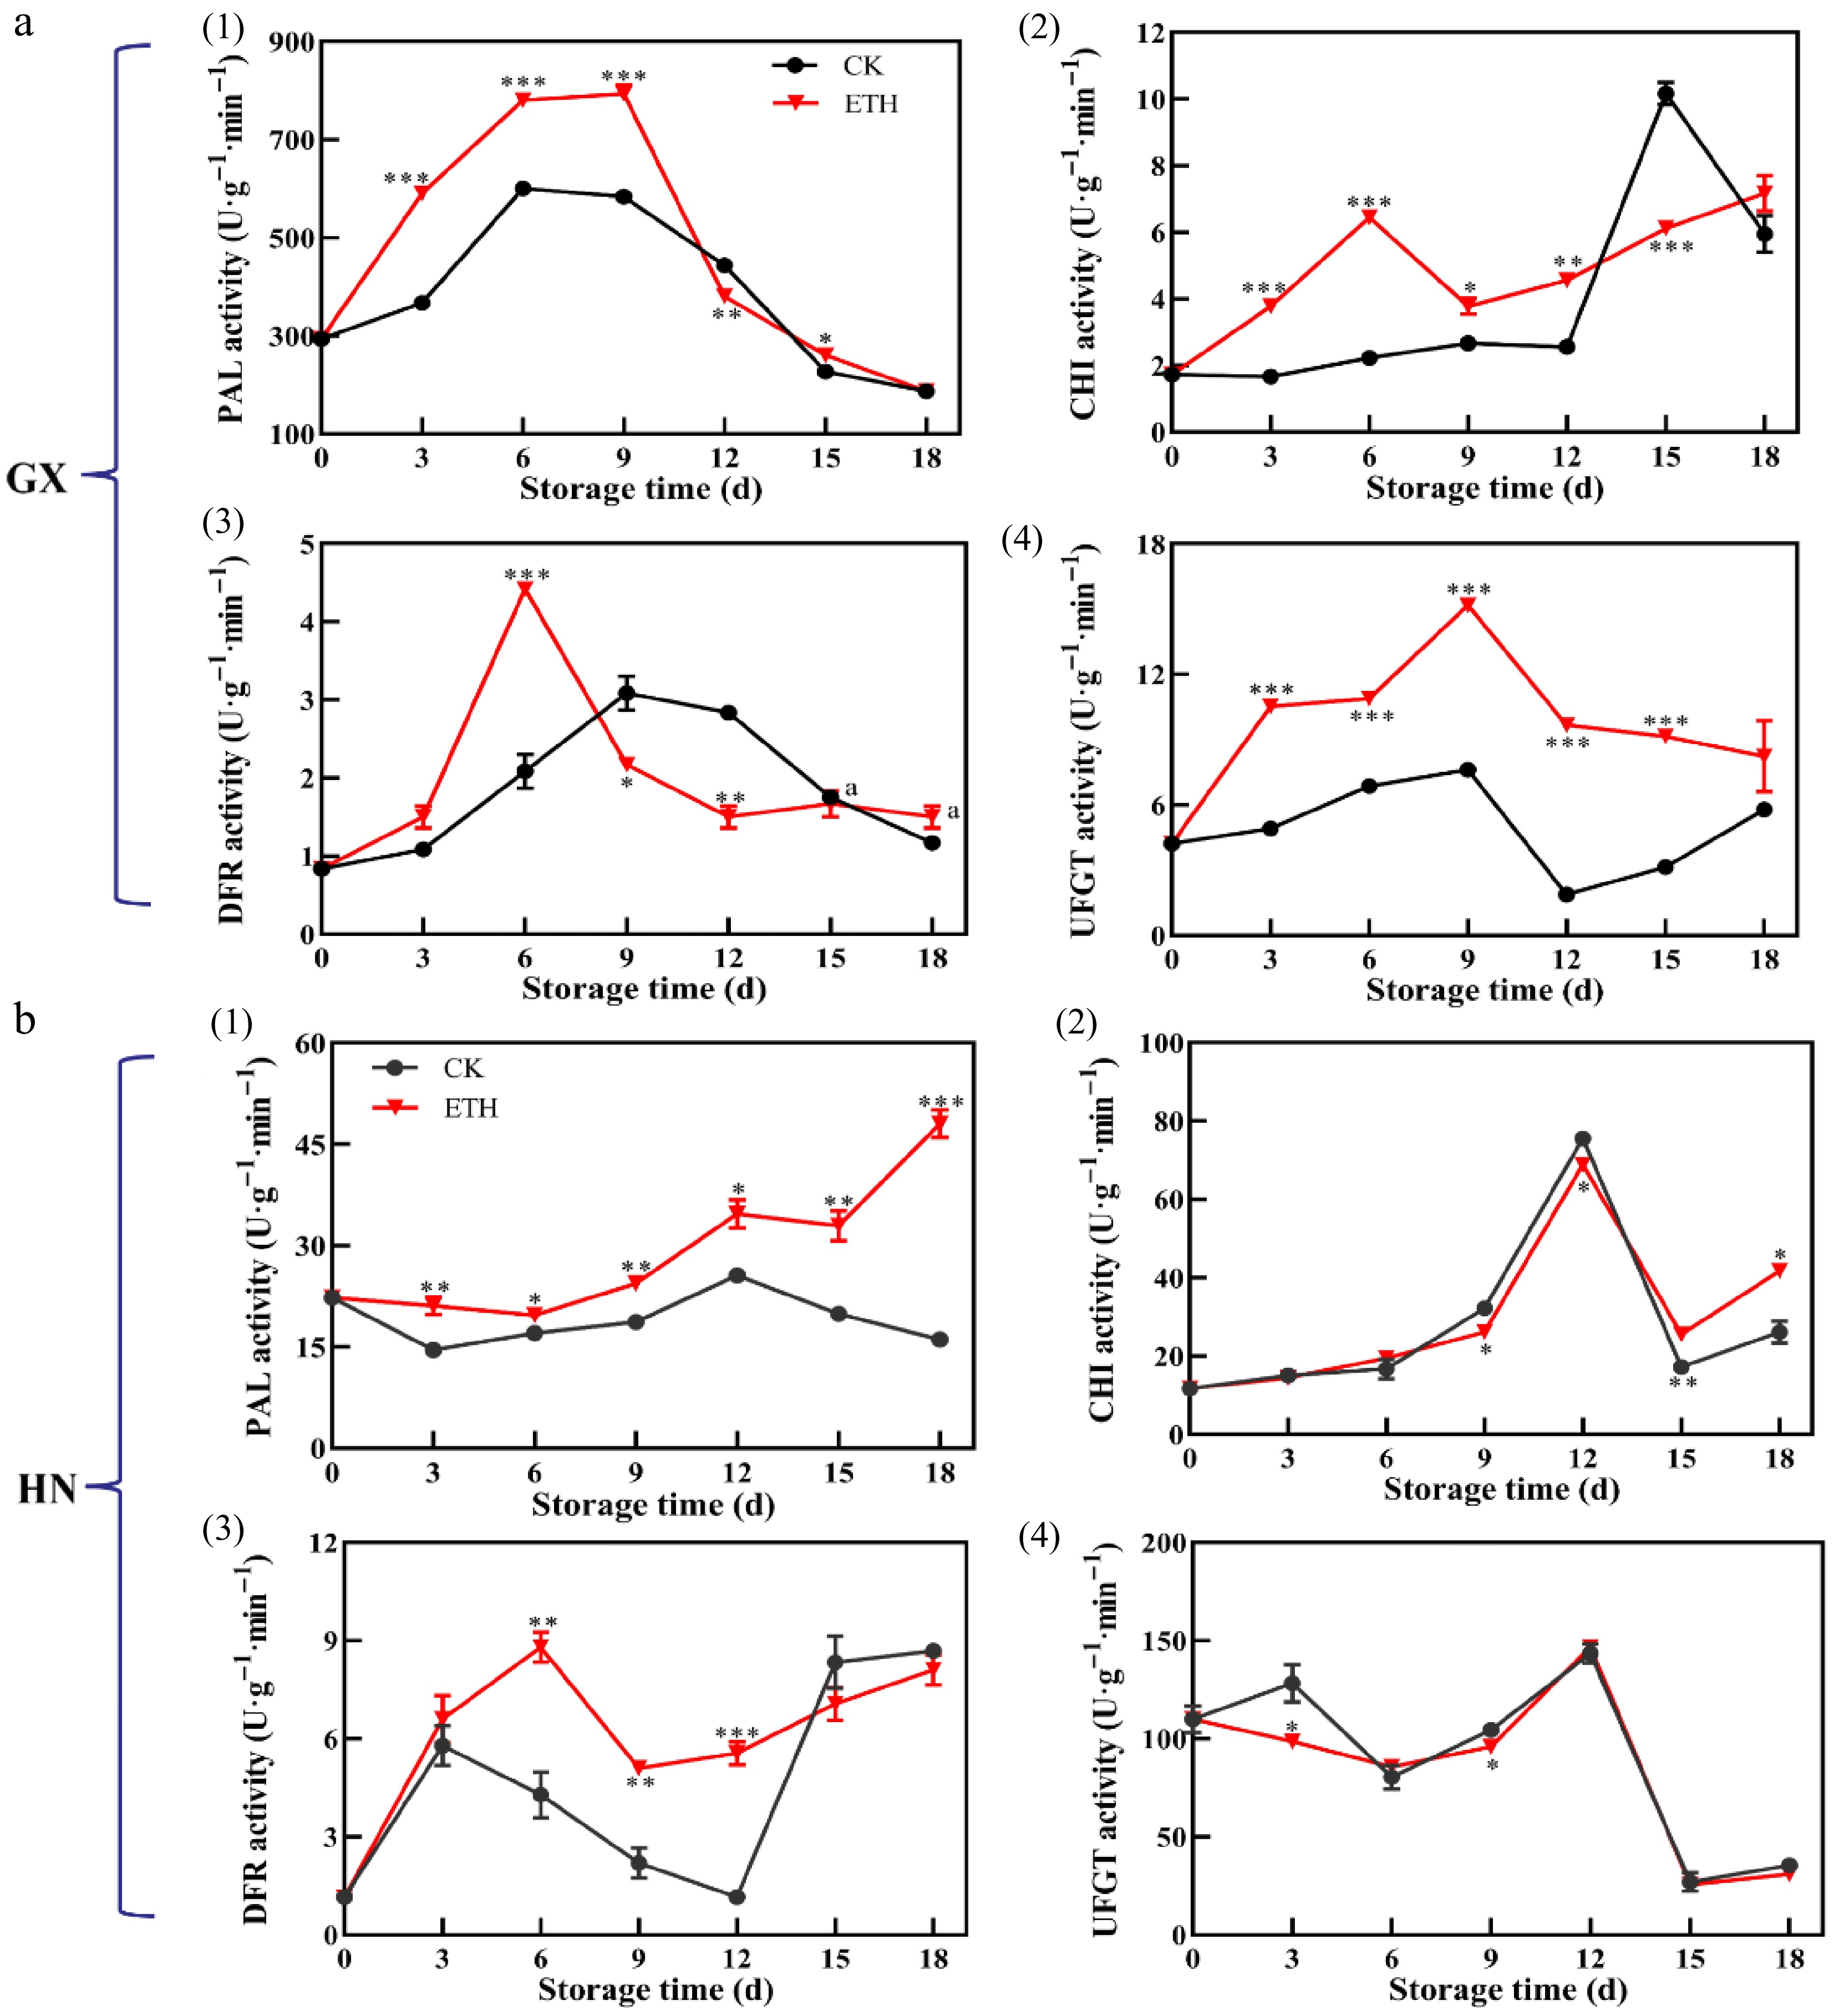
Figure 3.
Changes in enzyme activities related to anthocyanin biosynthesis in (a) GX and (b) HN mangoes during storage. (1) PAL activity, (2) CHI activity, (3) DFR activity, and (4) UFGT activity. The bars represent the standard error in the mean of triplicates. Asterisks over bars indicate differences between treatments with statistical significance set at ** p < 0.01, *** p < 0.001.
-
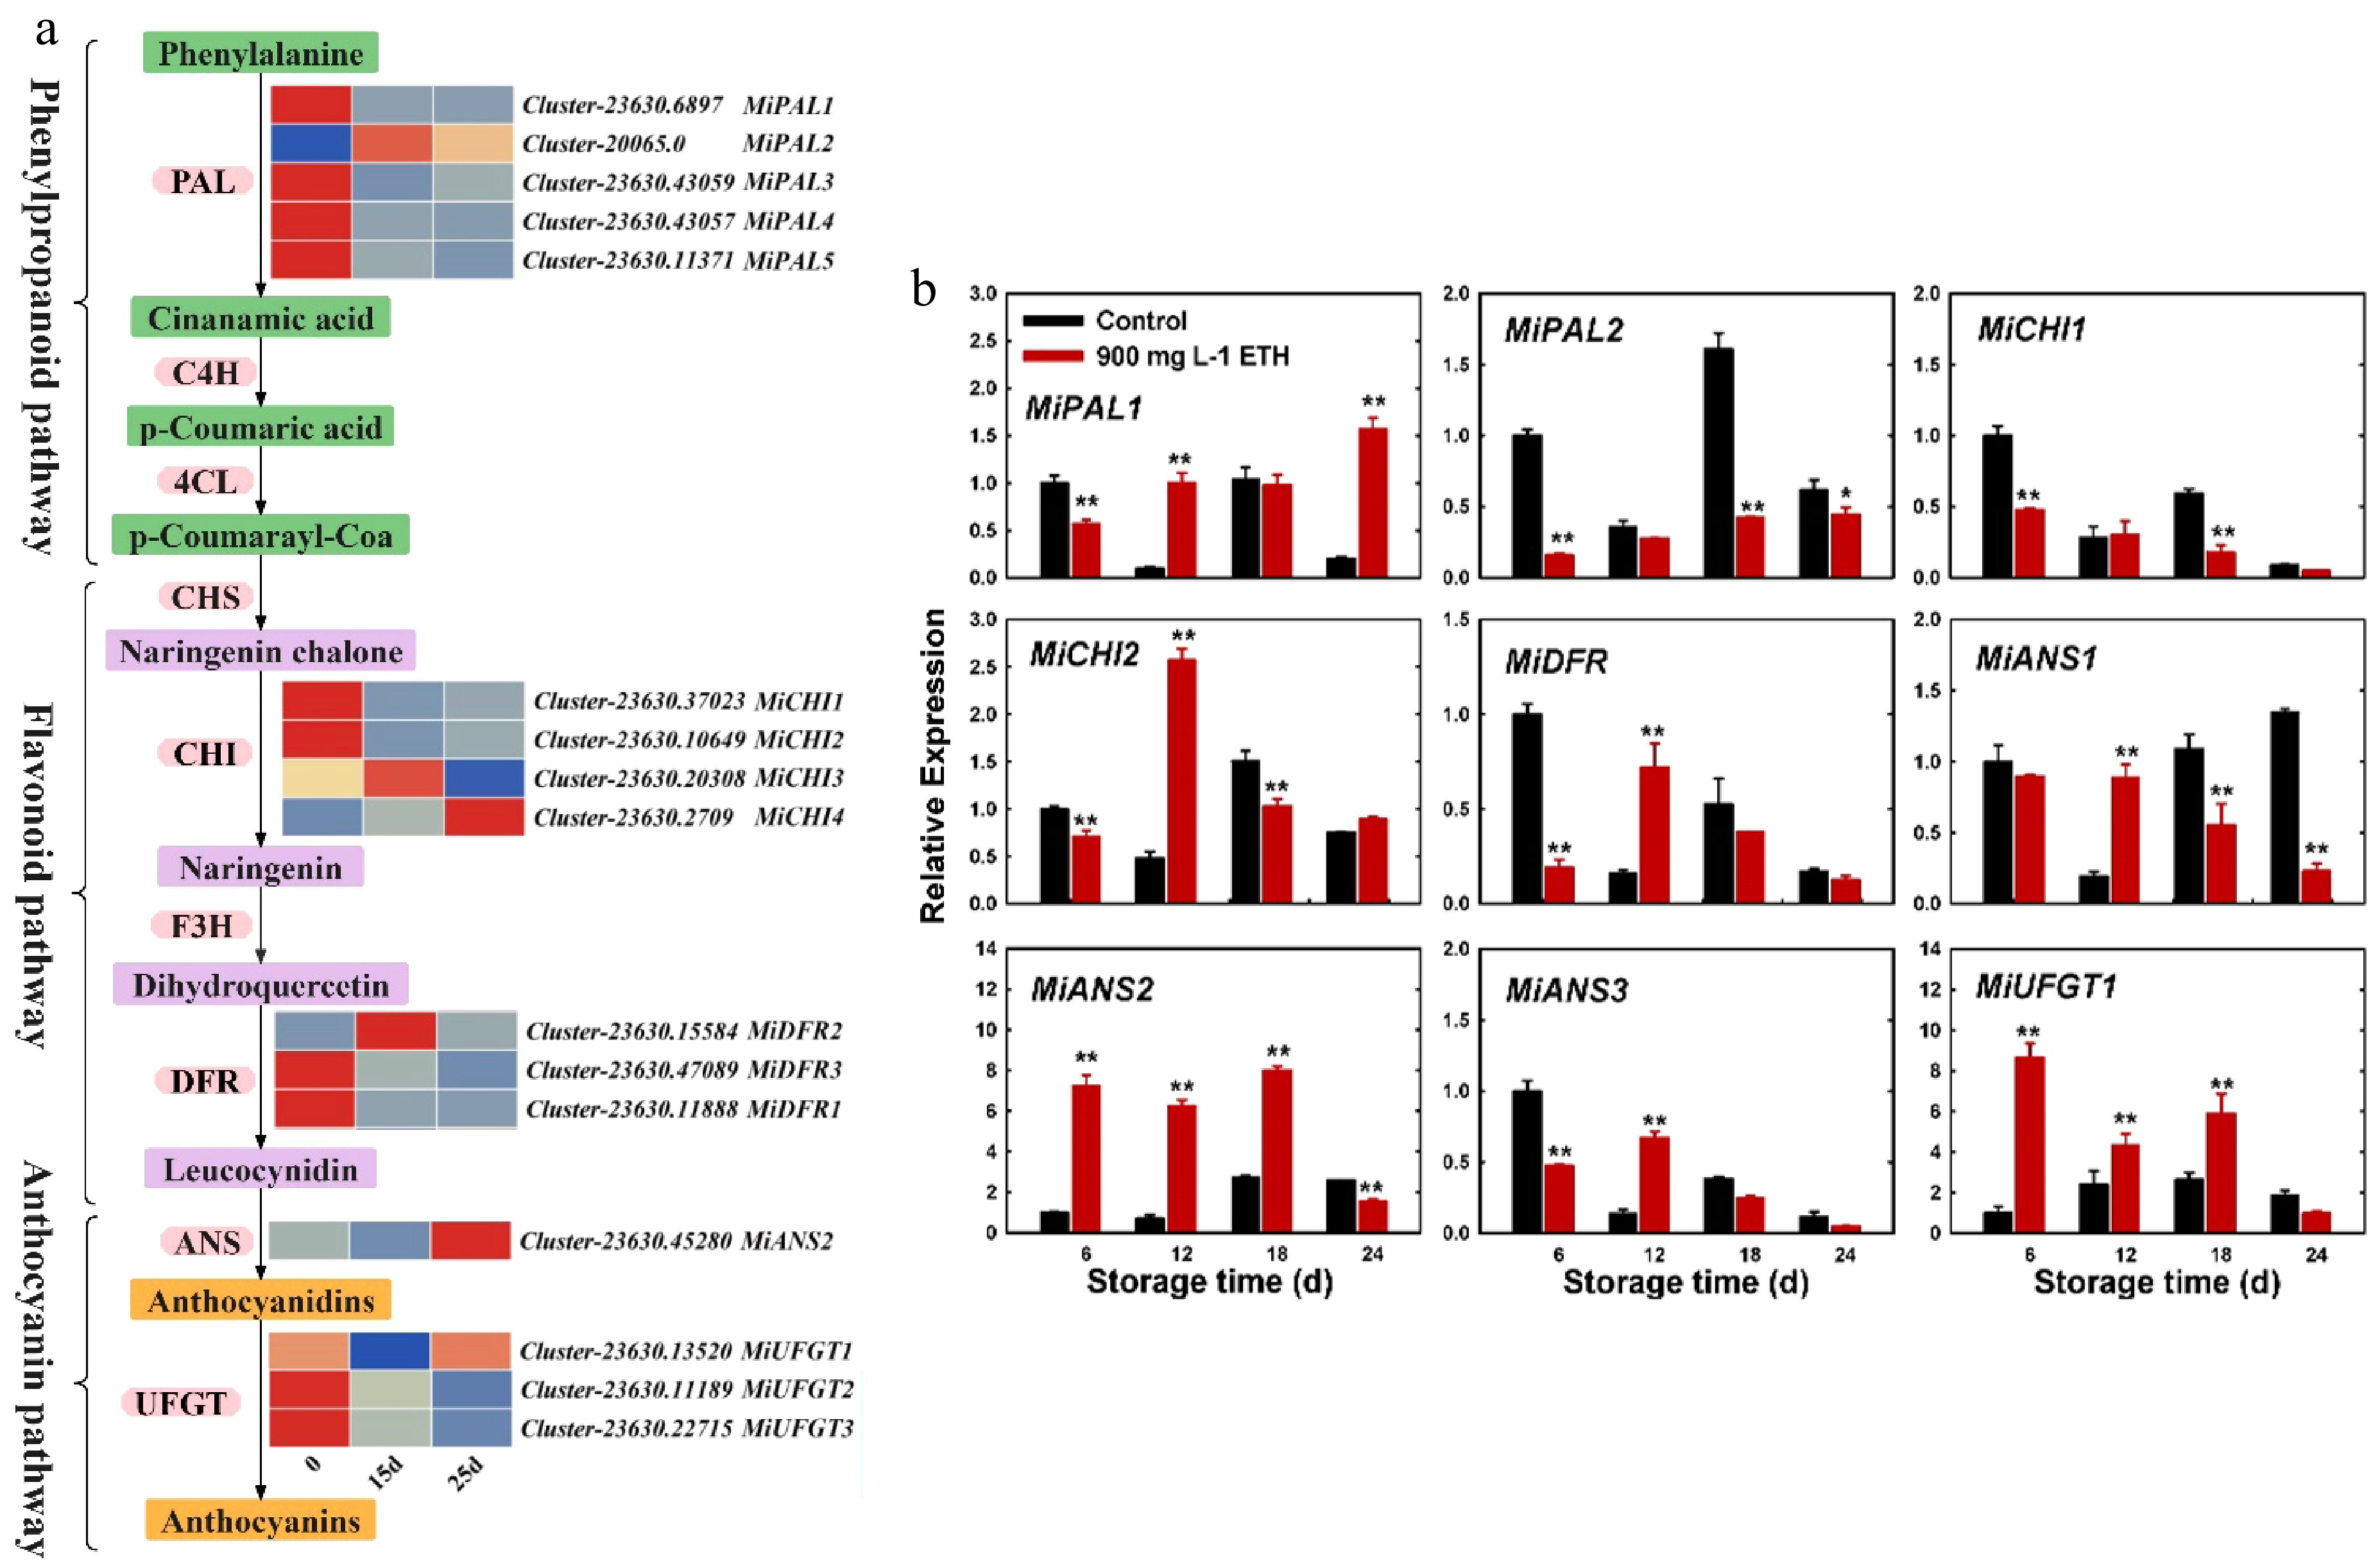
Figure 4.
Expression patterns of genes involved in anthocyanin biosynthesis of control- and ETH-treated HN mangoes during storage. Anthocyanin synthesis pathway and heatmap of differentially expressed genes according to (a) FPKM, and (b) expression levels by qRT-PCR. The bars represent the standard error in the mean of triplicates. Asterisks over bars indicate differences between treatments with statistical significance set at ** p < 0.05.
-
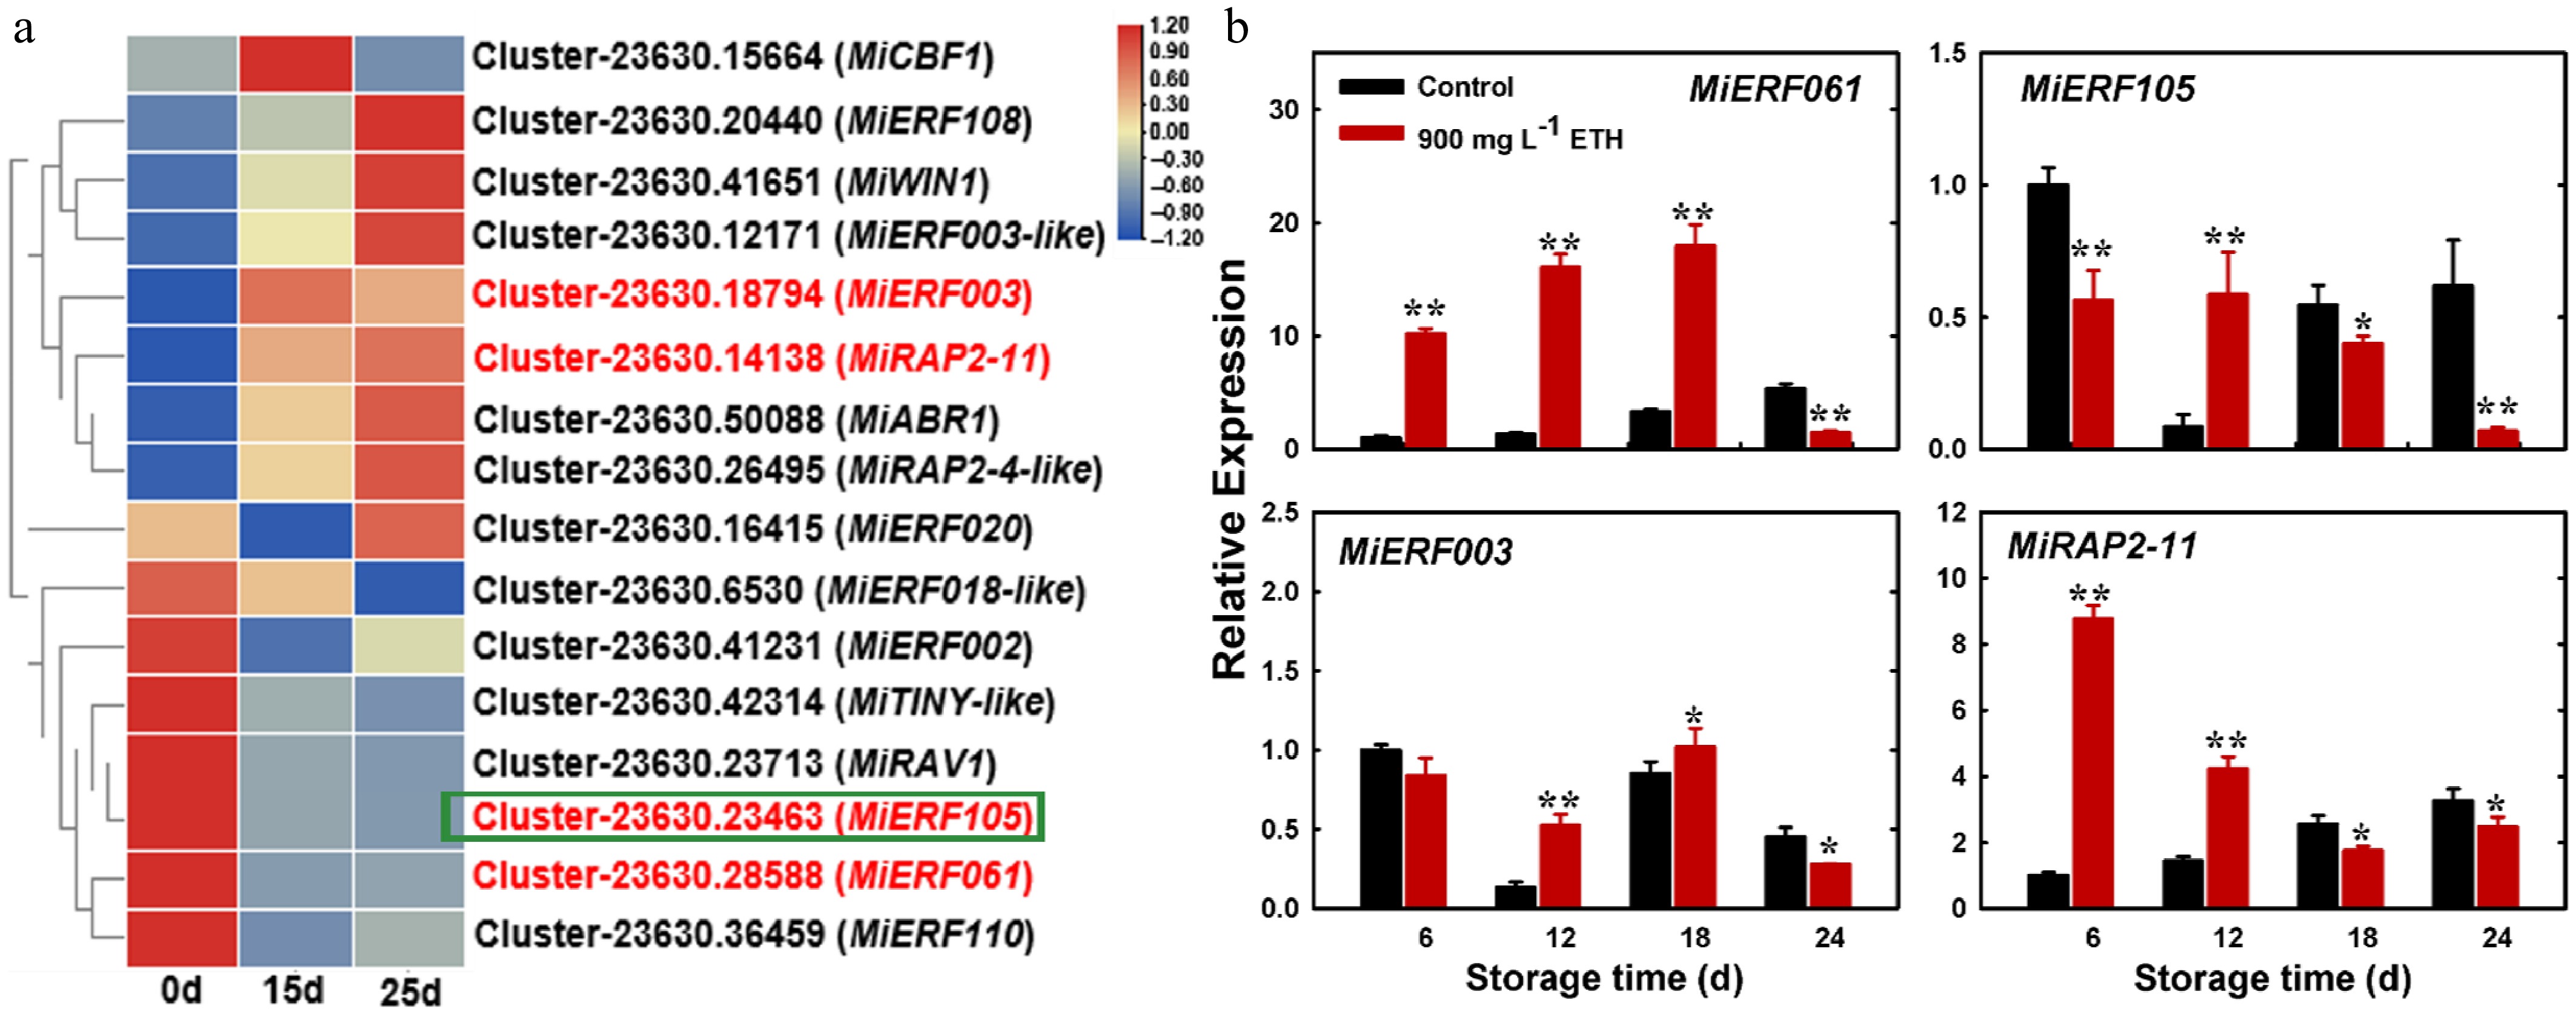
Figure 5.
Effects of ETH treatment on the expression of transcription factor ERF in Hainan mangoes during storage. Heatmap of differentially expressed genes according to (a) FPKM, and (b) relative expression levels by qRT-PCR. Asterisks over bars indicate differences between treatments with statistical significance set at * p < 0.05, ** p < 0.01.
-
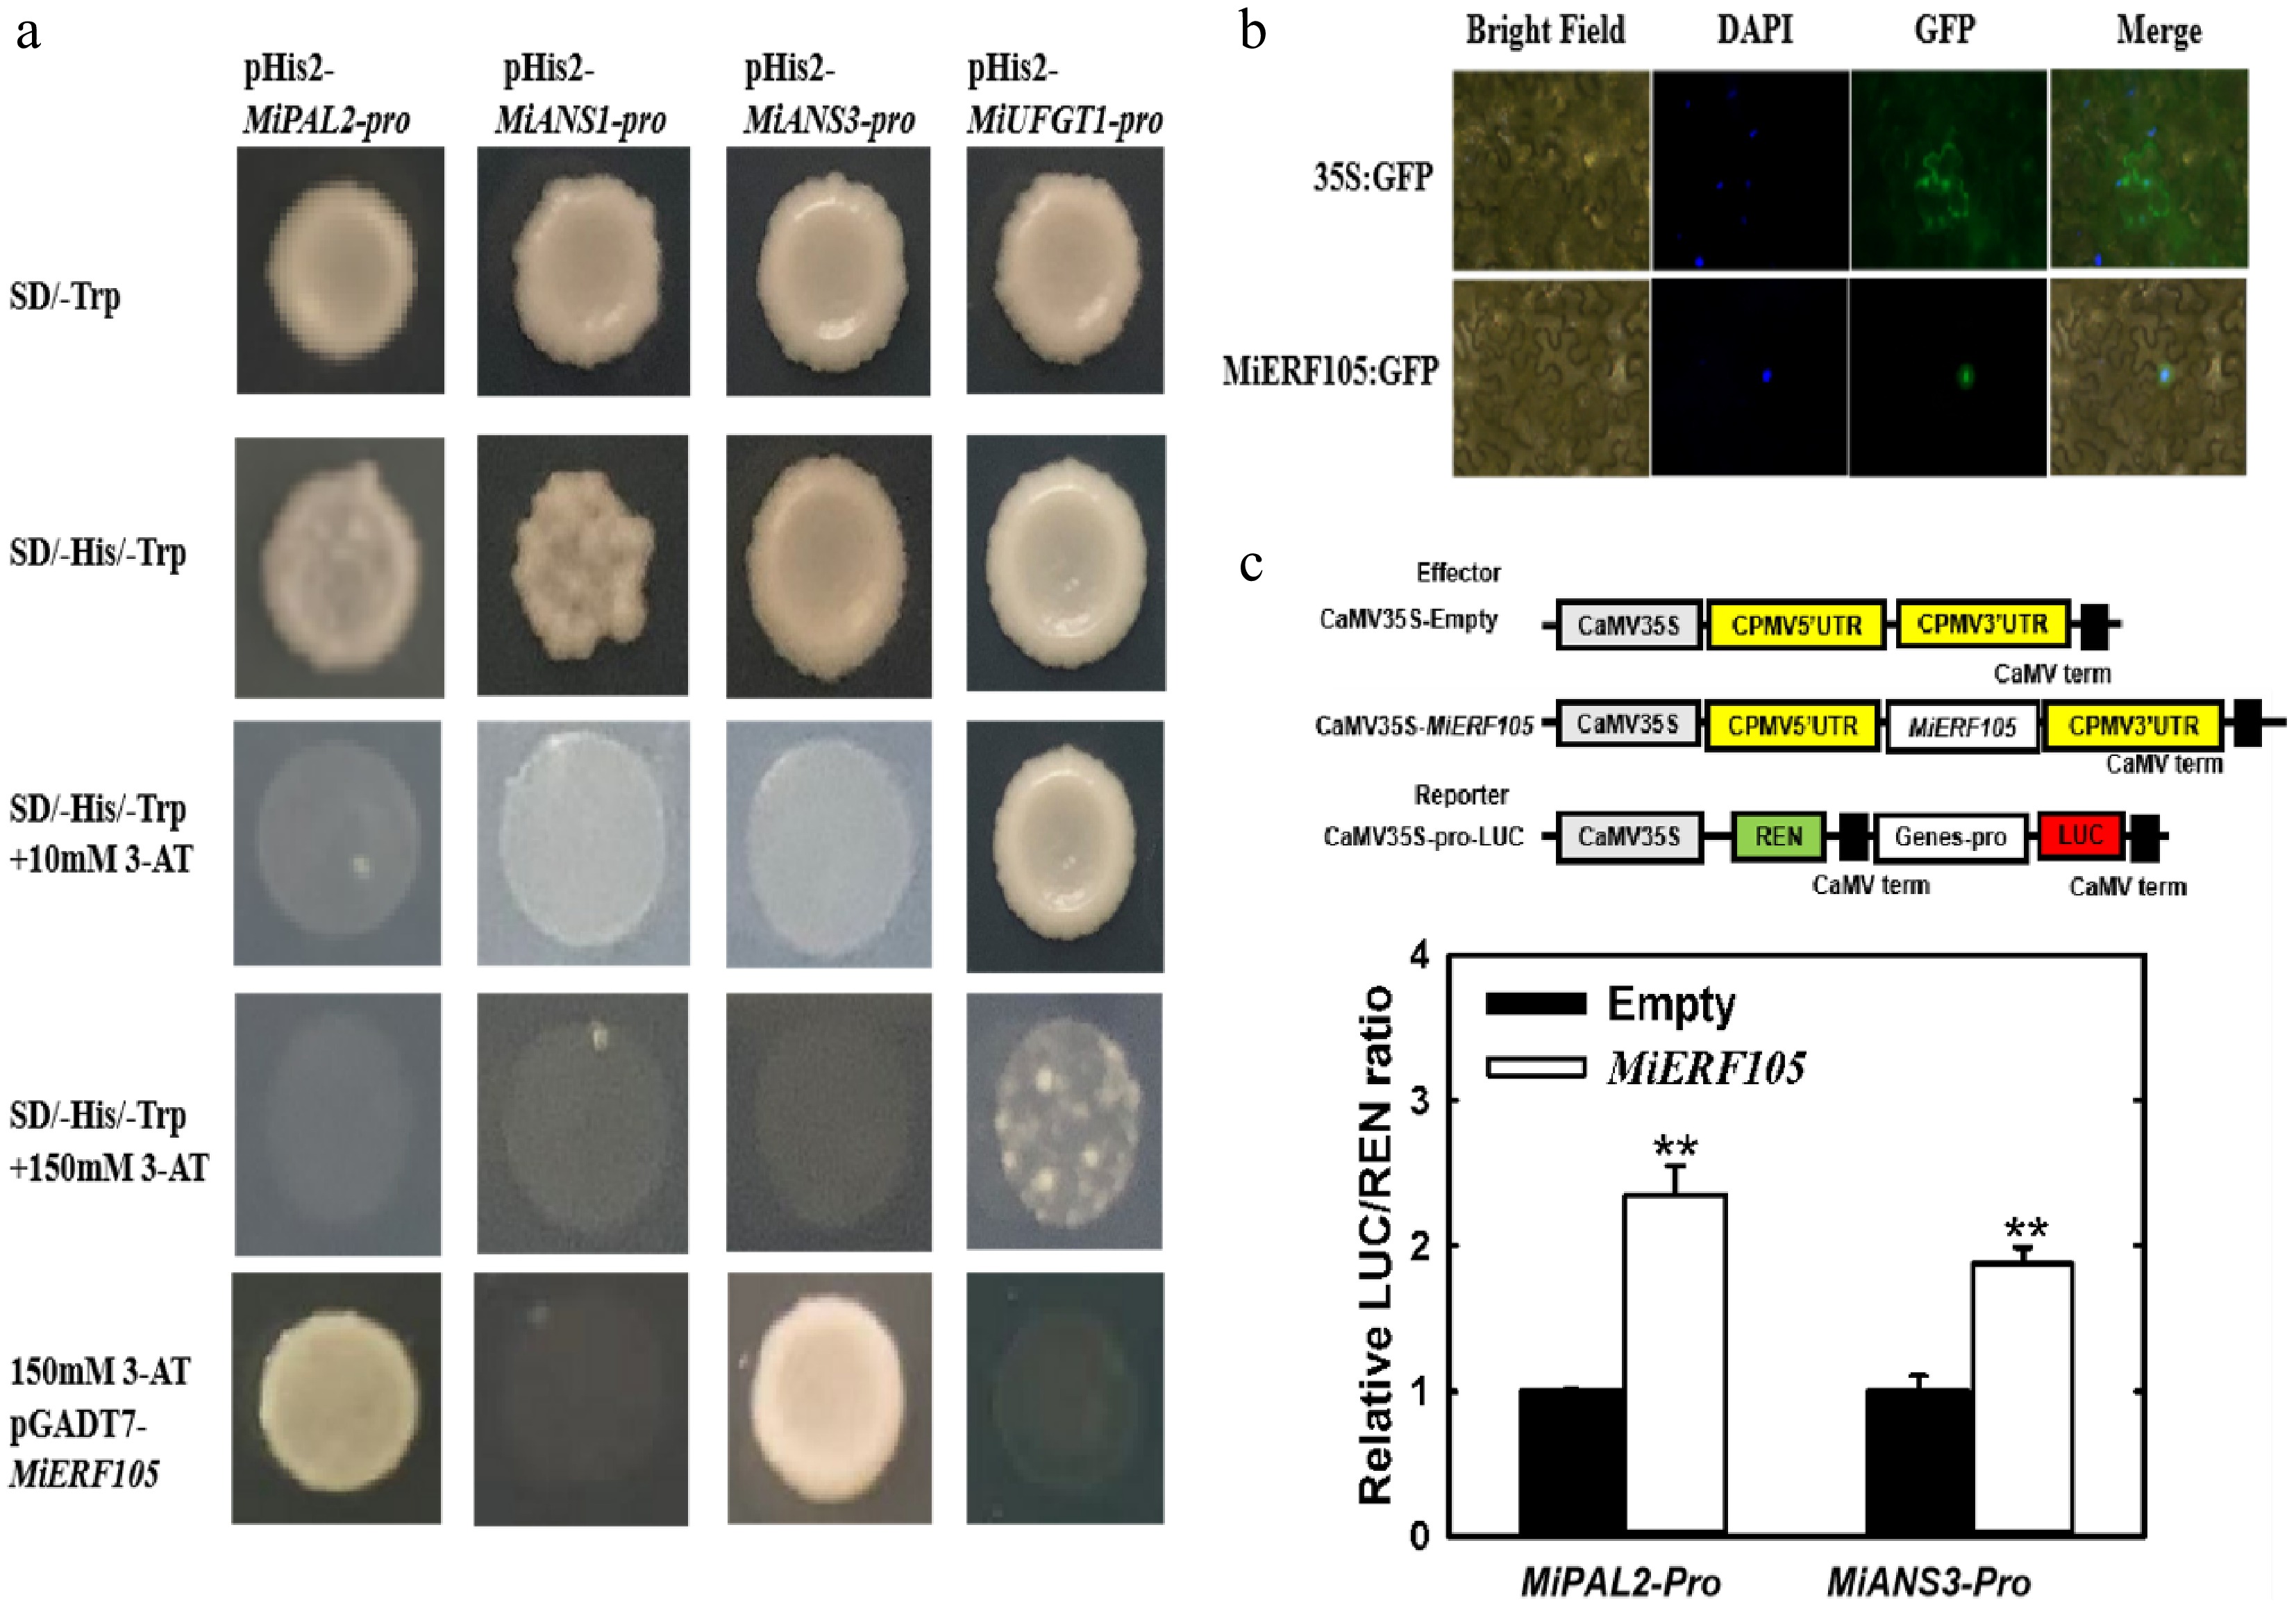
Figure 6.
MiERF105 directly binds to the promoters of MiPAL2 and MiANS3 to induce their expression. (a) MiERF105 activates the MiPAL2 and MiANS3 promoter fragments in yeast. (b) Subcellular localization of MiERF105 in tobacco. (c) MiERF105 binds to MiPAL2-pro and MiANS3-pro to activate their expression, shown by a dual-luciferase assay. The bars represent the standard error in the mean of triplicates. Asterisks over bars indicate differences between treatments with statistical significance set at p < 0.05.
-
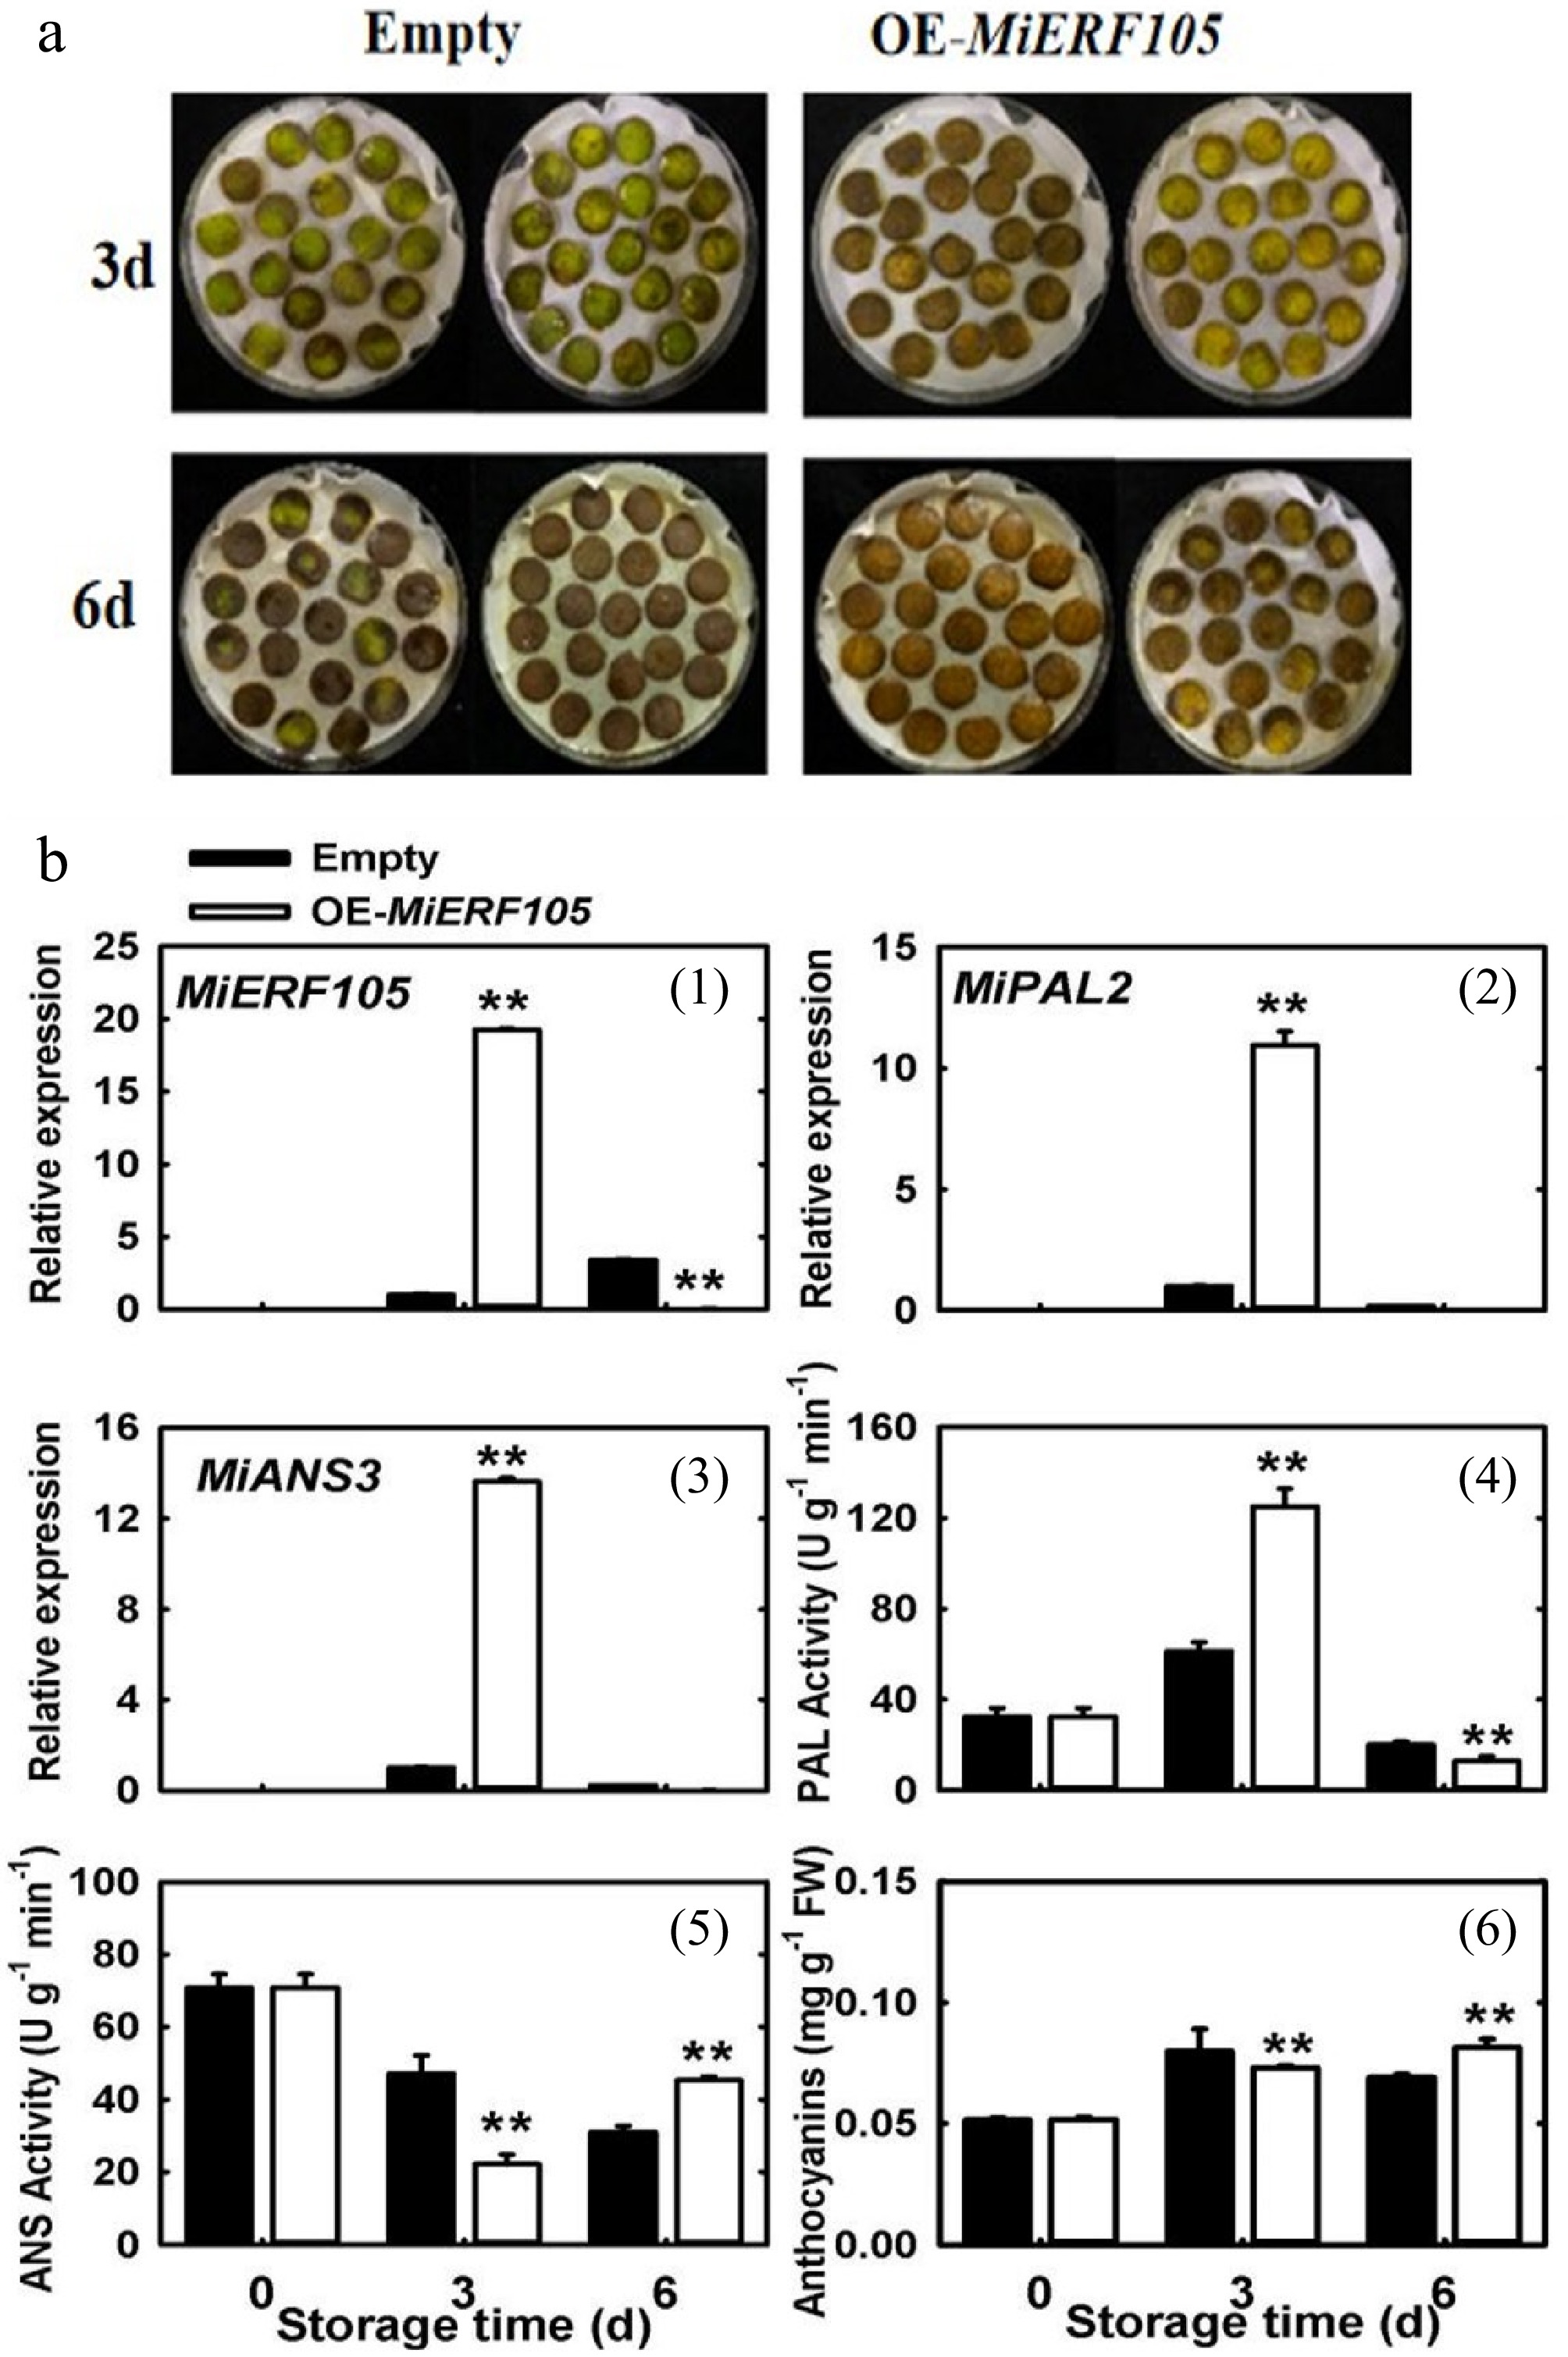
Figure 7.
Transient overexpression of MiERF105 in mango peel. (a) Phenotypic photograph of mango slices after MiERF105 infection, and the effects of MiERF105 overexpression on color-related parameters. (b) Expression levels of (1) MiERF105, (2) MiPAL2 gene, and (3) MiANS3 gene, (4) PAL activity, (5) ANS activity, and (6) anthocyanin content. The bars represent the standard error in the mean of triplicates. Asterisks over bars indicate differences between treatments with statistical significance set at ** p < 0.05.
-
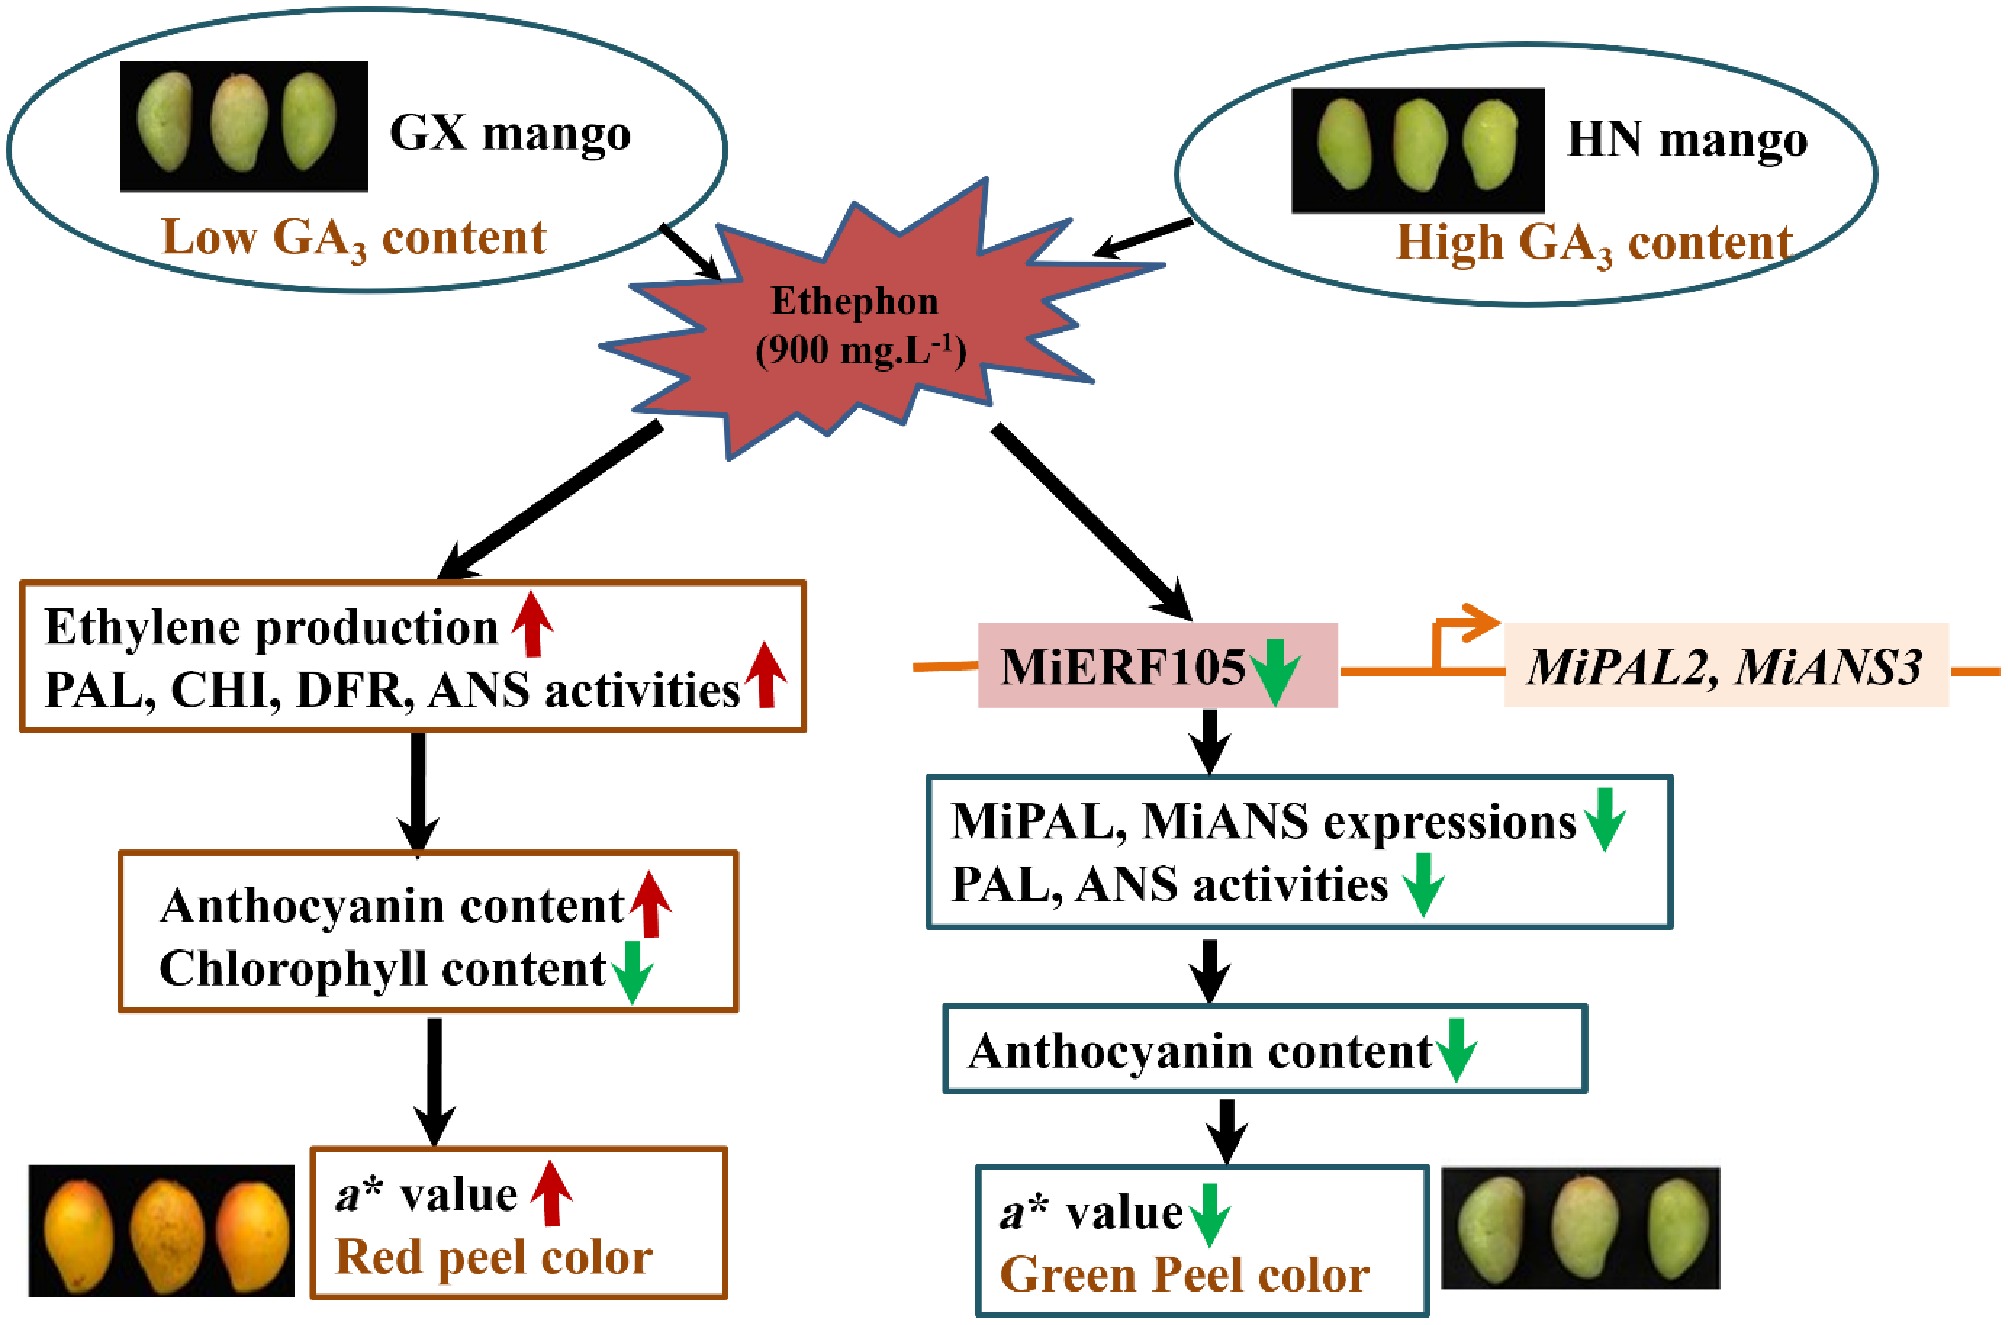
Figure 8.
Working model showing the relationship between ethylene production and GA3 concentration and the inhibition of ERF105 on the coloration of 'Guifei' mango fruit. Upward arrows in red represent an increase compared to the control group, and downward arrows in green represent a decrease compared to the control group.
Figures
(8)
Tables
(0)