-
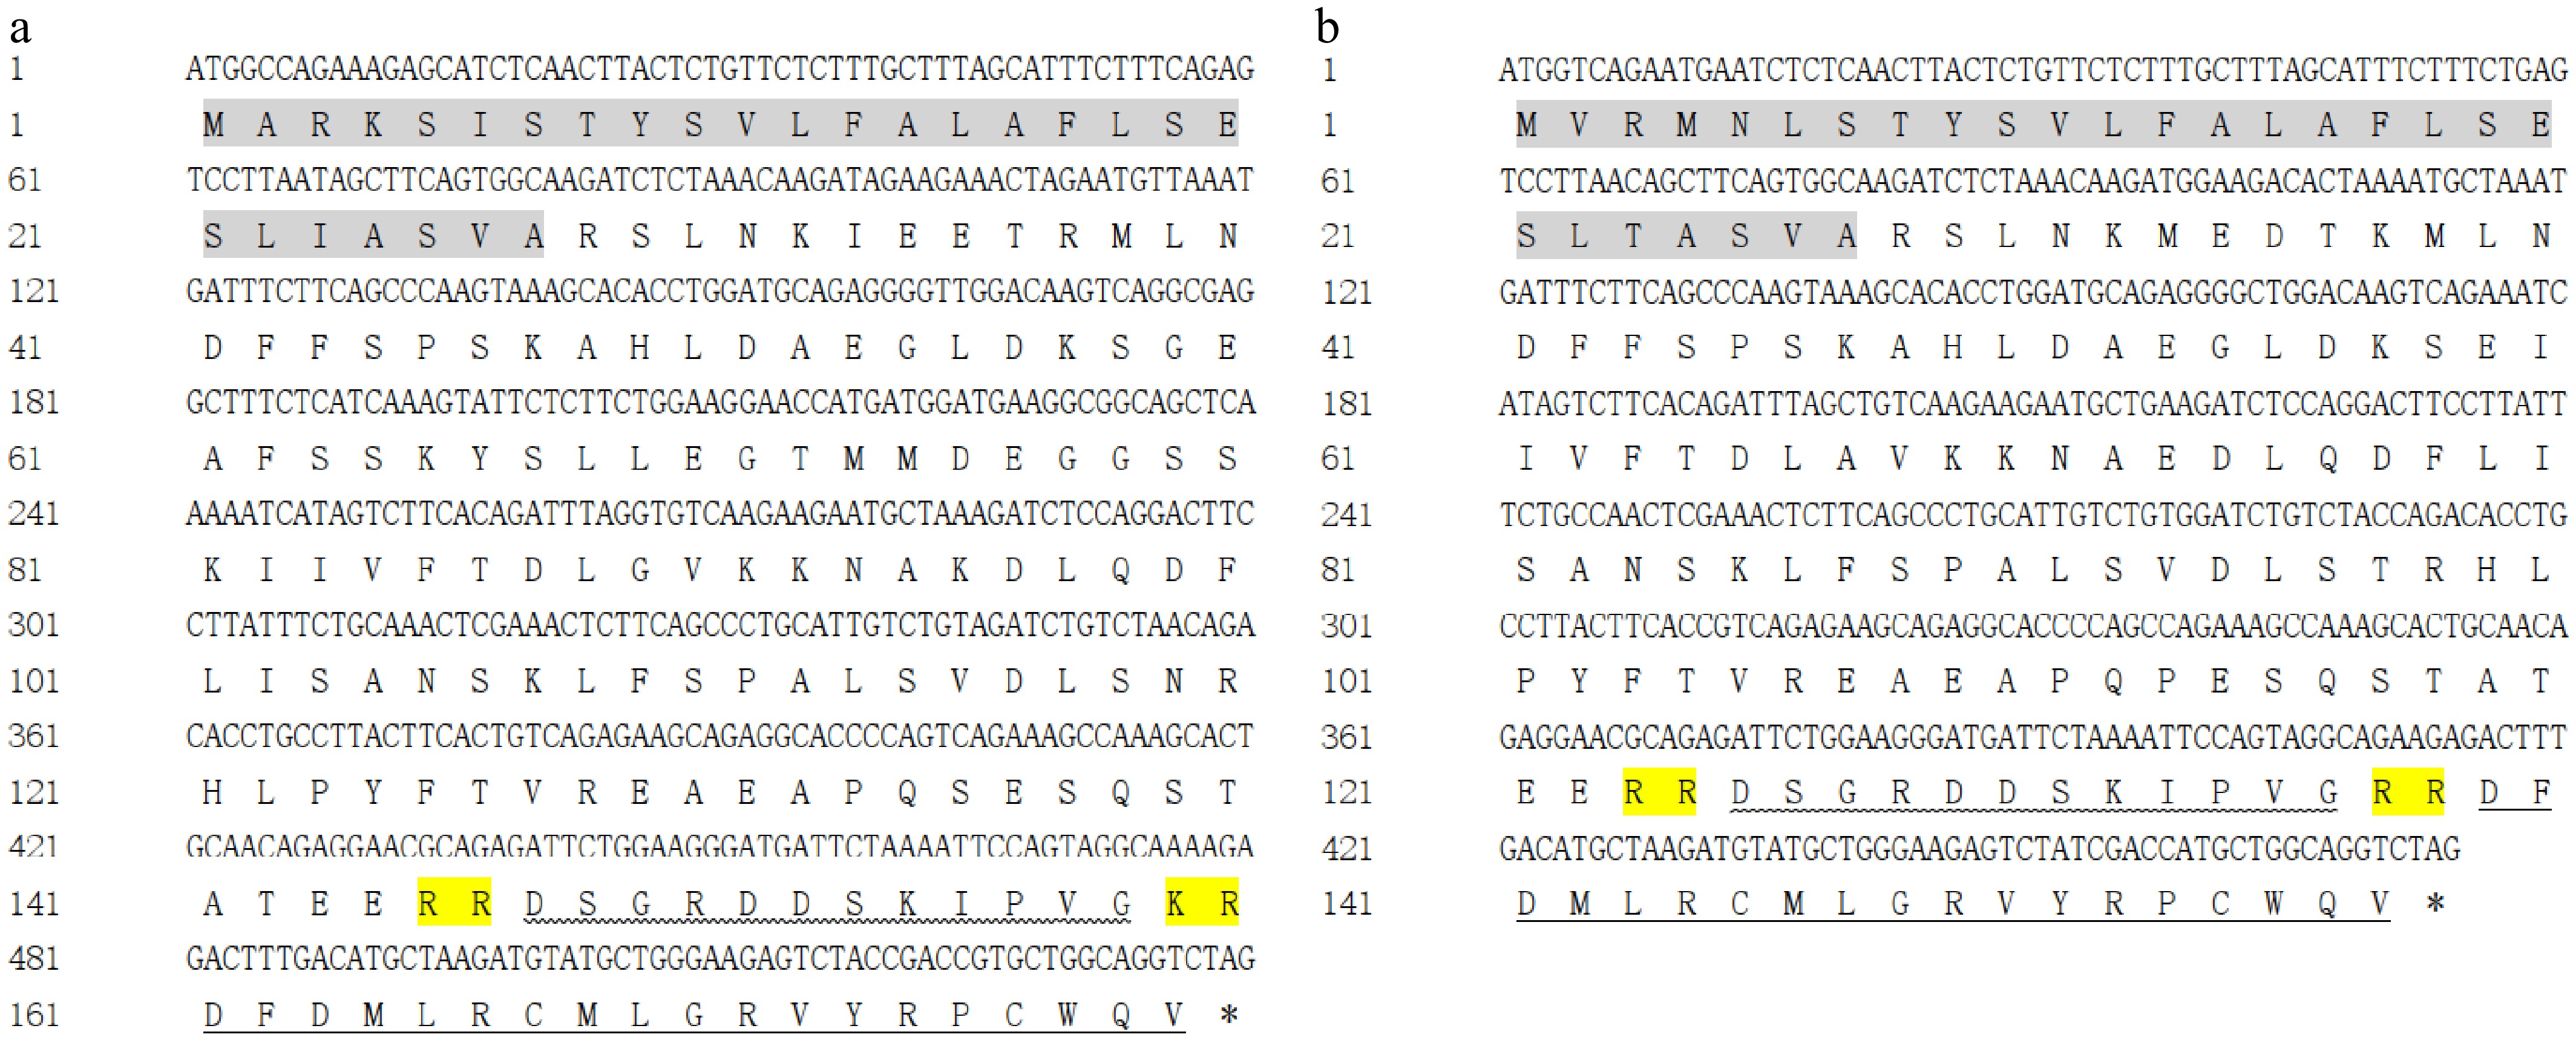
Figure 1.
Nucleotides and deduced amino acid sequences of pmcha and pmchb from Siberian sturgeon. The grey highlight indicates the signal peptide domains of pmcha and pmchb. The horizontal line represents the mature peptide region of MCH. The wavy line represents the MGRP region in PMCHa and PMCHb.
-
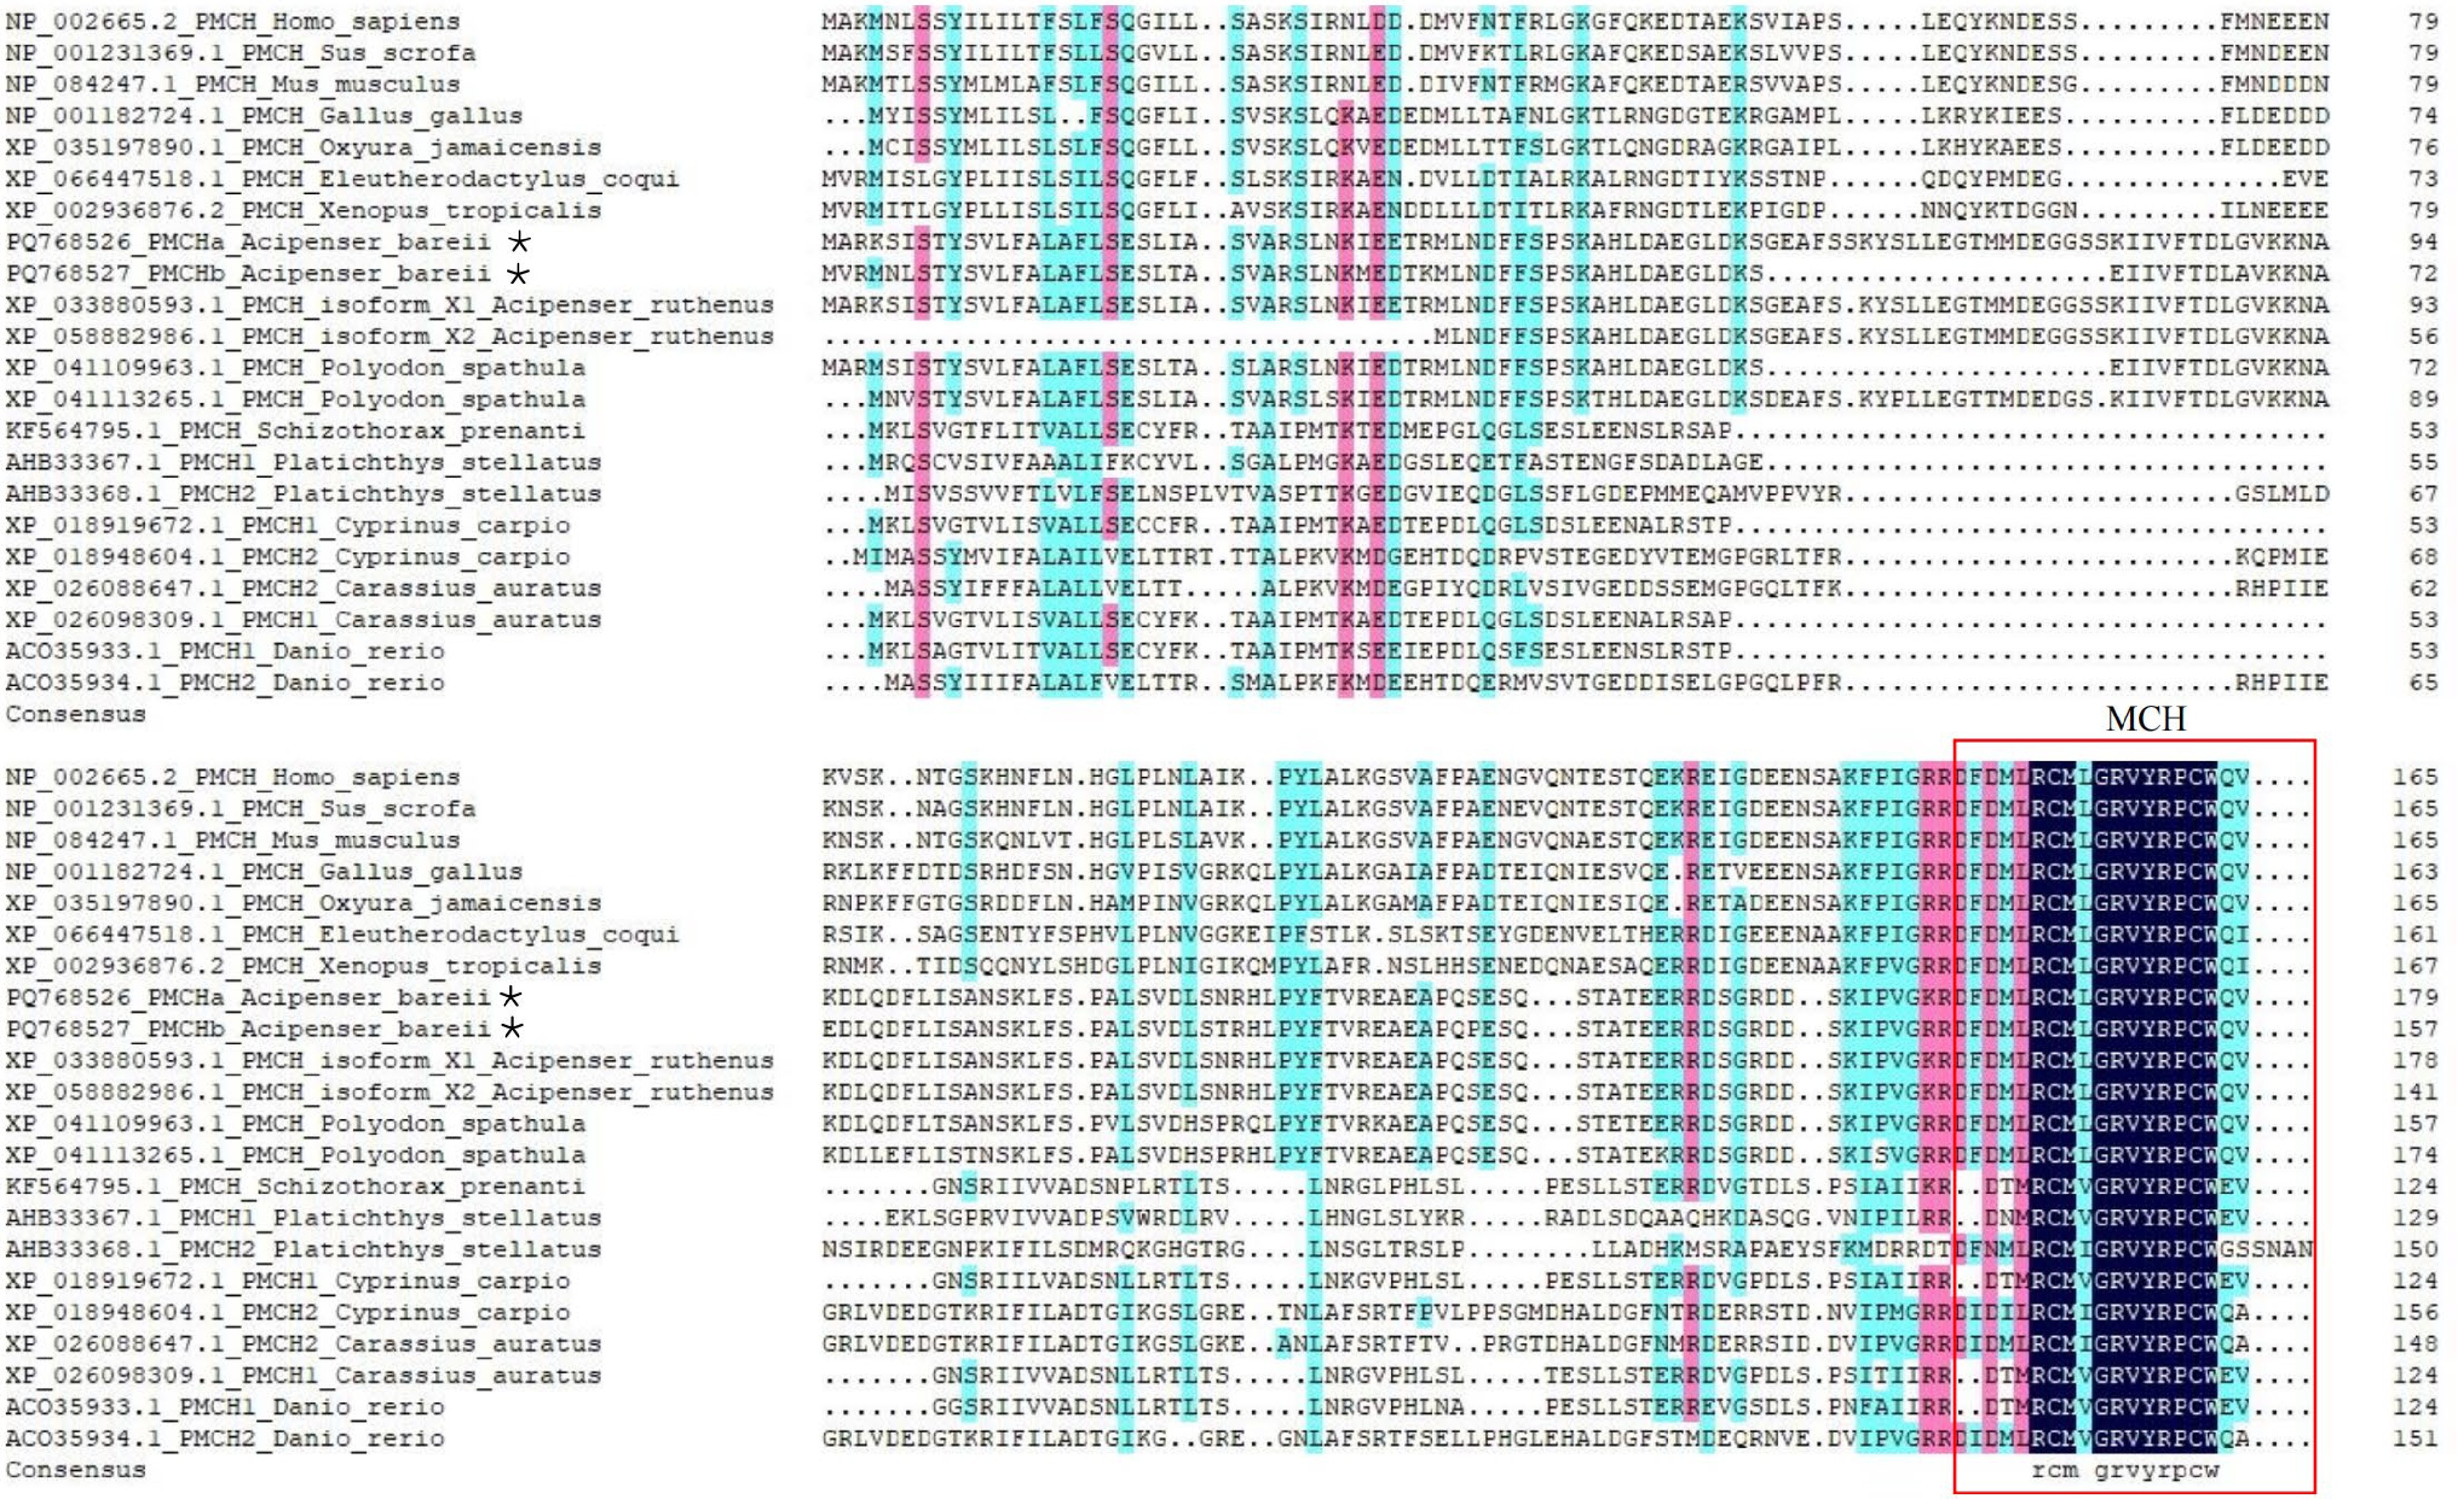
Figure 2.
The alignment of the deduced amino acid sequences of Siberian sturgeon pmch and other vertebrates. Black represents an amino acid consistency level of 100, pink represents 70, and blue represents 50.
-
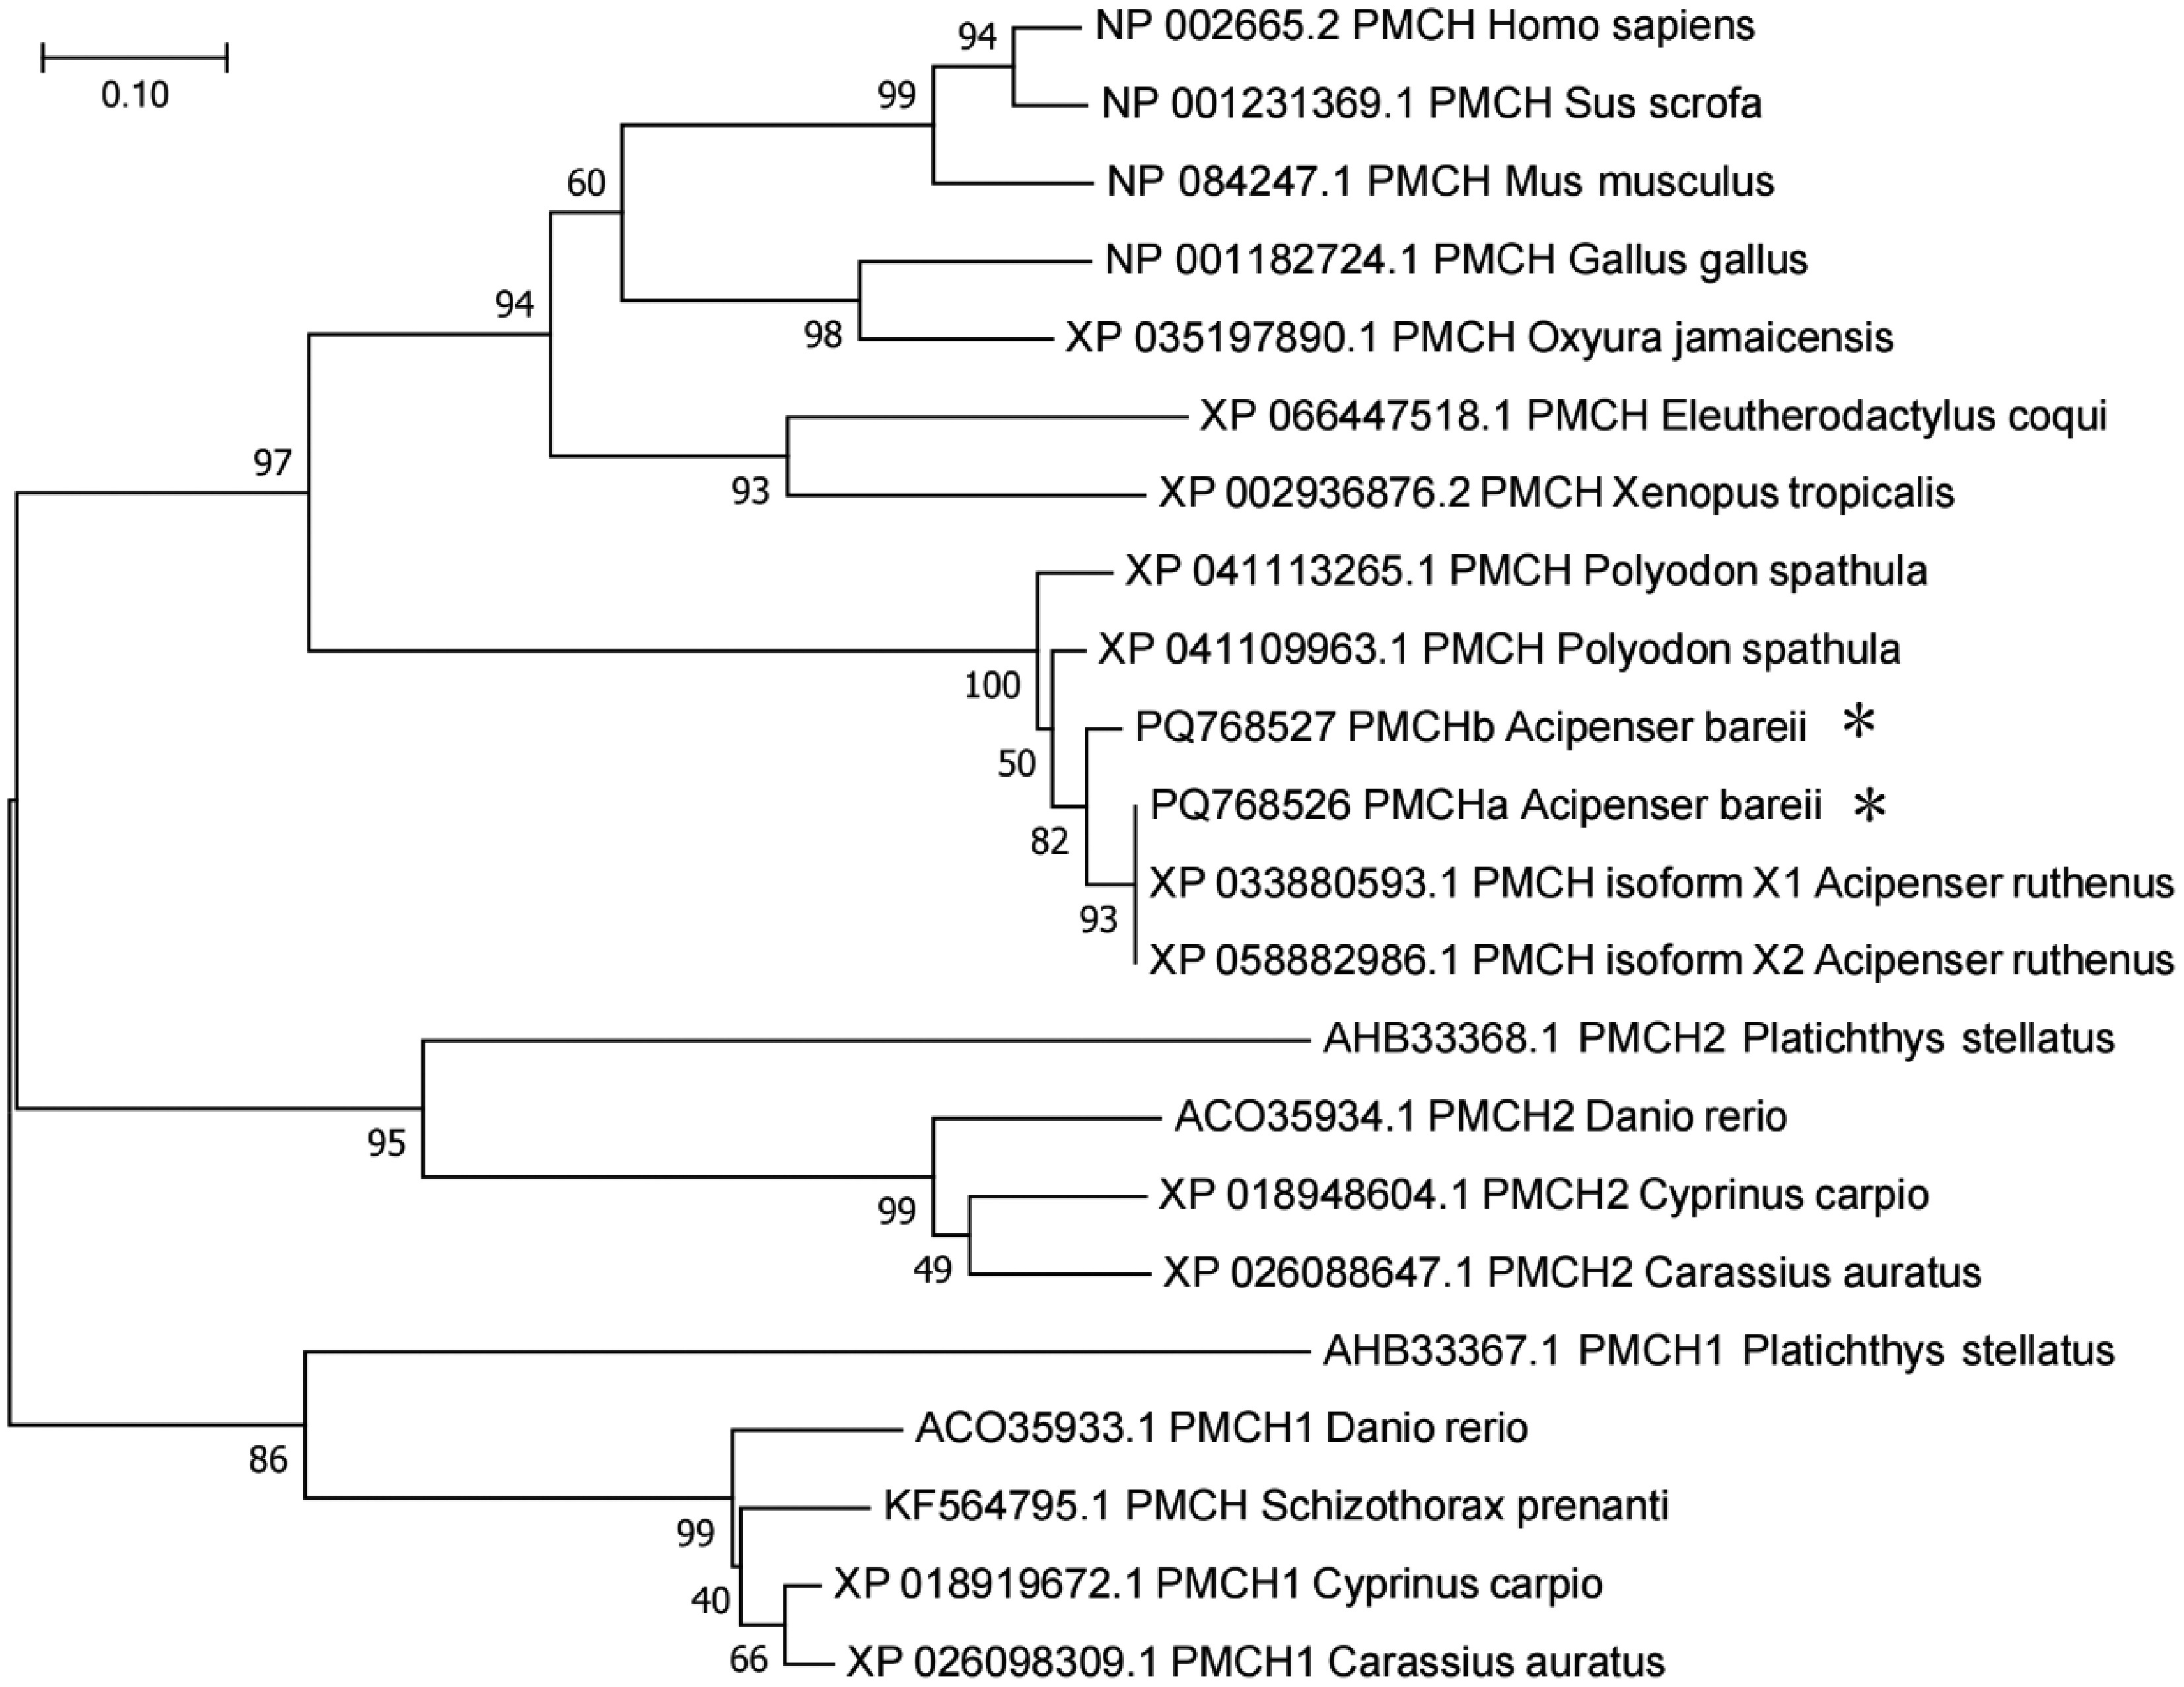
Figure 3.
The phylogenetic analysis of pmch amino acid sequences. MEGA 7.0 was used to construct the neighbor-joining phylogenetic tree and the confidence level of each branch was calculated by bootstrapping repeated 1,000 times.
-
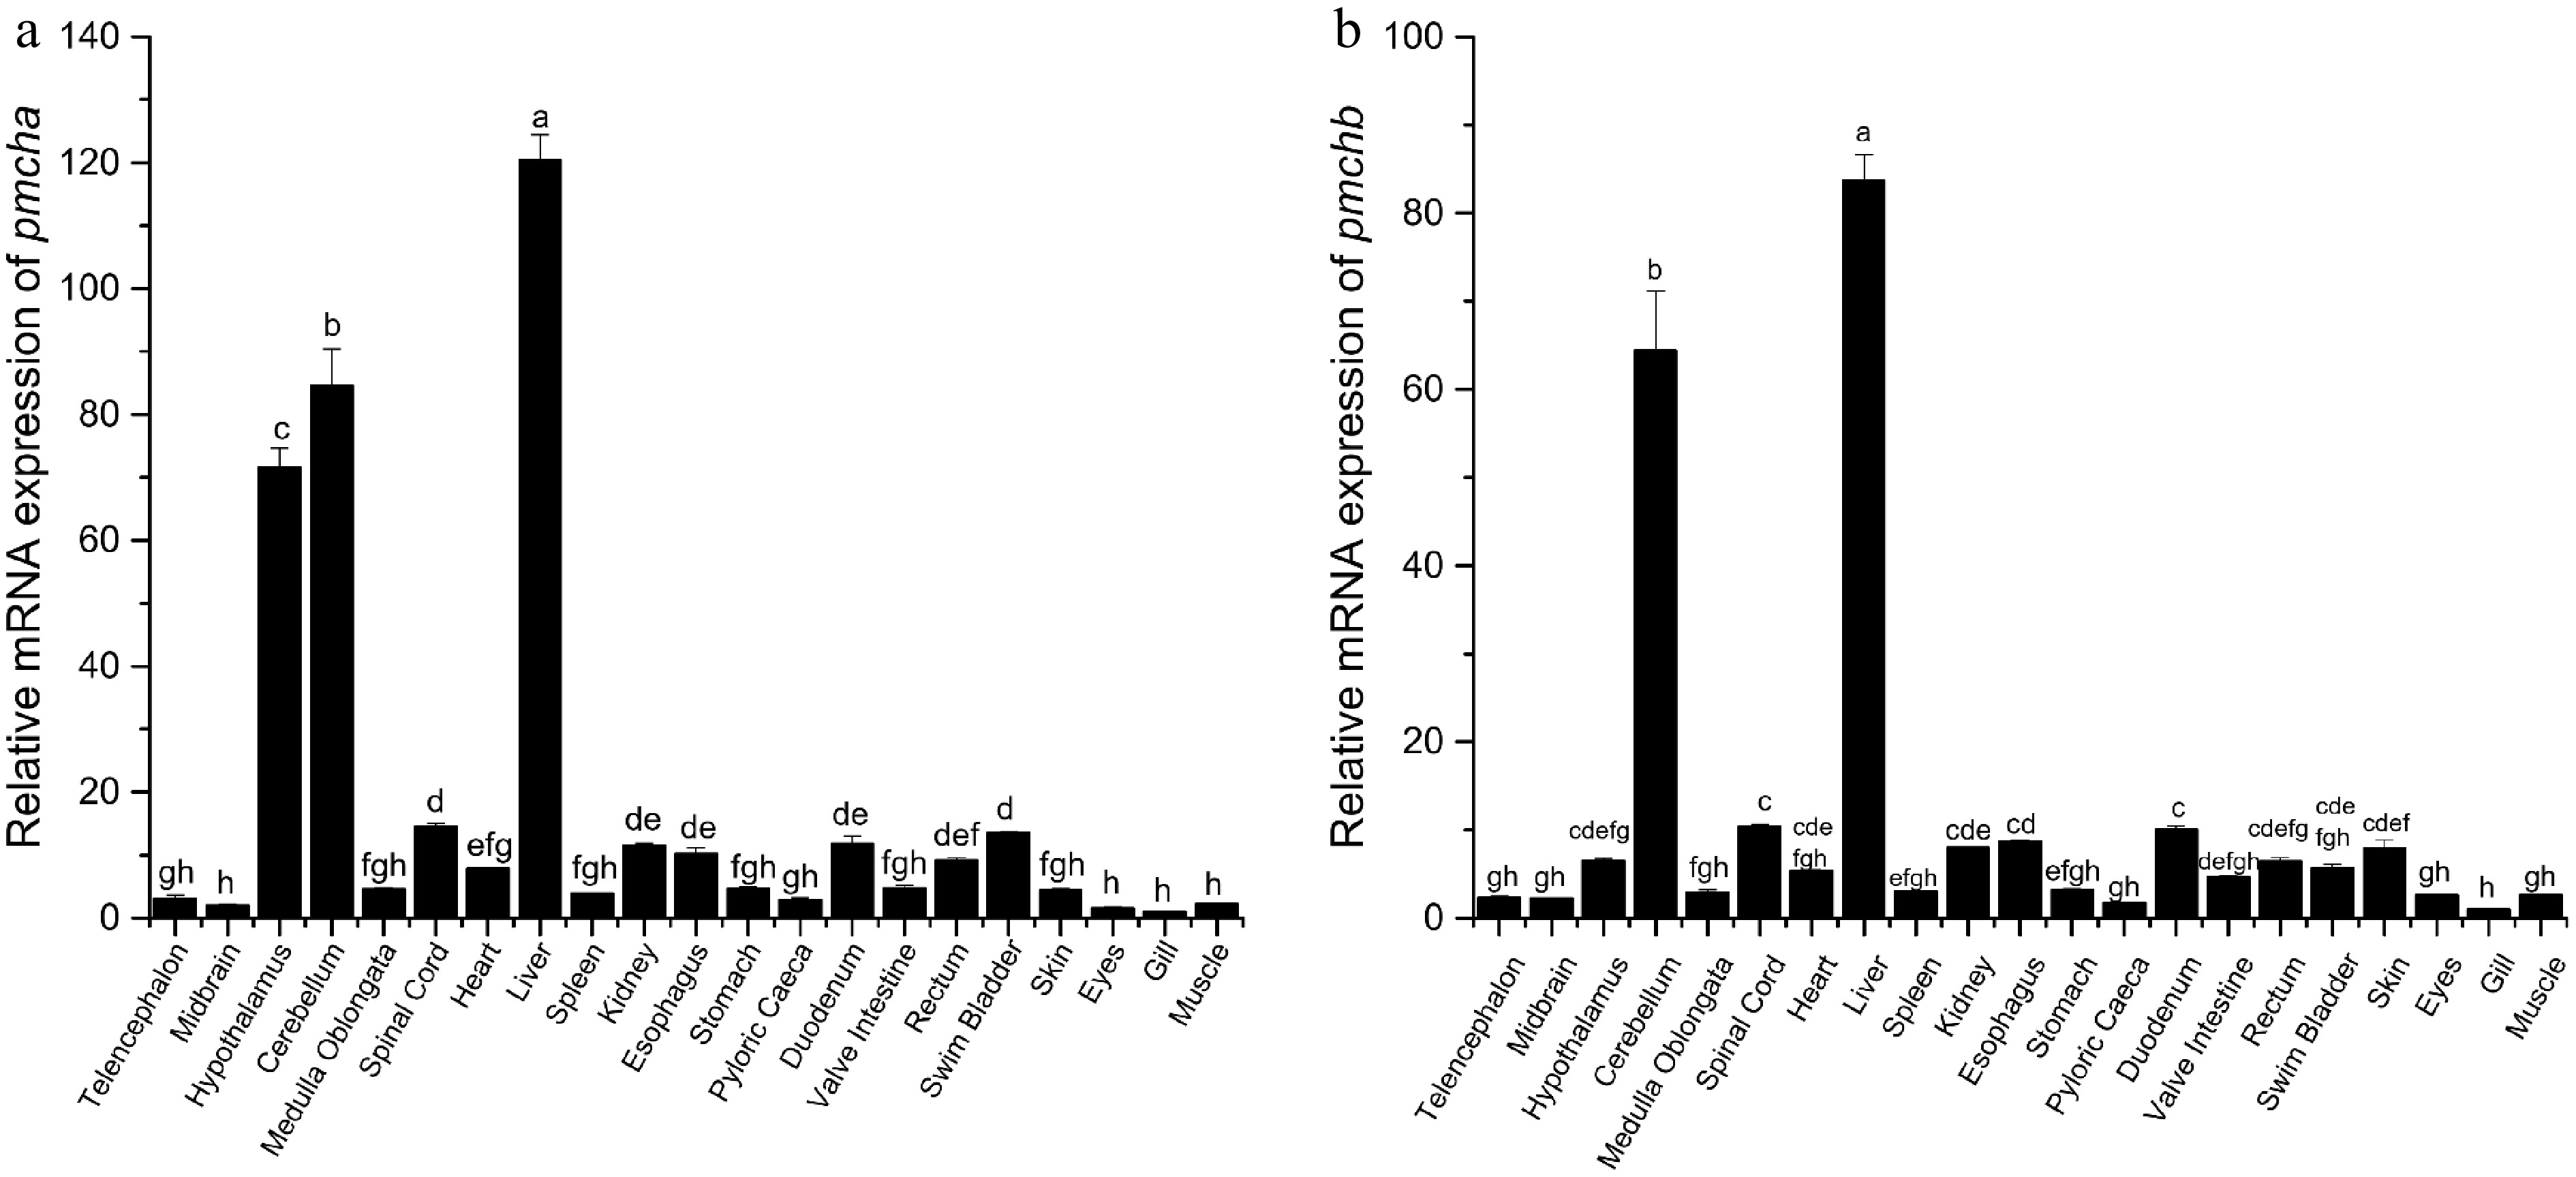
Figure 4.
Tissue distribution of (a) pmcha and (b) pmchb in Siberian sturgeon (n = 6). The mRNA expression of target genes was normalized to β-actin. Different letters indicate significant differences. p < 0.05 represents statistically significant.
-
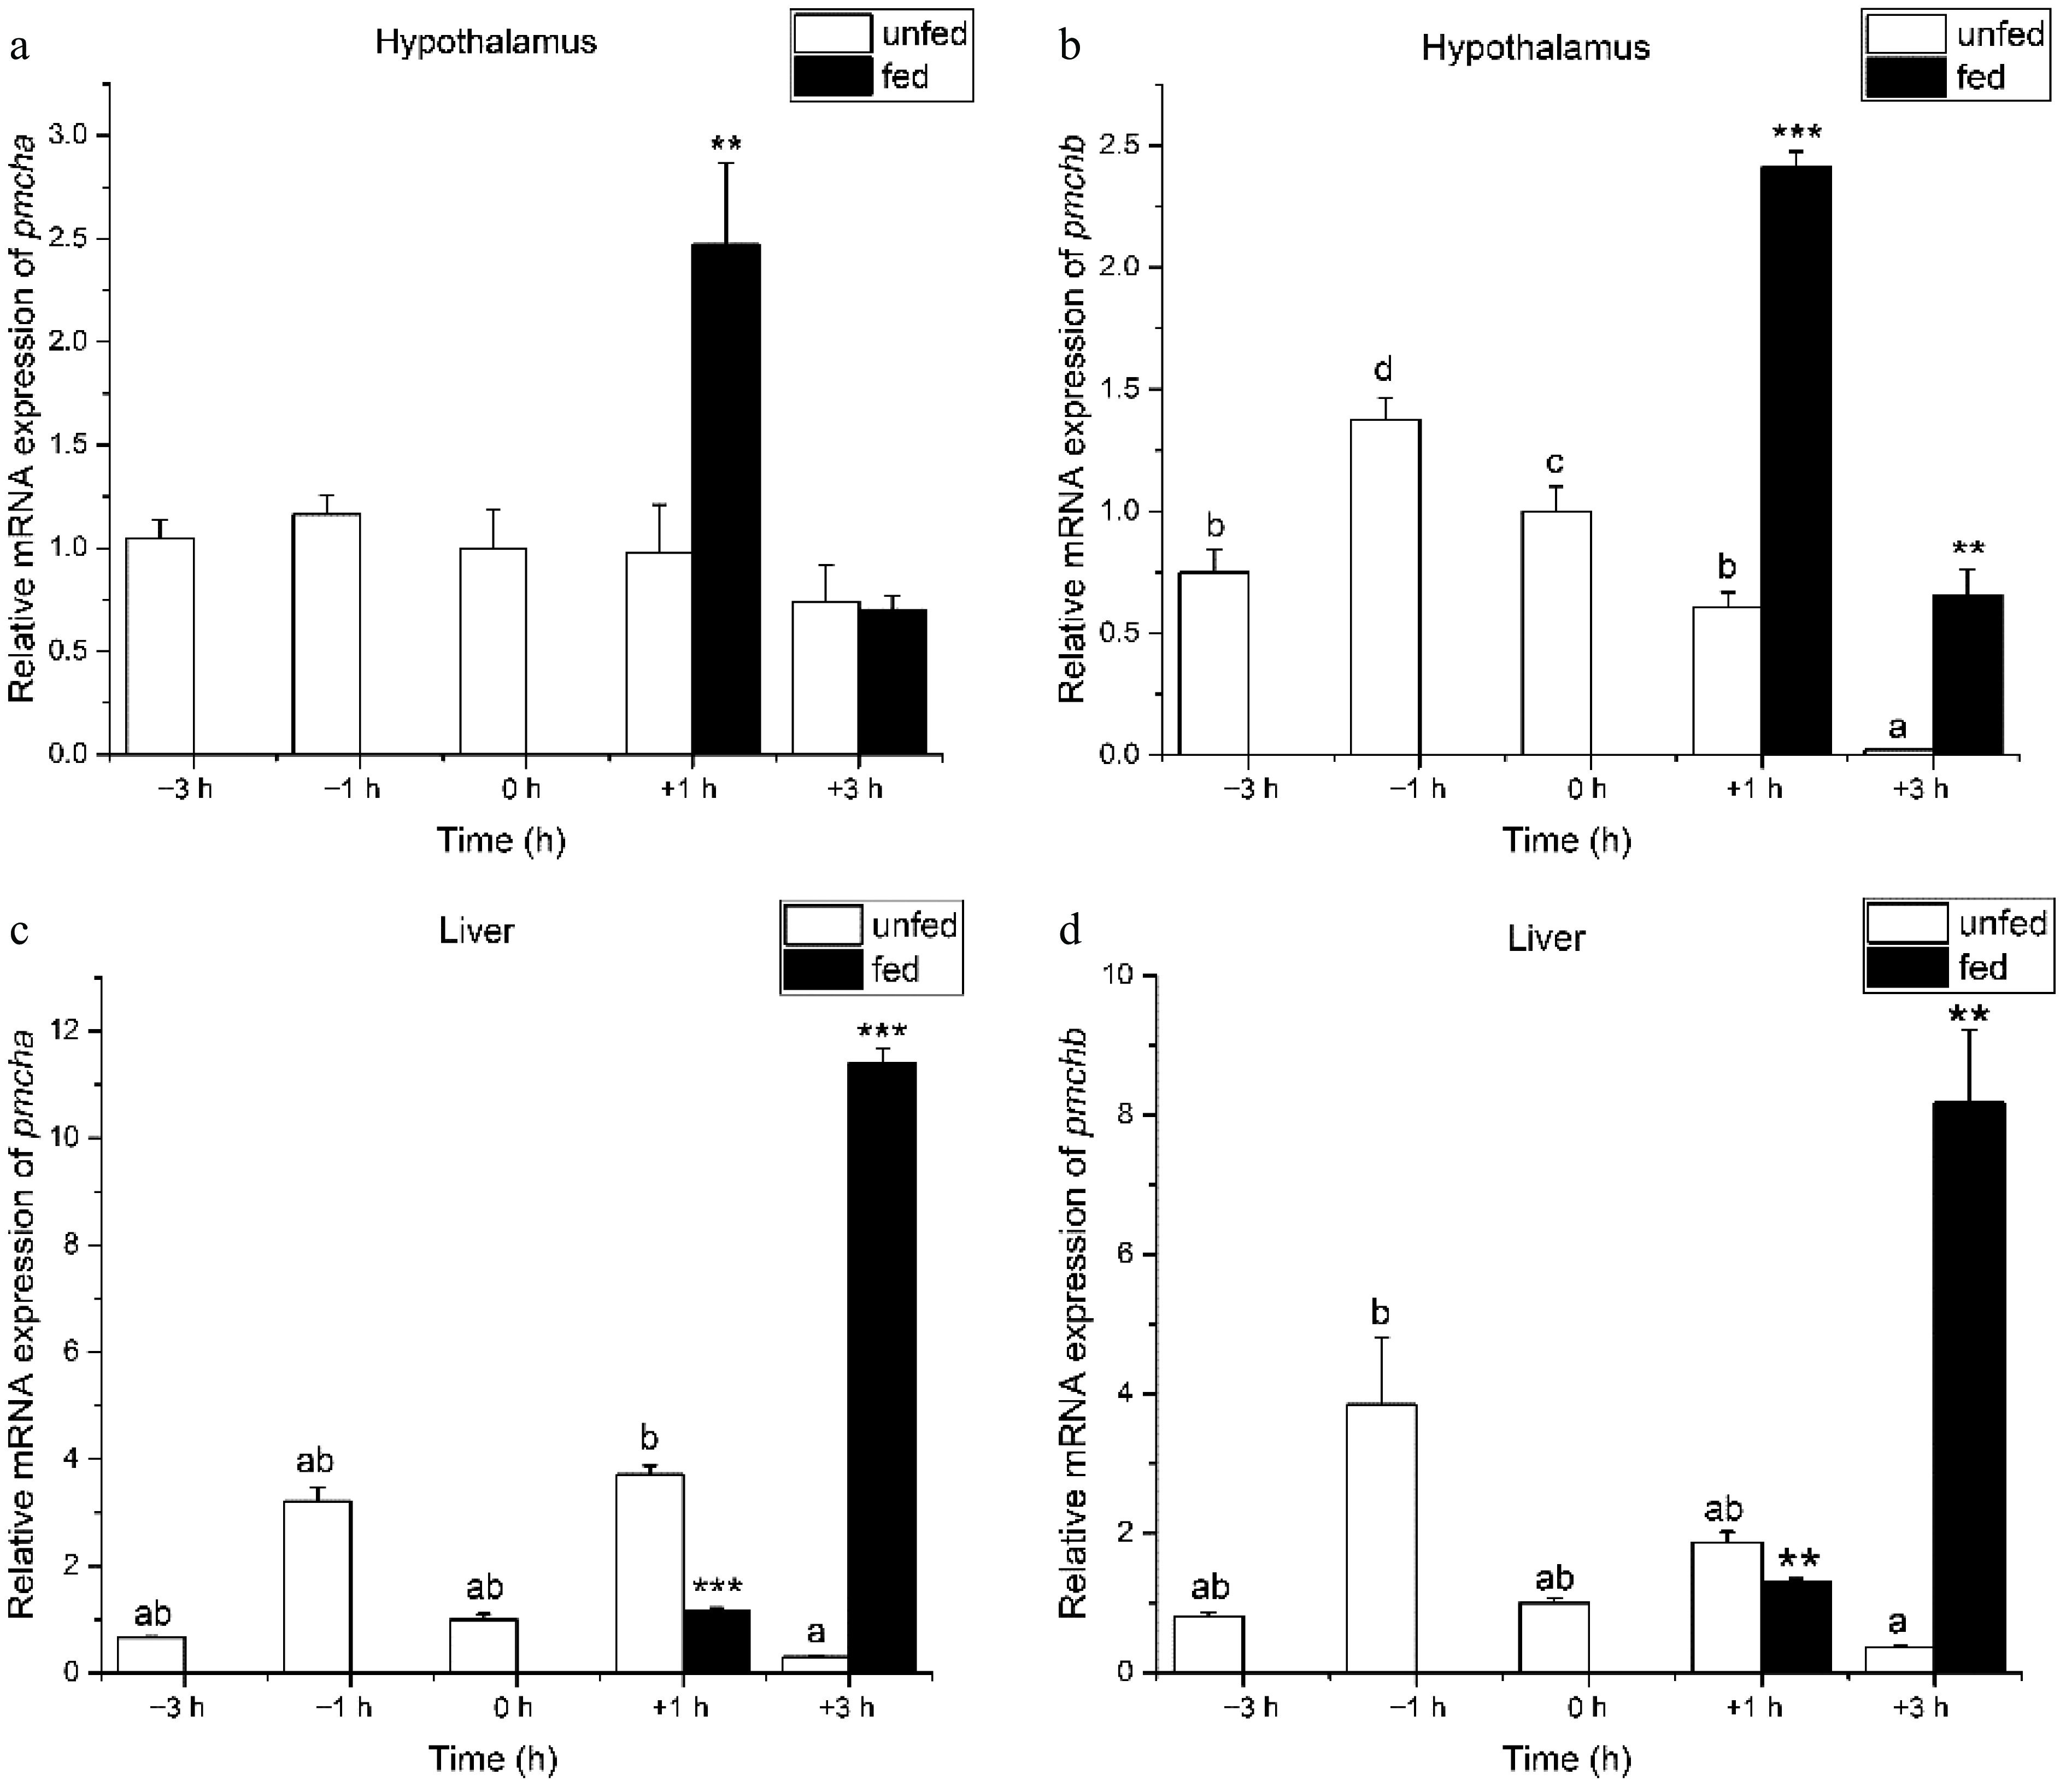
Figure 5.
Preprandial and postprandial changes in the mRNA expression of pmcha and pmchb in (a), (b) the hypothalamus and (c), (d) liver. The mRNA expression of target genes was normalized to β-actin and ef-1α. n = 9 fish per group. One-way ANOVA followed by Tukey's HSD test was conducted to compare the difference among different time points in the periprandial experiment. The asterisk represents significant differences between unfed fish and fed fish at the same time point (Student's t-test). * means p < 0.05, ** means p < 0.01, *** means p < 0.001 in the comparison between the fed and unfed groups at the same time point.
-
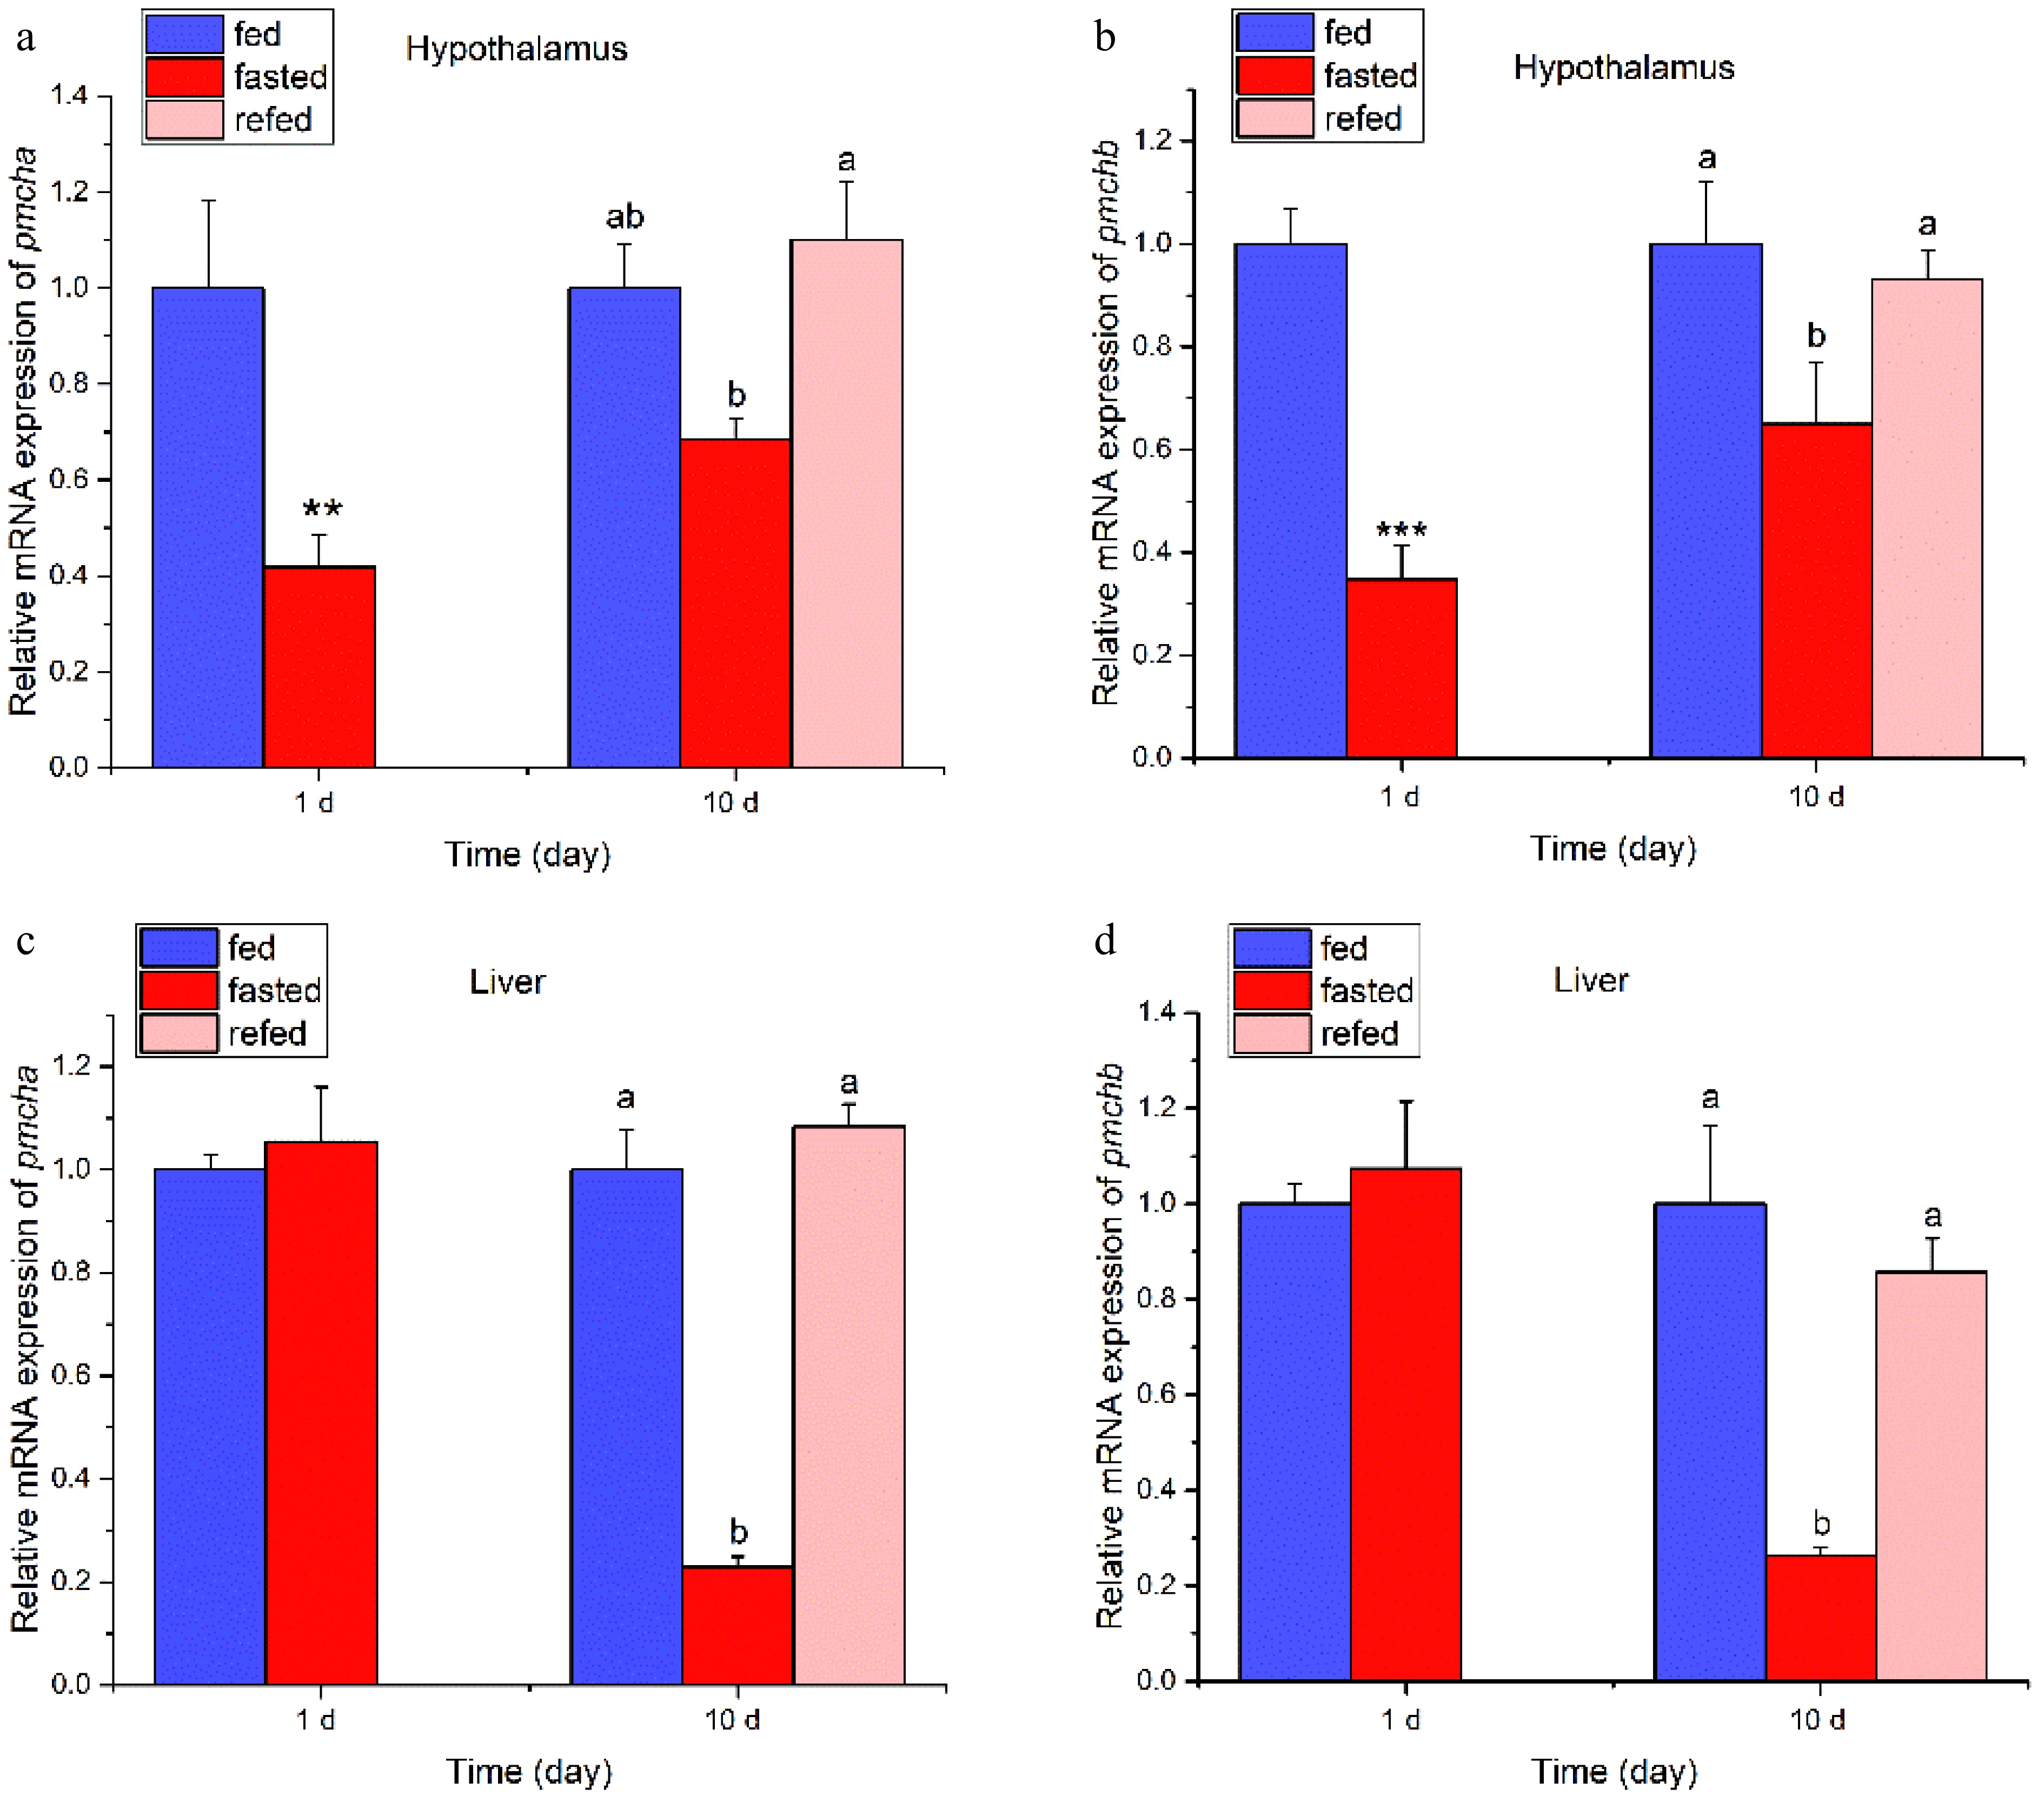
Figure 6.
Effect of fasting and refeeding on mRNA expression levels of pmcha and pmchb in the hypothalamus and liver of juvenile Siberian sturgeon. The mRNA expression levels were normalized to β-actin and ef-1α. n = 9 fish per group; one-way ANOVA followed by Tukey's HSD test was conducted to compare the difference among fed, fasted and refed groups. * represents significant differences between the fed group and the fasted group (Student's t-test), * means p < 0.05, ** means p < 0.01, *** means p < 0.001. Different letters indicate significant differences among the fed group, fasted group, and refed group.
-
Primer name Sequence (5'–3') Usage pmcha-f GATCGGTTTCTACAAGAACTGC Clone pmcha-r GCTTTGTTCATTGGAGGACTG pmchb-f GATAGTTTTTACAAGAACCTCAA pmchb-r CGTAACACACAGGTGAATAAC pmcha-qf AACAGACACCTGCCTTAC qRT-PCR pmcha-qr TCCCAGCATACATCTTAGC pmchb-qf CTTCCTTATTTCTGCCAACTCG pmchb-qr TAGACTCTTCCCAGCATACATC β-actin-qf GTTGGTATGGGACAGAAGGACA β-actin-qr CCAGTTGGTAACAATGCCGT ef-1α-qf AACCTTCAACACCCCAGCC ef-1α-qr CACCAGAGTCCATCACAATACC Table 1.
Primer sequences of the clone and those used for quantitative real-time PCR (qRT-PCR).
Figures
(6)
Tables
(1)