-
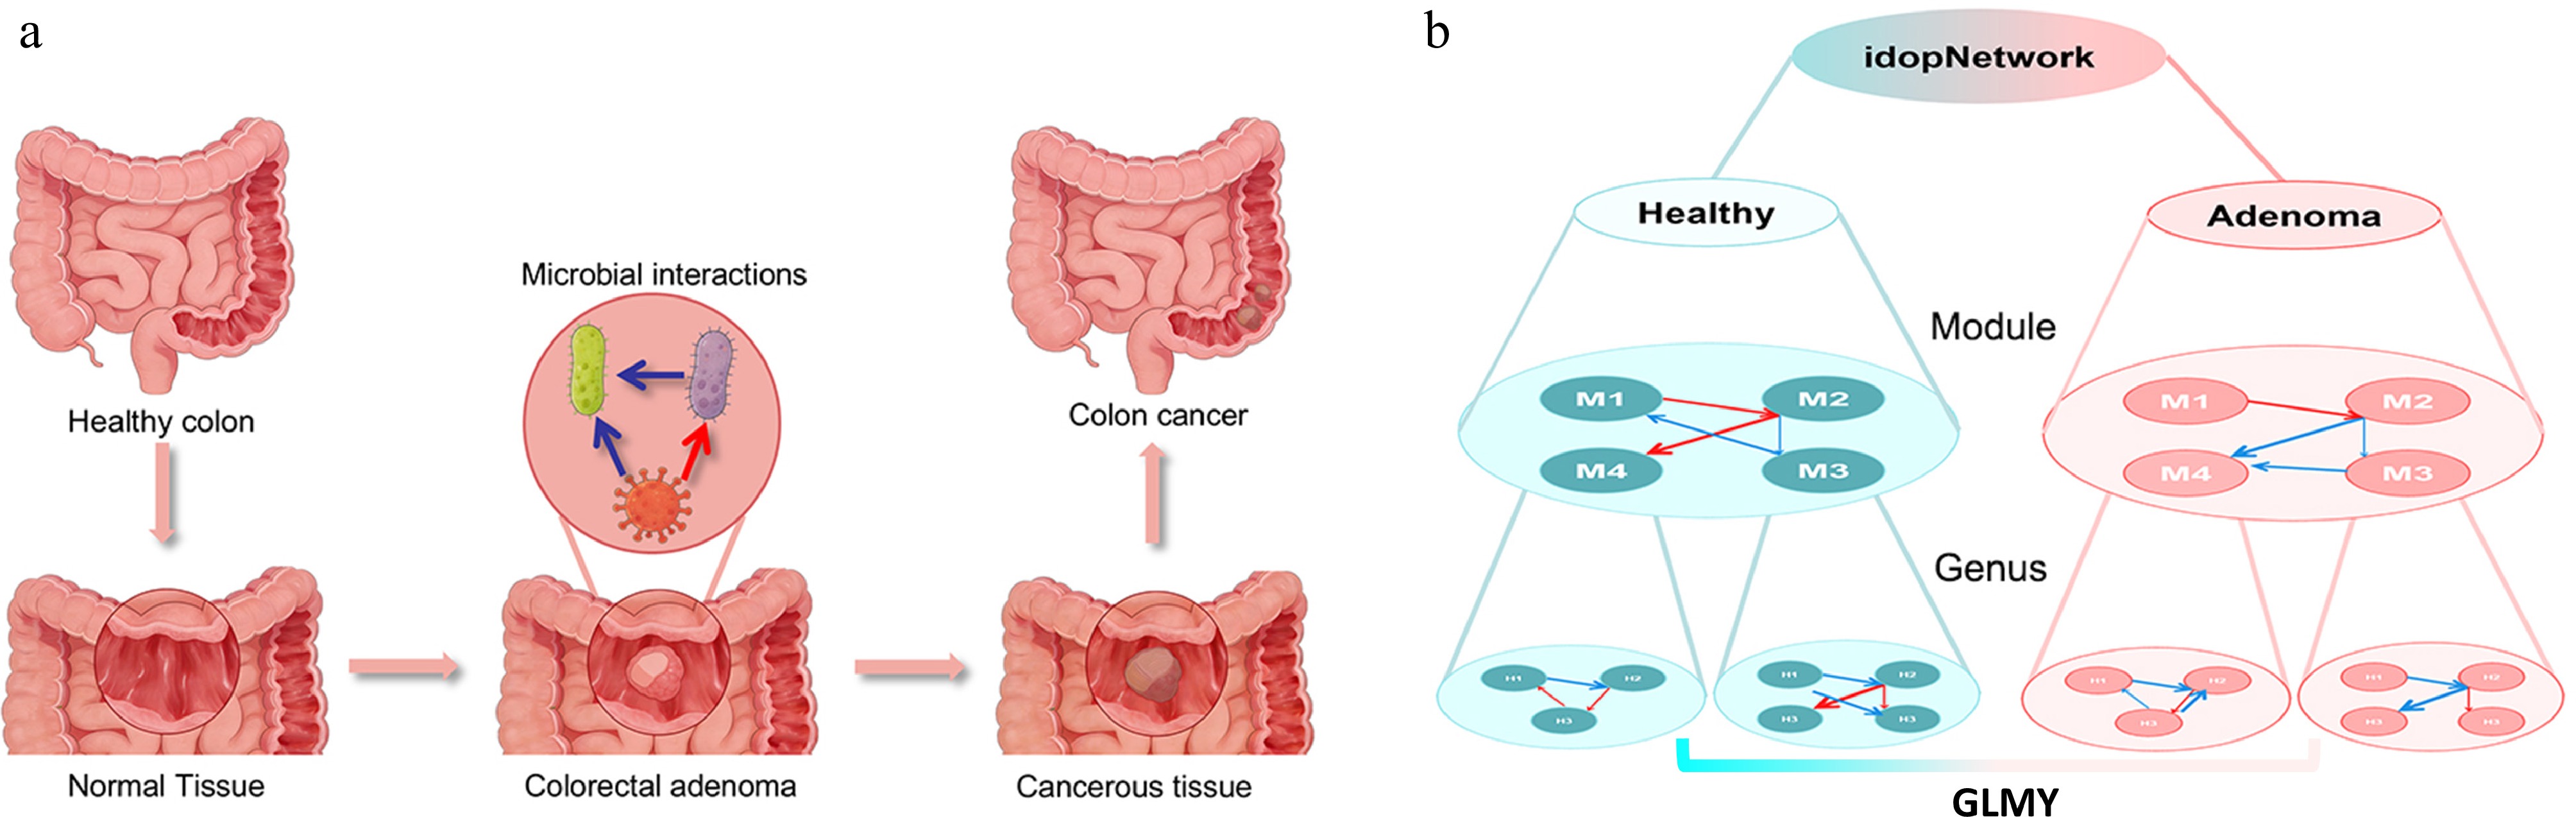
Figure 1.
Schematic overview of colorectal disease progression and idopNetwork–GLMY analysis of microbial interaction. (a) illustrates the stepwise progression of colorectal tissue from a healthy state to colorectal adenoma and ultimately to colorectal cancer. The enlarged central panel highlights microbial interactions at the adenoma stage, where distinct microbial taxa engage in cooperative or antagonistic interactions that may influence the local microenvironment. (b) depicts the multi-scale microbial interaction networks constructed from healthy and adenoma populations using idopNetwork. The inferred networks are subsequently analyzed using GLMY-based homological analysis to characterize and compare their topological organization, enabling systematic assessment of network-level structural differences between healthy and adenoma-associated states.
-
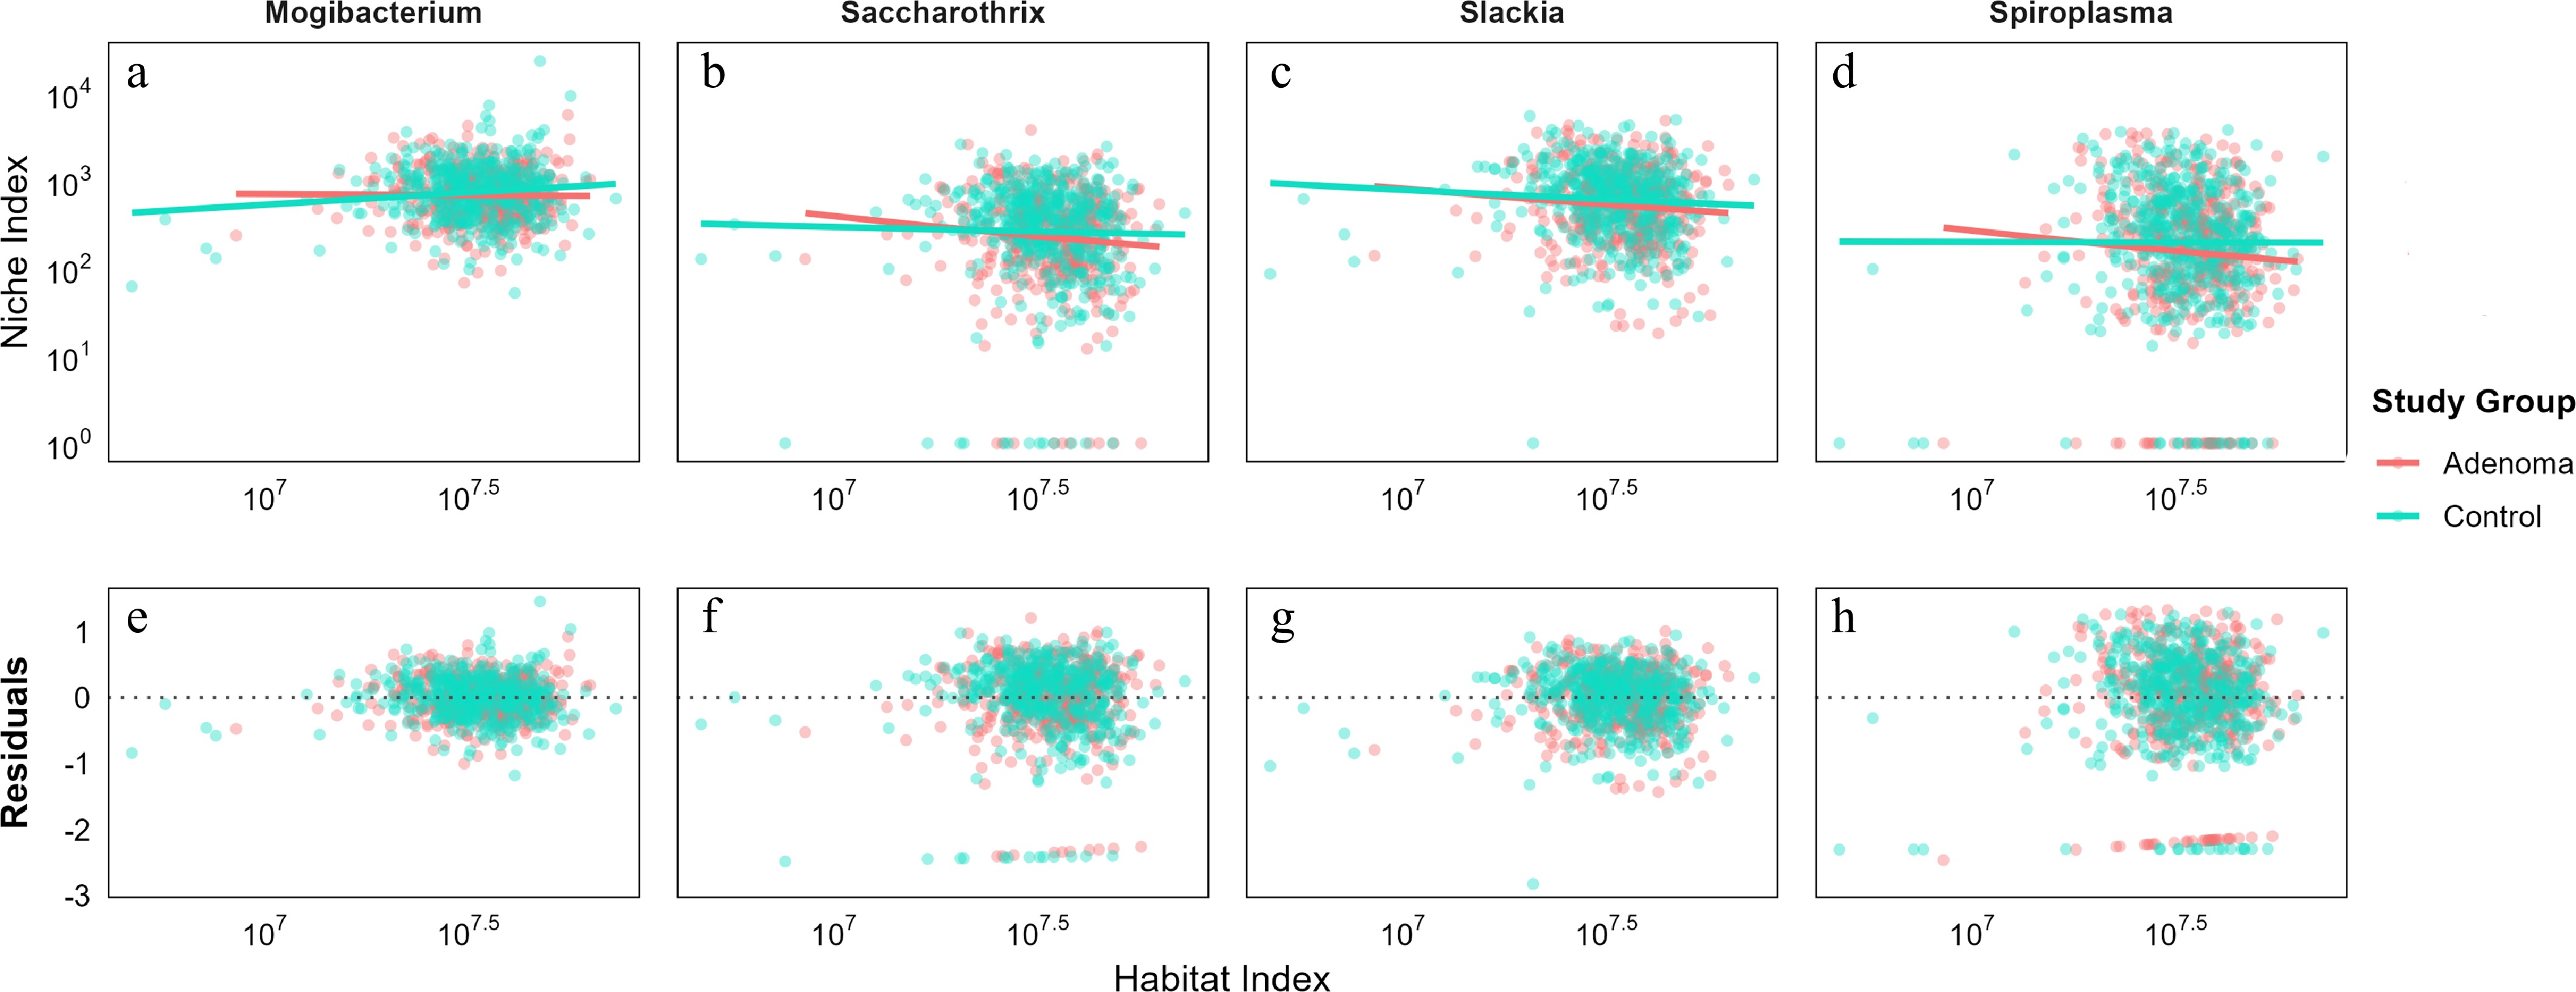
Figure 2.
Allometric scaling relationships of representative microbial taxa under healthy and adenoma conditions. The figure illustrates the differential scaling patterns of four microbial taxa (Mogibacterium, Saccharothrix, Spiroplasma, and Slackia) with respect to Habitat Index (HI) between healthy controls (green) and adenoma patients (red). (a)−(d) The fitted allometric curves (y = αXβ) describing the scaling relationship between (y) taxon abundance and (x) total community abundance; and (e)–(h) corresponding residual plots used to assess the adequacy of the power-law model fits.
-
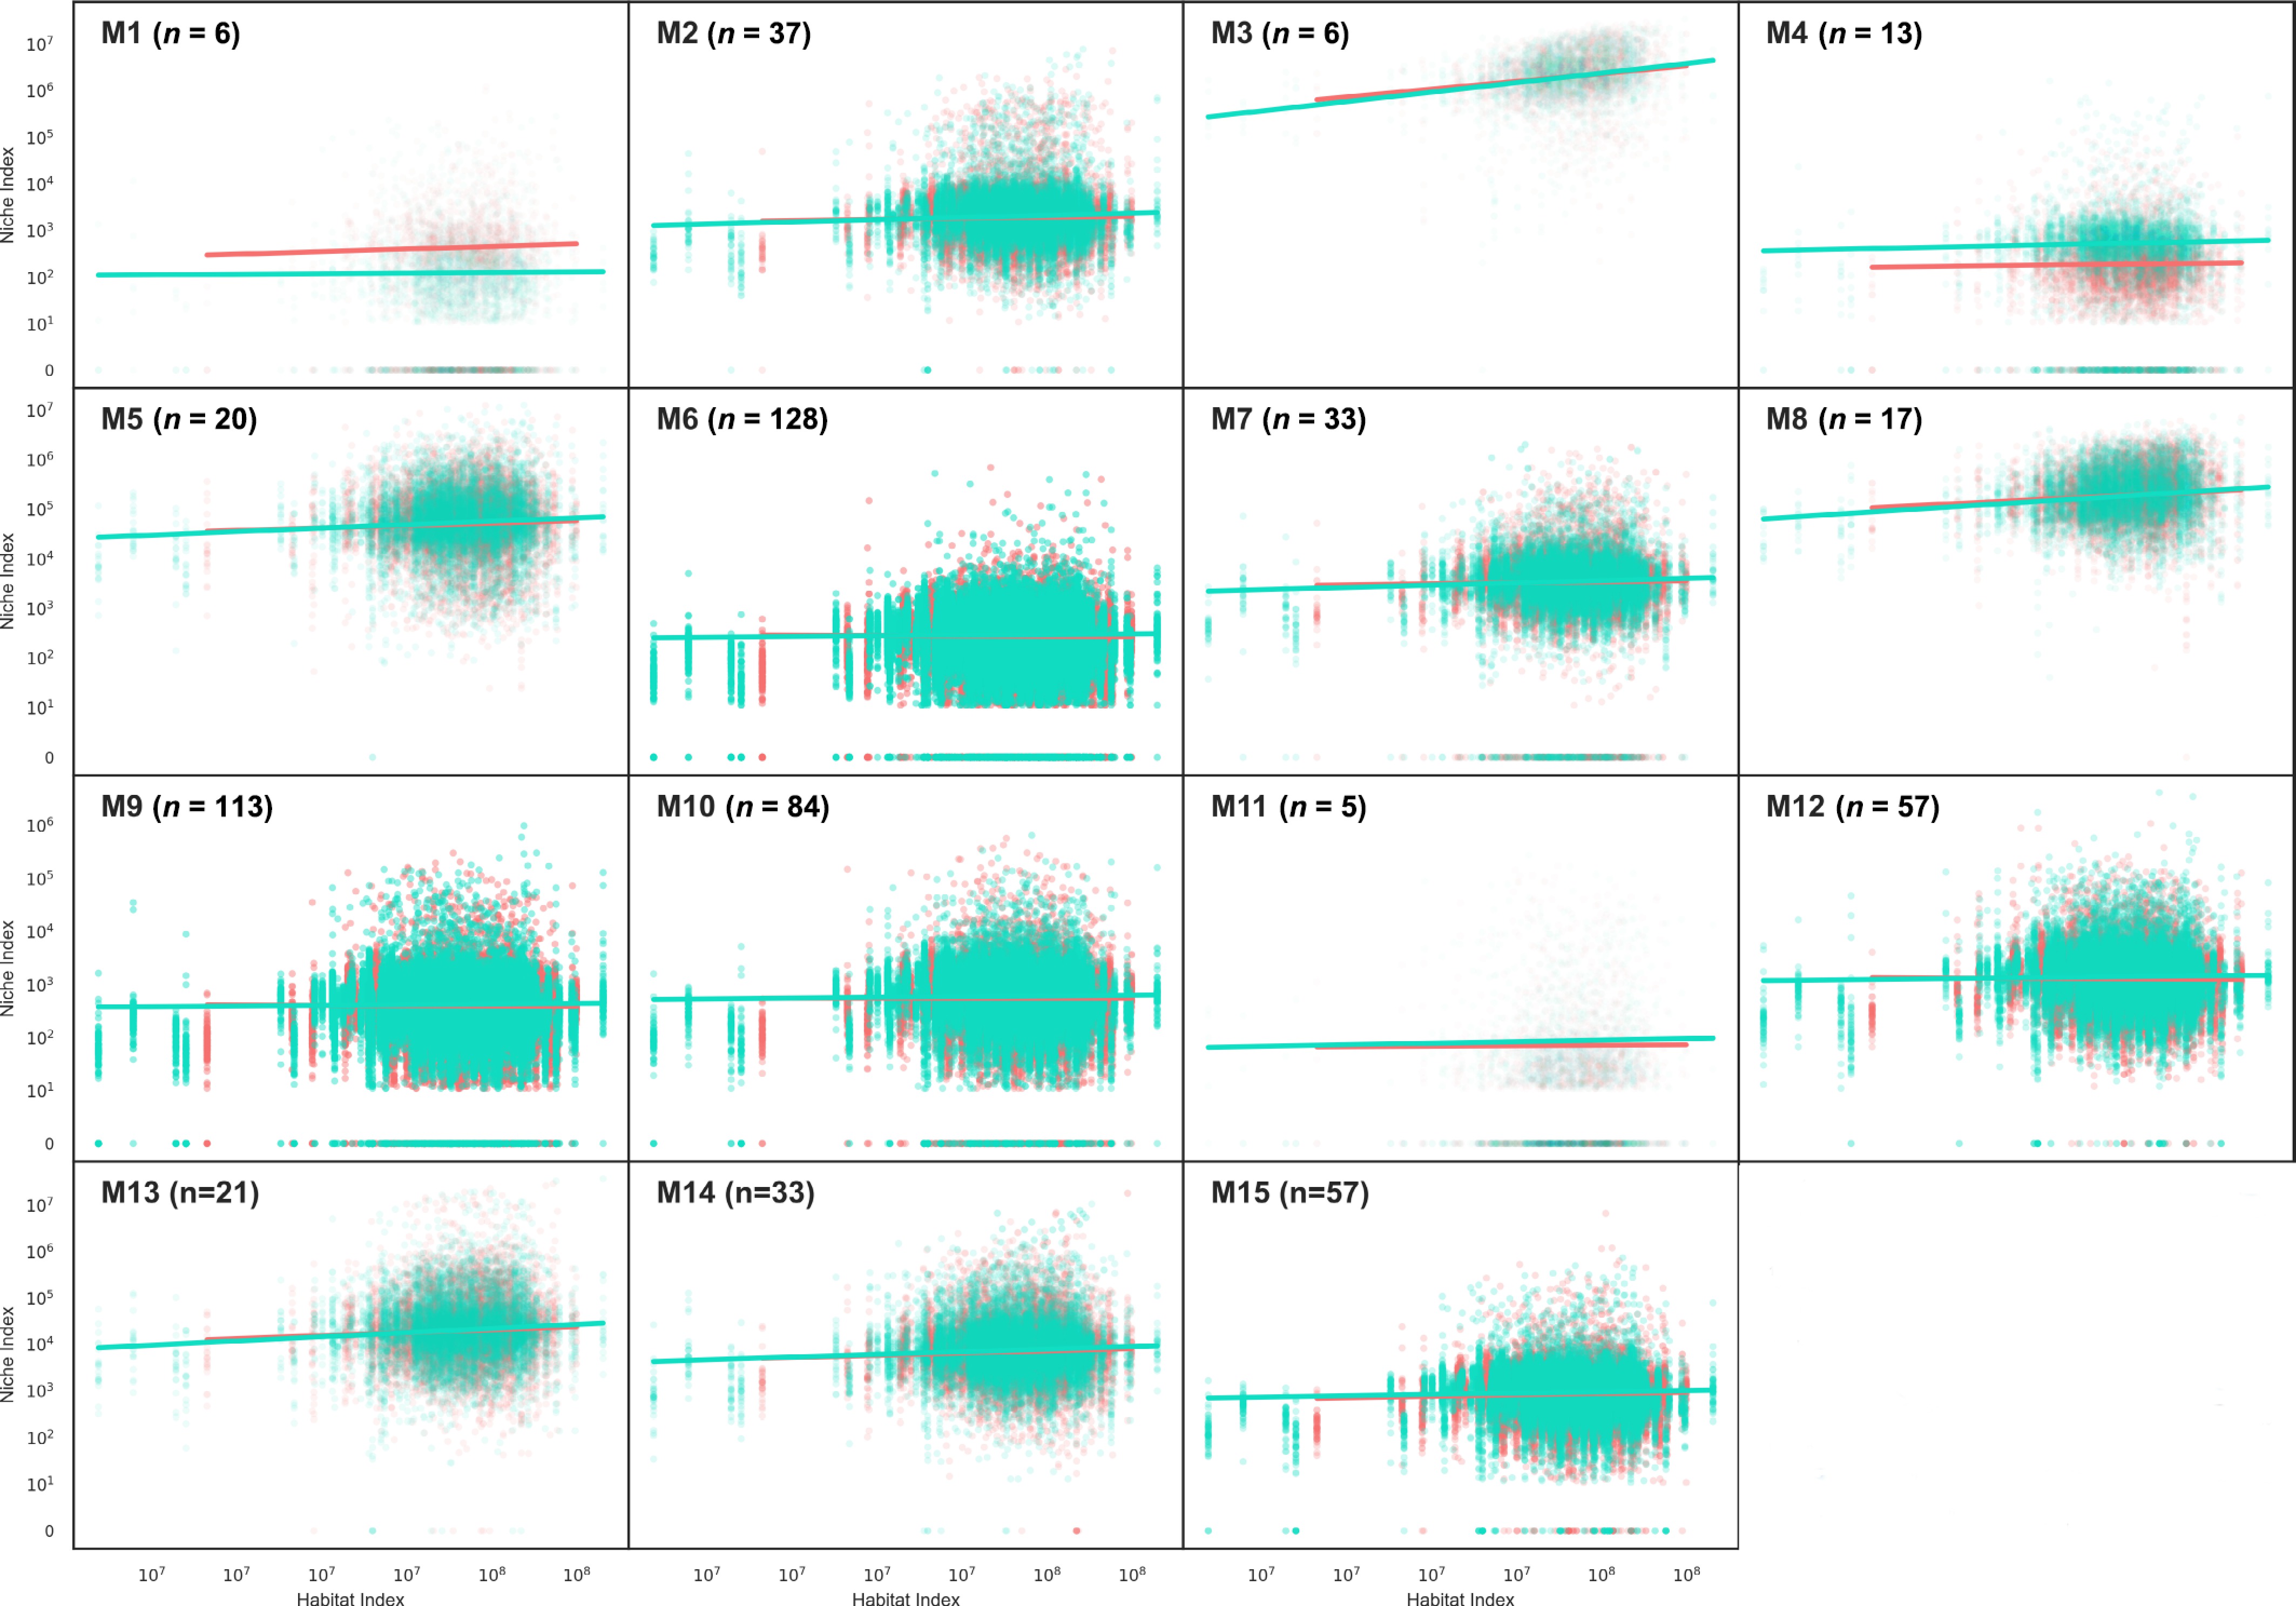
Figure 3.
Bifunctional clustering of 630 microbial features across adenoma (n = 435) and healthy control (n = 448) samples. This approach partitioned the microbial community into 15 distinct functional clusters, capturing shared ecological characteristics and differential associations with adenoma-associated dysbiosis. Red lines represent the adenoma group, whereas green lines denote the healthy control group.
-
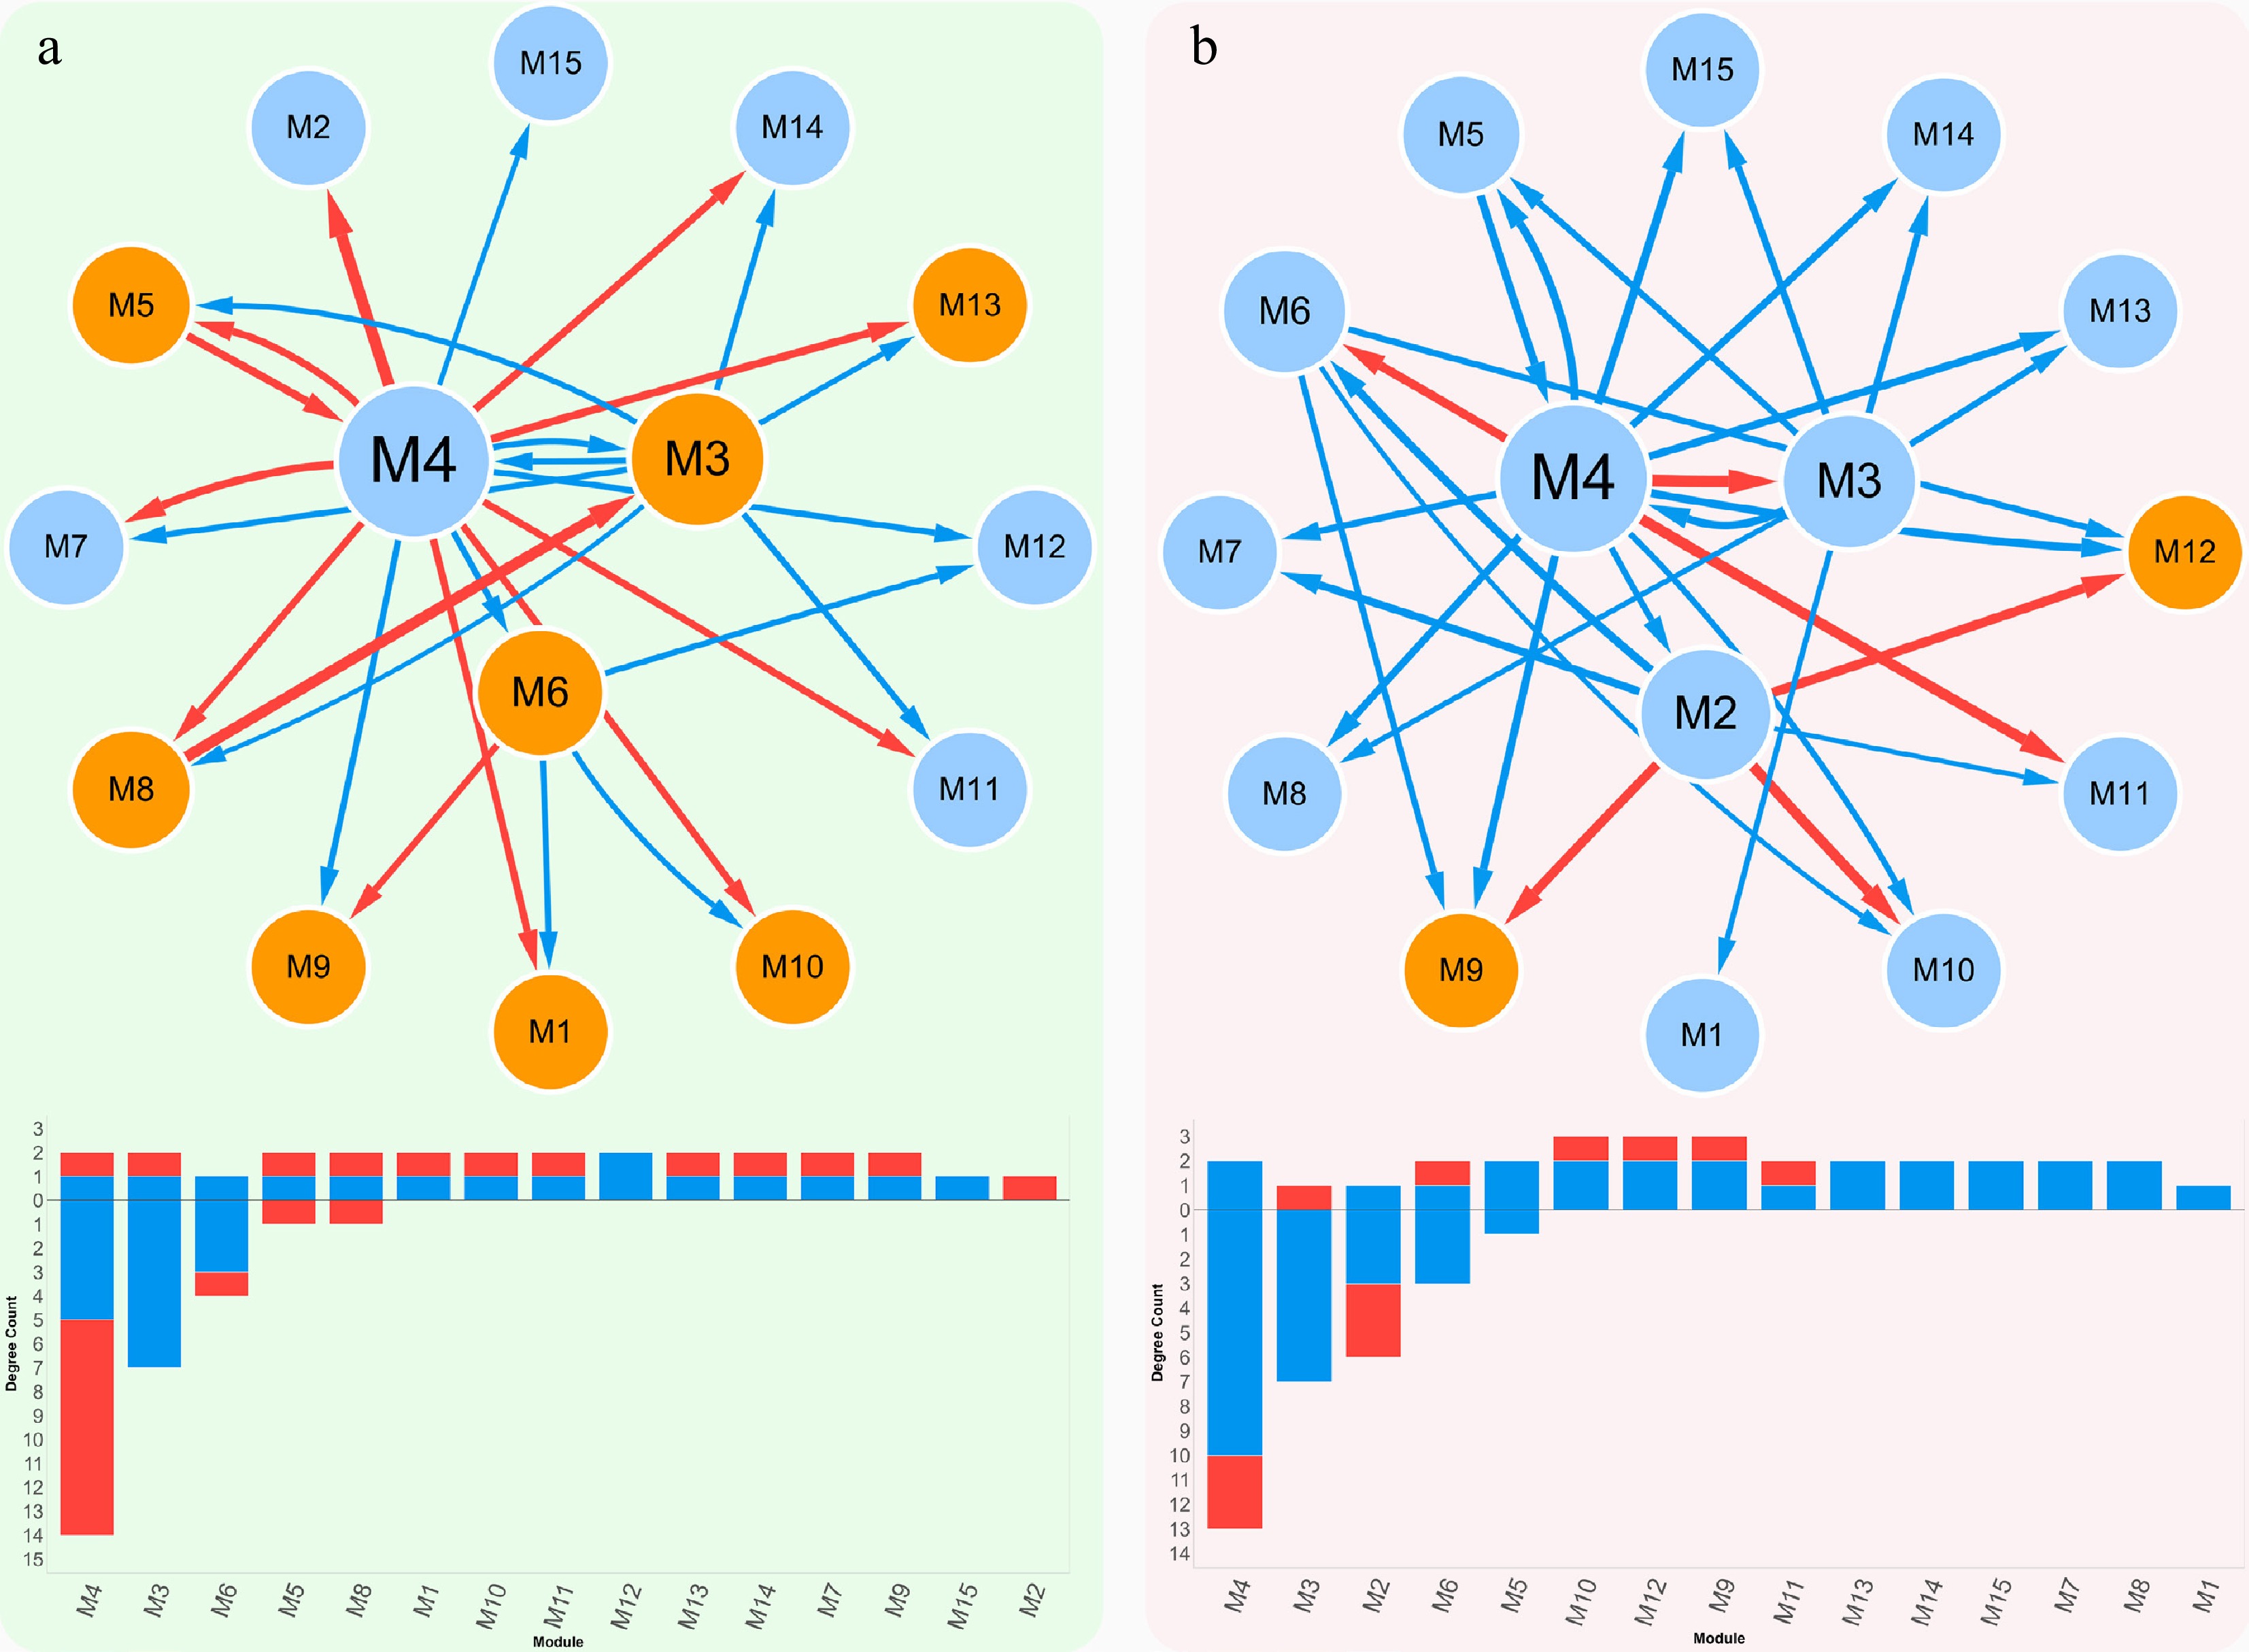
Figure 4.
Coarse-grained interaction networks among microbial modules under (a) healthy, and (b) adenoma conditions. Below each network, indegree (above axis) and outdegree (below axis) are shown, with red indicating positive and blue indicating negative inter-module interactions. In the healthy group, modules M4, M3, and M6 function as central hubs, supporting a balanced network architecture with relatively equal positive and negative connections. In contrast, the adenoma group shows a transition of hub roles, with M4, M3, and M2 emerging as dominant modules. This network is characterized by a predominance of negative interactions, suggesting a transition from stable, cooperative regulation in health to antagonistic and destabilized inter-module relationships in adenoma.
-
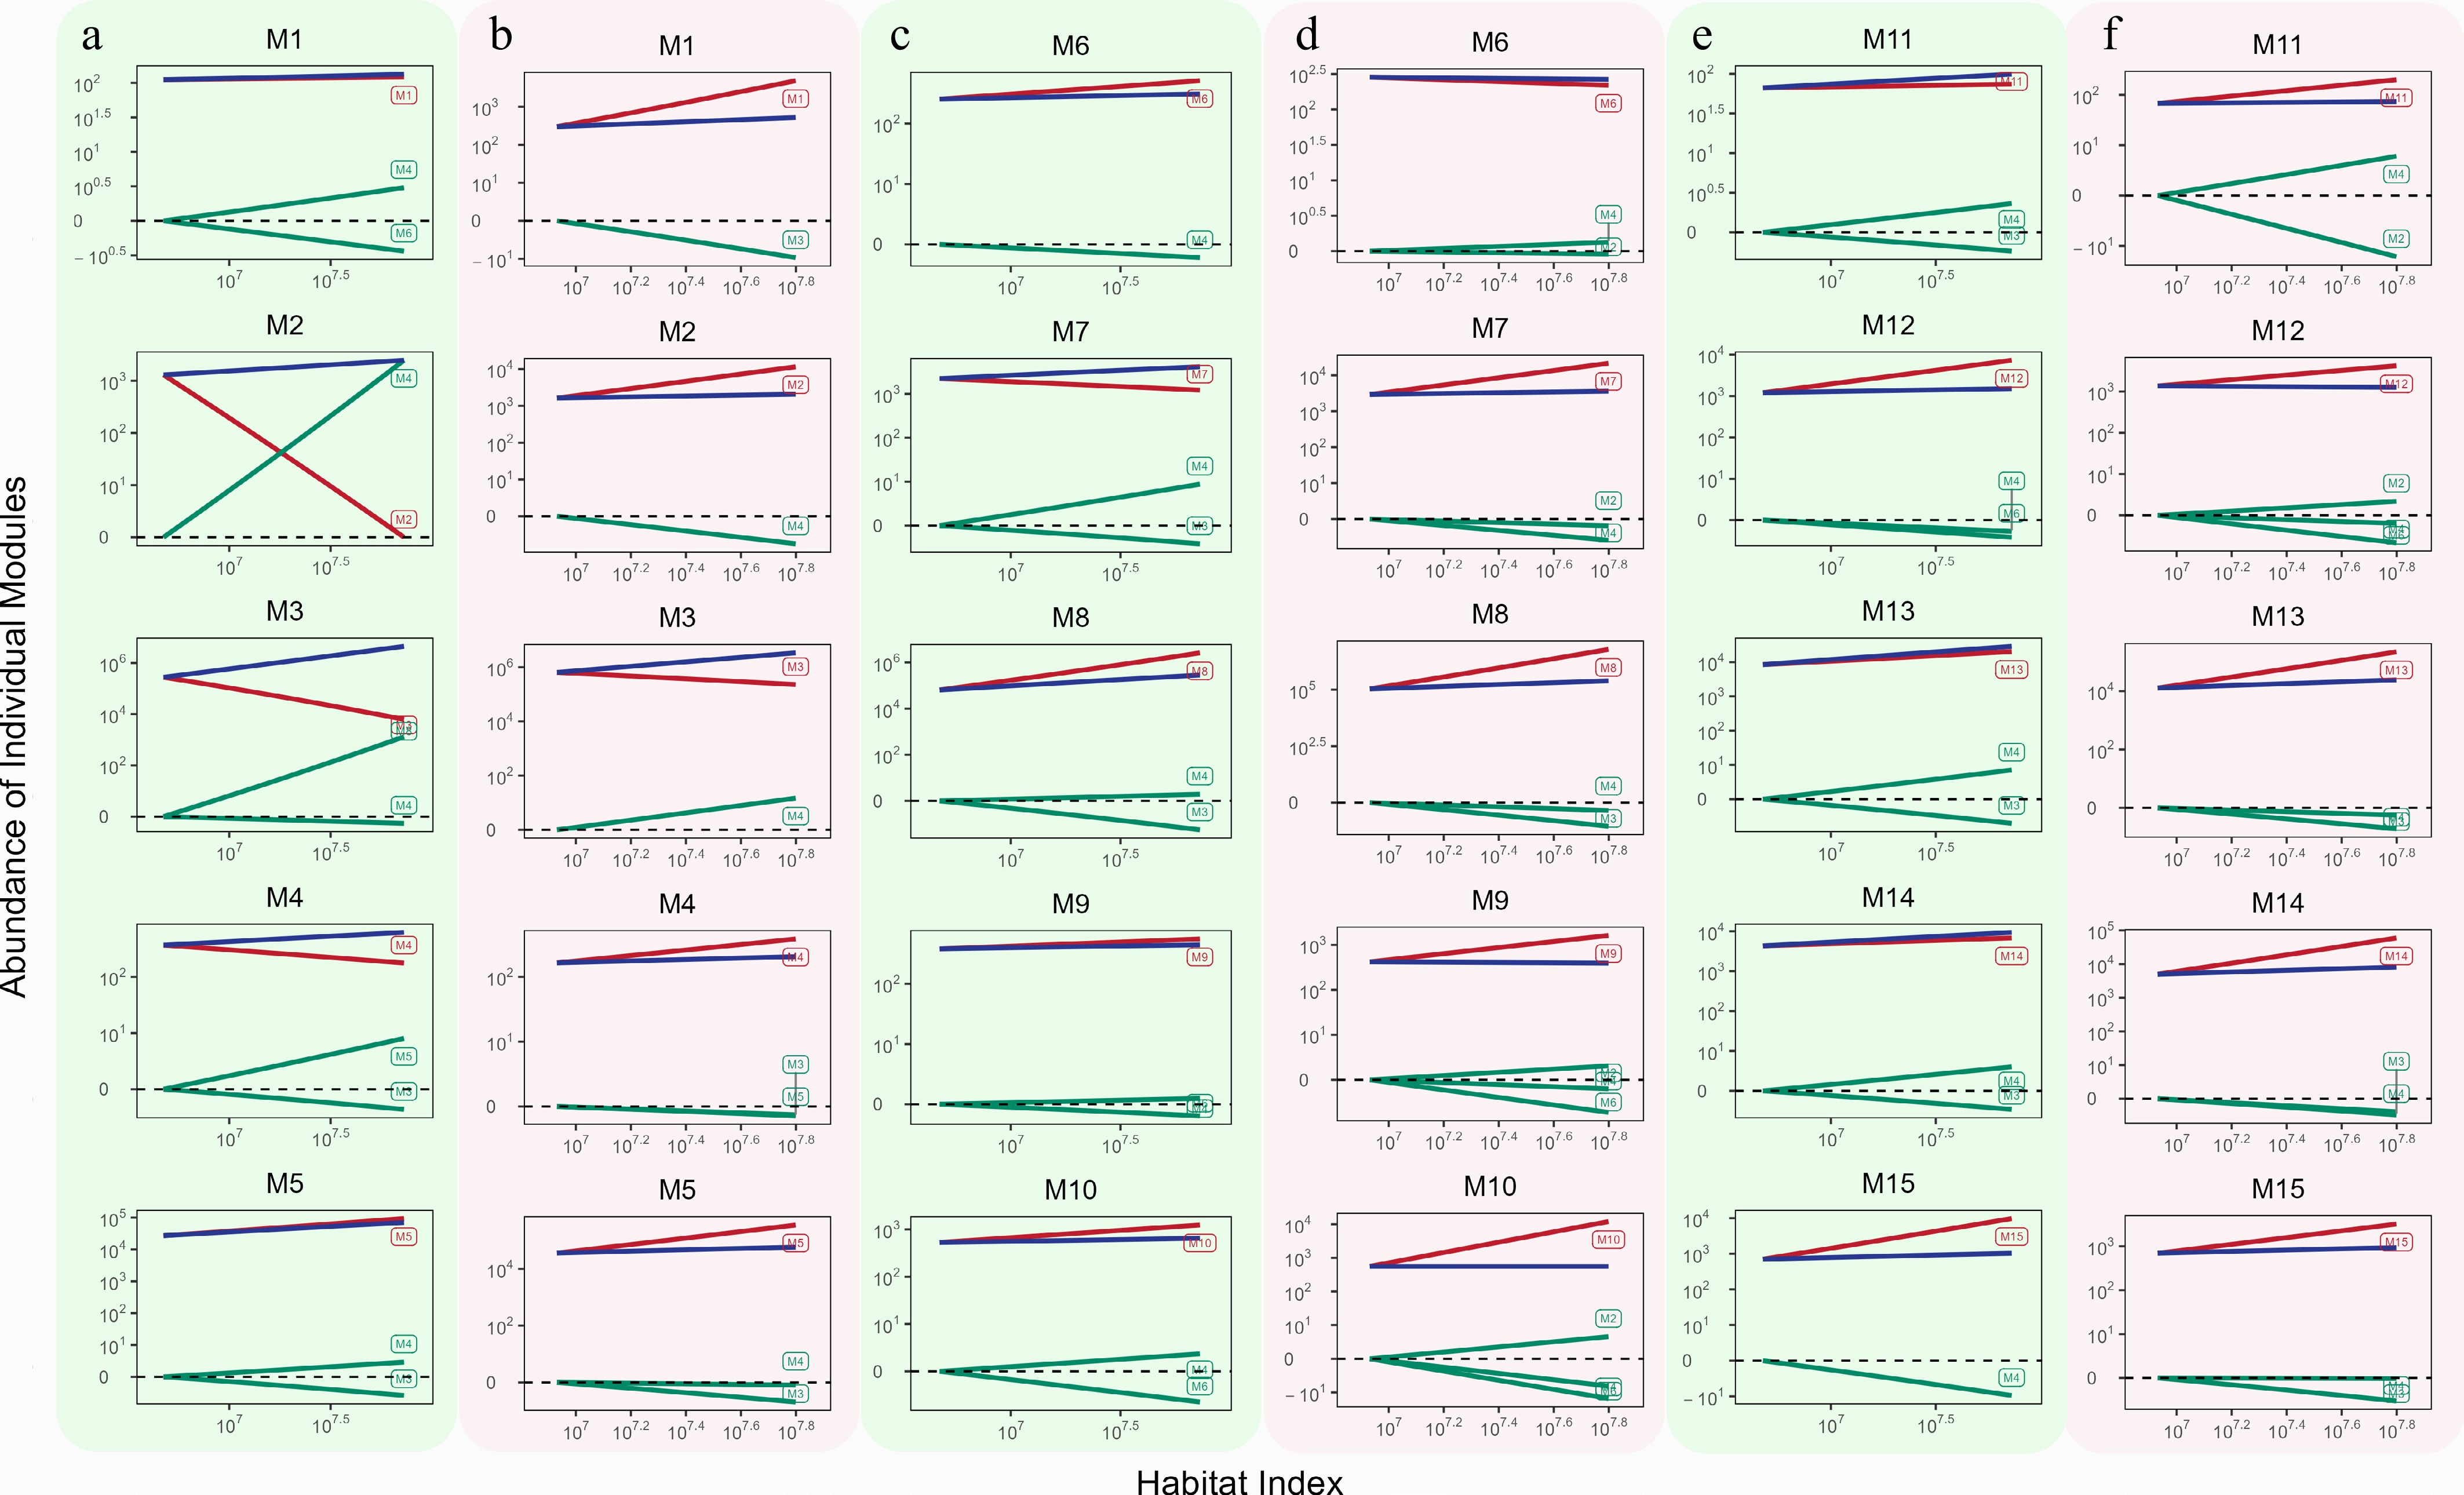
Figure 5.
Decomposition effect curves of 15 microbial modules under healthy and adenoma conditions. (a), (c), and (e) correspond to the 15 modules in the healthy group, (b), (d), and (f) correspond to the adenoma group. Within each subpanel, three trajectories are shown: the blue curve represents the overall effect of the module, the green curve represents the dependent effect (influences from other modules), and the red curve represents the independent effect (intrinsic tendency of the module).
-
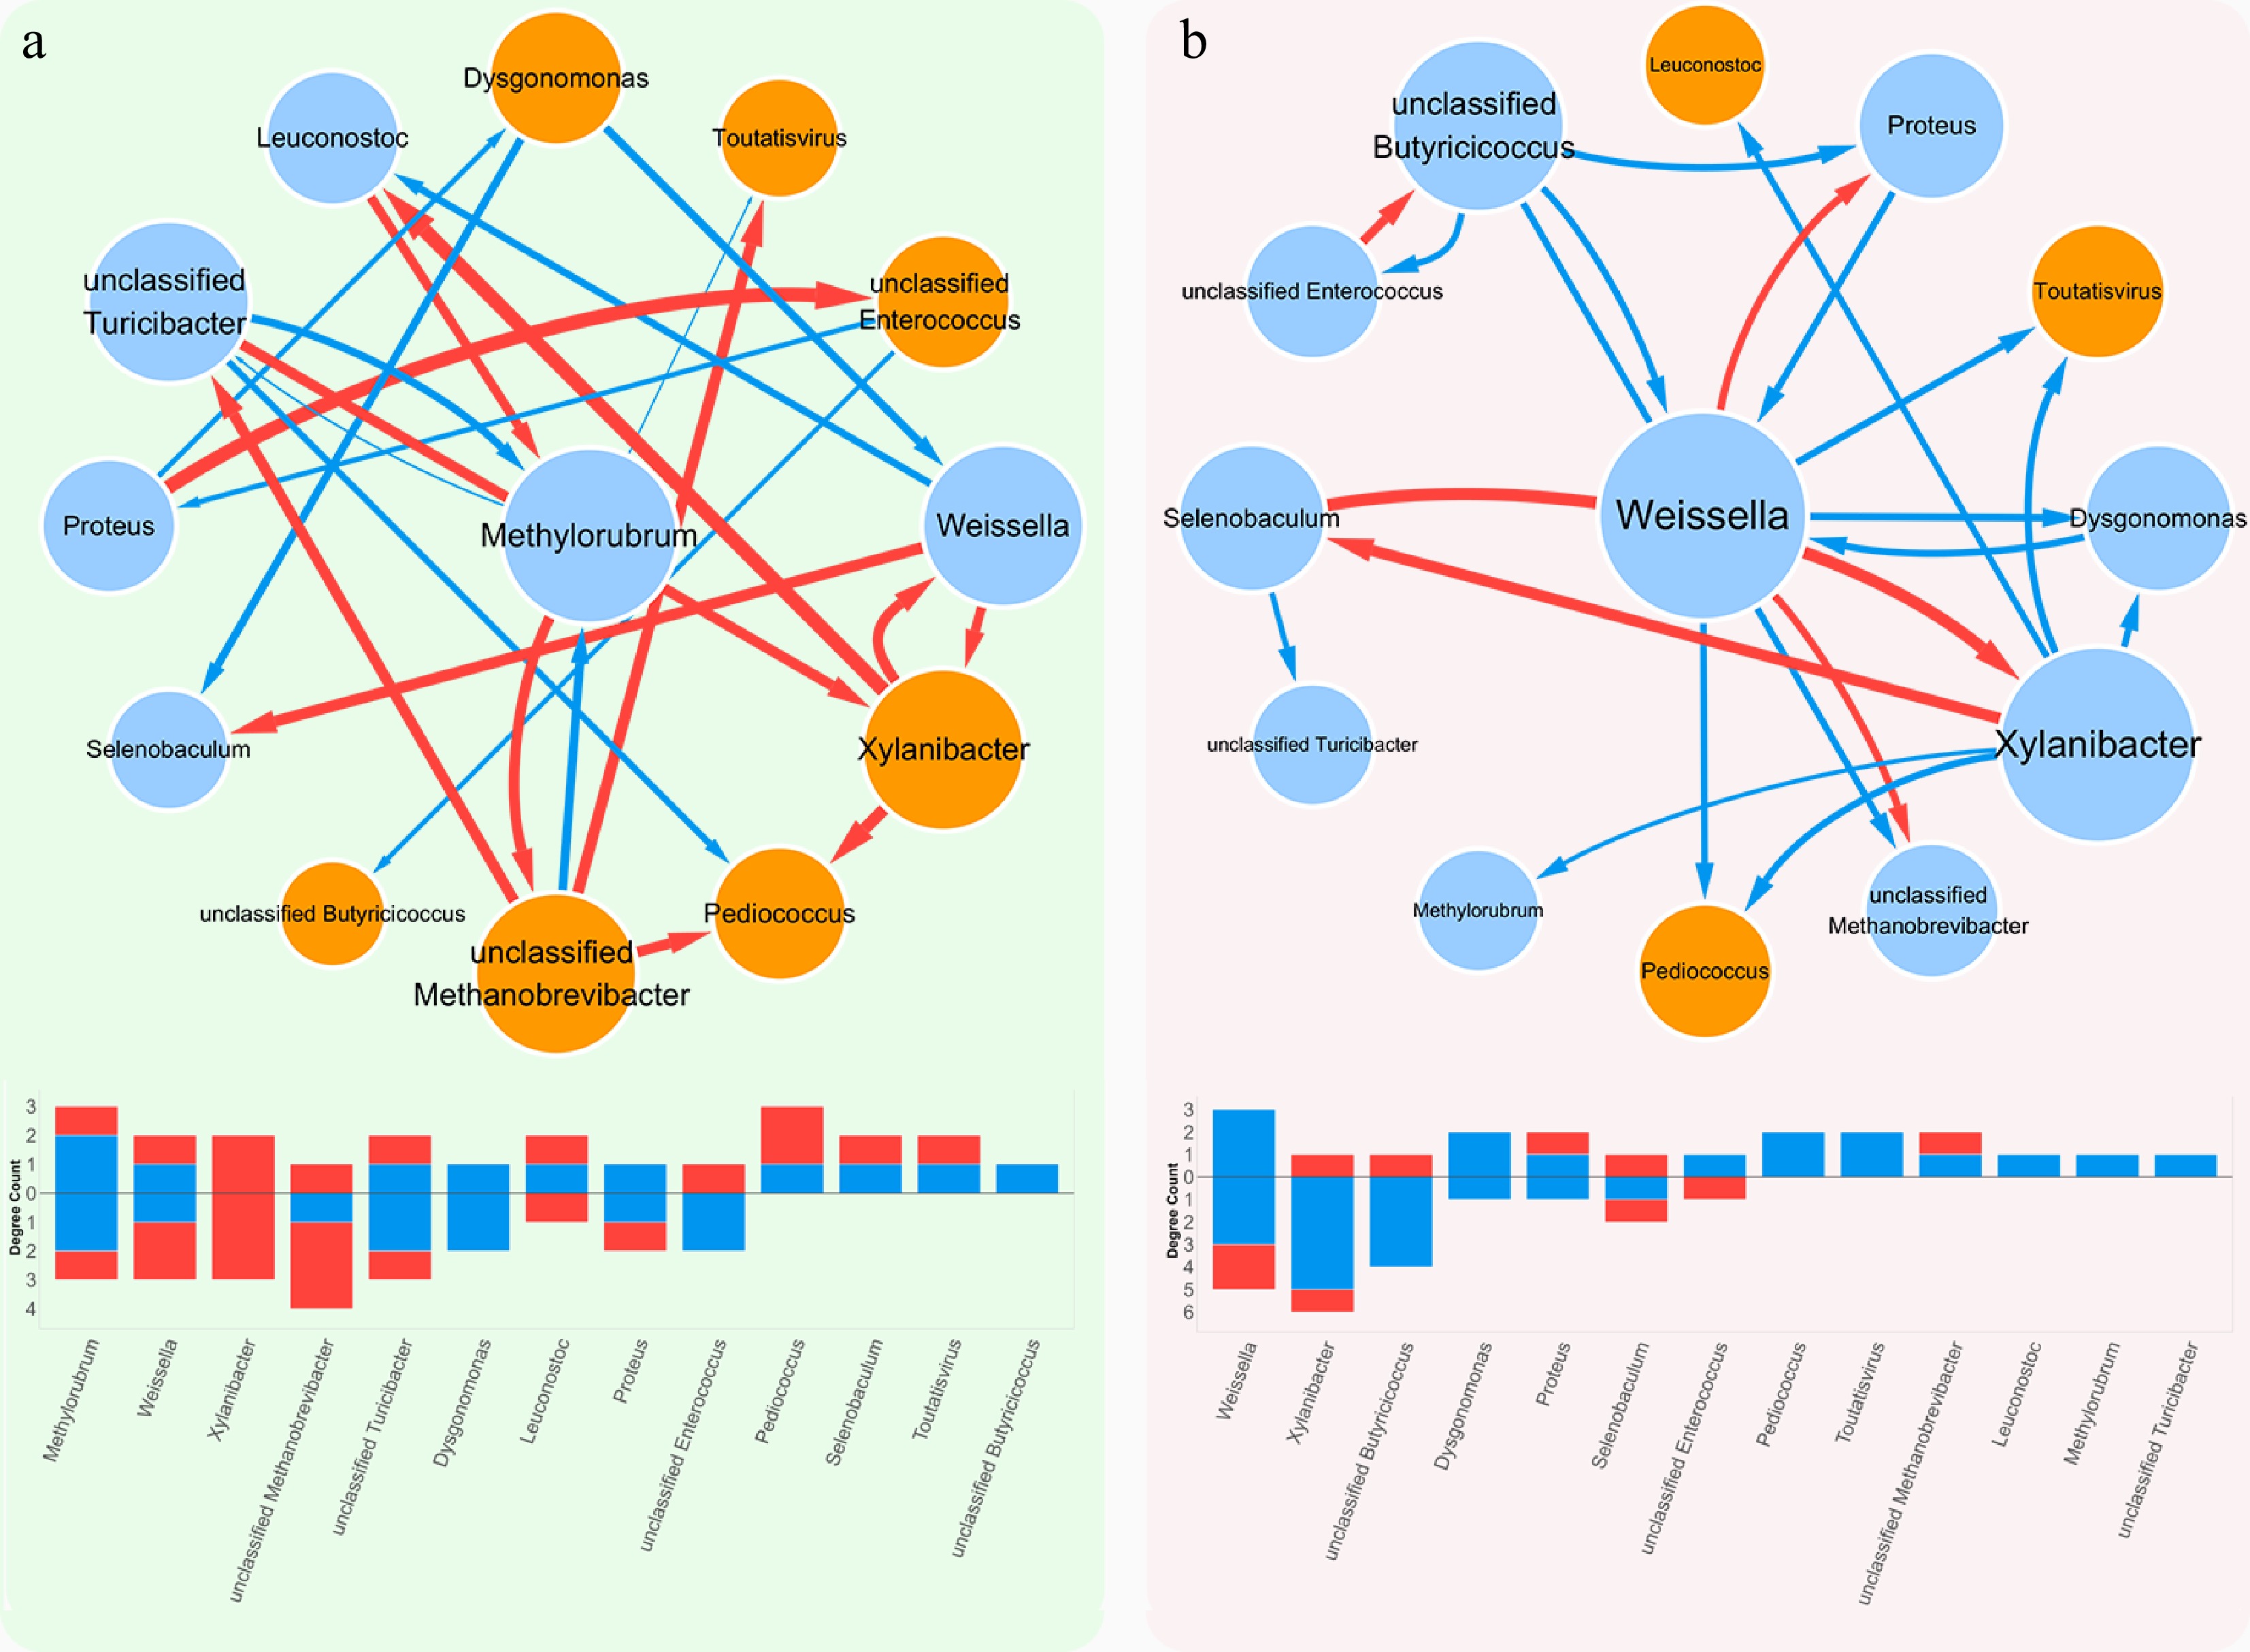
Figure 6.
Fine-grained interaction networks of module M4 under (a) healthy, and (b) adenoma conditions. The same color coding as in Fig. 4 is used to indicate positive and negative interactions. In healthy, Methylorubrum serves as the balanced hub, while in adenoma, Weissella becomes dominant with stronger connectivity, reflecting a shift from ecological stability to defensive and regulatory interactions.
-
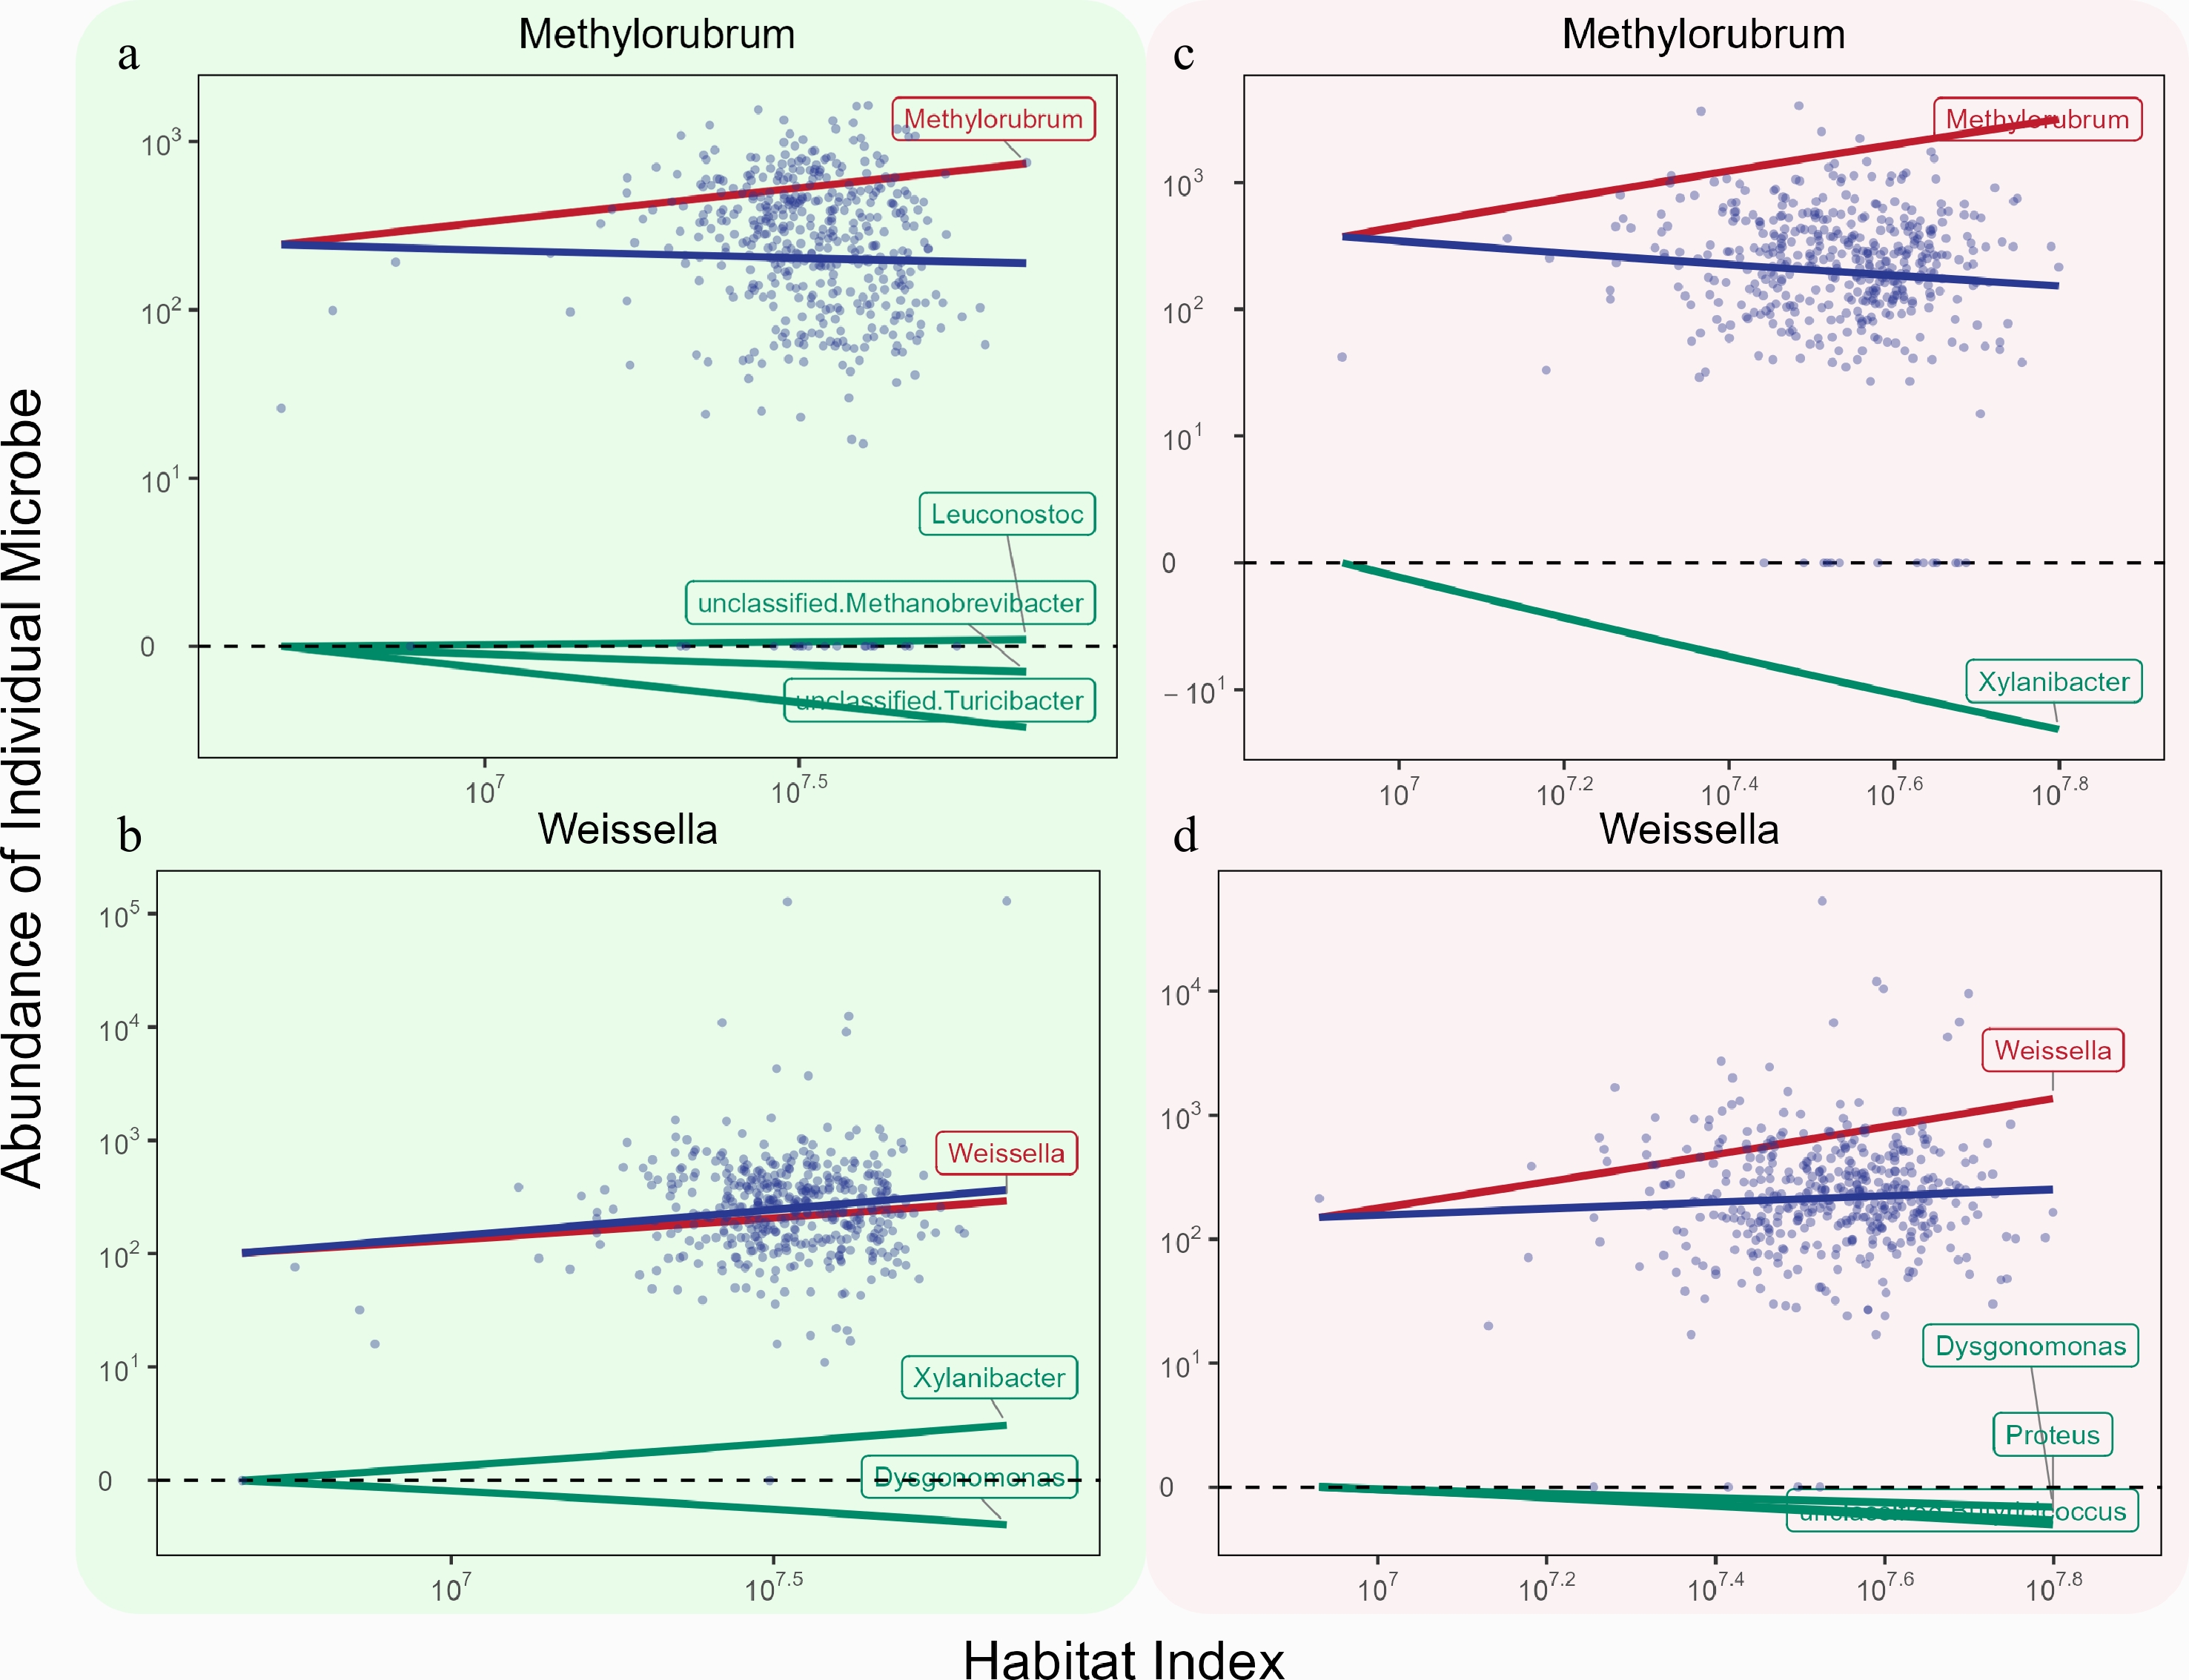
Figure 7.
Decomposition of independent and dependent effects for the two core hub microbes in module M4 under (a), (b) healthy, and (c), (d) adenoma conditions. Each panel shows the observed abundance trajectory (blue), the independent effect reflecting intrinsic ecological dynamics (green), and the dependent effect representing regulatory influences from other modules (red). Under healthy conditions, Methylorubrum is identified as the primary hub, with its abundance trajectory largely dominated by the independent effect and supplemented by moderate positive regulation from other modules. In contrast, under adenoma conditions, Weissella is identified as a dominant hub, with its abundance trajectory primarily shaped by a pronounced dependent effect.
-
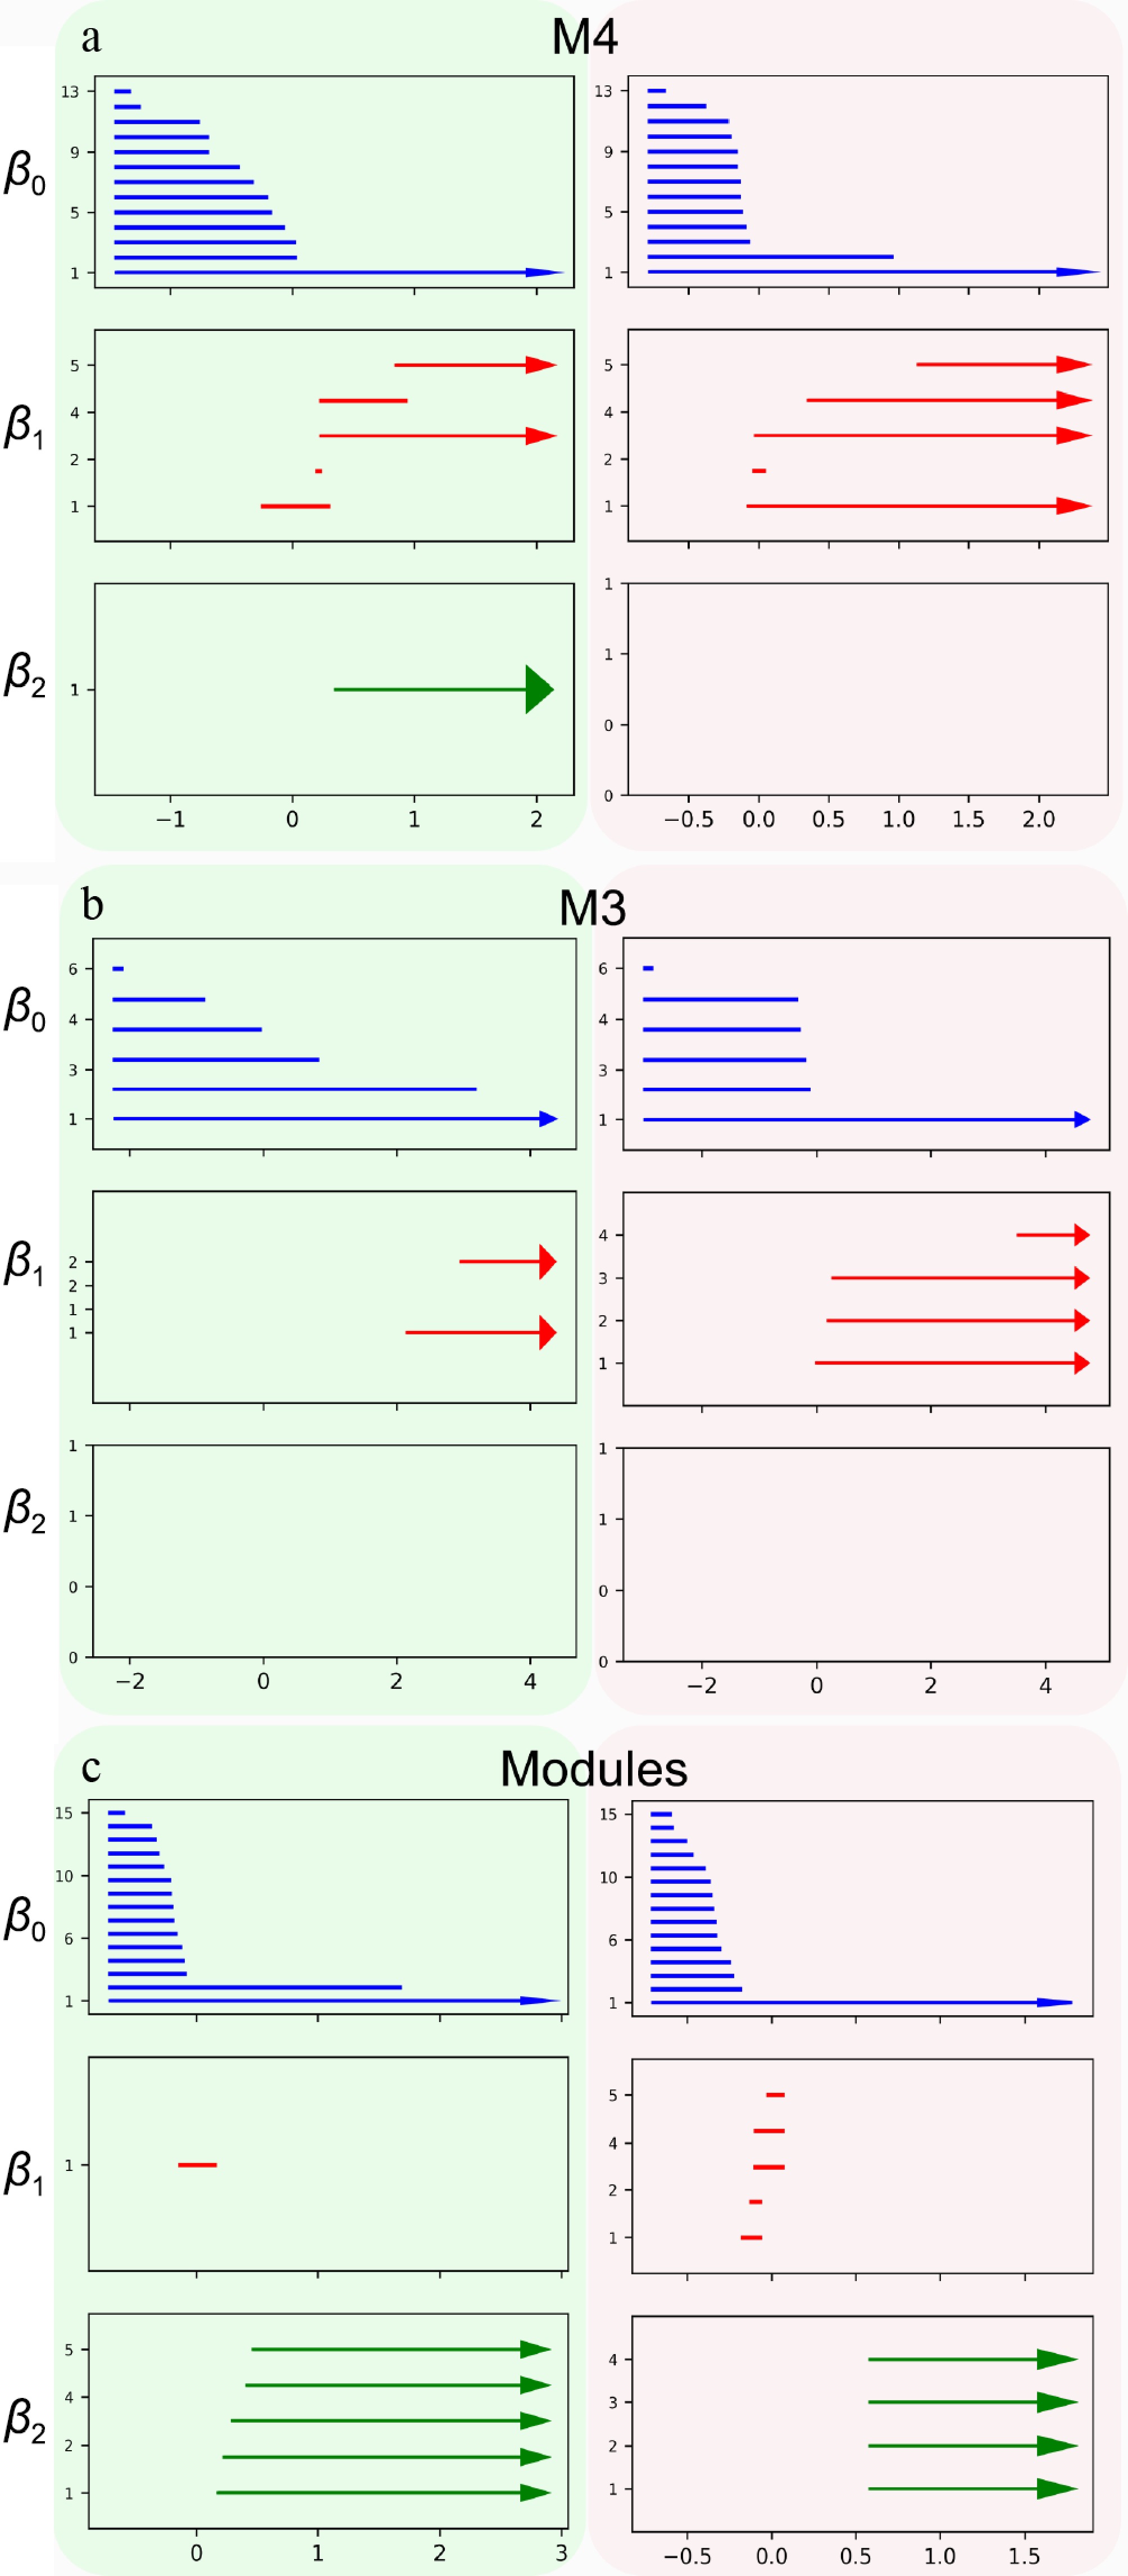
Figure 8.
GLMY homology analysis of microbial interaction networks under healthy and adenoma conditions. GLMY-based persistent homology was computed to quantify network topological features across different homology orders. A red background represents individuals with adenomas. A green background represents healthy controls. β0 (zero-order homology) indicates the number of connected components. β1 (first-order homology) captures the presence of one-dimensional loops, accounting for directed cycles and their interactions. β2 (second-order homology) reflects higher-order interacting structures formed by collections of directed paths.
Figures
(8)
Tables
(0)