












-
Colorectal cancer (CRC) ranks among the most commonly diagnosed malignancies worldwide and remains a leading cause of cancer-related mortality[1]. A substantial proportion of cases follow the well-described adenoma–carcinoma sequence, in which benign adenomatous polyps progressively accumulate oncogenic alterations and transition toward malignancy[2,3]. Understanding the biological characteristics of adenomas is therefore crucial, as it provides insights into the early events of colorectal tumorigenesis and identifies potential targets for prevention and early intervention[4]. Current evidence indicates that most CRCs develop through two major genetic instability routes: the majority of CRCs exhibit chromosomal instability (CIN), typically characterized by driver alterations in APC, TP53, KRAS, and related genes, whereas a subset display microsatellite instability (MSI), often resulting from mismatch repair deficiency or sporadic BRAFV600E-associated promoter silencing[5−7]. Despite these well-defined molecular trajectories, clinical heterogeneity persists: individuals harboring similar mutational landscapes often diverge in disease onset and progression. This discrepancy suggests that additional modulatory factors may contribute to CRC heterogeneity. Increasing evidence implicates the gut microbiome as one such factor, capable of reshaping the tumor microenvironment and interacting with host genetics in ways that may influence tumorigenesis (Fig. 1a)[8]. However, the majority of microbiome studies focus narrowly on differential taxonomic abundance, overlooking the intricate network of microbial interactions that may critically modulate the adenoma–carcinoma continuum.
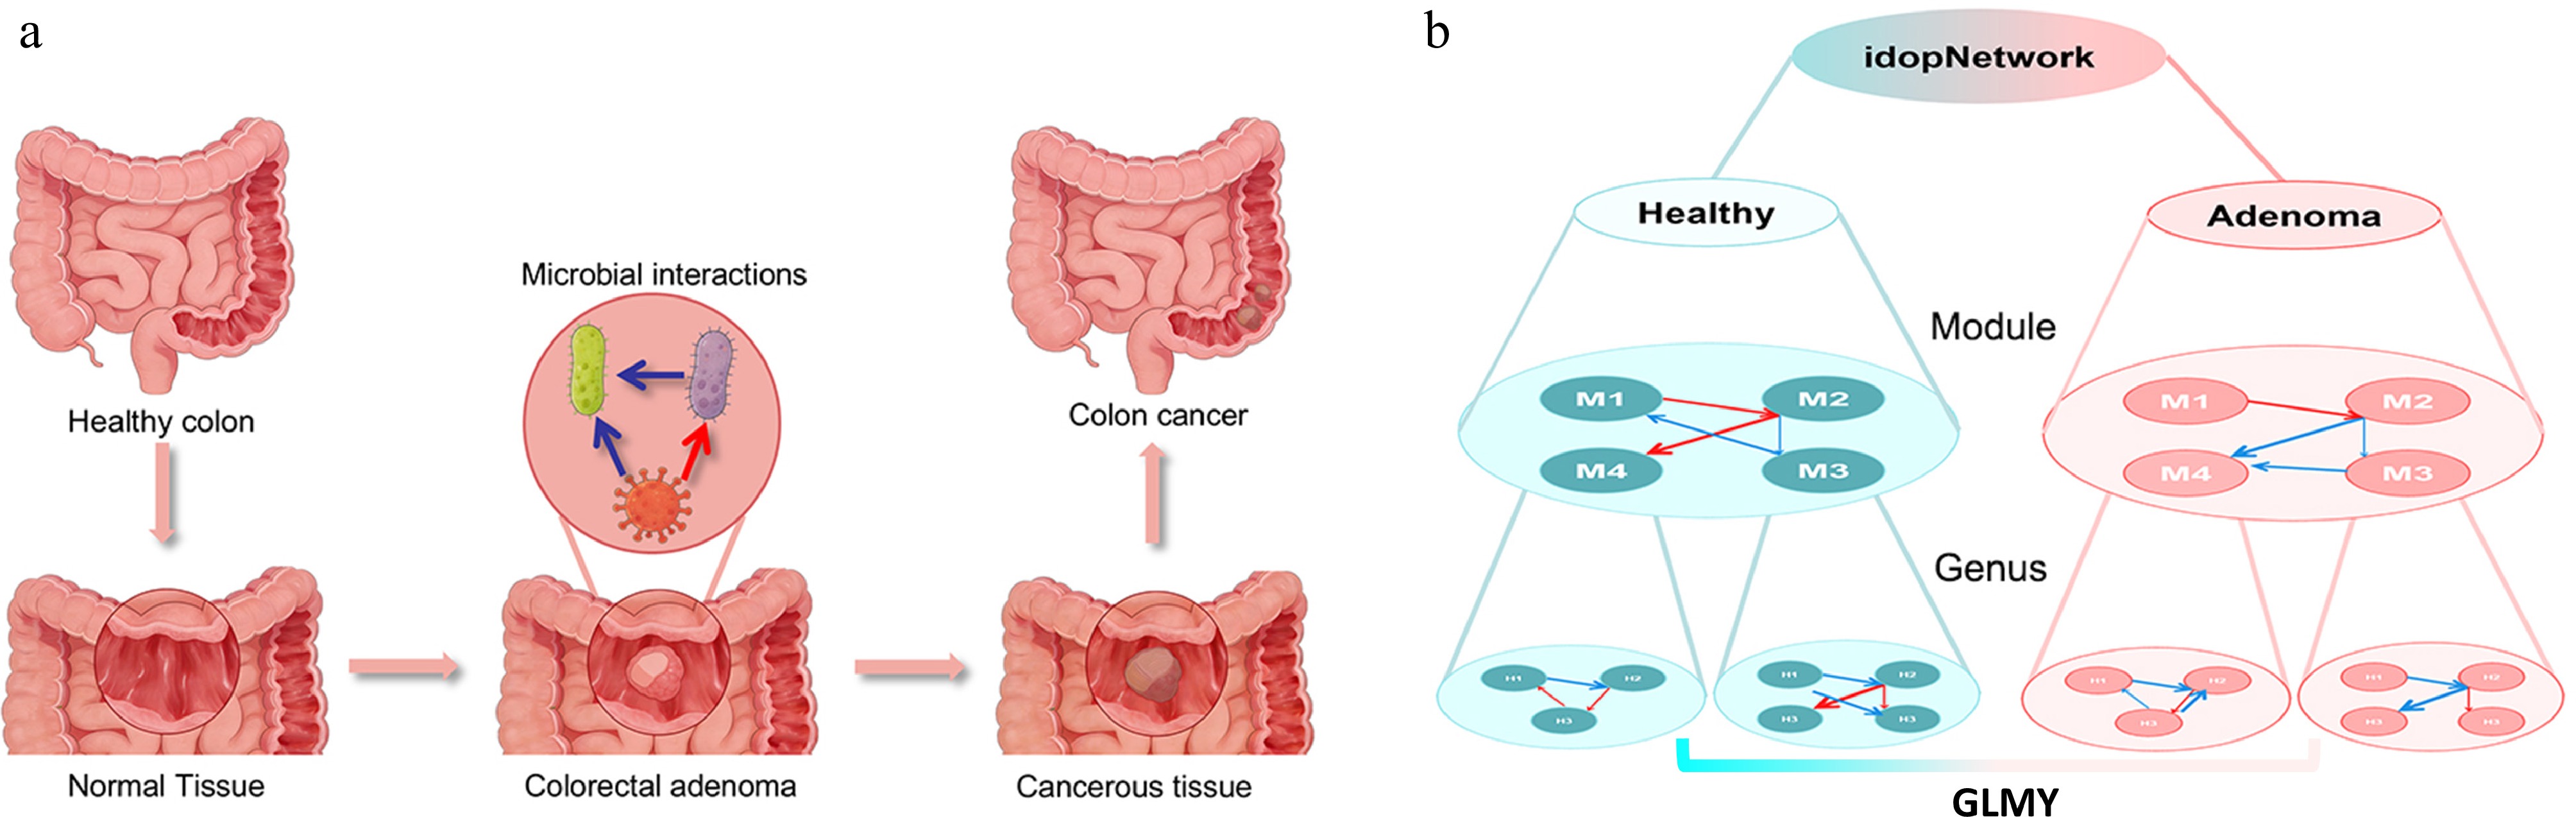
Figure 1.
Schematic overview of colorectal disease progression and idopNetwork–GLMY analysis of microbial interaction. (a) illustrates the stepwise progression of colorectal tissue from a healthy state to colorectal adenoma and ultimately to colorectal cancer. The enlarged central panel highlights microbial interactions at the adenoma stage, where distinct microbial taxa engage in cooperative or antagonistic interactions that may influence the local microenvironment. (b) depicts the multi-scale microbial interaction networks constructed from healthy and adenoma populations using idopNetwork. The inferred networks are subsequently analyzed using GLMY-based homological analysis to characterize and compare their topological organization, enabling systematic assessment of network-level structural differences between healthy and adenoma-associated states.
The gut microbiome is a dynamic, interdependent community in which complex interactions, rather than the presence of any single taxon, emerge as key determinants of host health or disease[9]. Conceptualizing colorectal adenoma as a potential 'network disorder' underscores the importance of a systems-level perspective, in which disease arises from community-wide perturbations of microbial interactions rather than isolated compositional shifts. In this framework, subtle alterations in interaction sign or strength during the adenoma–carcinoma sequence may reorganize microbial networks in ways that predispose to neoplastic progression[10,11]. Yet, implementing such a systems-level analysis poses several methodological challenges. Traditional approaches such as correlation-based co-occurrence networks typically infer static and population-averaged associations that obscure inter-individual heterogeneity and fail to distinguish direct from indirect interactions. Moreover, they generally fail to resolve interaction directionality[12]. Moreover, while longitudinal data are best suited to capture microbial dynamics, most clinical microbiome studies rely on cross-sectional sampling due to logistical constraints[13].
To address these limitations, we applied idopNetwork[14], a graph-based statistical model that reconstructs microbial networks from cross-sectional abundance data (Fig. 1b). The framework is characterized by four key features: full-information integration that combines abundance scaling and interaction effects, quasi-dynamic modeling that orders static data to achieve a quasi-dynamic representation, omnidirectional interaction inference that captures bidirectional, signed, and weighted relationships among taxa, and personalized network reconstruction that derives sample-specific network structures. By modeling microbial communities as complex systems and applying an allometric scaling law within the qdODEs framework, idopNetwork decomposes each species' abundance into independent and dependent components, enabling the inference of species-specific interactions. To quantify higher-order structural features, we analyzed the topology of idopNetwork using GLMY-based homological analysis. This homological framework enables the detection of multi-node interaction motifs and higher-order connectivity patterns, providing a principled means to assess structural complexity beyond conventional graph metrics. By adapting this integrated framework to microbial abundance data from 435 adenoma patients and 448 healthy controls, we aimed to:
1. Construct quasi-dynamic, multiscale microbial interaction networks;
2. Identify differences in inter- and intra-modular interaction patterns between healthy and adenoma-associated networks;
3. Compare network topological structures between healthy and adenoma groups.
Our findings suggest that network-level microbial shifts, particularly imbalanced inhibition between modules and altered hub connectivity, are associated with differences between healthy and adenoma-associated microbial communities. This study highlights the utility of idopNetwork in informing the identification of candidate microbial network biomarkers associated with early colorectal cancer risk stratification.
-
The study utilized gut microbiome data from the Nurses' Health Study II (NHSII), a long-running prospective cohort from the United States. A total of 883 stool samples were included, comprising 435 colorectal adenoma patients and 448 matched healthy controls. Cases and controls were matched based on age at stool collection, ethnicity, month of collection, state of residence, and the number and timing of recent endoscopy procedures.
All shotgun metagenomic sequencing data were downloaded from the National Center for Biotechnology Information (NCBI) Sequence Read Archive (SRA). To generate accurate microbial abundance profiles, raw sequencing reads were processed as follows:
1. Quality Filtering: low-quality bases and short reads were removed to ensure data reliability. Bases with Phred quality scores < 20 were considered low quality, and reads shorter than 60 bp after trimming were discarded.
2. Host Genome Removal: reads were aligned to the human reference genome GRCh38.p14 using Bowtie2 (v2.5.4) to remove host contamination. Only unmapped reads were retained for downstream microbial analyses.
3. Taxonomic Classification: the filtered reads were classified using Kraken2 (v2.17.1), which maps sequences against an official microbial reference database (GTDB v220).
4. Abundance Estimation: Bracken (v3.1) was applied to Kraken2 outputs to perform secondary estimation, producing standardized, high-precision species-level absolute abundance data.
The resulting microbial abundance table served as the input for all subsequent analyses, including bifunctional clustering, idopNetwork reconstruction, and GLMY-based homological analysis.
Module-level network analysis via allometric scaling and bifunctional clustering
-
We analyzed 883 gut microbiome samples, including 448 healthy controls and 435 colorectal adenoma patients, each characterized by abundance profiles of 630 microbial taxa retained after preprocessing. Microbial abundance tables were subjected to a two-step filtering procedure to reduce sparsity and low-prevalence features. First, taxa were filtered based on mean relative abundance computed from column-normalized data, retaining only those exceeding a threshold of 1 × 10⁻⁵. Second, a prevalence filter was applied to remove rare taxa, excluding features present in fewer than 30% of samples. These steps were uniformly applied across all datasets to ensure robustness and comparability in downstream analysis. Each gut microbiome sample was conceptualized as an ecological system composed of interacting microbial taxa. We quantified each sample by its Habitat Index (HI), defined as the log-transformed total microbial abundance, as a metric of overall community capacity. The part–whole relationship between individual microbial abundance
$ {y}_{ij} $ $ {y}_{j}\left({X}_{i}\right)={\alpha }_{j}X_{i}^{{\beta }_{j}} $ (1) where,
$ {\alpha }_{j} $ $ {\beta }_{j} $ $ j $ $ {X}_{i} $ Modular organization is a fundamental property of biological networks and is widely recognized as a design principle that enhances adaptability and robustness to perturbations. In microbial communities, modules were detected by a top-down strategy that decomposes the global microbiome network into module-level subnetworks based on HI-varying abundance patterns. We applied a power-law-based bifunctional clustering algorithm to group taxa into modules[16,17], selecting the optimal number of modules (15) using Bayesian information criterion (BIC). Specifically, model selection was guided by the elbow method applied to the BIC curve, where the number of clusters was chosen at the inflection point after a pronounced decrease, followed by a subsequent increase in BIC values[18,19]. This criterion balances model fit and complexity by penalizing overfitting, ensuring that the selected clustering solution captures meaningful structure in the data without introducing unnecessary model complexity. Once the modules were defined, we reconstructed coarse-grained regulatory networks among modules to capture inter-module interactions, as well as fine-grained networks within each module to characterize intra-module relationships. This framework enables mechanistic, scalable analysis of module-level reorganization in adenoma-associated vs healthy gut microbiomes.
Evolutionary game theoretic modeling of interactions
-
To interpret how microbial modules interact across samples, we integrated principles from evolutionary game theory to formulate module–module interactions using ordinary differential equations (ODEs) along the Habitat Index (HI) gradient. Specifically, for an L-module network at a coarse-grained level, the dynamical behavior of a given phenotypic group, such as healthy controls (k = 1) or adenoma patients (k = 2), can be formally described as follows:
$ y_{k}{'}\left({X}_{i}\right)=\left[\begin{array}{c} \dfrac{d{y}_{1k}\left({X}_{i}\right)}{d{X}_{i}}\\ \vdots\\ \dfrac{d{y}_{Lk}\left({X}_{i}\right)}{d{X}_{i}} \end{array}\right]=\left[\begin{array}{c} {Q}_{1k}\left[{y}_{1k}\left({X}_{i}\right);{\theta }_{1k}\right]+\sum_{j=2}^{L}\,{Q}_{1jk}\left[{y}_{jk}\left({X}_{i}\right);{\theta }_{1jk}\right]\\ \vdots\\ {Q}_{Lk}\left[{y}_{Lk}\left({X}_{i}\right);{\theta }_{Lk}\right]+\sum_{j=1}^{L-1}\,{Q}_{Ljk}\left[{y}_{jk}\left({X}_{i}\right);{\theta }_{Ljk}\right] \end{array}\right] $ (2) In Eq. (2),
$ {y}_{jk}({X}_{i}) $ $ j $ $ i $ $ k $ $ [{Q}_{jk}({y}_{jk}({X}_{i});{\theta }_{jk})] $ $[ {Q}_{j{{j}{'}}k}({y}_{{{j}{'}}k}({X}_{i});{\theta }_{j{{j}{'}}k})] $ Unlike conventional ODEs over time, these equations are defined along the HI gradient, which serves as a quasi-time representing total community abundance. By solving these qdODEs, we can quantify contributions of independent and dependent effects for each sample, enabling reconstruction of personalized microbial interaction networks and comparison of module interactions between healthy and adenoma microbiomes.
Variable selection
-
In microbial networks, biological constraints limit the number of stable interactions per taxon, motivating the use of sparse interaction models. For each taxon
$ j $ To identify the most influential taxa effecting taxon
$ j $ $ {\text{y}}_{j}=[{y}_{j}({X}_{1}), \cdots ,{y}_{j}({X}_{n}){]}^{T} $ $ j $ $ n $ $ {\text{X}}_{-j} $ $ {\text{y}}_{j}={\text{X}}_{-j}{\beta }_{j}+{\varepsilon }_{j} $ (3) where,
$ {\beta }_{j}=({\beta }_{j{{j}{'}}}{)}_{{{j}{'}}\neq j} $ $ j $ $ {\varepsilon }_{j} $ The adaptive LASSO estimator is defined as:
$ \hat{\beta }_{j}^{(AL)}=\mathrm{arg}\underset{{\beta }_{j}}{\min }\,\{\dfrac{1}{2n}\| {\text{y}}_{j}-{\text{X}}_{-j}{\beta }_{j}\|_{2}^{2}+\sum\limits_{{j}{'}\neq j}\,{w}_{j{{j}{'}}}|{\beta }_{j{{j}{'}}}|\},\;{w}_{j{{j}{'}}}=\dfrac{1}{|\hat{\beta }_{j{j}{'}}^{(init)}{|}^{\gamma }} $ (4) where,
$ {w}_{j{{j}{'}}} $ $ \hat{\beta }_{j{j}{'}}^{(init)} $ $ \gamma >0 $ Applying adaptive LASSO on power-law transformed abundances retains only the most significant interacting taxa for each focal taxon, producing a sparse and interpretable microbial interaction network that reflects both part–whole scaling and intrinsic connectivity constraints.
GLMY-based microbial network analysis
-
In this study, we extend idopNetwork analysis by applying GLMY homology theory to analyze the higher-order topological features of directed interaction networks. GLMY homology provides an algebraic framework for analyzing directed networks, enabling quantitative multi-order topological comparison across phenotypic conditions[20,21]. Consider a directed network
$ G=(V,E) $ $ V=\{{v}_{1}, \cdots ,{v}_{n}\} $ $ E \subseteq V \times V $ $ p $ $ p+1 $ $ \left({v}_{{{i}_{0}}},{v}_{{{i}_{1}}}, \cdots ,{v}_{{{i}_{p}}}\right),{v}_{{{i}_{j}}}\in V $ (5) Let
$ {\text{Λ}}_{p} $ $ F $ $ p $ $ {\partial }_{p}:{\text{Λ}}_{p}\rightarrow{\text{Λ}}_{p-1},{\partial }_{p}({v}_{{{i}_{0}}}, \cdots ,{v}_{{{i}_{p}}})=\sum\limits_{j=0}^{p}\,(-1{)}^{j}\left({v}_{{{i}_{0}}}, \cdots ,{\hat{v}}_{{{i}_{j}}}, \cdots ,{v}_{{{i}_{p}}}\right) $ (6) where,
$ {\hat{v}}_{{{i}_{j}}} $ $ j $ $ {\Omega}_{p}\subseteq {\mathcal{A}}_{p} $ $ \cdots \xrightarrow{\partial_{p+1}} \Omega_p \xrightarrow{\partial_p} \Omega_{p-1} \xrightarrow{\partial_{p-1}} \cdots$ (7) The pth GLMY homology group is defined as:
$ {H}_{p}\left(G\right)=\dfrac{\ker \left({\partial }_{p}\right)}{\text{im}\left({\partial }_{p+1}\right)} $ (8) and its rank, the pth GLMY Betti number, is denoted by:
$ {\beta }_{p}=\mathrm{rank}{H}_{p}\left(G\right) $ (9) These Betti numbers provide a hierarchy of topological insights (
$ {\beta }_{0} $ $ {\beta }_{1} $ $ {\beta }_{p} $ $ p\leqslant 2 $ $ {G}_{0}\subseteq {G}_{1}\subseteq \cdots \subseteq {G}_{n}=G $ $ {G}_{i} $ $ {H}_{p}({G}_{i}) $ $ {f}_{i}:{H}_{p}\left({G}_{i}\right)\rightarrow{H}_{p}\left({G}_{i+1}\right) $ Likelihood and test
-
A fundamental challenge in microbial network reconstruction is determining whether each edge in the network truly exists, that is, assessing whether interactions between microbes are statistically significant. To address this, we implemented a likelihood ratio (LR) testing framework comparing a qdODE model with interactions (H1) to a baseline model assuming independent microbial growth (H0).
Under the null hypothesis (H0), we assume that a focal microbe
$ j $ $ {y}_{j}({X}_{i}) $ $ j $ $ i $ $ \hat{y}_{j}^{H0}\left({X}_{i}\right)={Q}_{j}\left({y}_{j}\left({X}_{i}\right);{\theta }_{j}\right) $ (10) where,
$ {Q}_{j}(\cdot) $ $ j $ $ {\theta }_{j} $ Under the alternative hypothesis (H1), we include the interactions with a set of dependent microbes
$ {j}{'} $ $ \hat{y}_{j}^{H1}({X}_{i})={Q}_{j}({y}_{j}({X}_{i});{\theta }_{j})+\sum\limits_{{j}{'}}\,{Q}_{j{{j}{'}}}({y}_{{{j}{'}}}({X}_{i});{\theta }_{j{{j}{'}}}) $ (11) where,
$ {Q}_{j{{j}{'}}}(\cdot) $ $ {j}{'} $ $ j $ $ {\theta }_{j{{j}{'}}} $ Assuming independent, normally distributed residuals with variance
$ \sigma _{H0}^{2} $ $ \sigma _{H1}^{2} $ $\begin{gathered} \log {L}_{H0}=\sum\limits_{i=1}^{n}\,\log \text{N(}{y}_{j}({X}_{i}) |\hat{y}_{j}^{H0}({X}_{i}),\sigma _{H0}^{2}), \\ log{L}_{H1}=\sum\limits_{i=1}^{n}\,\log \text{N(}{y}_{j}({X}_{i}) |\hat{y}_{j}^{H1}({X}_{i}),\sigma _{H1}^{2}) \end{gathered}$ (12) The likelihood ratio (LR) statistic is then computed as:
$ {\text{LR}}_{j}=2(\log{L}_{H1}-\log{L}_{H0}) $ (13) To assess statistical significance, we perform a permutation test: the abundance of microbe
$ j $ $ {n}_{\text{perm}} $ $ \text{LR}_{j}^{\text{perm}} $ $ {\text{LR}}_{j} \gt \text{quantile(LR}_{j}^{\text{perm}},0.95) $ (14) This permutation-based inference does not rely on asymptotic chi-square approximations or explicit degrees-of-freedom calculations and remains valid under the qdODEs framework with nonparametric components. This framework ensures that the reconstructed microbial networks (idopNetwork) contain edges that represent statistically supported interactions, capturing meaningful and significant microbial dependencies beyond independent growth.
-
We analyzed 630 microbial taxa across 883 gut microbiome samples (435 adenoma and 448 healthy controls) within an allometric scaling framework. The healthy microbiome exhibited a broader HI range (6.676–7.862) than the adenoma group (6.931–7.799), potentially suggesting greater ecological flexibility and adaptive capacity in health[22]. Examining four representative microbial taxa revealed specific scaling shifts (Fig. 2). Mogibacterium displayed positive scaling in healthy individuals but negative scaling in adenoma samples, whereas Saccharothrix and Spiroplasma shifted from near-neutral to negative scaling. In contrast, Slackia exhibited consistently weak negative scaling across both health states. Together, these findings demonstrate that allometric scaling laws effectively capture distinct microbial variation patterns between healthy and adenoma-associated gut ecosystems.
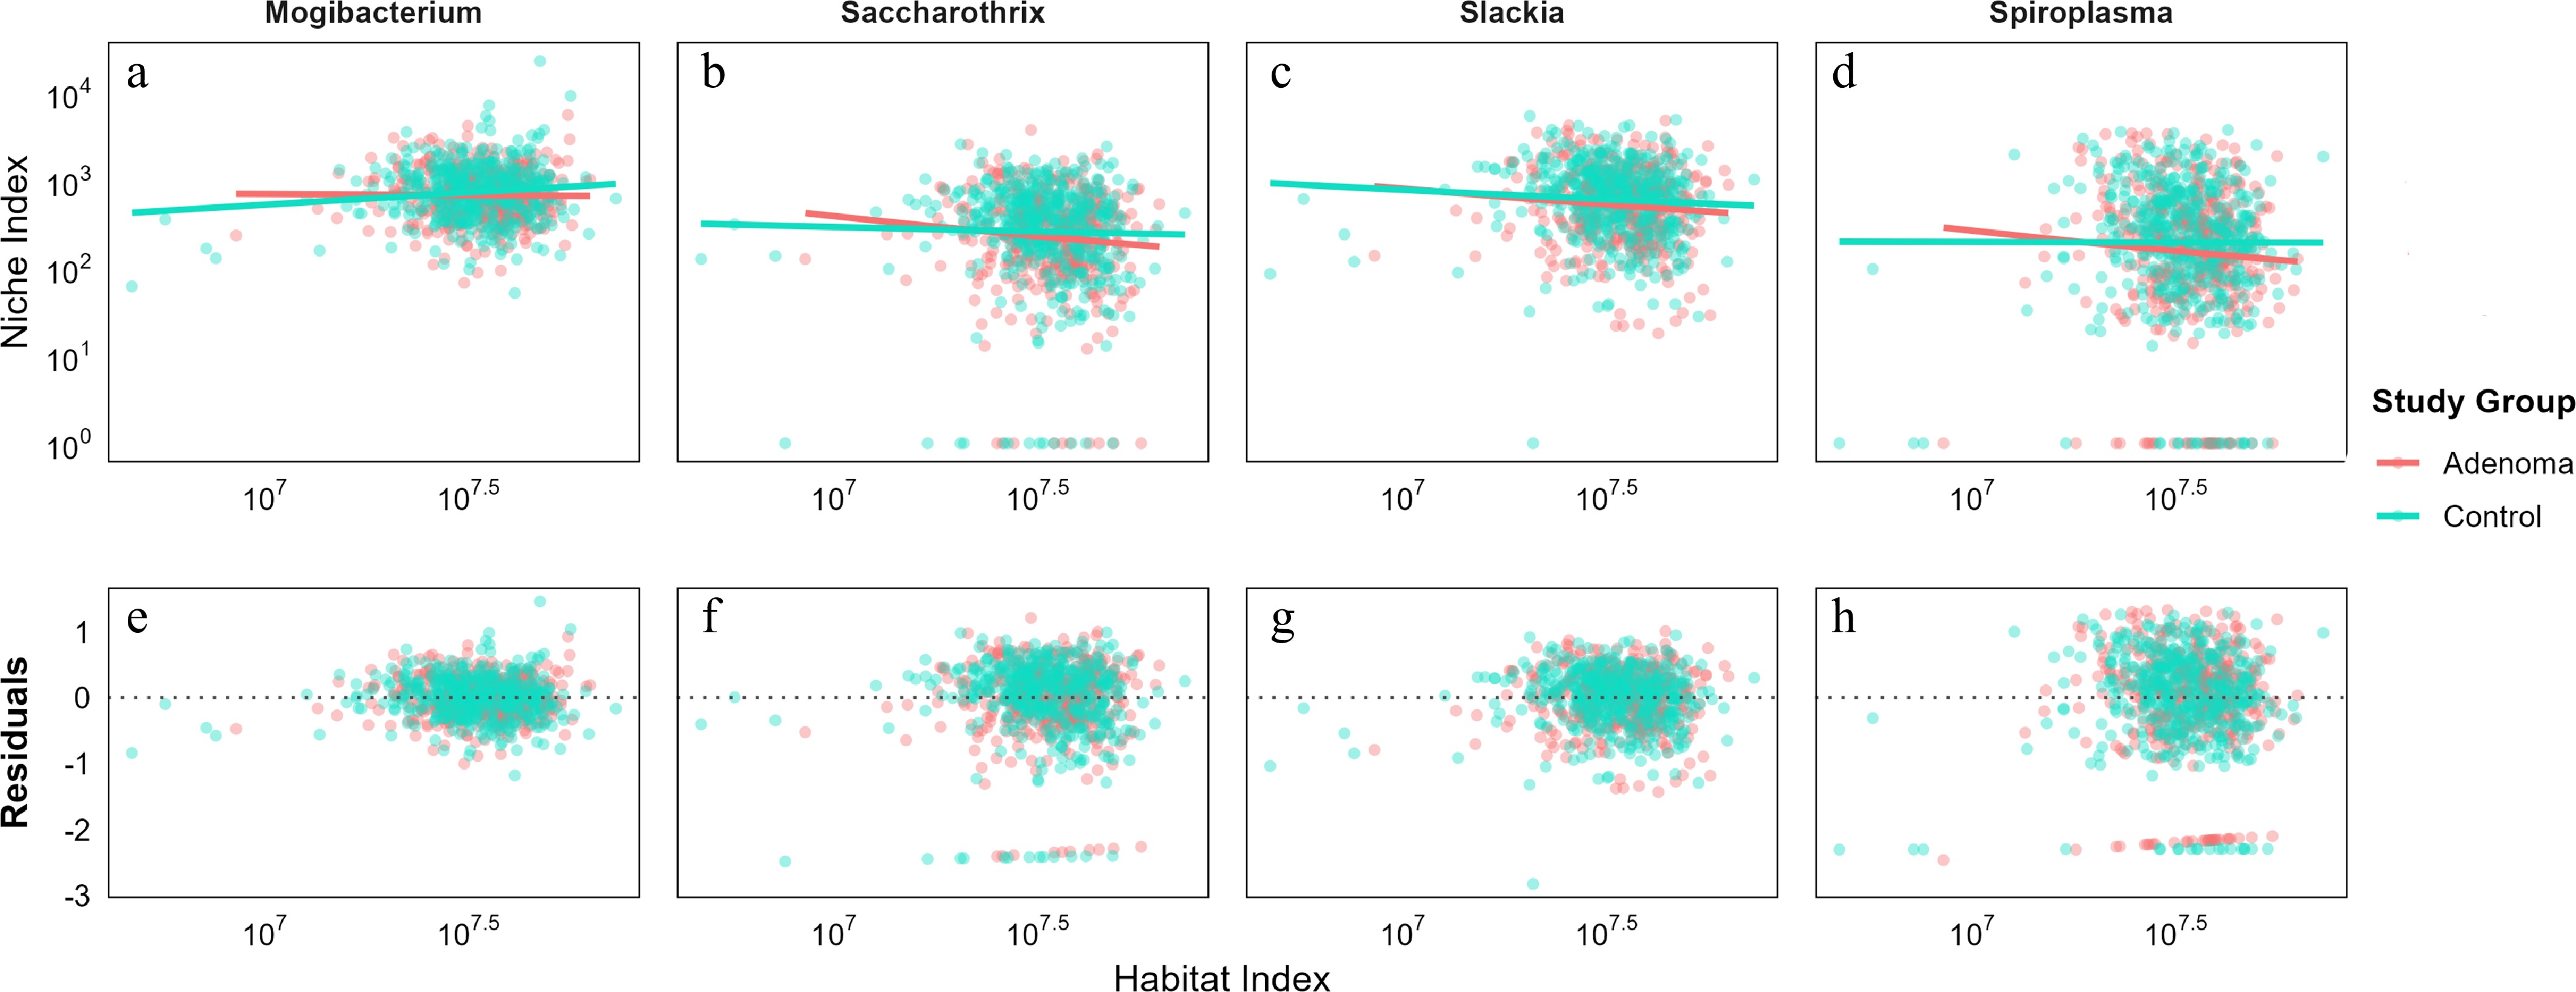
Figure 2.
Allometric scaling relationships of representative microbial taxa under healthy and adenoma conditions. The figure illustrates the differential scaling patterns of four microbial taxa (Mogibacterium, Saccharothrix, Spiroplasma, and Slackia) with respect to Habitat Index (HI) between healthy controls (green) and adenoma patients (red). (a)−(d) The fitted allometric curves (y = αXβ) describing the scaling relationship between (y) taxon abundance and (x) total community abundance; and (e)–(h) corresponding residual plots used to assess the adequacy of the power-law model fits.
Clustering analysis of the 630 microbial taxa identified 15 distinct functional modules (Fig. 3). For the majority of modules, the mean HI-dependent scaling patterns were broadly similar between healthy and adenoma groups. This pattern is consistent with adenoma representing an intermediate stage of colorectal carcinogenesis, as previous studies have shown that microbiome configurations in adenomas largely resemble those of non-lesion tissues, with no significant differences in overall diversity. In contrast, pronounced community reorganization emerges predominantly at the carcinoma stage, indicating that microbiome dysbiosis differs across disease states rather than appearing abruptly[23]. This consistency suggests that a substantial fraction of the gut microbiota is governed by shared ecological and host-related constraints, such as common dietary exposures or host-derived selection pressures, that operate across disease states[24,25]. Nonetheless, distinct scaling patterns were observed for a subset of microbial modules. Modules including M1, M4, and M11 demonstrated differences in scaling patterns between healthy and adenoma groups, highlighting sub-communities associated with disease status and likely contributing to adenoma-associated dysbiosis. Collectively, these findings indicate that while much of the gut microbiota exhibits similar scaling patterns across groups, some modules show group-specific differences that may be relevant to adenoma-associated microbial variation.
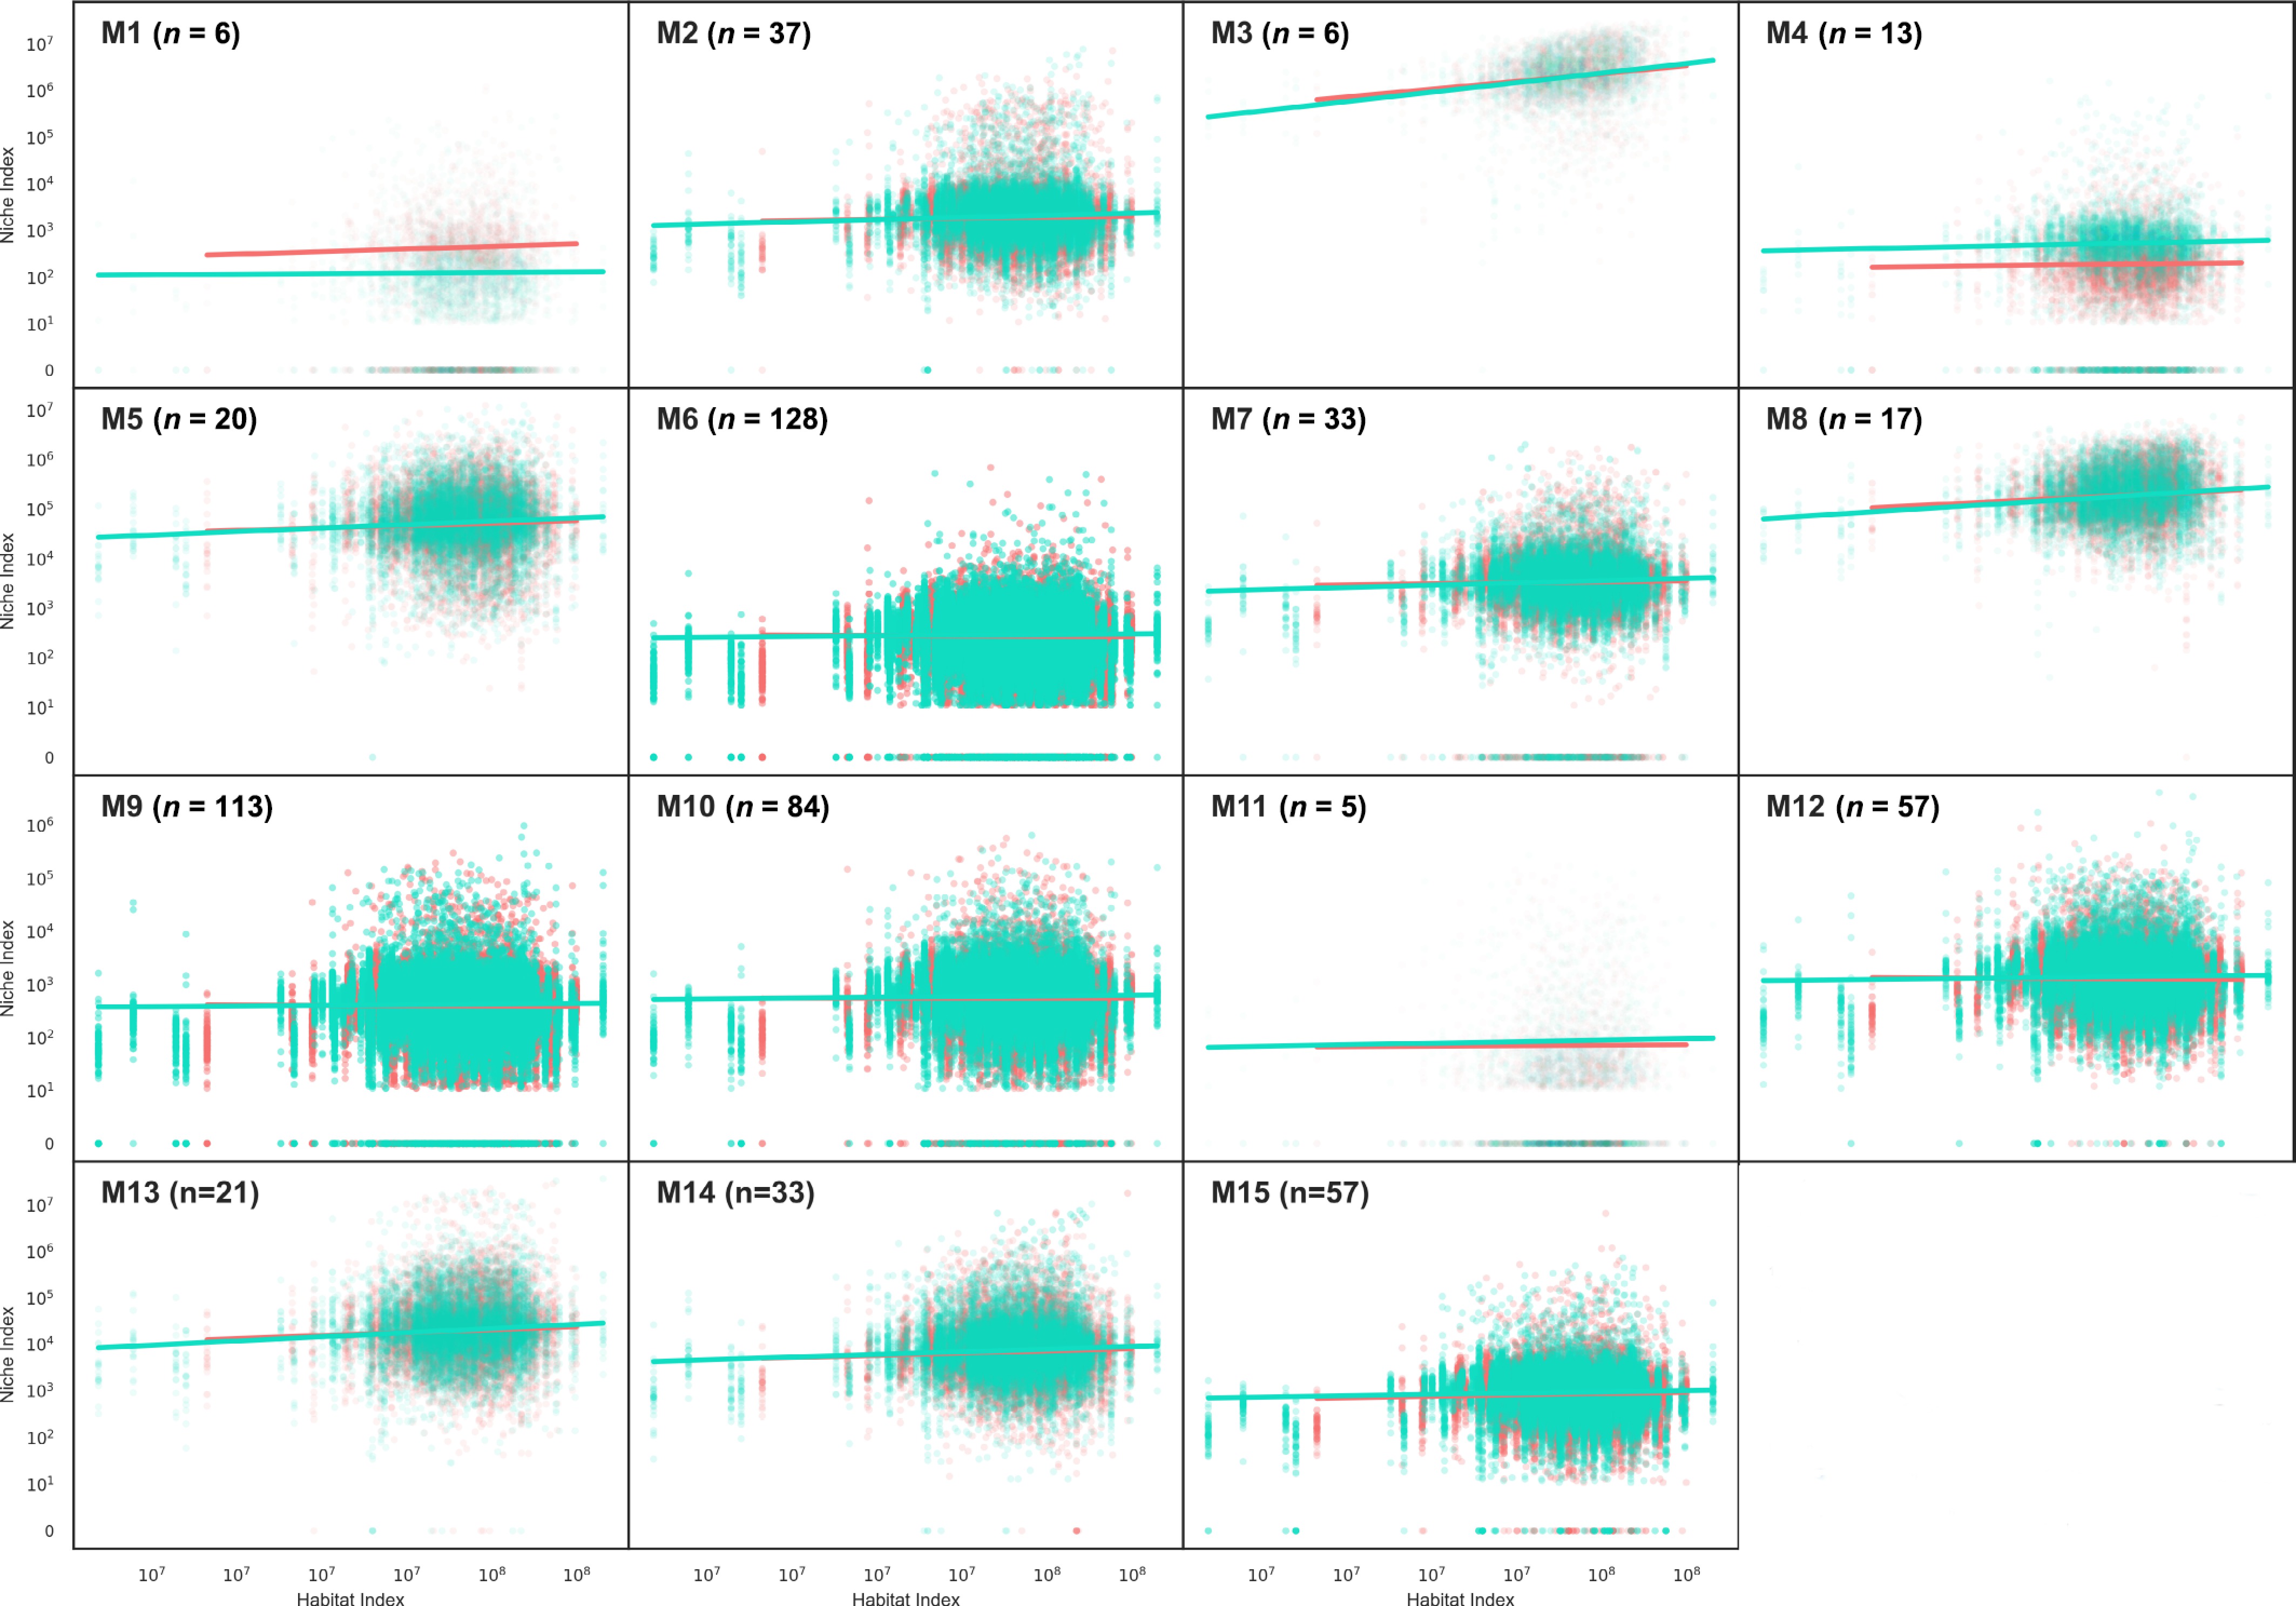
Figure 3.
Bifunctional clustering of 630 microbial features across adenoma (n = 435) and healthy control (n = 448) samples. This approach partitioned the microbial community into 15 distinct functional clusters, capturing shared ecological characteristics and differential associations with adenoma-associated dysbiosis. Red lines represent the adenoma group, whereas green lines denote the healthy control group.
Coarse-grained idopnetwork and modular functions
-
The 630 microbial taxa collectively form a global microbial interaction network. Such networks, however, are rarely homogeneous; instead, they typically exhibit community structures in which subsets of microbes are more densely connected with each other than to the rest of the network[26]. This makes it both reasonable and necessary to investigate whether the global network can be partitioned into distinct subnetworks. Such modular organization is a common property of biological systems: for example, gene regulatory networks cluster into transcriptional modules, and metabolic networks are organized into functional pathways[27,28]. By analogy, the gut microbiome is also expected to exhibit modular community structures that reflect coordinated ecological and functional relationships. Using bifunctional clustering, we identified 15 distinct microbial modules, each representing a fine-grained subnetwork (Fig. 3). These subnetworks can be further integrated into coarse-grained networks through inter-module links.
We constructed coarse-grained idopNetwork at the module level for adenoma and healthy groups (Fig. 4). Notably, the adenoma network (Fig. 4b) featured M4, M3, and M2 as major hub modules, whereas the healthy network (Fig. 4a) had M4, M3, and M6 as hubs. This indicates that, at the module level, the difference between adenoma patients and healthy individuals lies in differences in hub connectivity and inter-module interaction patterns. In the healthy group, positive and negative interactions were relatively balanced, consistent with a stable and resilient microbial community. In contrast, the adenoma network exhibited a predominance of negative interactions, indicating a relative imbalance in interaction types. Distributional analysis of inter-module links further suggested that both networks are scale-free, a hallmark of many biological and ecological systems. Functional annotation of modules using the NJC19 database (Supplementary Fig. S1) revealed that the core hub module M4 is involved in diverse metabolic processes, including carbohydrate utilization (e.g., glucose, lactose, D-tagatose), short-chain fatty acid production (notably acetate and L-lactate), and fermentation-related pathways (H2, ethanol, succinate). Permutation-test results for the module likelihood-ratio statistics are presented (Supplementary Fig. S2), while the corresponding statistical significance testing of the likelihood ratios for module M4 is shown (Supplementary Fig. S3). Importantly, acetate, a major metabolite of M4, has been shown to induce apoptosis in colorectal cancer cells and modulate glycolytic metabolism, suggesting a potential protective and therapeutic role in CRC, while D-tagatose, another key substrate utilized by M4 microbes, can be fermented by the large intestinal microbiota to increase butyrate production and lactobacilli abundance, indicating prebiotic and gut-protective effects[29,30]. Moreover, microbial metabolites that influence glycolysis could conceptually affect CRC phenotypes, as compounds such as 2-deoxy-D-glucose (2-DG) suppress glycolysis, reduce epithelial-to-mesenchymal transition, and enhance drug sensitivity in resistant CRC cells[31]. Supporting these observations, population-based studies suggest that dietary factors such as dairy intake can also confer protective effects against CRC, with high consumption associated with reduced CRC risk in both lactase non-persistent and lactase-persistent populations[32].
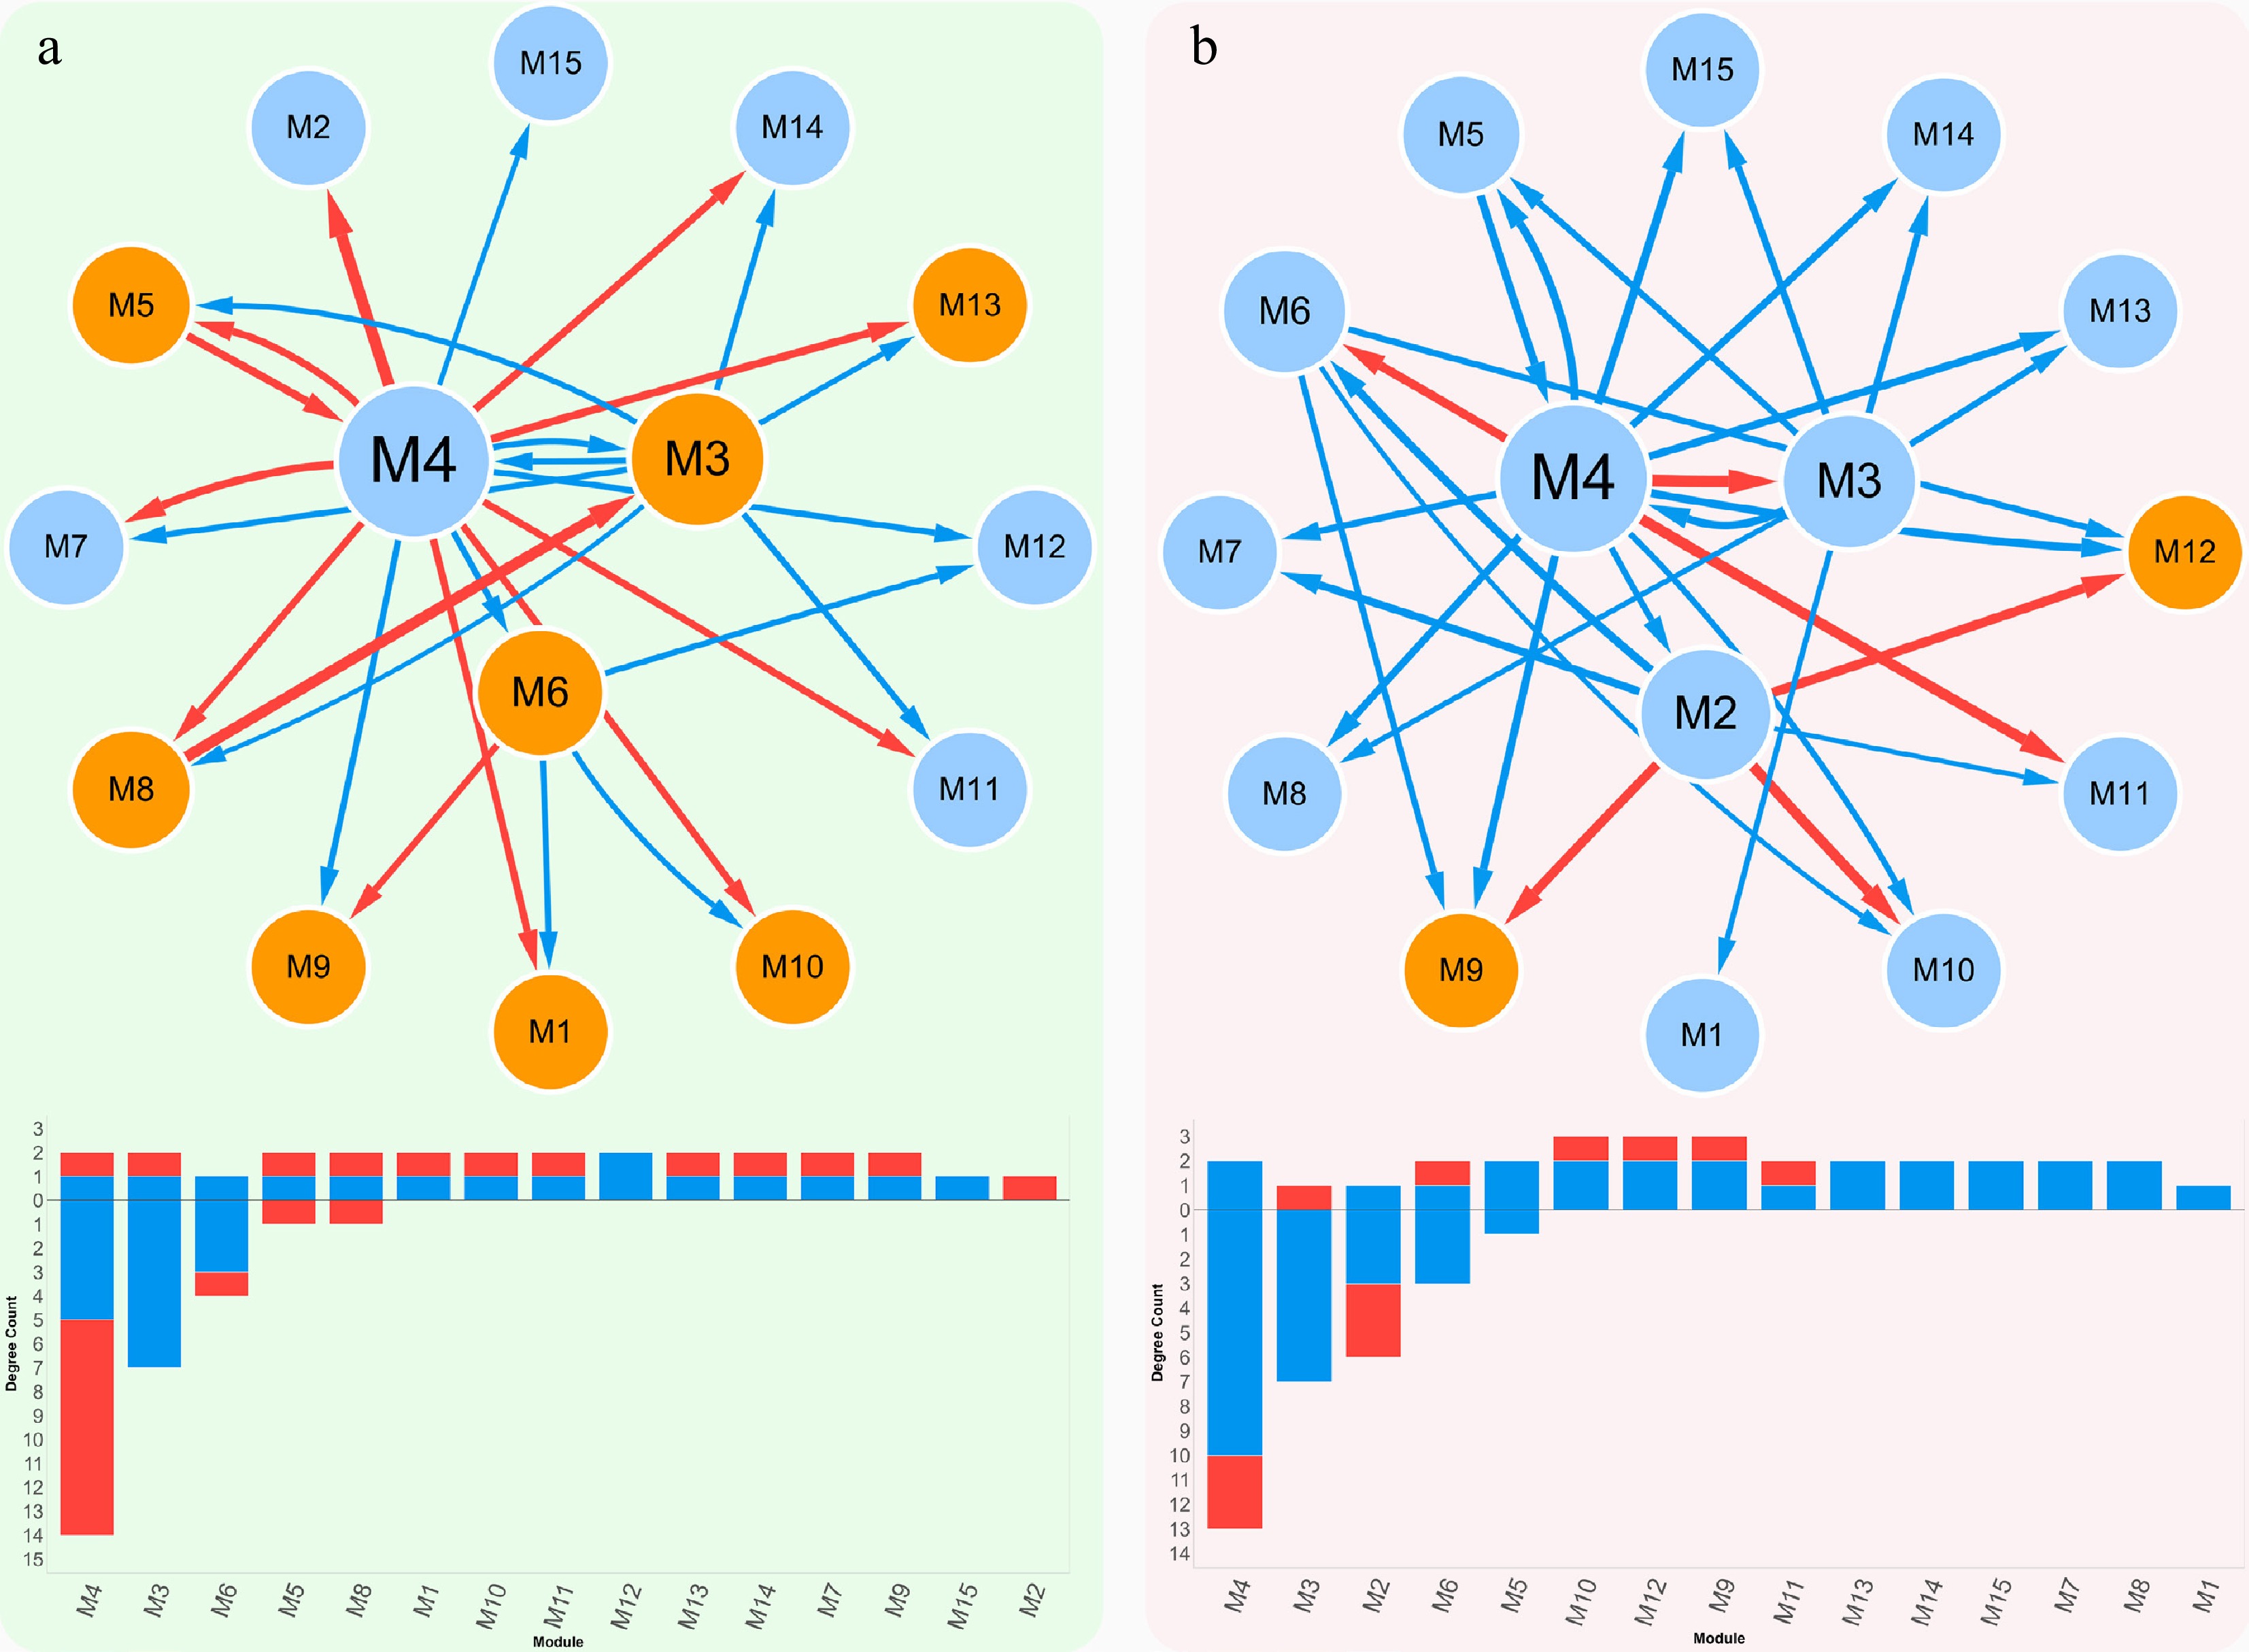
Figure 4.
Coarse-grained interaction networks among microbial modules under (a) healthy, and (b) adenoma conditions. Below each network, indegree (above axis) and outdegree (below axis) are shown, with red indicating positive and blue indicating negative inter-module interactions. In the healthy group, modules M4, M3, and M6 function as central hubs, supporting a balanced network architecture with relatively equal positive and negative connections. In contrast, the adenoma group shows a transition of hub roles, with M4, M3, and M2 emerging as dominant modules. This network is characterized by a predominance of negative interactions, suggesting a transition from stable, cooperative regulation in health to antagonistic and destabilized inter-module relationships in adenoma.
Taken together, these results demonstrate that adenoma-associated dysbiosis involves not only differences in hub composition but also differences in microbial interaction architecture, where hub modules differ between groups and interaction patterns show a relative increase in negative interactions in the adenoma network, reflecting altered network organization associated with adenoma status. These functional, metabolite-mediated, and dietary evidence highlight M4's potential influence on colonic epithelial homeostasis, microbial metabolite balance, and adenoma progression.
Module decomposition effect analysis
-
Traditional approaches mainly compare microbial abundance differences between groups, often missing interaction-level structure. idopNetwork addresses this by applying a quasi-dynamic ODE framework that describes competition and cooperation with evolutionary game theory, modeling microbial interaction patterns. Applying this to 15 microbial modules revealed how intrinsic and interaction-related components jointly shape community structures in healthy and adenoma groups. Some modules exhibited similar scaling patterns across groups; however, these patterns were sustained by distinct interaction influences, a distinction that is not accessible to traditional abundance-based analyses. Model fitting and residual diagnostics for representative microbial taxa under the null model (H0) and the full model (H1) are presented (Supplementary Fig. S4).
For example, module M4 provides a clear illustration of how differences in inter-module interactions are associated with overall abundance patterns (Fig. 5a, b). In the healthy group, the independent effect of M4 shows a declining trend; however, modest inhibition from M3 combined with stronger promotion from M5 shifts the overall trajectory above the independent component. In the adenoma group, the interaction effect of M5 on M4 differs, shifting from positive to negative, which diminishes M4's overall upward tendency, making its pattern in adenoma patients less steep compared to the healthy group. For module M12, the overall patterns between healthy and adenoma groups are similar, yet the underlying interaction contributions differ. In healthy individuals, M12 is inhibited by M4 and M6, while its independent effect exhibits an increasing trend, together producing a balanced overall trajectory. In the adenoma group, M4 and M6 continue to exert inhibitory effects, but M2 emerges as a positive interaction partner, promoting M12. The introduction of M2-mediated promotion is accompanied by a strengthened inhibitory influence from M6, leading to minimal net change in the overall trajectory. This demonstrates how similar overall patterns can arise from distinct inter-module interaction structures.
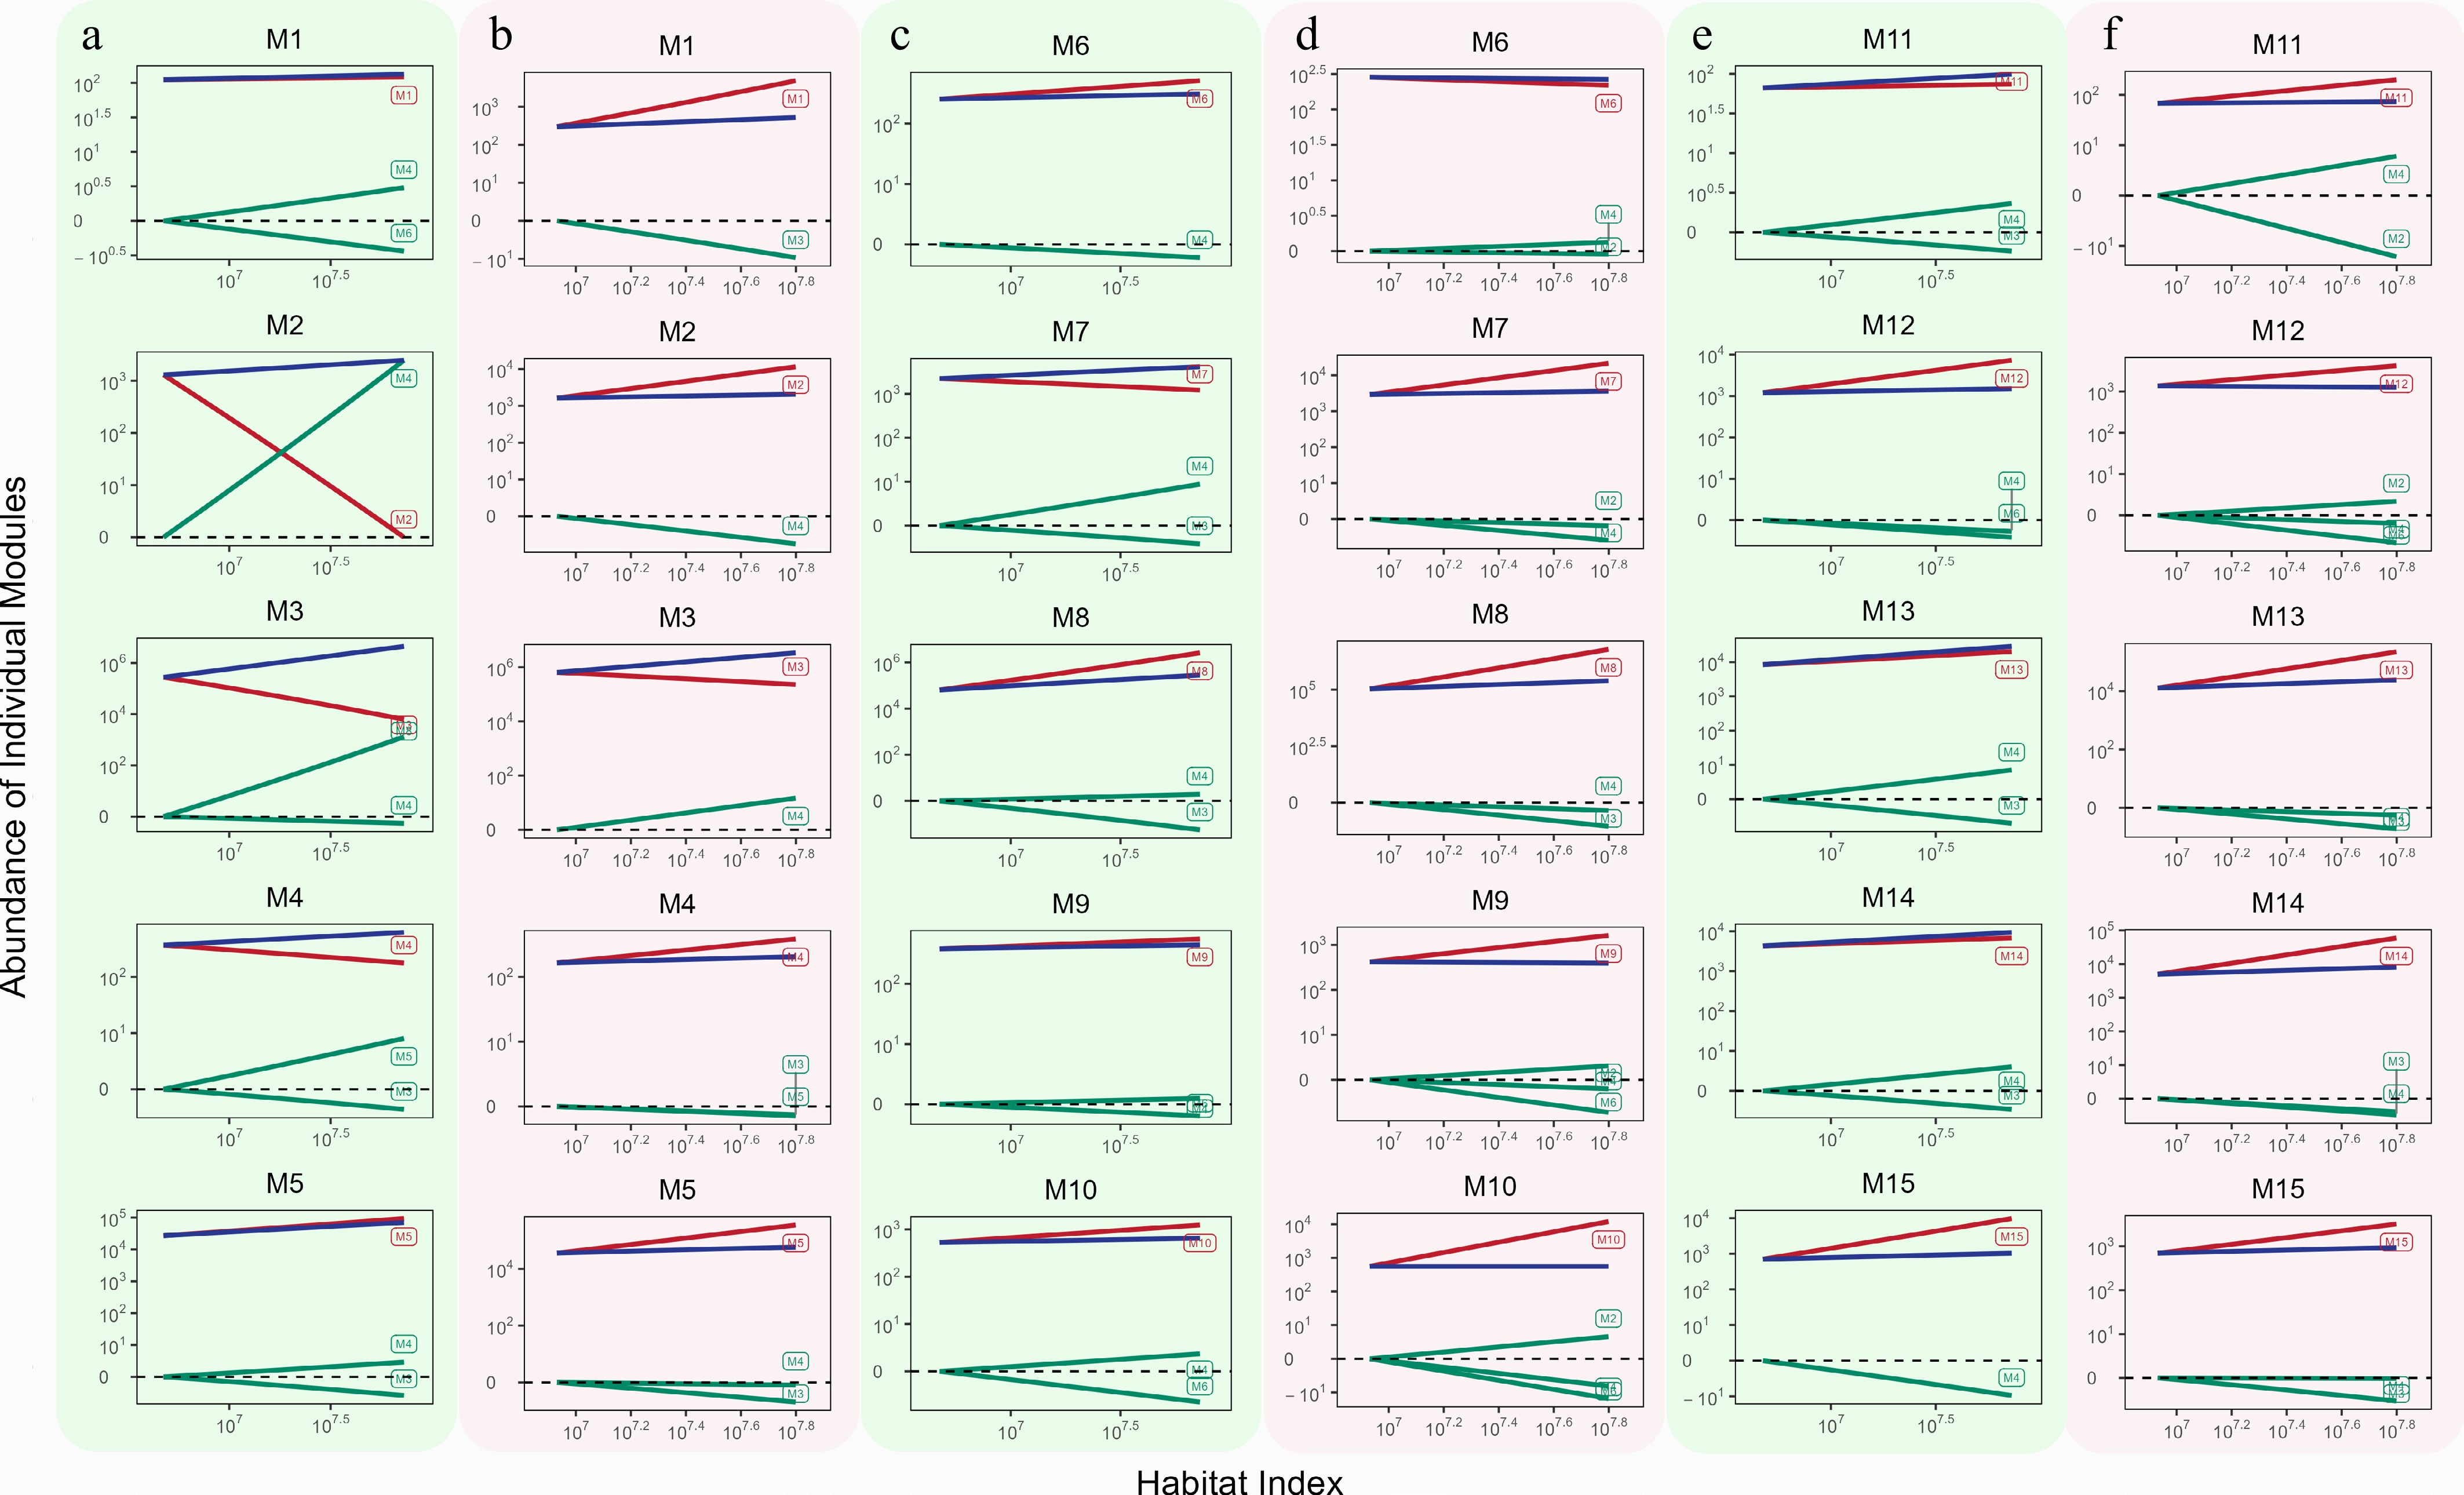
Figure 5.
Decomposition effect curves of 15 microbial modules under healthy and adenoma conditions. (a), (c), and (e) correspond to the 15 modules in the healthy group, (b), (d), and (f) correspond to the adenoma group. Within each subpanel, three trajectories are shown: the blue curve represents the overall effect of the module, the green curve represents the dependent effect (influences from other modules), and the red curve represents the independent effect (intrinsic tendency of the module).
These examples illustrate the interaction-level structure underlying module behavior, showing that even when overall scaling patterns appear comparable between healthy and adenoma groups, independent and dependent effects can differ substantially, thereby revealing differences in interaction structure associated with adenoma-related microbial variation that would be overlooked by conventional abundance-based analyses.
Fine-grained idopNetwork
-
We reconstructed 15 module-specific subnetworks and selected module M4, a core hub module, for detailed analysis of intra-modular interaction architecture (Fig. 6). Comparison of fine-grained networks revealed clear differences between healthy and adenoma groups in both hub taxa and interaction patterns. In healthy individuals, interactions were more evenly distributed, reflecting a balanced and active community structure, whereas in adenoma patients, connectivity became increasingly concentrated in a few dominant hub microbes. This pattern indicates a relative imbalance in intra-modular organization between groups, characterized by increasing dominance of a limited set of core microbes.
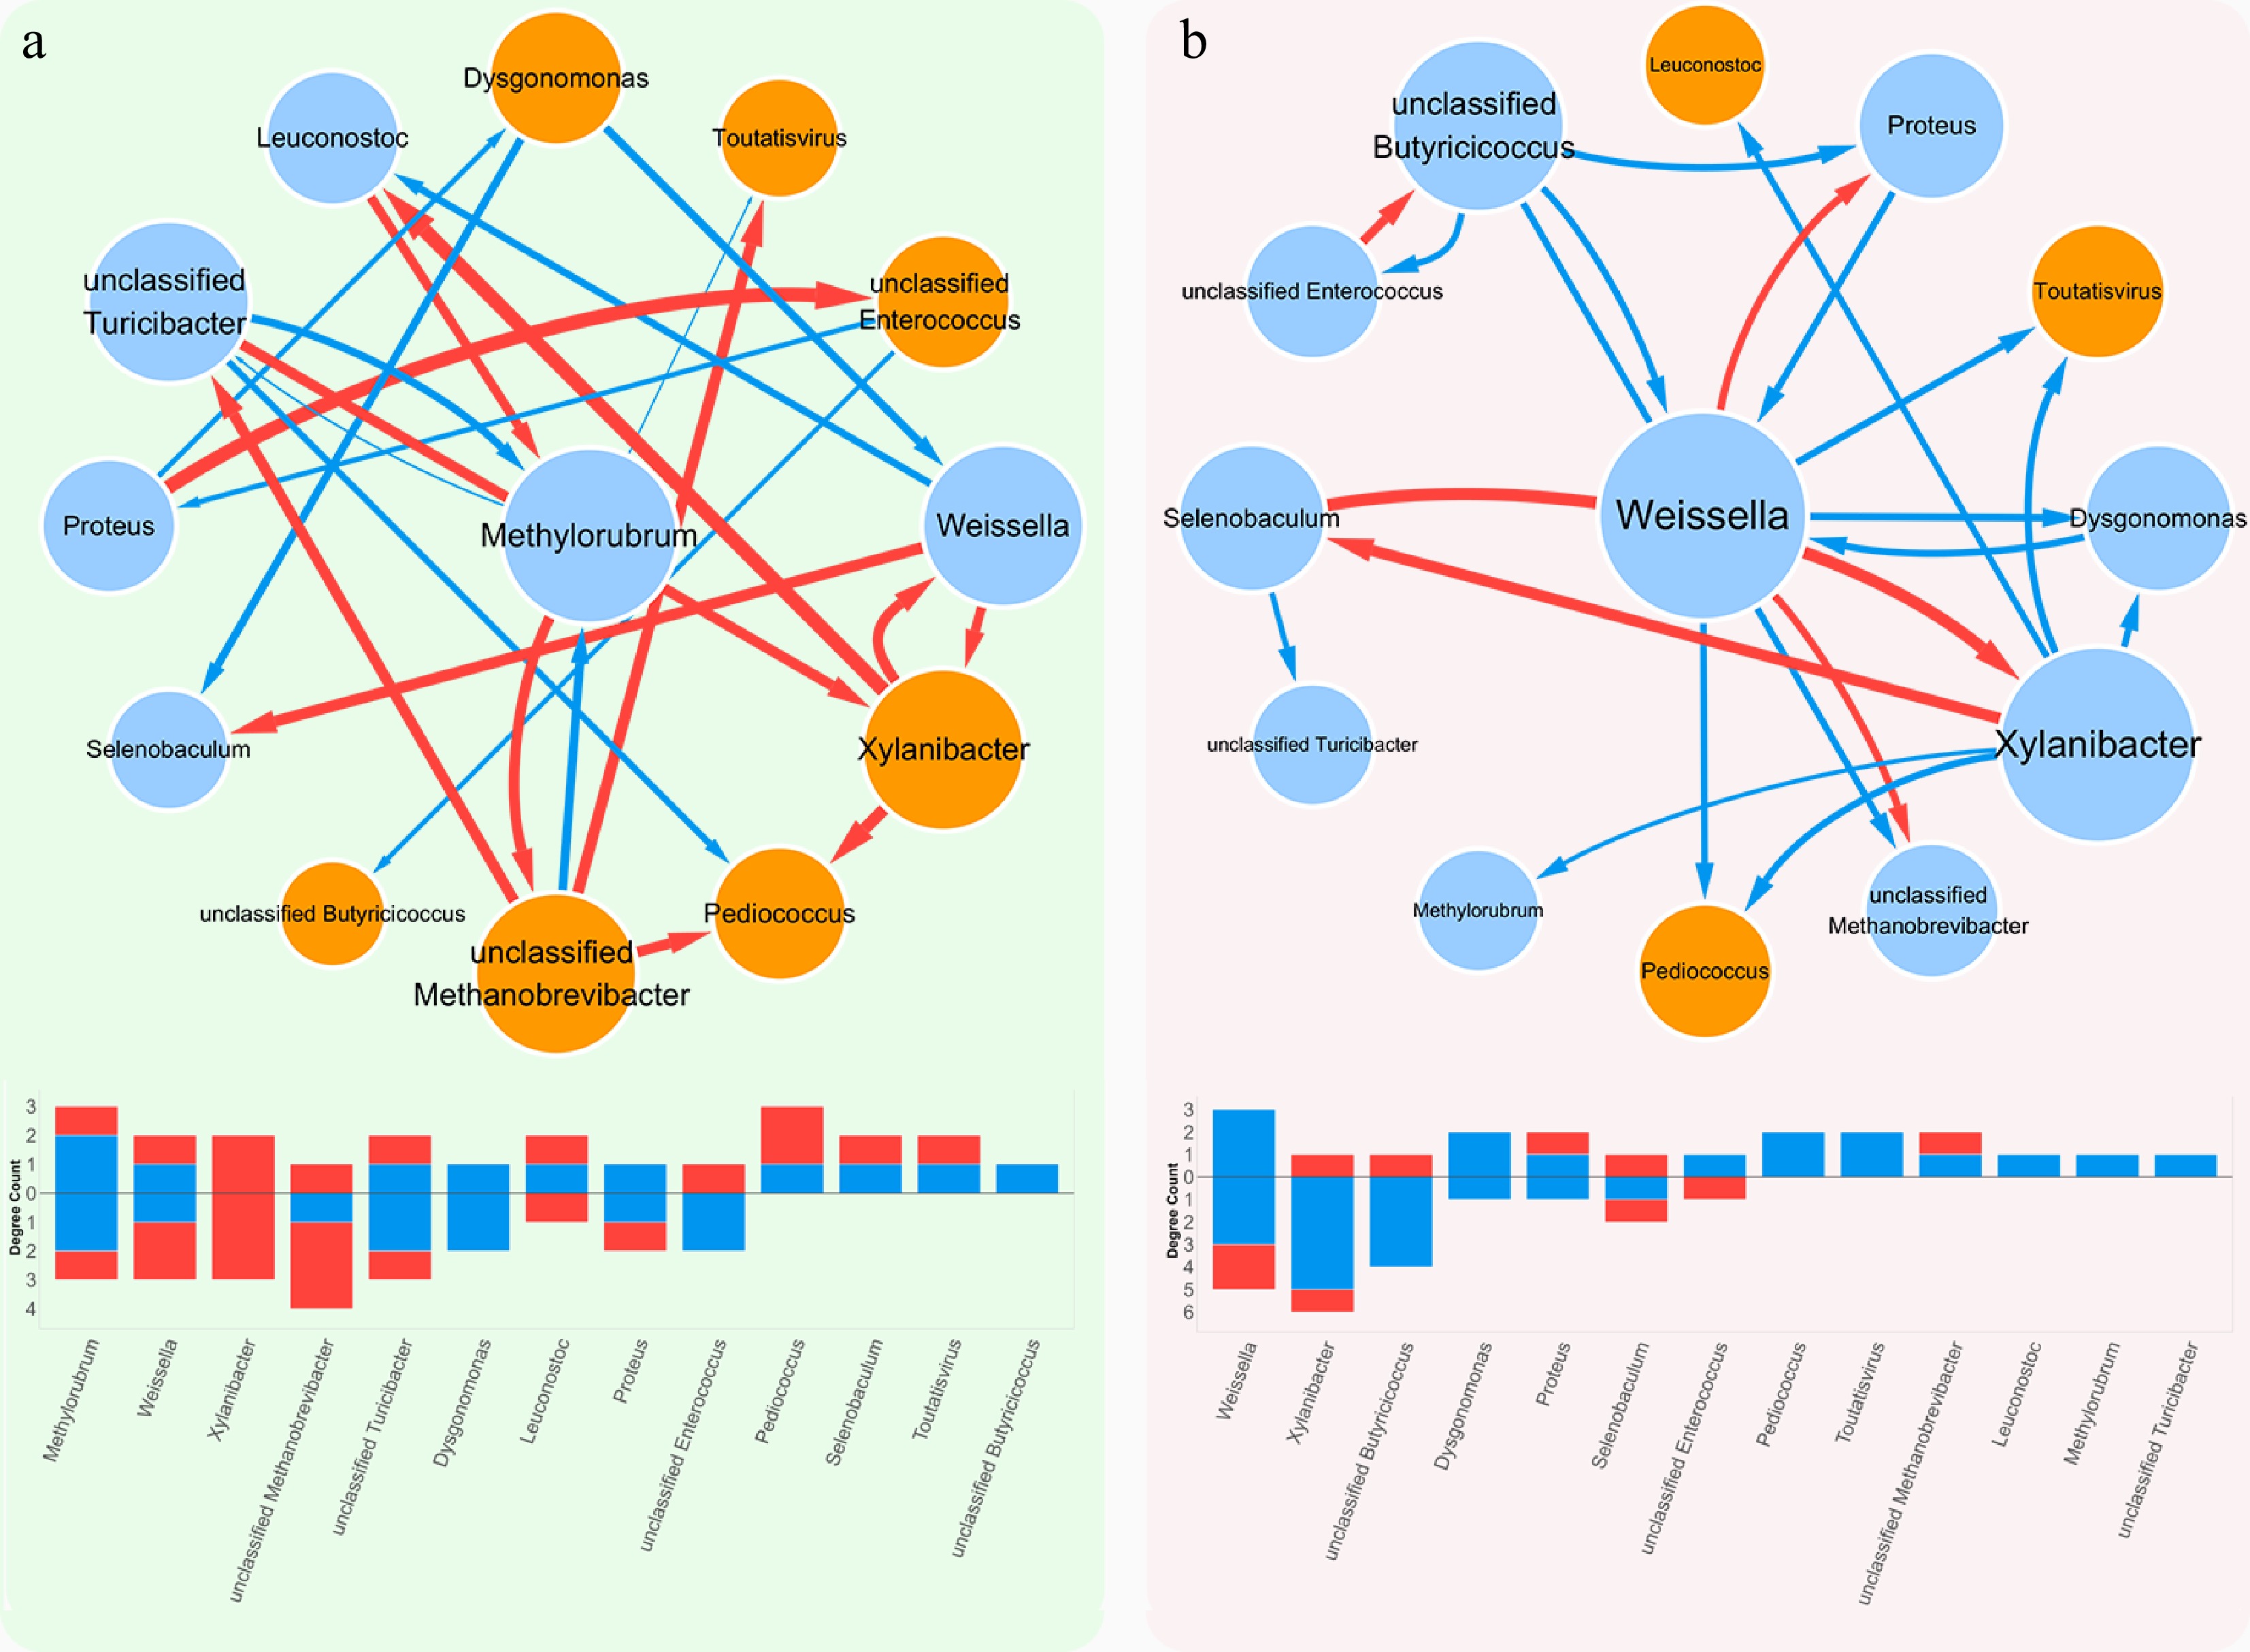
Figure 6.
Fine-grained interaction networks of module M4 under (a) healthy, and (b) adenoma conditions. The same color coding as in Fig. 4 is used to indicate positive and negative interactions. In healthy, Methylorubrum serves as the balanced hub, while in adenoma, Weissella becomes dominant with stronger connectivity, reflecting a shift from ecological stability to defensive and regulatory interactions.
In the healthy group, the primary hub microorganism within module M4 was Methylorubrum. Members of this genus are well-known for their methylotrophic lifestyle, capable of utilizing one-carbon compounds via the ethylmalonyl-CoA pathway (EMCP). This pathway produces several CoA-activated dicarboxylic acids, including mesaconic acid and 2-methylsuccinic acid, which serve as key metabolic intermediates[33]. Long-chain dicarboxylic acids, such as hexadecanedioic acid, have been reported to exhibit antimycotic activity, suggesting a possible association with microbial ecological balance in the gut. Furthermore, metabolites derived from dicarboxylic acid metabolism, such as succinic acid and sebacic acid, have been shown in vitro to inhibit cancer cell proliferation and migration and to induce apoptosis, indicating potential relevance to tumor-related processes under experimental conditions[34,35]. Although the causal relationship between dicarboxylic acid levels and colorectal cancer remains to be fully elucidated, their relative abundance has been proposed as a biomarker[36]. Beyond metabolite production, Methylorubrum may be associated with microbial community stability through processes such as cross-feeding and redox balance. Its metabolic versatility and ecological functions may contribute to its observed hub status in healthy microbiomes, although context-dependent pathogenicity has been reported for certain strains[37,38].
In the adenoma group, Weissella emerged as the primary hub microorganism within module M4, a lactic acid bacterium increasingly recognized for its functional versatility[39]. Members of this genus are capable of producing exopolysaccharides (EPS), which not only contribute to microbial adherence and colonization but have also been reported to exert biological effects in experimental systems. Recent studies have demonstrated that EPS derived from Weissella cibaria can inhibit proliferation, migration, and invasion of colorectal cancer (CRC) cells, while inducing cell cycle arrest and apoptosis via the Fas/FasL–Caspase pathway, thereby suppressing tumor growth in xenograft models without apparent toxicity to normal tissues[40]. Beyond these direct anticancer effects, W. cibaria has also shown promise in vivo: in an azoxymethane/dextran sulfate sodium-induced colitis-associated colorectal cancer (CAC) murine model, oral supplementation with W. cibaria restored intestinal barrier integrity, reshaped the gut microbiota, and reduced tumor burden[41]. Together, these findings suggest that Weissella is associated with hub roles in adenoma-related microbial networks, potentially reflecting its ecological interactions and metabolic adaptability.
The hub shift between healthy and adenoma groups reflects differences in characteristics of the gut environment between groups. In healthy, Methylorubrum is associated with module M4 through metabolic versatility that may support redox balance, cross-feeding, and community stability. In adenoma, Weissella is observed as a dominant hub taxon, potentially associated with differences in the microbial environment, such as inflammation, barrier disruption, and bile acid dysregulation. In this context, Weissella has been reported to be involved in processes such as exopolysaccharide production and modulation of bile acid and inflammatory pathways under experimental conditions. Notably, Spearman correlation analysis revealed no significant association between relative abundance and node centrality (out-degree: ρ = −0.035, p = 0.91; betweenness centrality: ρ = 0.24, p = 0.43), and logistic regression further indicated that abundance was not a significant predictor of hub status (p = 0.63), confirming that this hub replacement is not merely driven by variations in microbial abundance, but rather represents genuine alterations in microbial interaction patterns.
Hub microorganisms decomposition effect analysis
-
Decomposition effect analysis highlighted distinct interaction patterns of Methylorubrum and Weissella between healthy and adenoma groups. In the healthy group, Methylorubrum received mild promotion from Leuconostoc but inhibition from unclassified Methanobrevibacter and unclassified Turicibacter. These inhibitory effects were relatively modest and did not disrupt the hub status of Methylorubrum within the healthy network. By contrast, in the adenoma group, Methylorubrum was strongly suppressed by Xylanibacter. This stronger antagonism is also evident in the independent effect curve (Fig. 7a, c; red line), which shows that despite an upward intrinsic growth tendency, Methylorubrum was markedly inhibited in the adenoma network. Functionally, Xylanibacter (e.g., X. ruminicola) ferments dietary fiber via the succinate pathway, producing propionate in a cobalamin-dependent manner[42]. Elevated propionate may be associated with changes in redox balance and metabolic competition within the gut, potentially relating to the reduced prominence of Methylorubrum in the adenoma network.
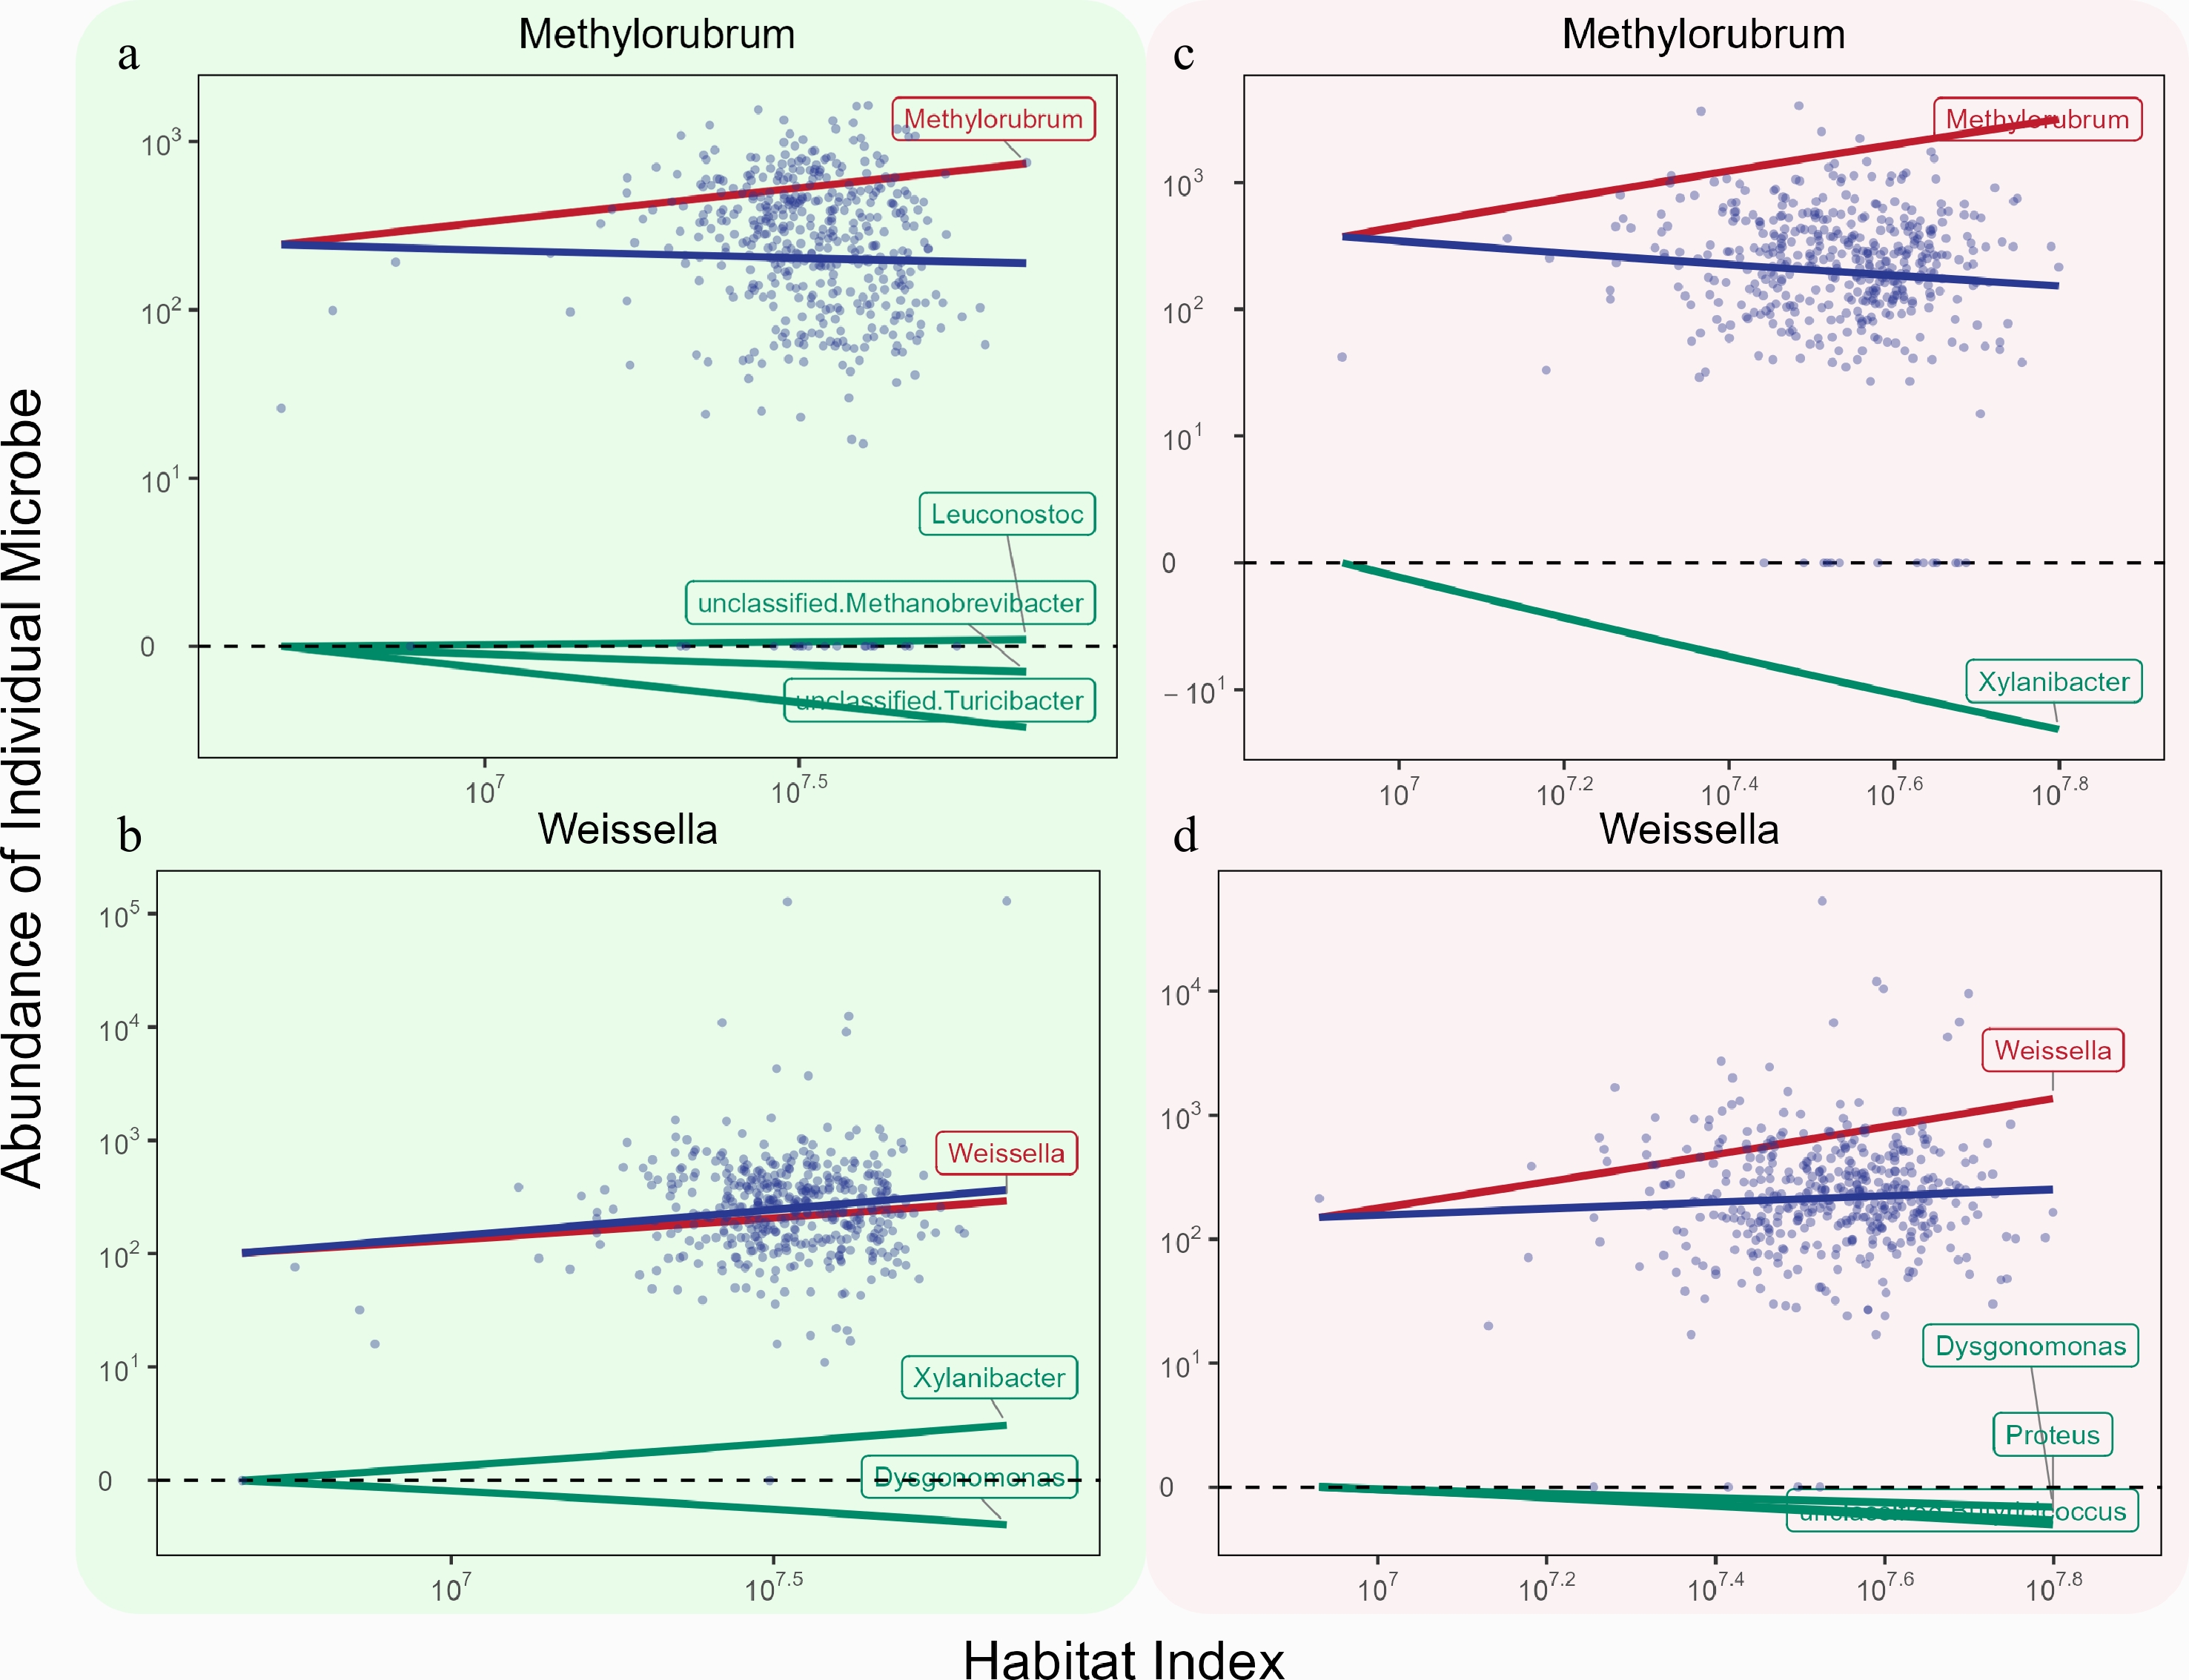
Figure 7.
Decomposition of independent and dependent effects for the two core hub microbes in module M4 under (a), (b) healthy, and (c), (d) adenoma conditions. Each panel shows the observed abundance trajectory (blue), the independent effect reflecting intrinsic ecological dynamics (green), and the dependent effect representing regulatory influences from other modules (red). Under healthy conditions, Methylorubrum is identified as the primary hub, with its abundance trajectory largely dominated by the independent effect and supplemented by moderate positive regulation from other modules. In contrast, under adenoma conditions, Weissella is identified as a dominant hub, with its abundance trajectory primarily shaped by a pronounced dependent effect.
Weissella displayed a distinct pattern. In healthy individuals, Weissella received interaction input from Xylanibacter and inhibitory input from Dysgonomonas, resulting in a balanced interaction pattern consistent with its role as a secondary hub. In the adenoma group, however, Weissella was inhibited by Dysgonomonas, Proteus, and unclassified Butyricicoccus, yet it persisted as a hub microorganism. Dysgonomonas has been associated with cancer cachexia and colorectal tumorigenesis, with increased abundance frequently observed in dysbiotic states. Studies have shown that prebiotic treatments reducing Dysgonomonas abundance (e.g., ginsenoside Rb3/Rd supplementation) correlate with suppression of polyps, restoration of mucosal integrity, and downregulation of oncogenic signaling[43]. These findings suggest that Dysgonomonas may be associated with tumor-related processes, which is consistent with its observed inhibitory association with Weissella in the adenoma-associated microbial network.
In addition, Proteus, although typically regarded as a low-abundance commensal, is known to harbor a range of virulence-associated factors, including urease, hemolysins, IgA proteases, and antibiotic resistance mechanisms. It has been associated with gastrointestinal disorders, particularly Crohn's disease recurrence, where its pathogenic potential is evident[44]. In the adenoma context, the presence of Proteus may be associated with mucosal disruption and pro-inflammatory conditions, which could relate to its inhibitory association with Weissella within the microbial interaction network. This aligns with the broader observation that opportunistic pathogens can expand under dysbiotic and pre-tumorigenic conditions, corresponding to differences in microbial interaction patterns between groups.
Topological analysis of microbial networks using GLMY homology
-
To systematically characterize the differences in microbial community network structures between healthy individuals and adenoma patients, we analyzed idopNetwork for each group based on GLMY homology theory and computed topological invariants at different homology orders (β0, β1, β2), quantifying connected components, loop structures, and higher-order organization (Fig. 8). This multilevel characterization enables a systematic comparison of microbial community structure between healthy and disease conditions.
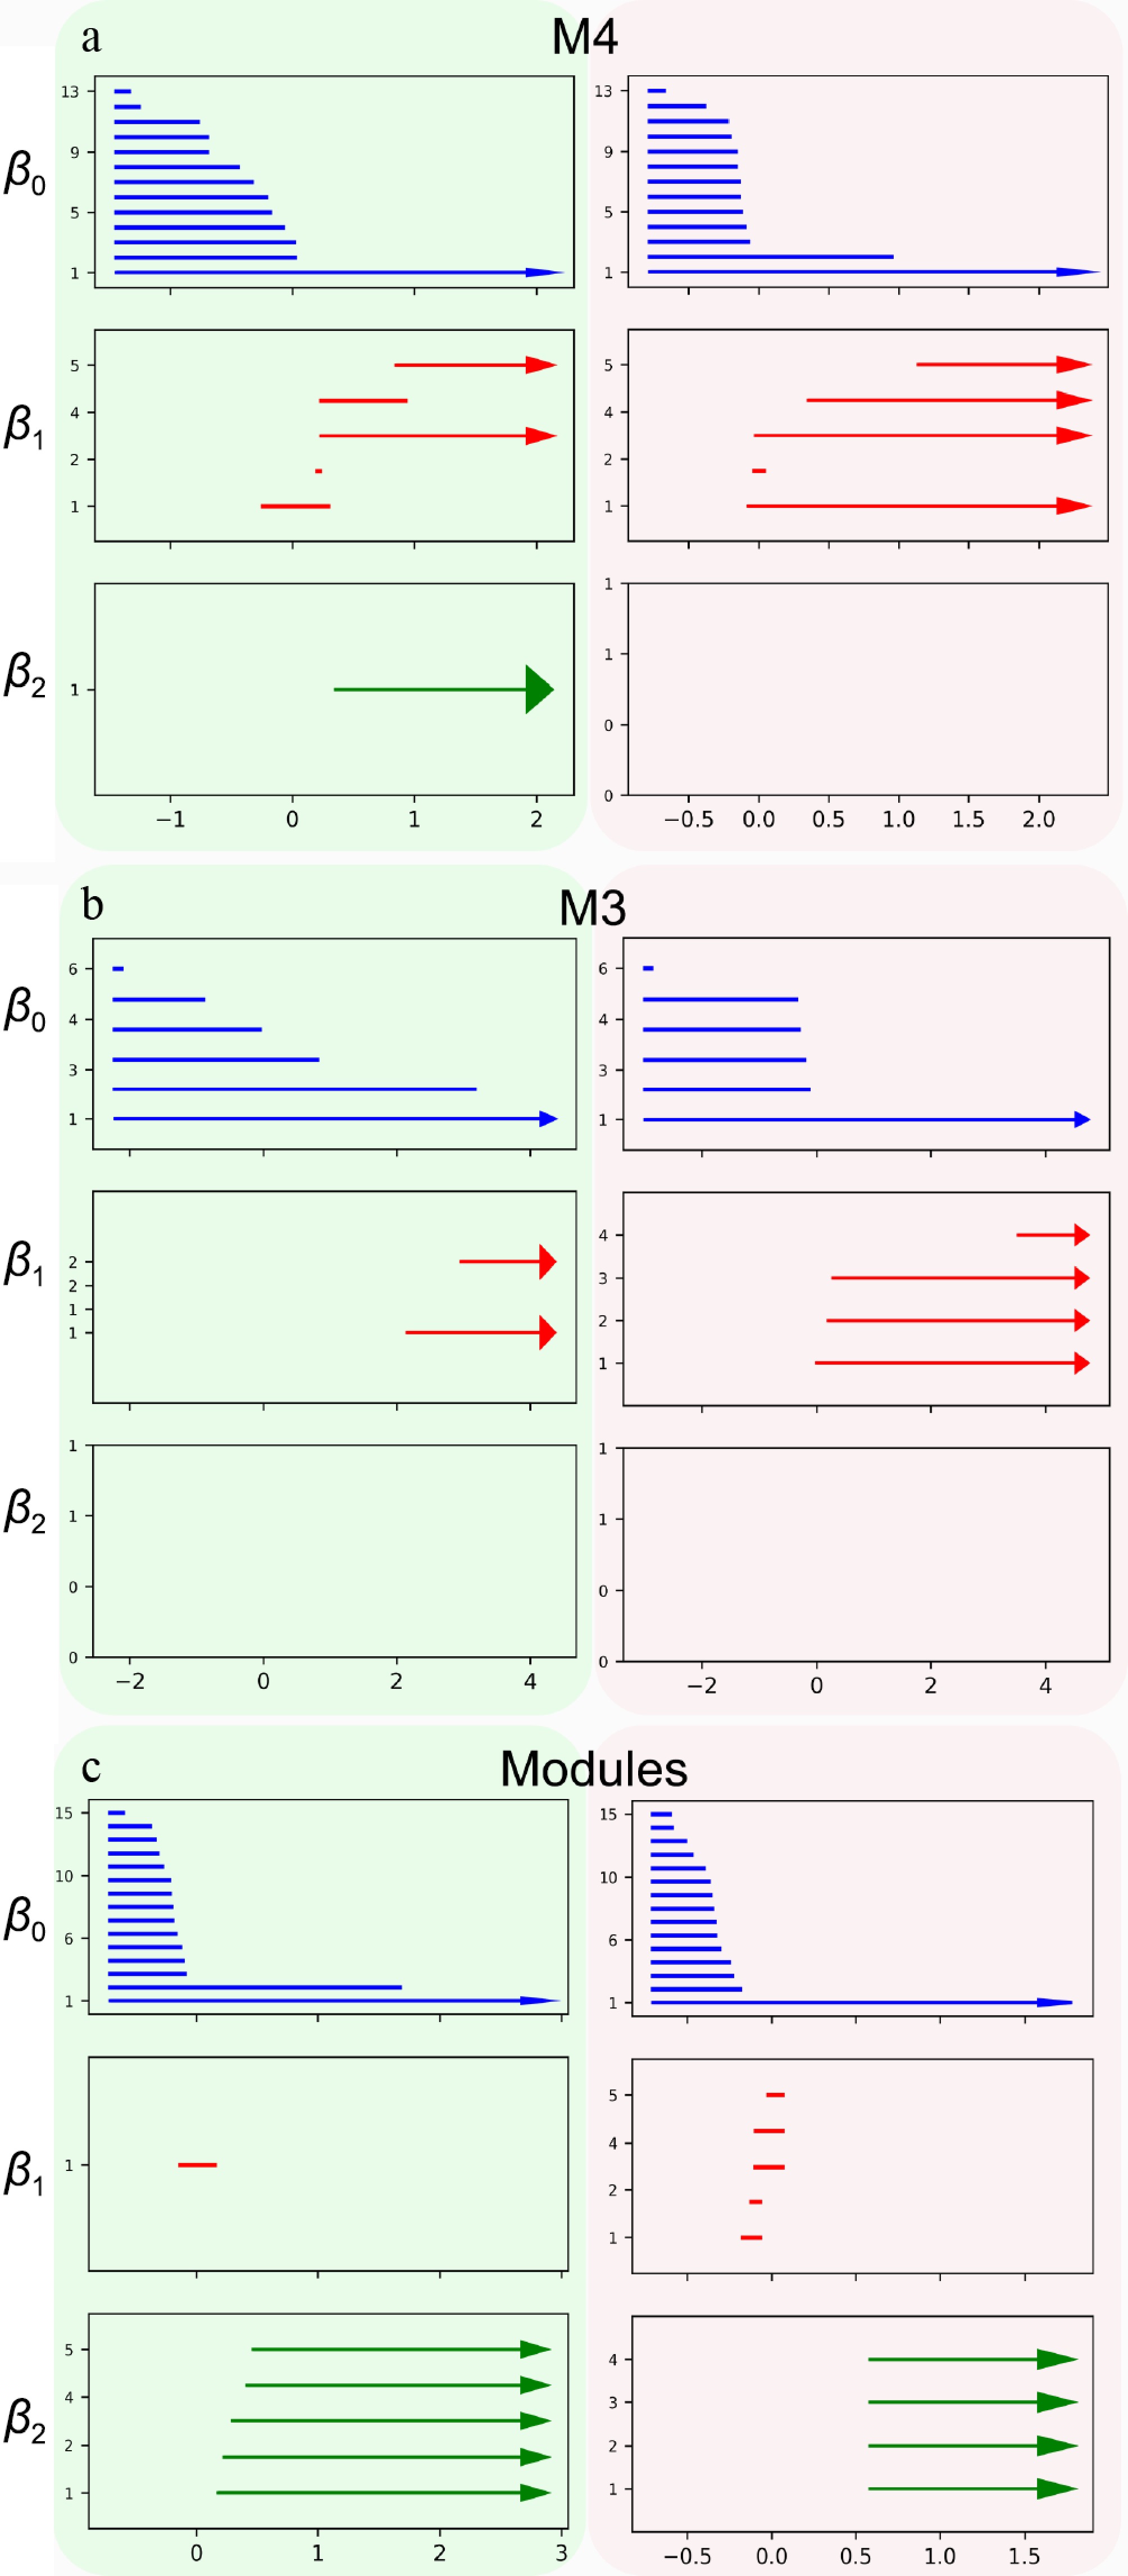
Figure 8.
GLMY homology analysis of microbial interaction networks under healthy and adenoma conditions. GLMY-based persistent homology was computed to quantify network topological features across different homology orders. A red background represents individuals with adenomas. A green background represents healthy controls. β0 (zero-order homology) indicates the number of connected components. β1 (first-order homology) captures the presence of one-dimensional loops, accounting for directed cycles and their interactions. β2 (second-order homology) reflects higher-order interacting structures formed by collections of directed paths.
A comparison of persistent barcode structures between healthy and adenoma groups reveals pronounced topology-dependent differences, both across modules and within individual hub-associated modules. At the inter-module level, the adenoma network exhibits an enrichment of one-dimensional loops (β1). In contrast, the healthy network shows a higher prevalence of higher-dimensional structures (β2). Consistent with these inter-module trends, analysis within individual modules further highlights topology-dependent alterations. In the hub module M4, the adenoma network displays a substantially greater number of persistent one-dimensional loops (β1). By contrast, the healthy network is characterized by higher-dimensional structures (β2). This pattern suggests that in the healthy state, microbial interactions within M4 are organized into higher-order structures that may support systemic stability, whereas in the adenoma state, the network shifts toward dominance of lower-dimensional loops, reflecting stronger local interactions. A similar, but less pronounced, pattern is observed in hub module M3: neither group exhibits higher-dimensional (β2) structures, yet the adenoma network consistently shows more one-dimensional loops (β1) than the healthy network.
Both inter-module and intra-module analyses reveal a shift in network topology associated with adenoma. Compared to healthy hub module networks, adenoma-associated networks are characterized by an enrichment of one-dimensional loops (β1), whereas healthy hub module networks exhibit higher-dimensional structures (β2). These findings suggest that the adenoma state involves a reorganization of microbial interactions, highlighting systemic alterations in microbial community architecture.
-
Differential abundance of microbial taxa has been widely applied to characterize dysbiosis in diseases, but focusing on single taxa ignores the complex, coordinated interactions among microbes that may underlie disease progression[45,46]. Traditional microbial interaction network analyses often rely on correlation or Bayesian network inference, which are unable to fully capture the directed, signed, and weighted interactions between microorganisms in disease states[47−49]. Here, we applied the idopNetwork framework to reconstruct informative, quasi-dynamic, omnidirectional, and personalized microbial interaction networks from static gut microbiome data, allowing us to compare how microbial networks differ between healthy controls and adenoma patients. By integrating Bifunctional clustering and variable selection, idopNetwork can capture microbial networks at multiple scales and levels of topological complexity, thereby enabling more comprehensive identification of key microorganisms and changes in network topology.
Our results demonstrate that adenoma-associated gut dysbiosis reflects differences in microbial ecosystem structure rather than solely differences in taxonomic abundance; this finding is consistent with previous research[9,50]. Using allometric scaling analysis, healthy microbiomes were found to occupy a broad and flexible ecological state space, whereas adenoma-associated communities exhibited constrained scaling regimes. Importantly, identical taxa exhibit distinct allometric scaling relationships across healthy and adenoma states, indicating that the allometric scaling law itself is sensitive to differences between groups and that taxa can assume context-dependent roles within the microbial network, potentially influencing disease progression[51−53].
Bifunctional clustering further revealed that microbial taxa organize into coherent functional modules with conserved mean abundance patterns across cohorts, yet exhibit differences in their underlying interaction structures. Module-level idopNetwork uncovered differences between relatively balanced positive–negative inter-module interactions in healthy microbiomes and a higher proportion of negative interactions in adenoma networks, indicating differences in network organization between groups. This observation is consistent with previous reports that maximum entropy-based microbial networks have demonstrated that healthy communities exhibit balanced interactions and symmetric information flow, indicative of dynamically stable ecosystems, whereas unhealthy microbiomes show asymmetric structures, which may lead to instability[54,55]. These findings underscore that dysbiosis involves substantial differences in network structure, even when conventional abundance-based analyses suggest minimal change.
At the microbial hub level, context-dependent interaction patterns provided a structural perspective on these differences. For example, Methylorubrum displayed stable integration within healthy networks but was strongly inhibited in adenoma-associated communities, which may be associated with differences in microbial interaction context, leading to its exclusion from the core microbiome[33]. In contrast, Weissella maintained hub status across conditions, highlighting differential robustness among taxa. Statistical verification further confirmed that such hub shifts are not simply driven by abundance variation. Decomposition of independent and dependent effects confirmed that these differences are associated with variations in interaction structures[39].
Most current analyses of networks are based on classical graph theory methods, such as degree, connectivity, and centrality, with little attention paid to differences in the overall topological structure of networks, such as cycles and voids. In this study, we apply GLMY to the topological analysis of networks in adenoma patients and healthy controls, thereby gaining a new perspective on the development of the disease[56,57]. Topological homology analysis further substantiated these observations, showing that adenoma-associated microbiome hub modules exhibit simplified higher-order structures and an enrichment of local loop structures. The concurrent decrease in β2 with an elevation in β1 suggests differences in network topology between groups, reflecting a shift from a hierarchically organized structure in healthy individuals toward a more locally loop-enriched configuration in adenoma-associated networks. This structural shift is further supported by previous studies showing that enzymes enriched in healthy microbiomes exhibit higher node degrees and clustering coefficients, indicative of strong metabolic cooperation, whereas both metrics progressively decline from adenoma to CRC, reflecting a gradual loss of cooperative interactions in diseased states[58].
Compared with traditional abundance- or correlation-based approaches, our results show that adenoma-associated dysbiosis is primarily driven by a system-level reorganization of microbial interaction architecture, rather than taxonomic shifts alone. Adenoma communities exhibit constrained ecological scaling with context-dependent taxon roles, accompanied by increased negative interactions and reduced cooperation, indicating impaired stability. Concurrently, hub network topology shifts from globally coordinated, hierarchical structures to more locally loop-enriched but less integrated configurations. Overall, these findings suggest that adenoma progression is characterized by multi-scale alterations in interaction structure, stability, and topological complexity, offering a more mechanistic perspective beyond conventional abundance-based analyses. Despite these findings, several limitations should be acknowledged. The cross-sectional design restricts dynamic inference, and the quasi-dynamic ordering based on quasi-time relies on assumptions about temporal progression. In addition, although we adjusted for major demographic variables, residual confounding from unmeasured factors, such as dietary habits, environmental exposures, lifestyle factors, and medication use, cannot be entirely ruled out. Furthermore, the inferred interaction structures and directionality remain computational predictions without direct experimental validation, and ecological directionality inference is inherently uncertain due to the complexity and context-dependence of microbial interactions. These factors should be considered, and future studies incorporating experimental validation will be essential to further substantiate the inferred interaction mechanisms.
-
By analyzing 630 microbial taxa across 883 gut microbiome samples, this study shows that adenoma-associated dysbiosis extends beyond compositional differences and is characterized by coordinated differences in microbial interaction structure. Allometric scaling analysis revealed that identical microbial taxa obey distinct scaling laws in healthy vs adenoma-associated communities, suggesting that disease-associated variation is reflected in taxon–community relationships rather than solely in abundance levels. BiFunctional clustering further identified 15 microbial modules, most of which exhibited conserved abundance scaling patterns across health states, while a subset displayed pronounced divergence, indicating group-specific differences in interaction organization.
Application of the idopNetwork framework enabled decomposition of module-level patterns into independent and dependent components, revealing that similar scaling patterns in healthy and adenoma microbiomes can be associated with distinct interaction structures. Network reconstruction further uncovered differences in hub roles, with taxa contributing to community stability in healthy microbiomes being replaced by alternative hubs in adenoma-associated networks, reflecting differences in interaction organization between groups.
Topological homology analysis using GLMY provided complementary evidence for this reorganization, uncovering marked differences in network structure. Healthy microbiome hub modules exhibited richer higher-order organization, whereas adenoma-associated networks hub modules were characterized by increased local looping and simplified higher-order topology.
Collectively, these findings establish that adenoma-associated microbiome variation involves concurrent disruptions in scaling behavior, interaction structure, and network topology. By integrating allometric scaling law, modular decomposition, network modeling, and topological analysis, this work provides a structural framework for characterizing differences between healthy and adenoma-associated microbial communities, with potential relevance for microbiome-based risk assessment and future investigation.
-
All data used in this study were obtained from publicly available resources in the NCBI, specifically from the NHSII cohort (Cohort 5), a cross-sectional, prospective study investigating colorectal cancer-related gut microbiome composition. The original study protocol was approved by the Institutional Review Boards of Brigham and Women's Hospital and Harvard T.H. Chan School of Public Health, as well as relevant participating registries. All participants provided written informed consent prior to enrollment and sample collection. As this study involved only secondary analysis of de-identified, publicly available data, no additional ethical approval or informed consent was required.
-
The authors confirm their contributions to the paper as follows: study conception and design: Ma S, Che J, Li X; data collection: Ma S; analysis and interpretation of results: Yan X, Ma S, Pan W; manuscript draft preparation: Yan X, Ma S, Che J, and Li X. All authors reviewed the results and approved the final version of the manuscript.
-
The data that support the findings of this study are available in the NCBI Sequence Read Archive (SRA) repository. These data were derived from the following resources available in the public domain: NHSII cohort, Project ID PRJNA1237248. The computer code for processing and analyzing this data can be found at CRC_adenoma_code.
-
This work is partially supported by the Shanghai Institute for Mathematics and Interdisciplinary Sciences (SIMIS-ID-2024-WN).
-
The authors declare that they have no conflict of interest.
-
accompanies this paper online at: https://doi.org/10.48130/stati-0026-0011.
-
# Authors contributed equally: Xiaojue Yan, Shuaikang Ma
- Supplementary Fig. S1 Heatmap of functional annotation enrichment across modules.
- Supplementary Fig. S2 Statistical significance testing of module likelihood ratios via permutation test.
- Supplementary Fig. S3 Statistical significance testing of M4 microbial likelihood ratios via permutation test.
- Supplementary Fig. S4 Model fitting and residual diagnostics for representative microbial taxa under models with and without interaction effects.
- Copyright: © 2026 by the author(s). Published by Maximum Academic Press, Fayetteville, GA. This article is an open access article distributed under Creative Commons Attribution License (CC BY 4.0), visit https://creativecommons.org/licenses/by/4.0/.
-
About this article
Cite this article
Yan X, Ma S, Pan W, Li X, Che J. 2026. IdopNetwork as a tool to reveal microbial interaction shifts in colorectal adenoma development. Statistics Innovation 3: e010 doi: 10.48130/stati-0026-0011 

IdopNetwork as a tool to reveal microbial interaction shifts in colorectal adenoma development
- Received: 26 December 2025
- Revised: 29 April 2026
- Accepted: 29 May 2026
- Published online: 31 July 2026
Abstract: Colorectal adenoma is a common premalignant lesion and represents a critical intermediate stage in the adenoma–carcinoma sequence of colorectal cancer. Accumulating evidence suggests that gut microbiome dysbiosis contributes to early colorectal carcinogenesis. Network-based approaches offer a systematic framework to characterize microbial interactions; however, most existing methods rely on static, single-scale networks and are limited in their ability to capture the variation associated with adenoma status. Here, we applied idopNetwork, integrating bifunctional clustering with quasi-dynamic ordinary differential equations (qdODEs), to gut microbiome data from colorectal adenoma patients and healthy controls. This approach enables the construction of quasi-dynamic, multiscale, full-information microbial interaction networks, revealing coordinated system-level differences in microbial interaction between adenoma and healthy states. At the inter-modular level, adenoma-associated networks were characterized by a relative increase in inhibition-dominated interactions compared to more balanced facilitative–inhibitory patterns in controls, while intra-modular analysis suggested alterations in hub taxa connectivity within core microorganisms. GLMY-based homological analysis further indicated that adenoma-associated networks exhibit a topological shift from globally connected, higher-order organization toward more locally constrained and simplified structures. Together, these findings indicate that integrating idopNetwork with GLMY homology analysis offers a robust multi-scale framework for dissecting microbial interactions, and that targeted modulation of key interactions may inform early colorectal cancer prevention.
-
Key words:
- Microbial interaction network /
- Colorectal adenoma /
- IdopNetwork /
- Modularity