-
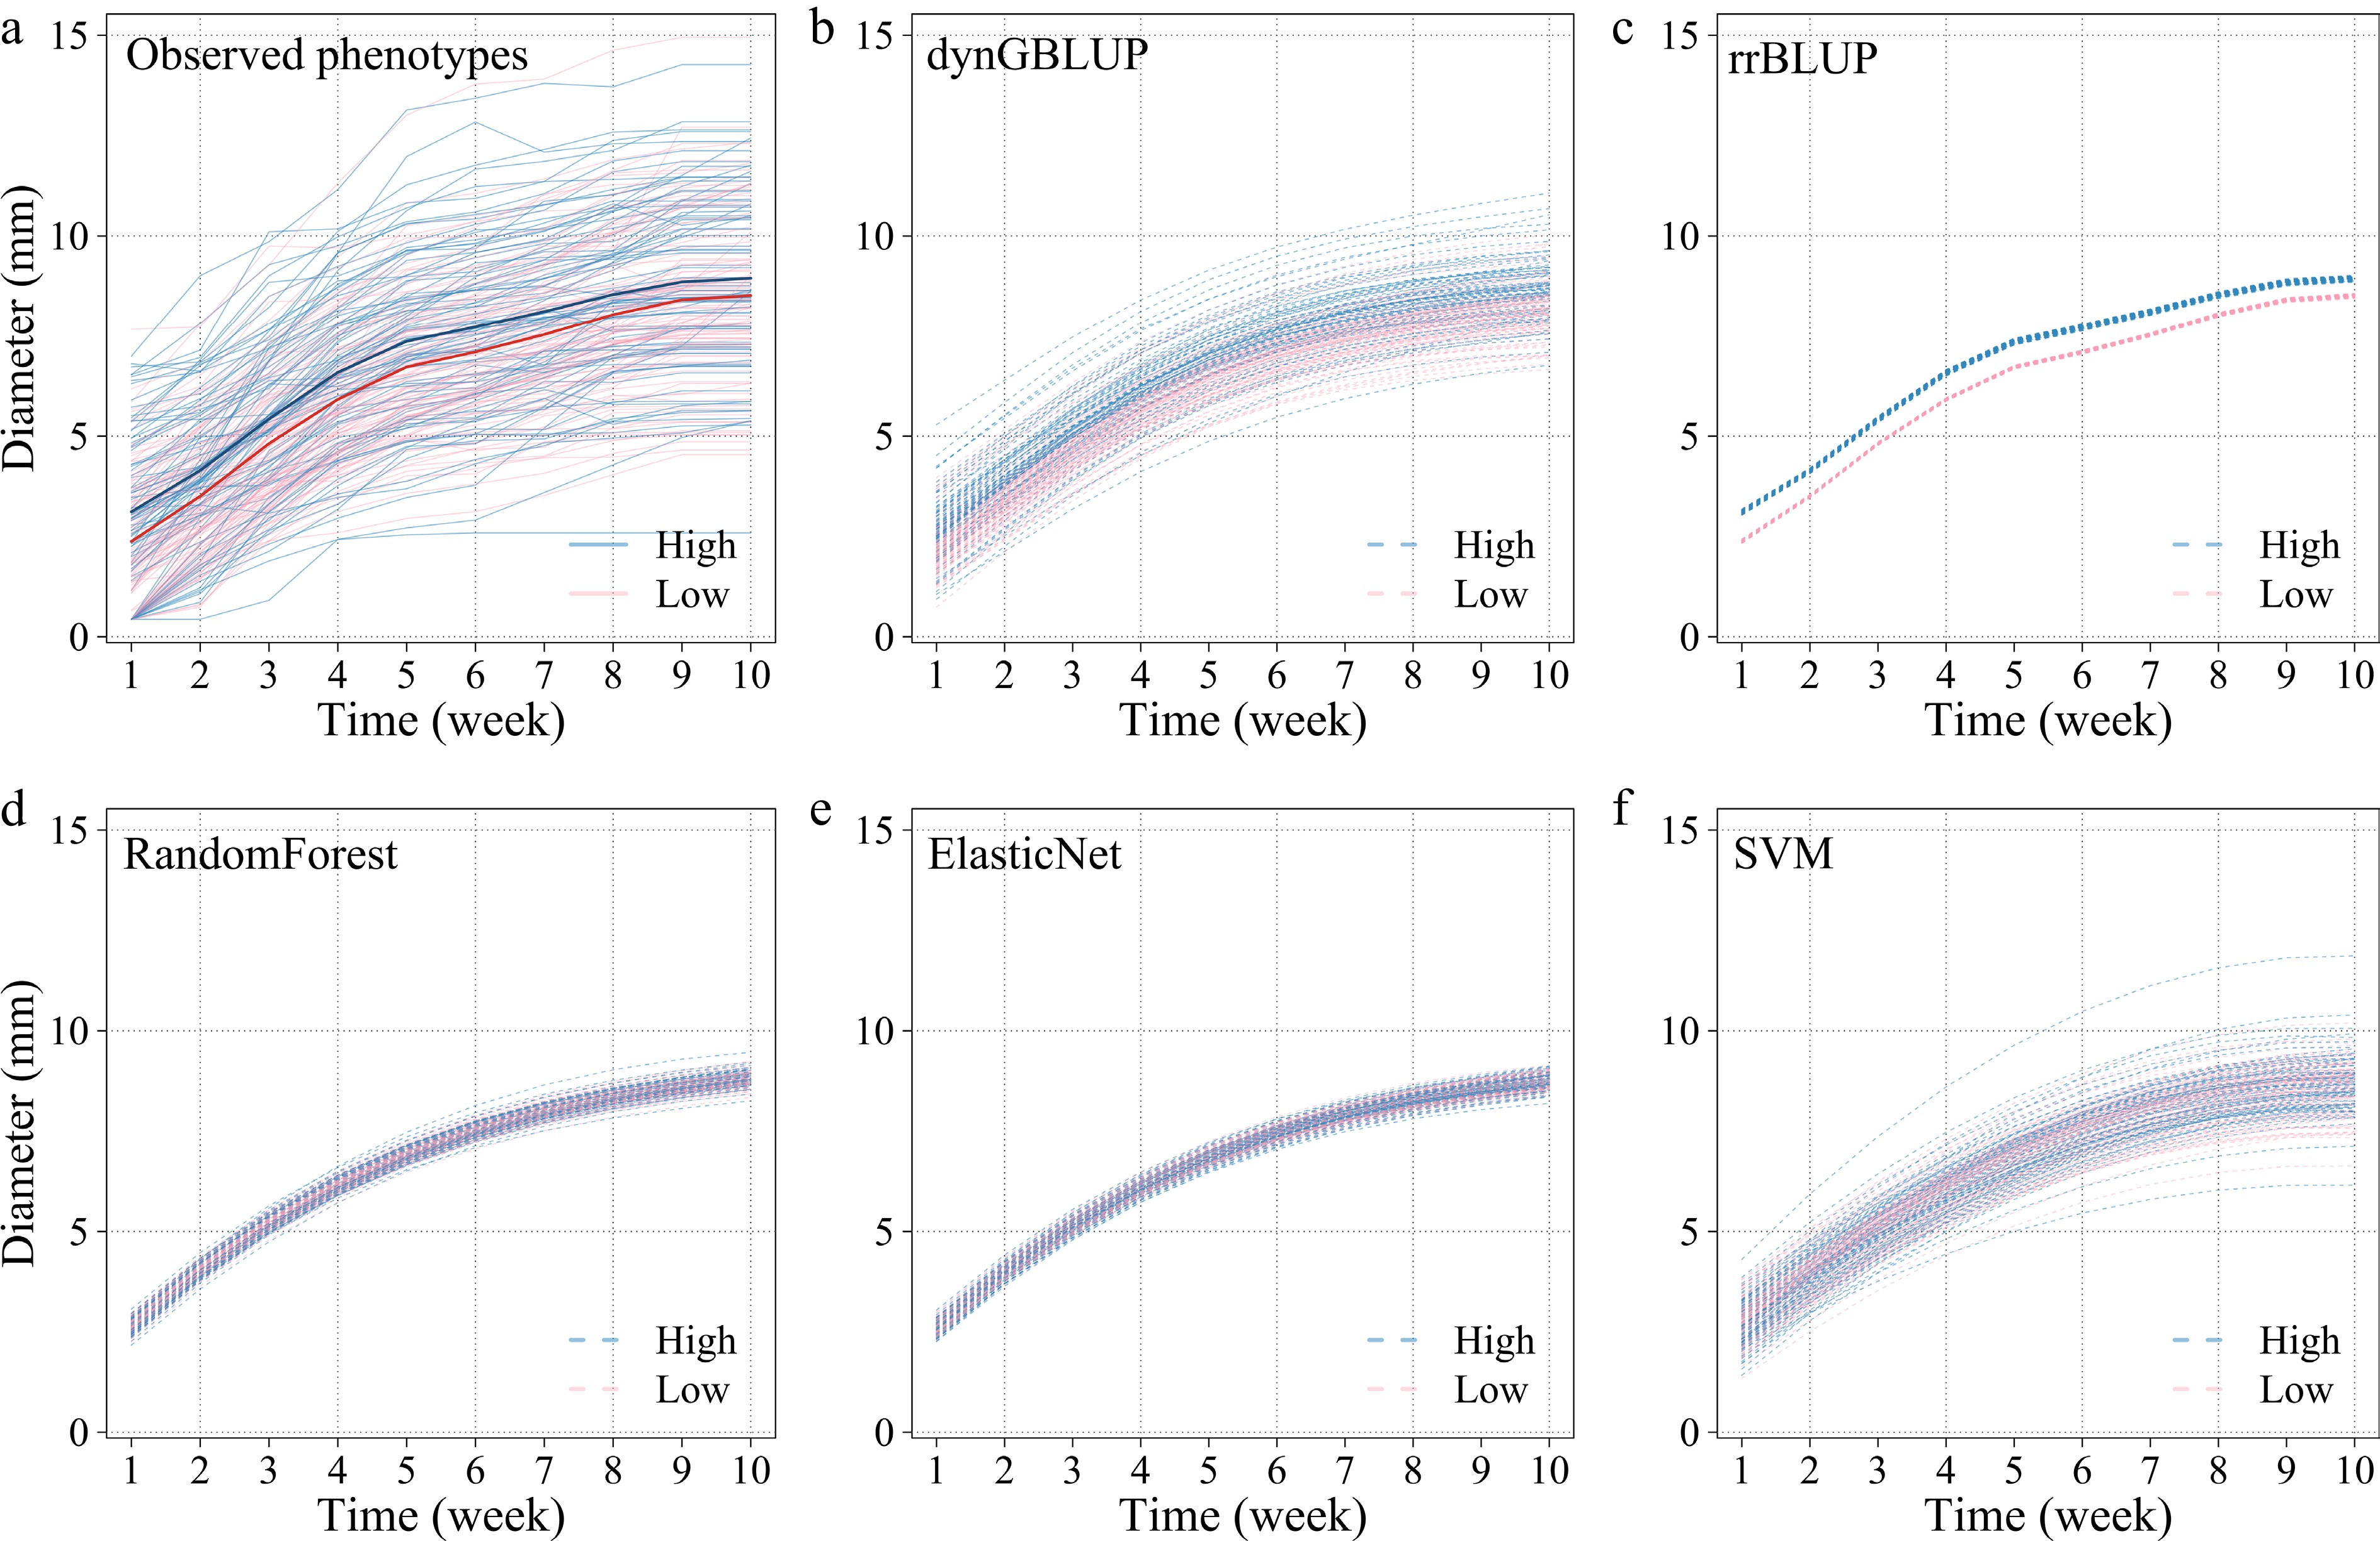
Figure 1.
(a) Observed stem diameter phenotypes of Populus szechuanica var. tibetica across 10 time points. Average predicted values from 10 repetitions of 10-fold cross-validation using (b) dynGBLUP, (c) rrBLUP, (d) random forest, (e) elastic net, and (f) SVM, for stem diameter data.
-
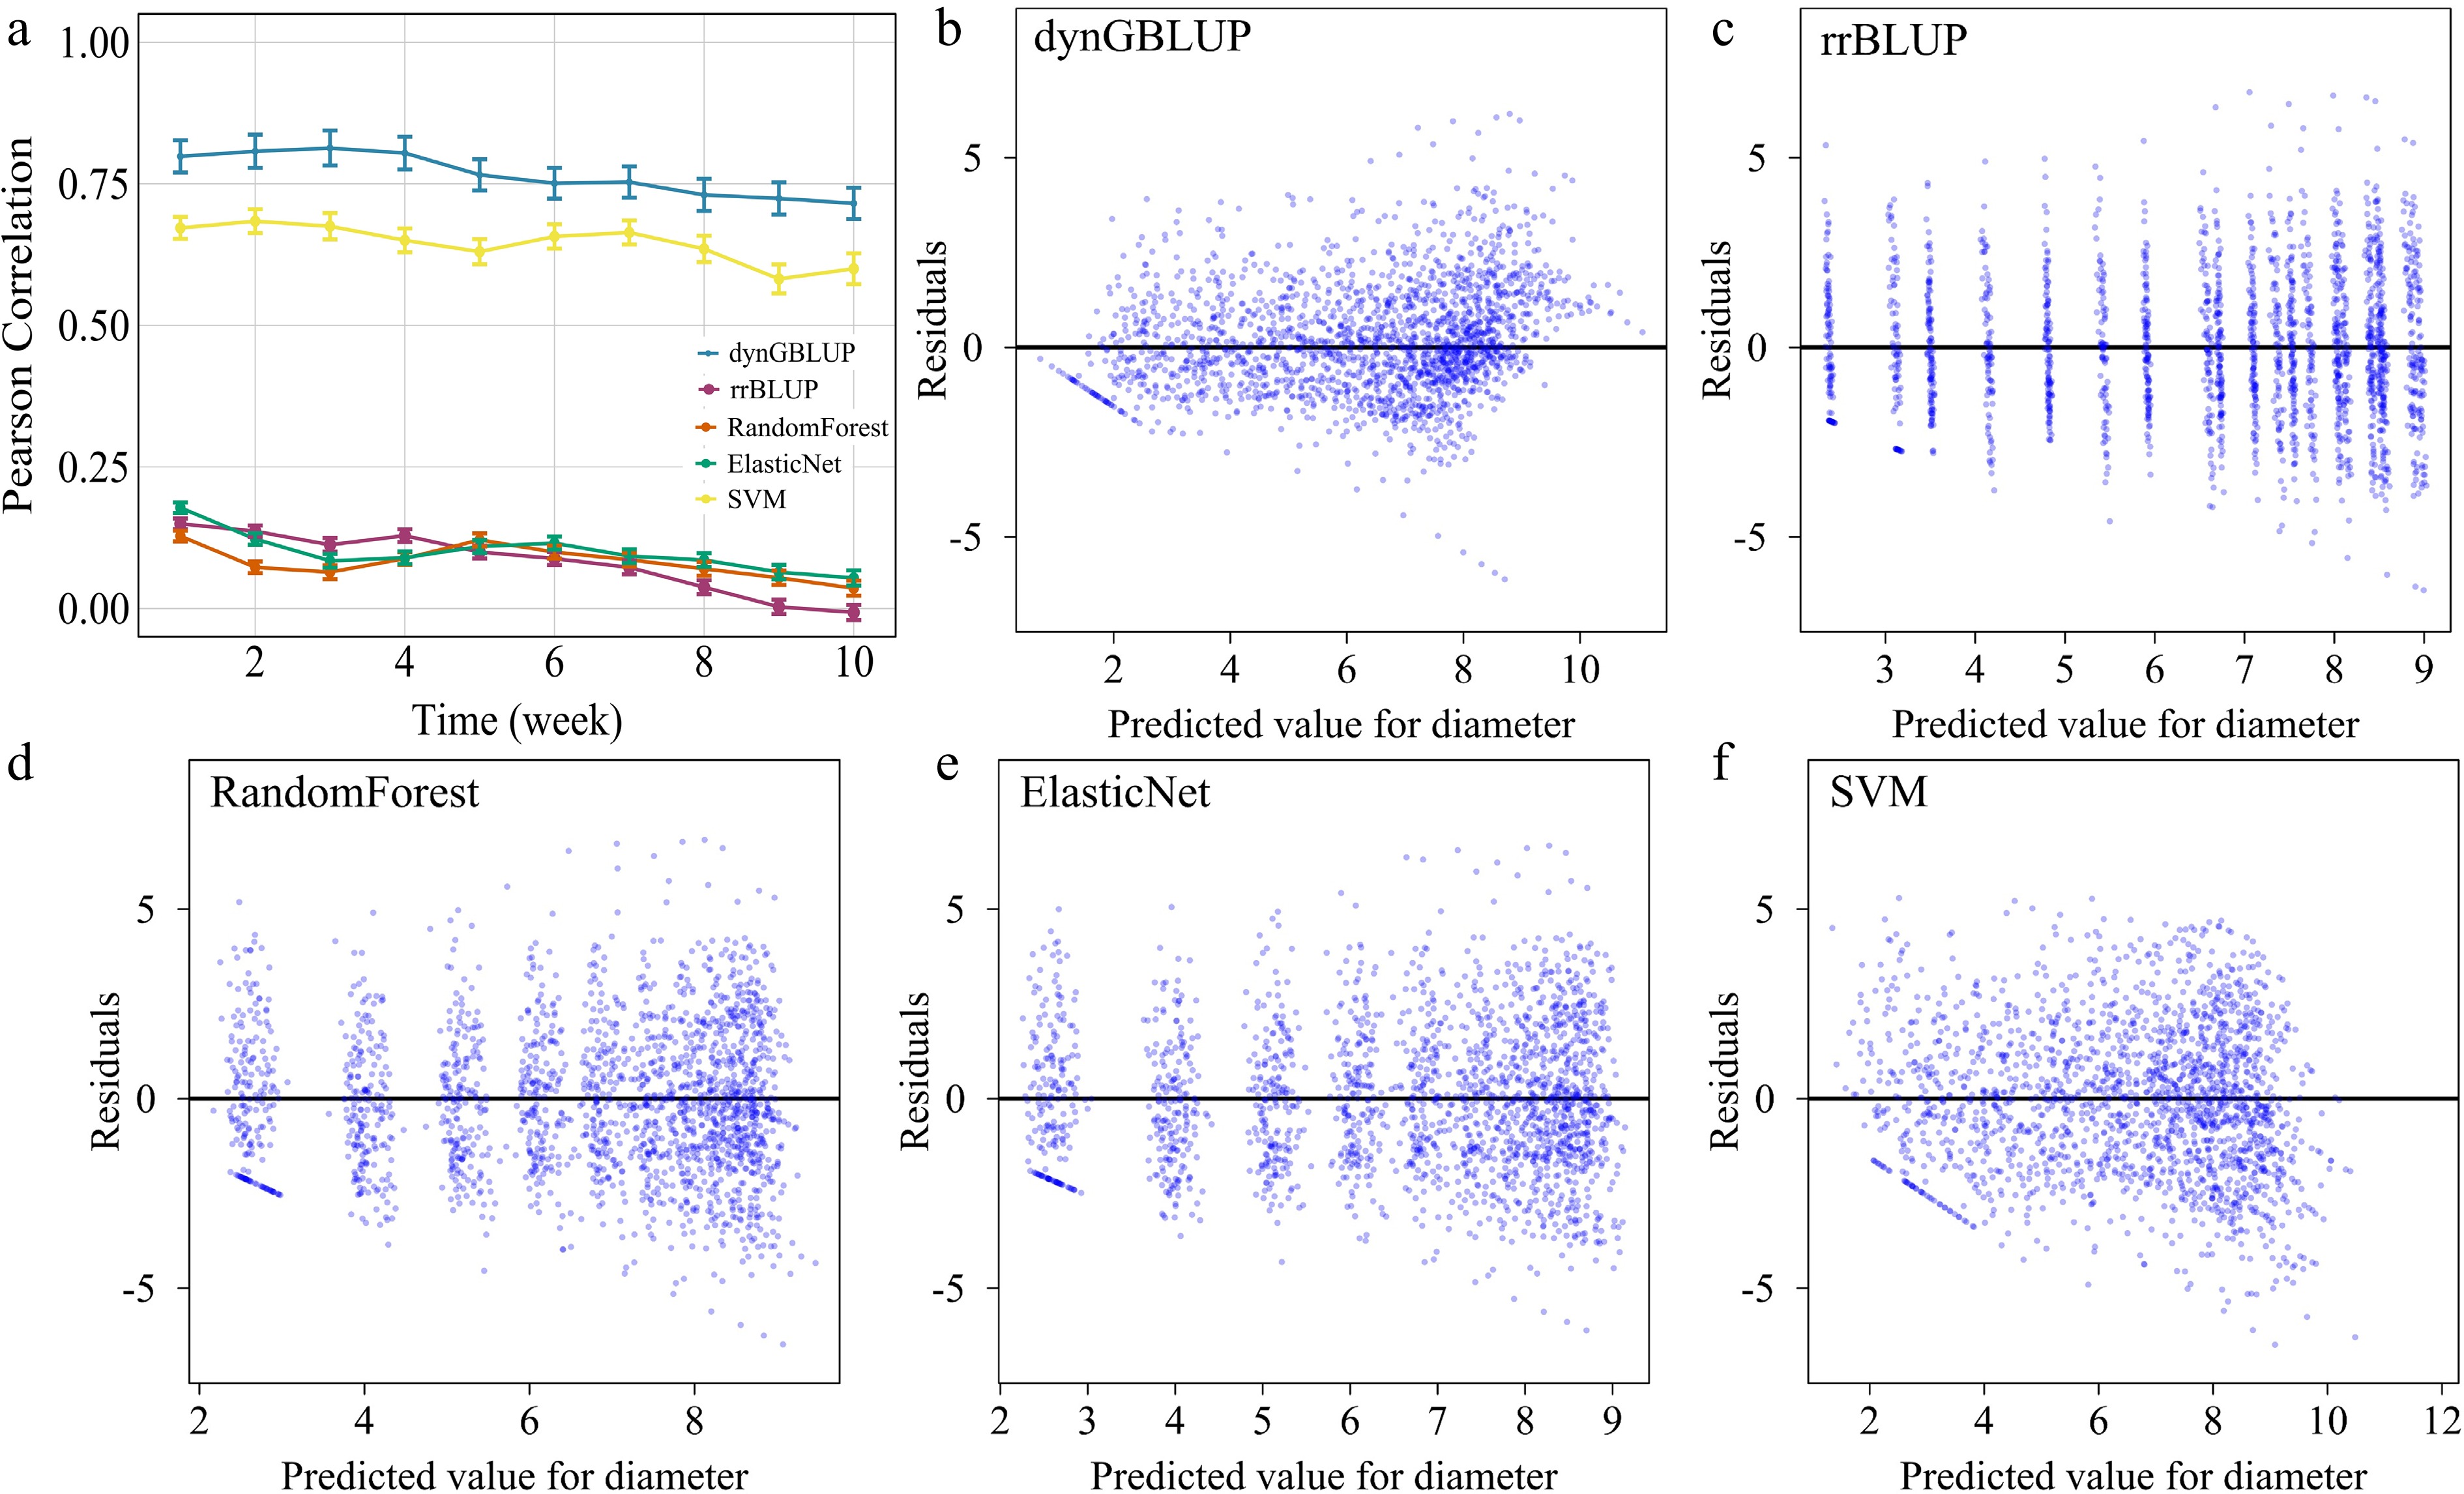
Figure 2.
(a) Comparison of the predictive performance of dynGBLUP and rrBLUP models across individual time points. Predicted residuals from (b) dynGBLUP, (c) rrBLUP, (d) random forest, (e) elastic net, and (f) SVM, for stem diameter growth in Populus szechuanica var. tibetica cuttings.
-
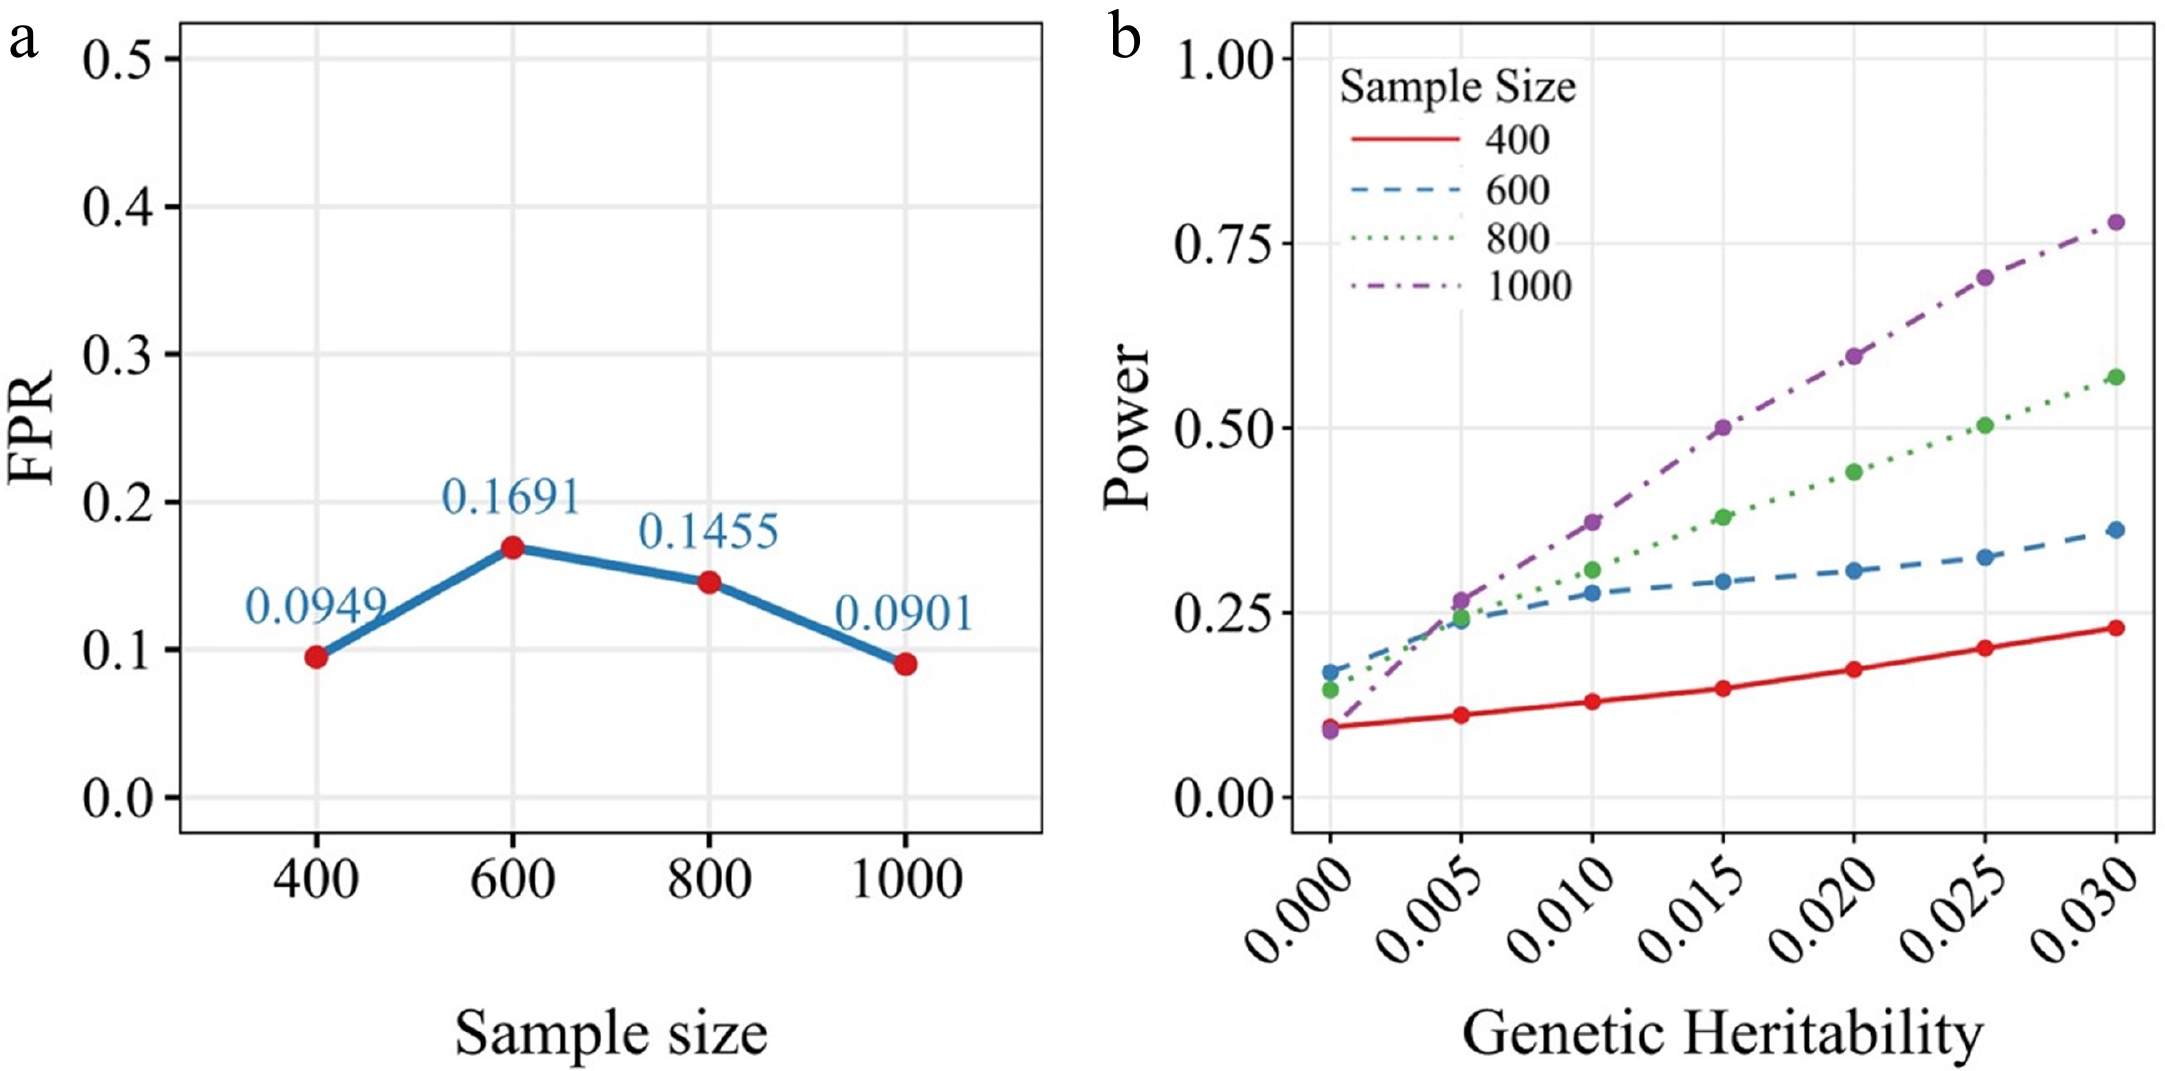
Figure 3.
(a) False positive rate and (b) statistical power of the dynGBLUP model.
-
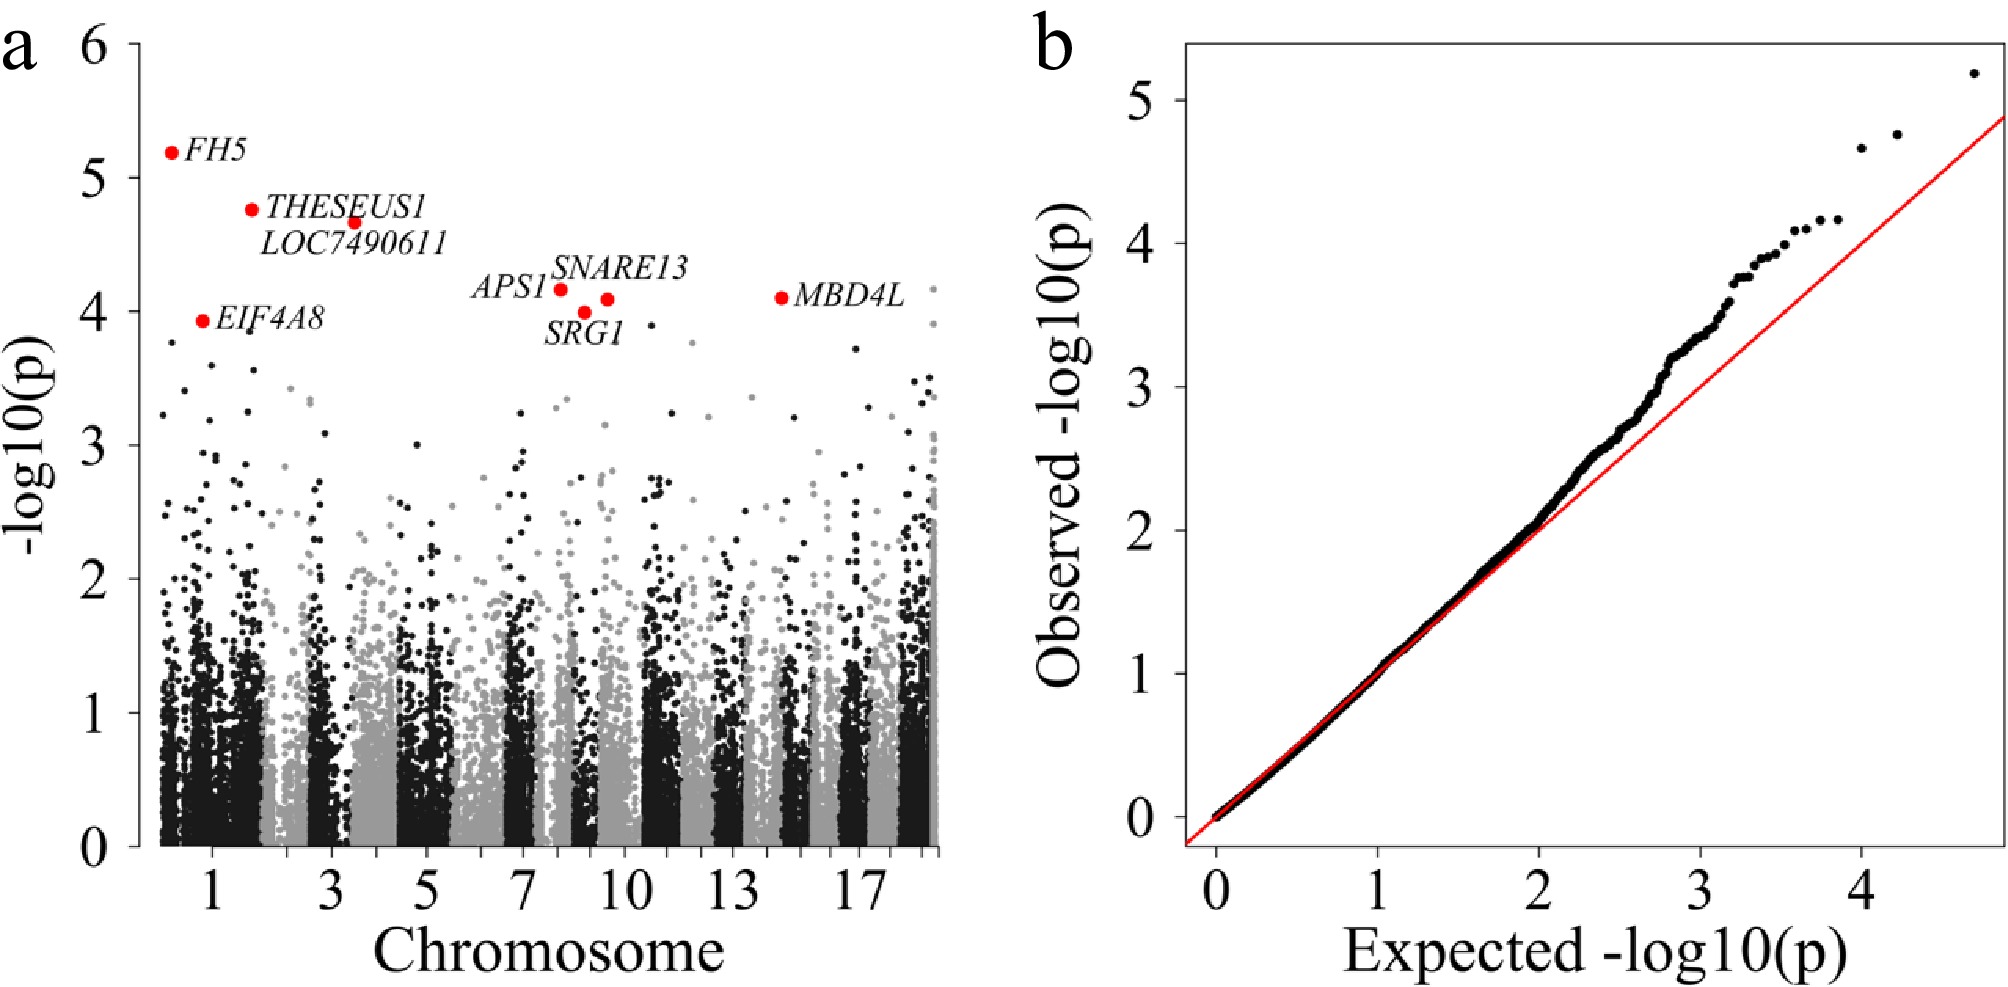
Figure 4.
(a) Manhattan and (b) QQ plots for stem diameter growth in Populus szechuanica var. tibetica cuttings.
Figures
(4)
Tables
(0)