-
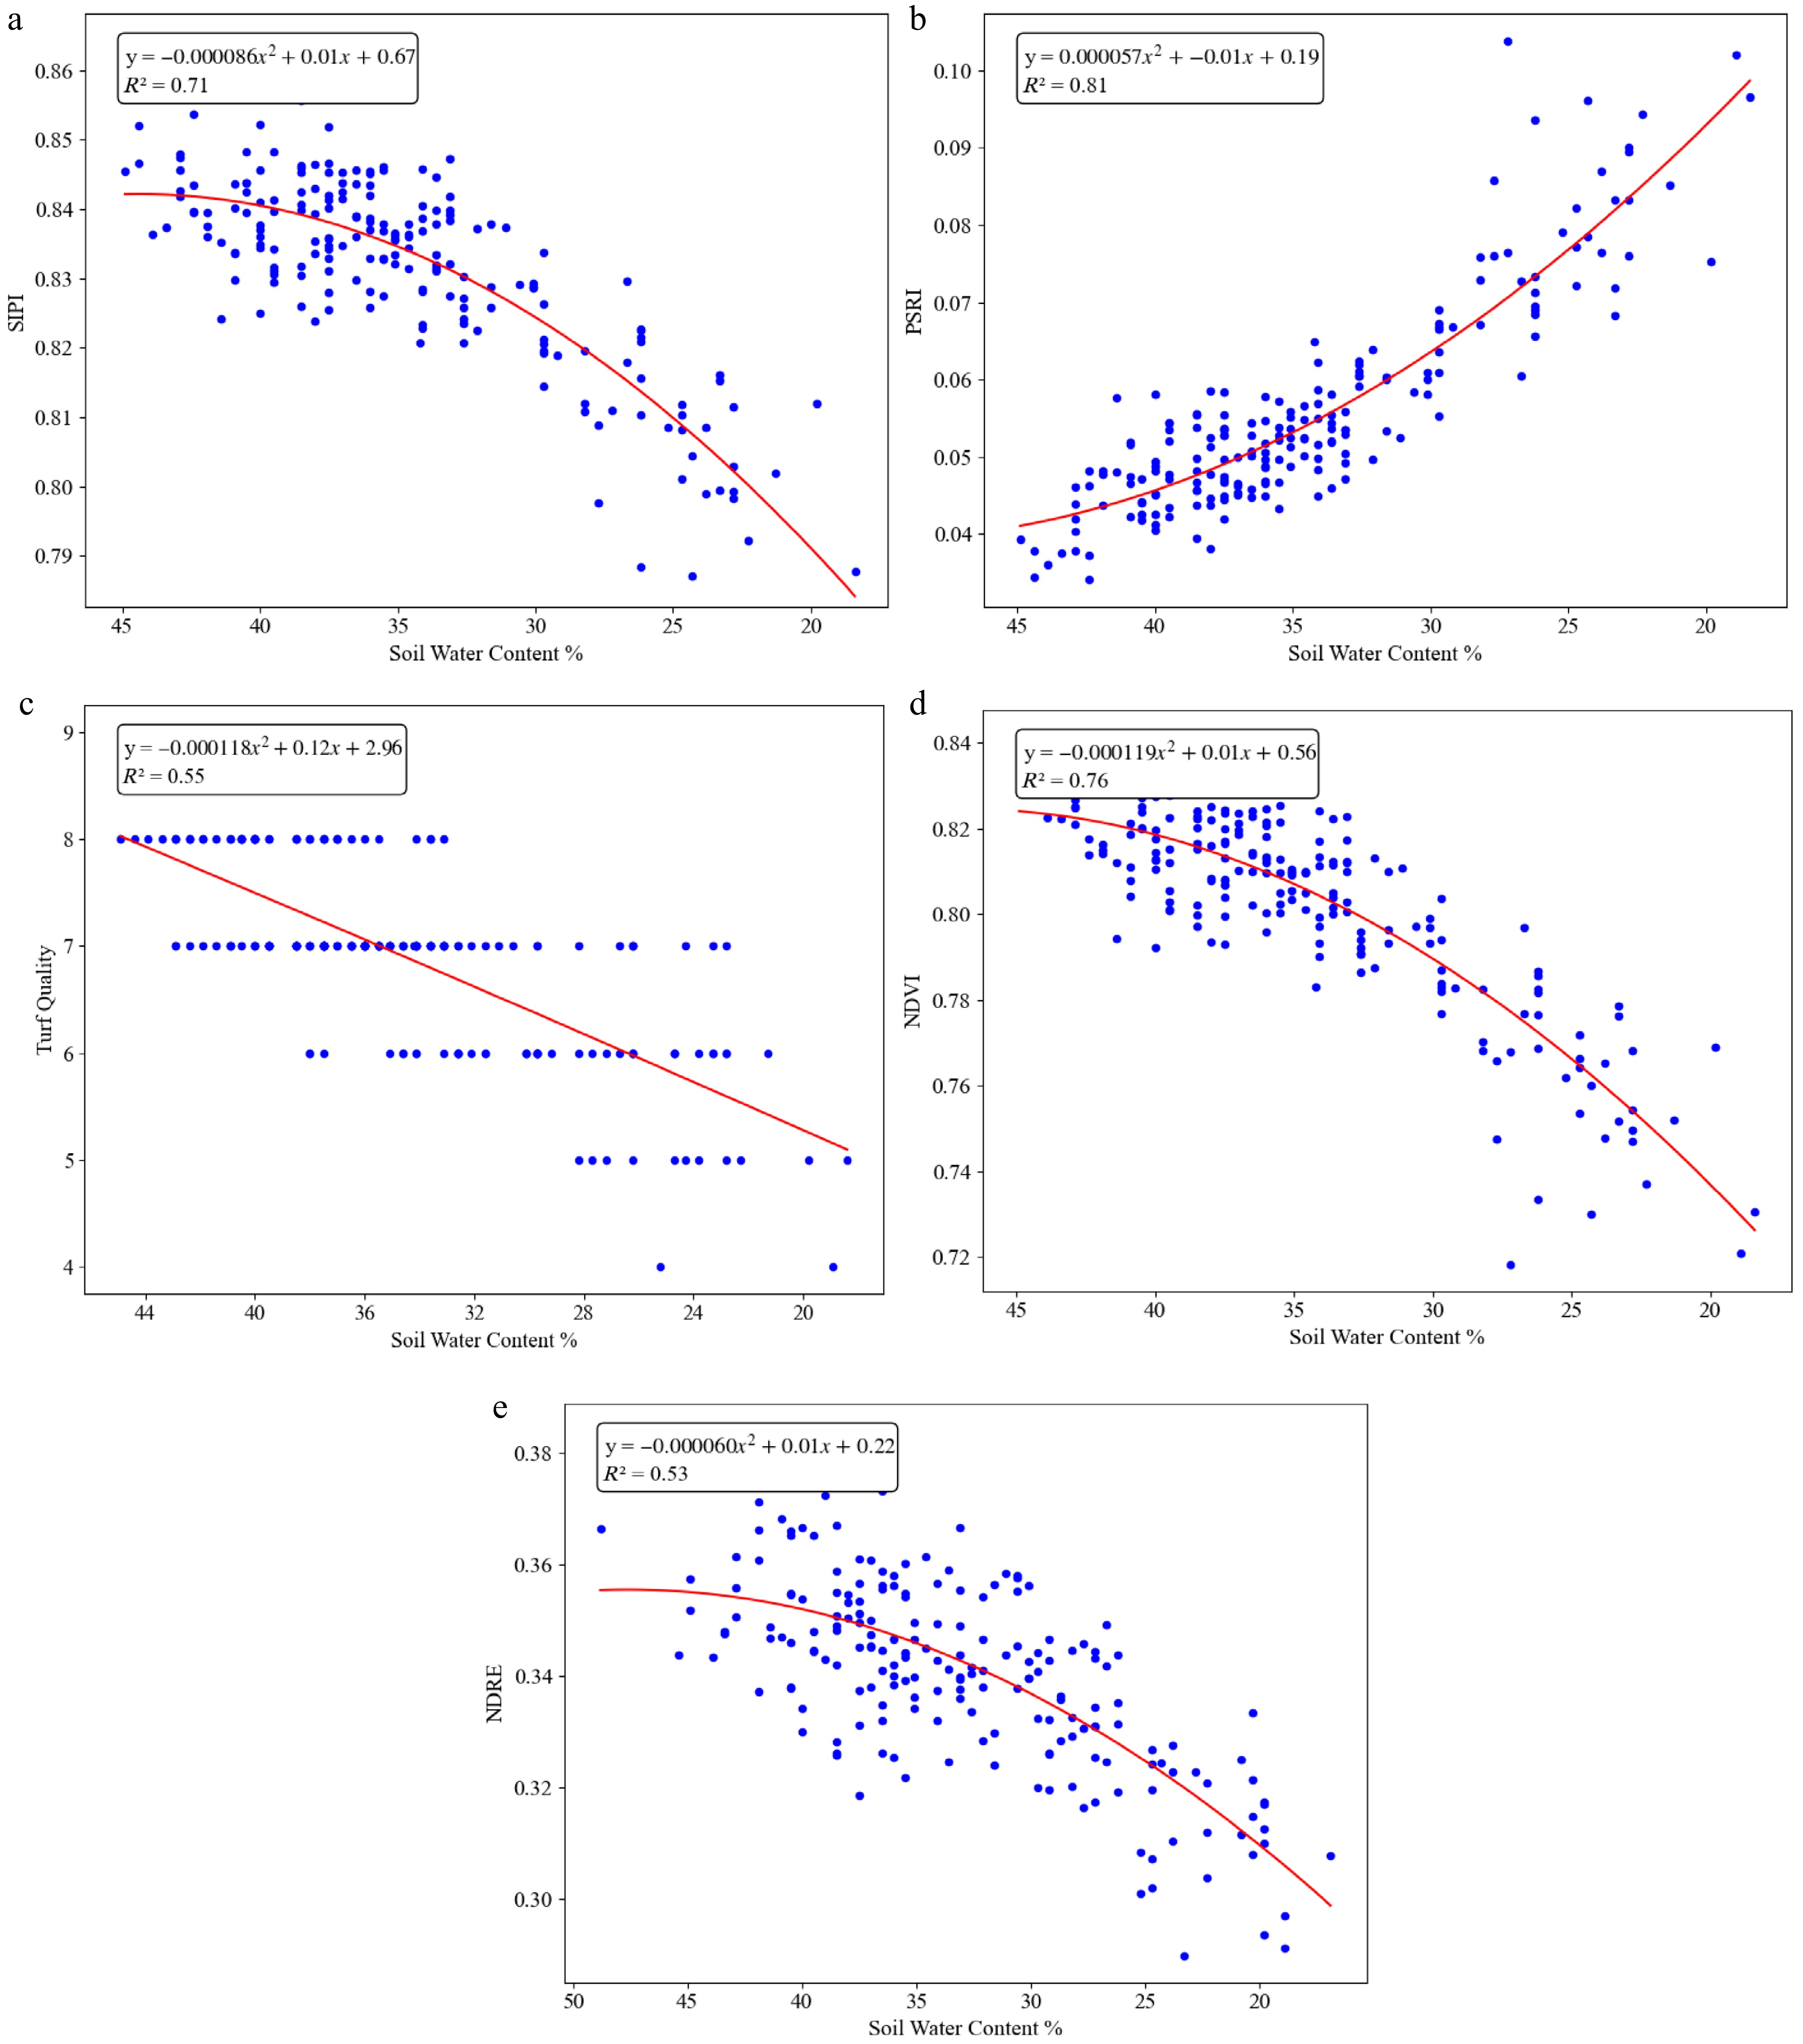
Figure 1.
Non-linear correlation regression graphs of various vegetation indices or turf quality vs. soil water content on 6/14/2024. (a) SIPI vs. SWC, (b) PSRI vs. SWC, (c) TQ vs. SWC, (d) NDVI vs. SWC, and (e) NDRE vs. SWC.
-
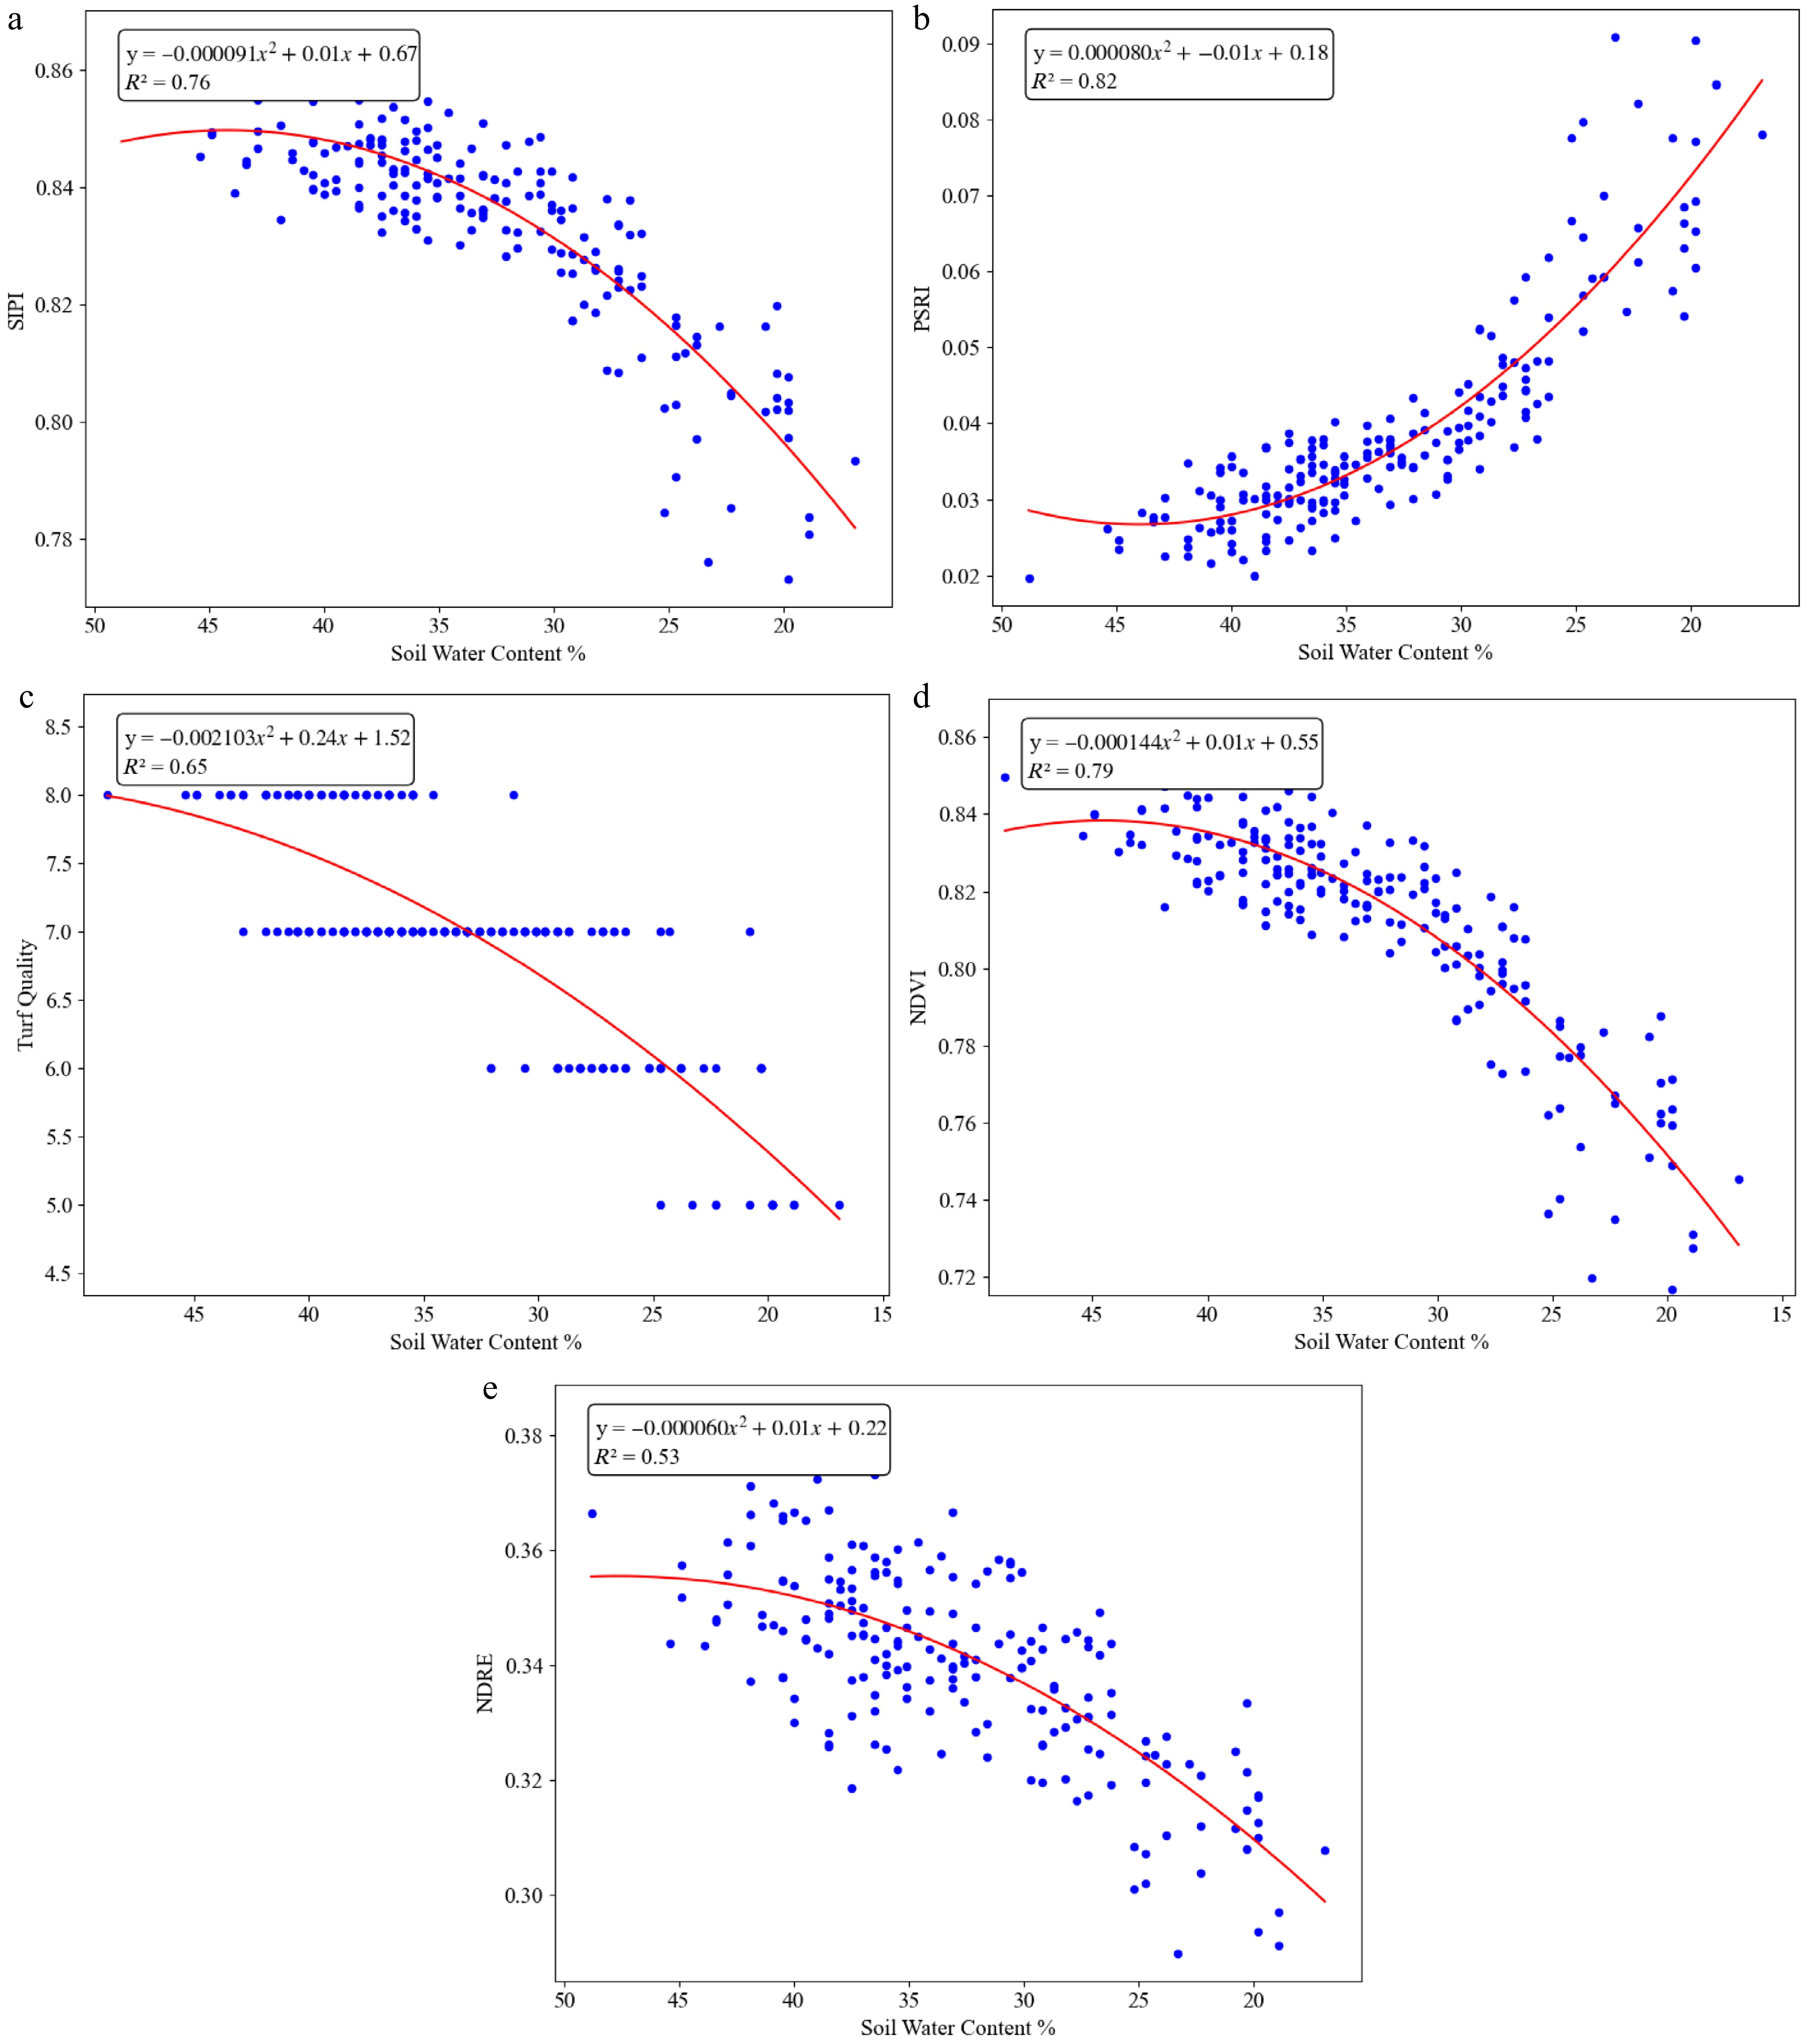
Figure 2.
Changes in vegetation indices and turf quality with soil water content during early phase of deficit irrigation (data collected on 6/17/2024). (a) SIPI vs. SWC, (b) PSRI vs. SWC, (c) TQ vs. SWC, (d) NDVI vs. SWC, and (e) NDRE vs. SWC.
-
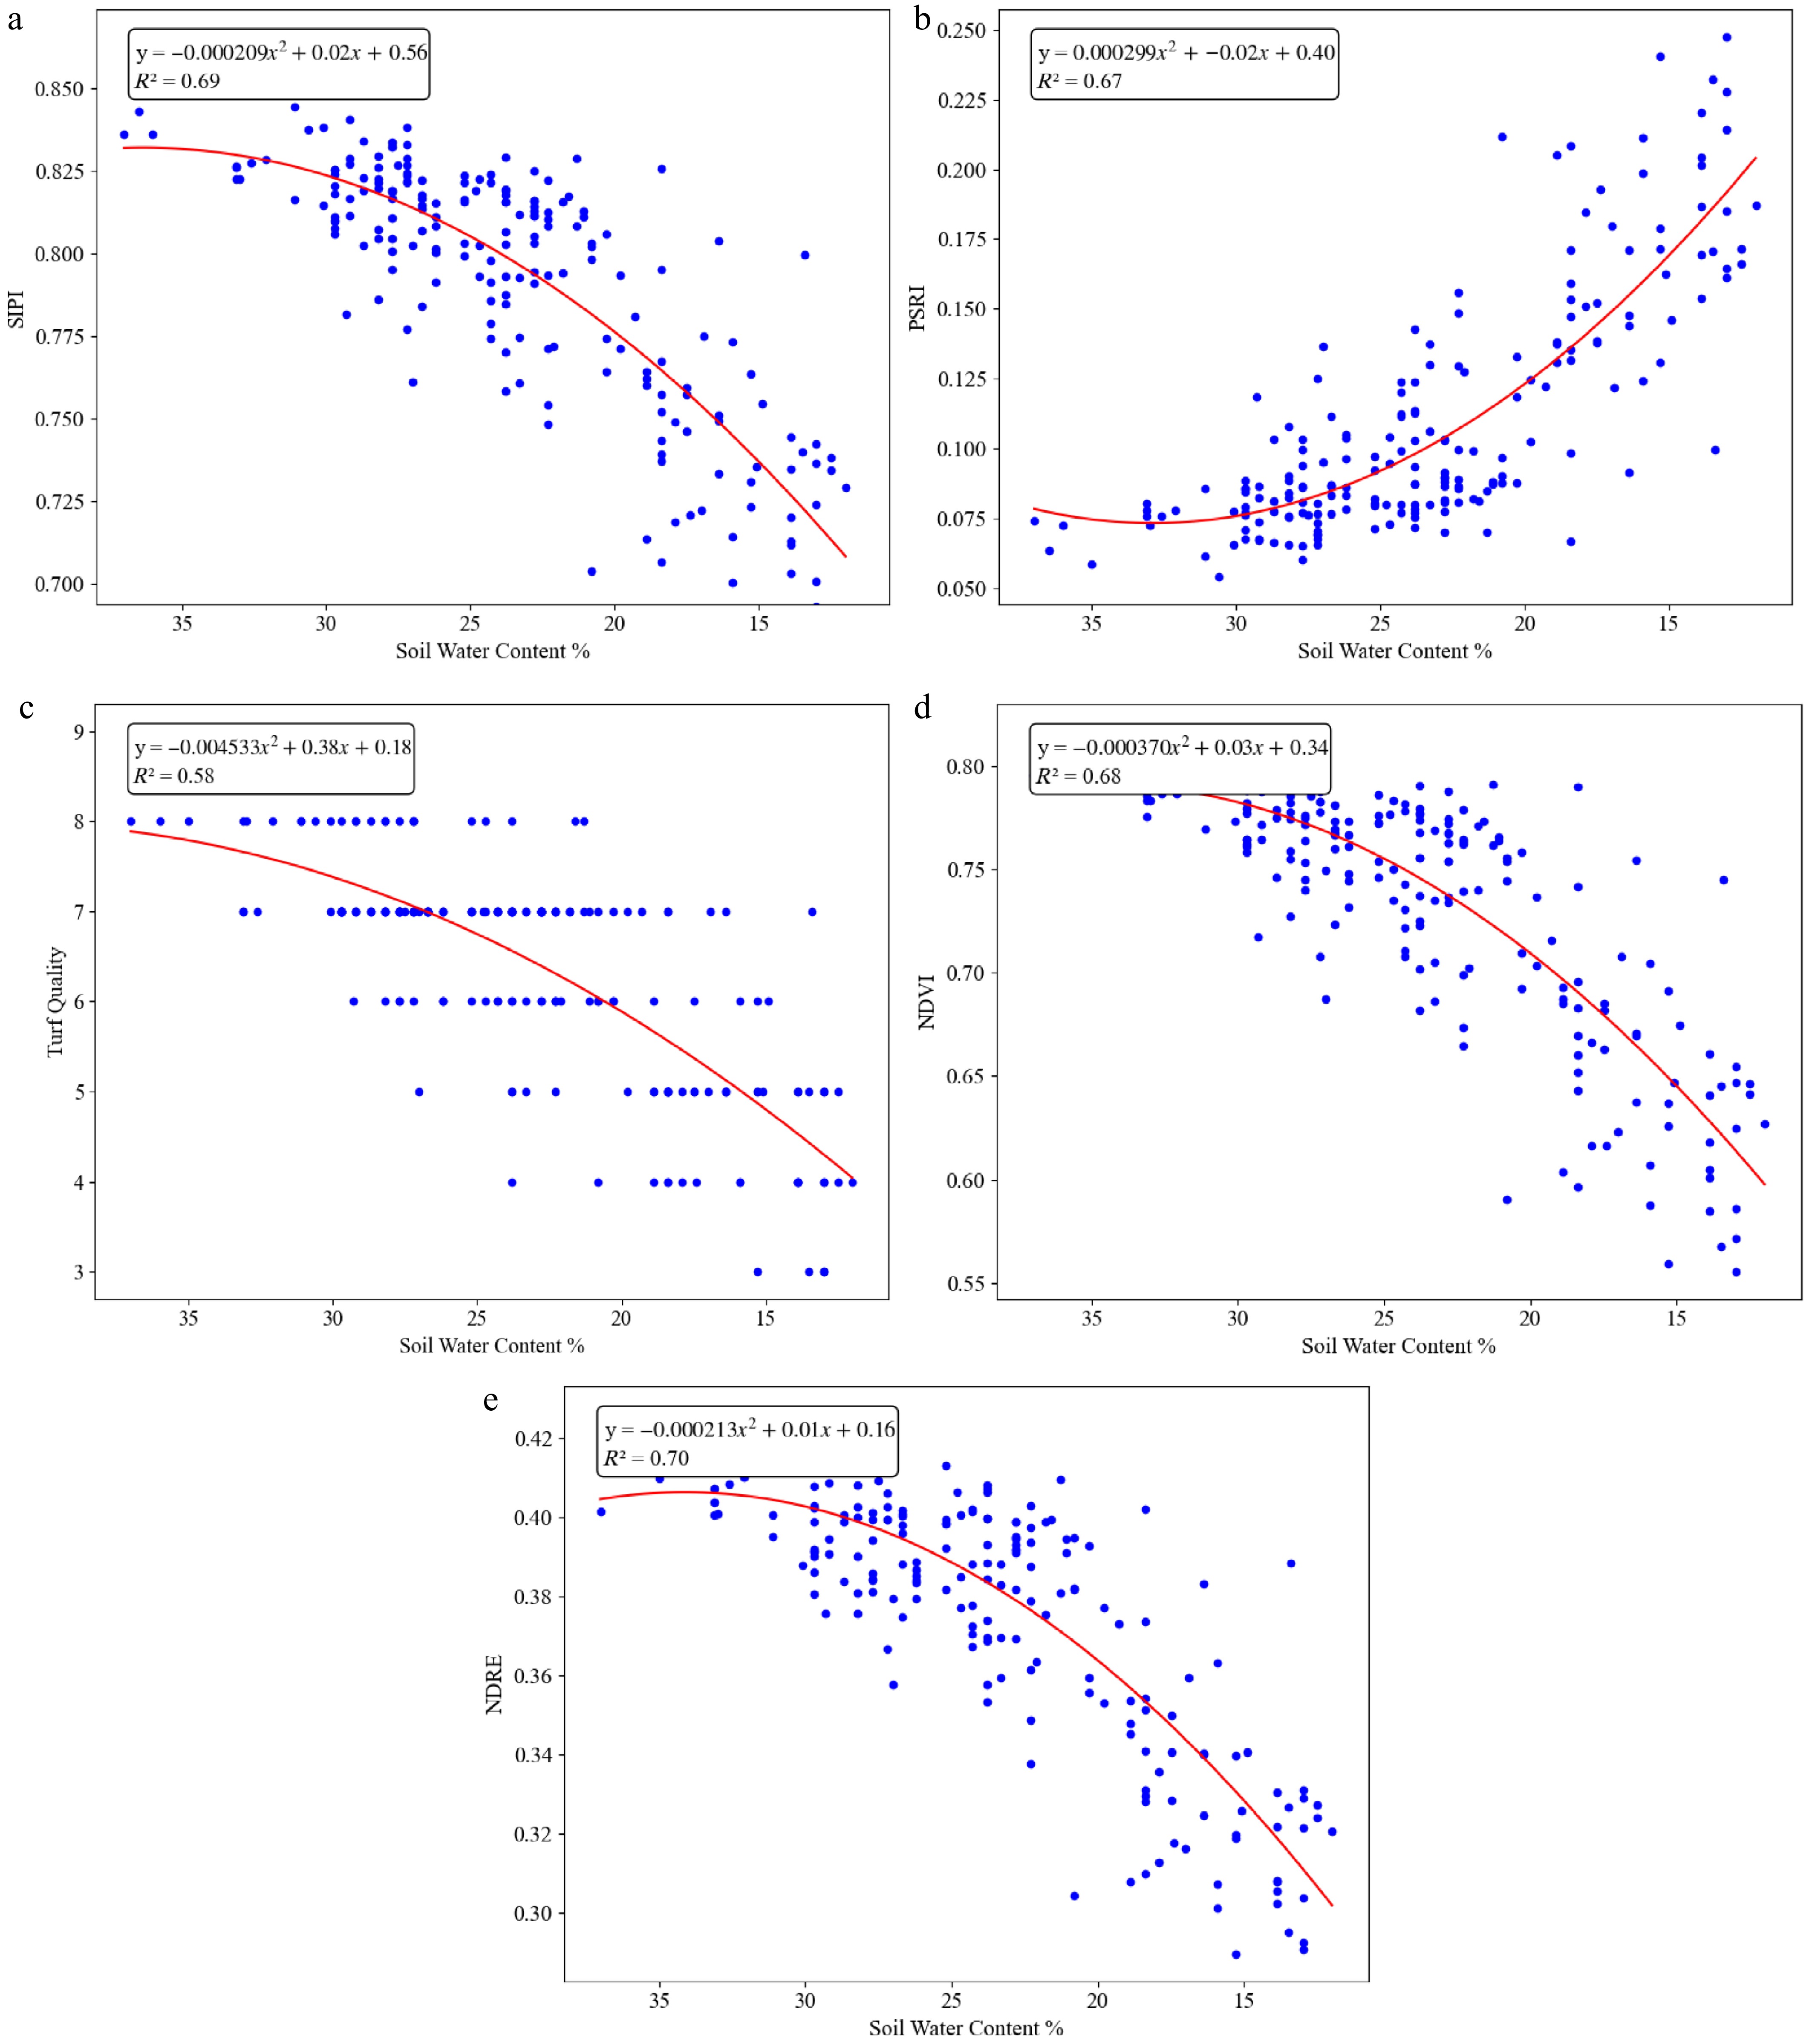
Figure 3.
Changes in vegetation indices and turf quality with soil water content during late phase of deficit irrigation (data collected on 6/25/2024). (a) SIPI vs. SWC, (b) PSRI vs. SWC, (c) TQ vs. SWC, (d) NDVI vs. SWC, and (e) NDRE vs. SWC.
-
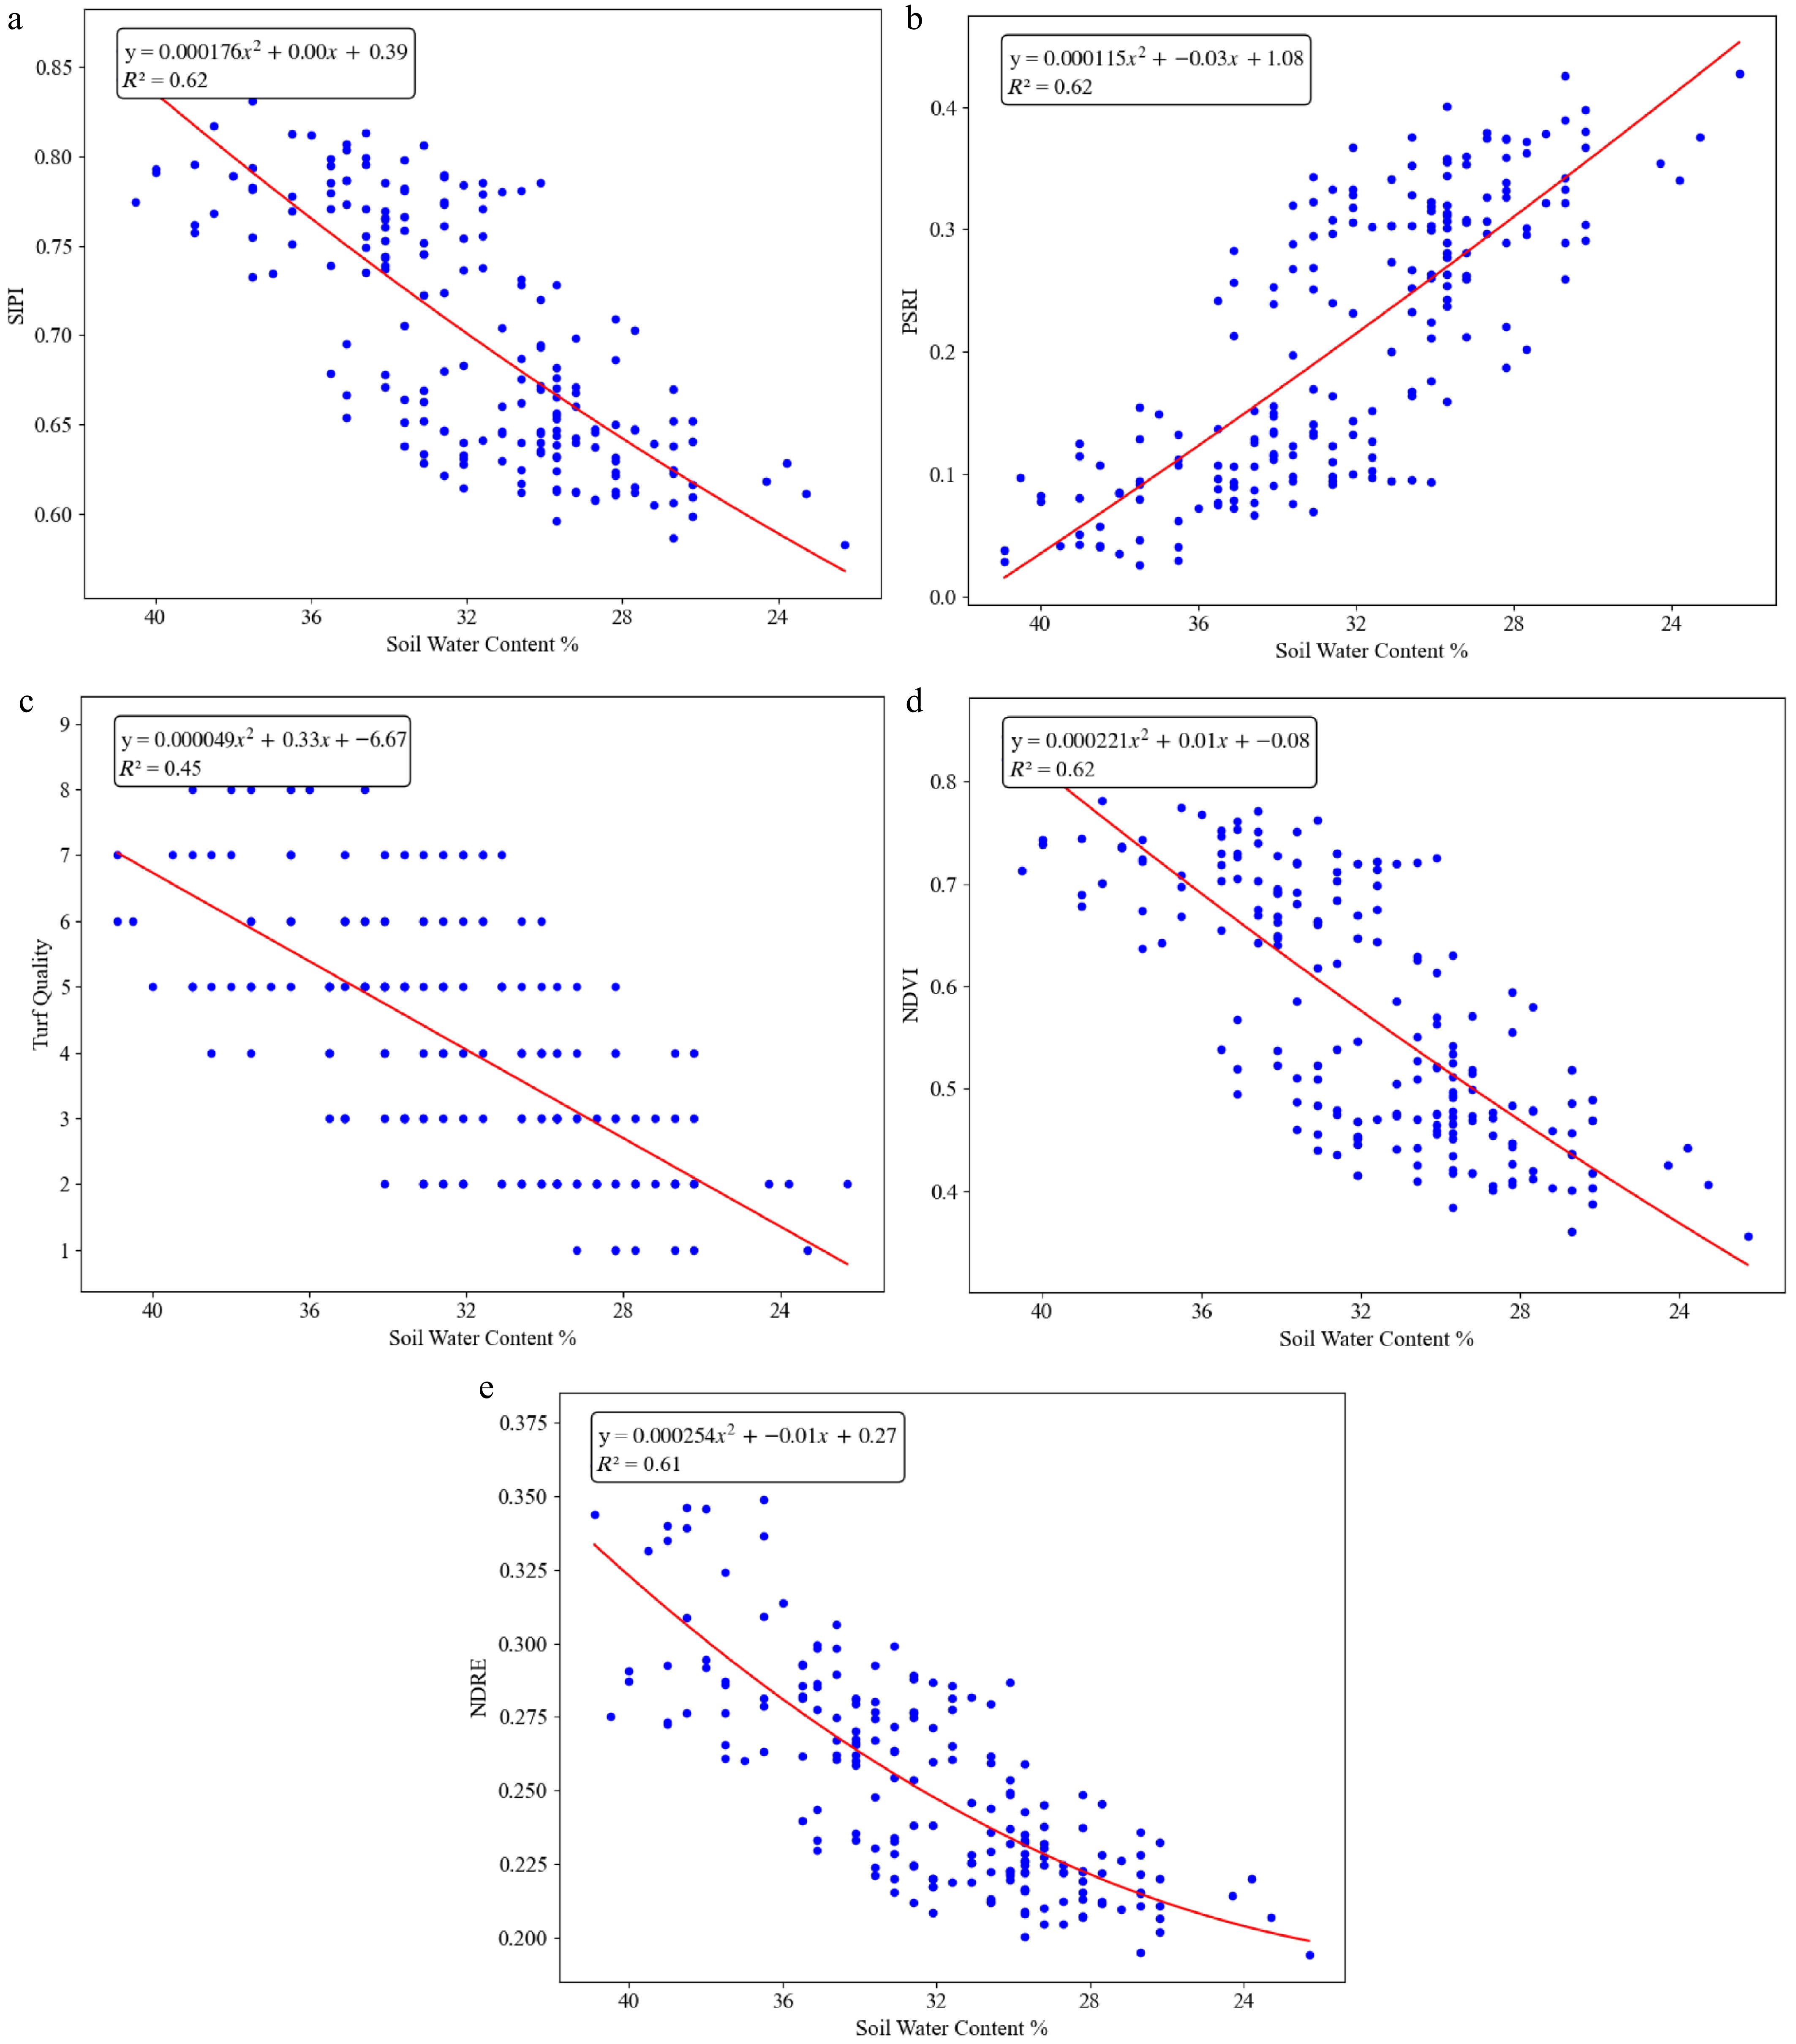
Figure 4.
Changes in vegetation indices and turf quality with soil water content during late phase of deficit irrigation on 8/13/2023. (a) SIPI vs. SWC, (b) PSRI vs. SWC,(c) TQ vs. SWC, (d) NDVI vs. SWC, and (e) NDRE vs. SWC.
-
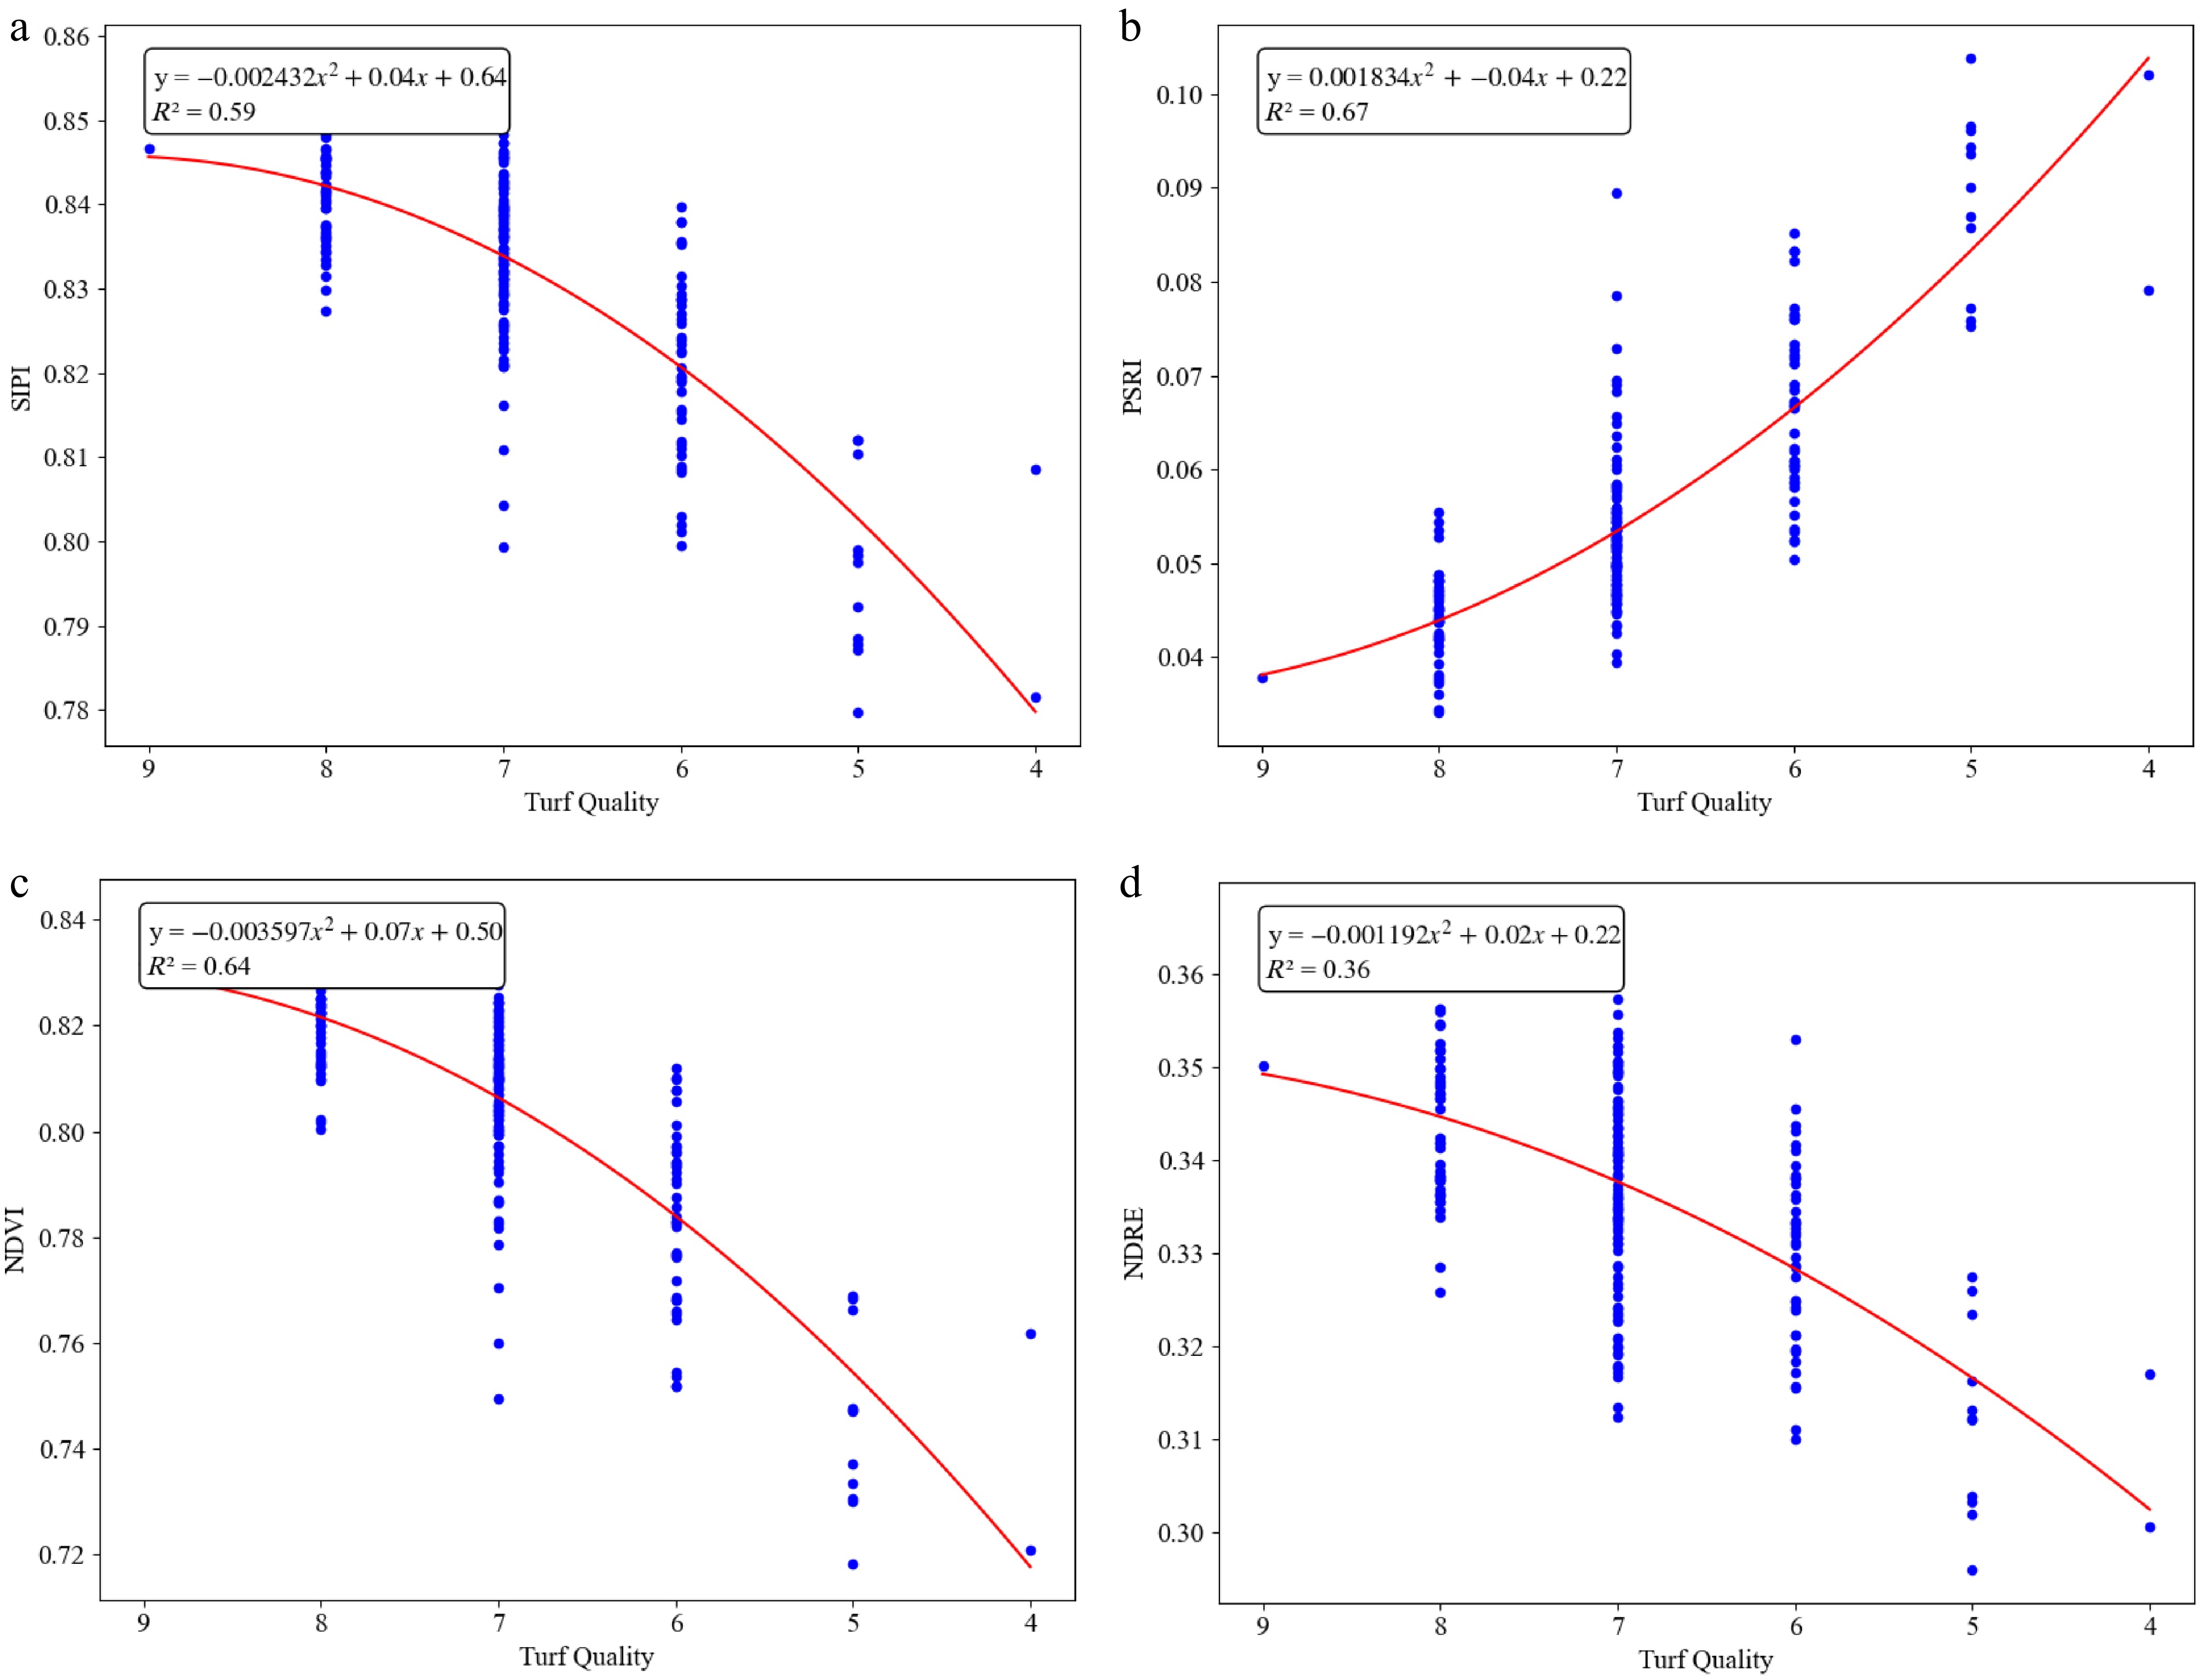
Figure 5.
Relationships of vegetation indices and turf quality during early phase of deficit irrigation (6/14/2024). (a) SIPI vs. TQ, (b) PSRI vs. TQ, (c) NDVI vs. TQ, and (d) NDRE vs. TQ.
-
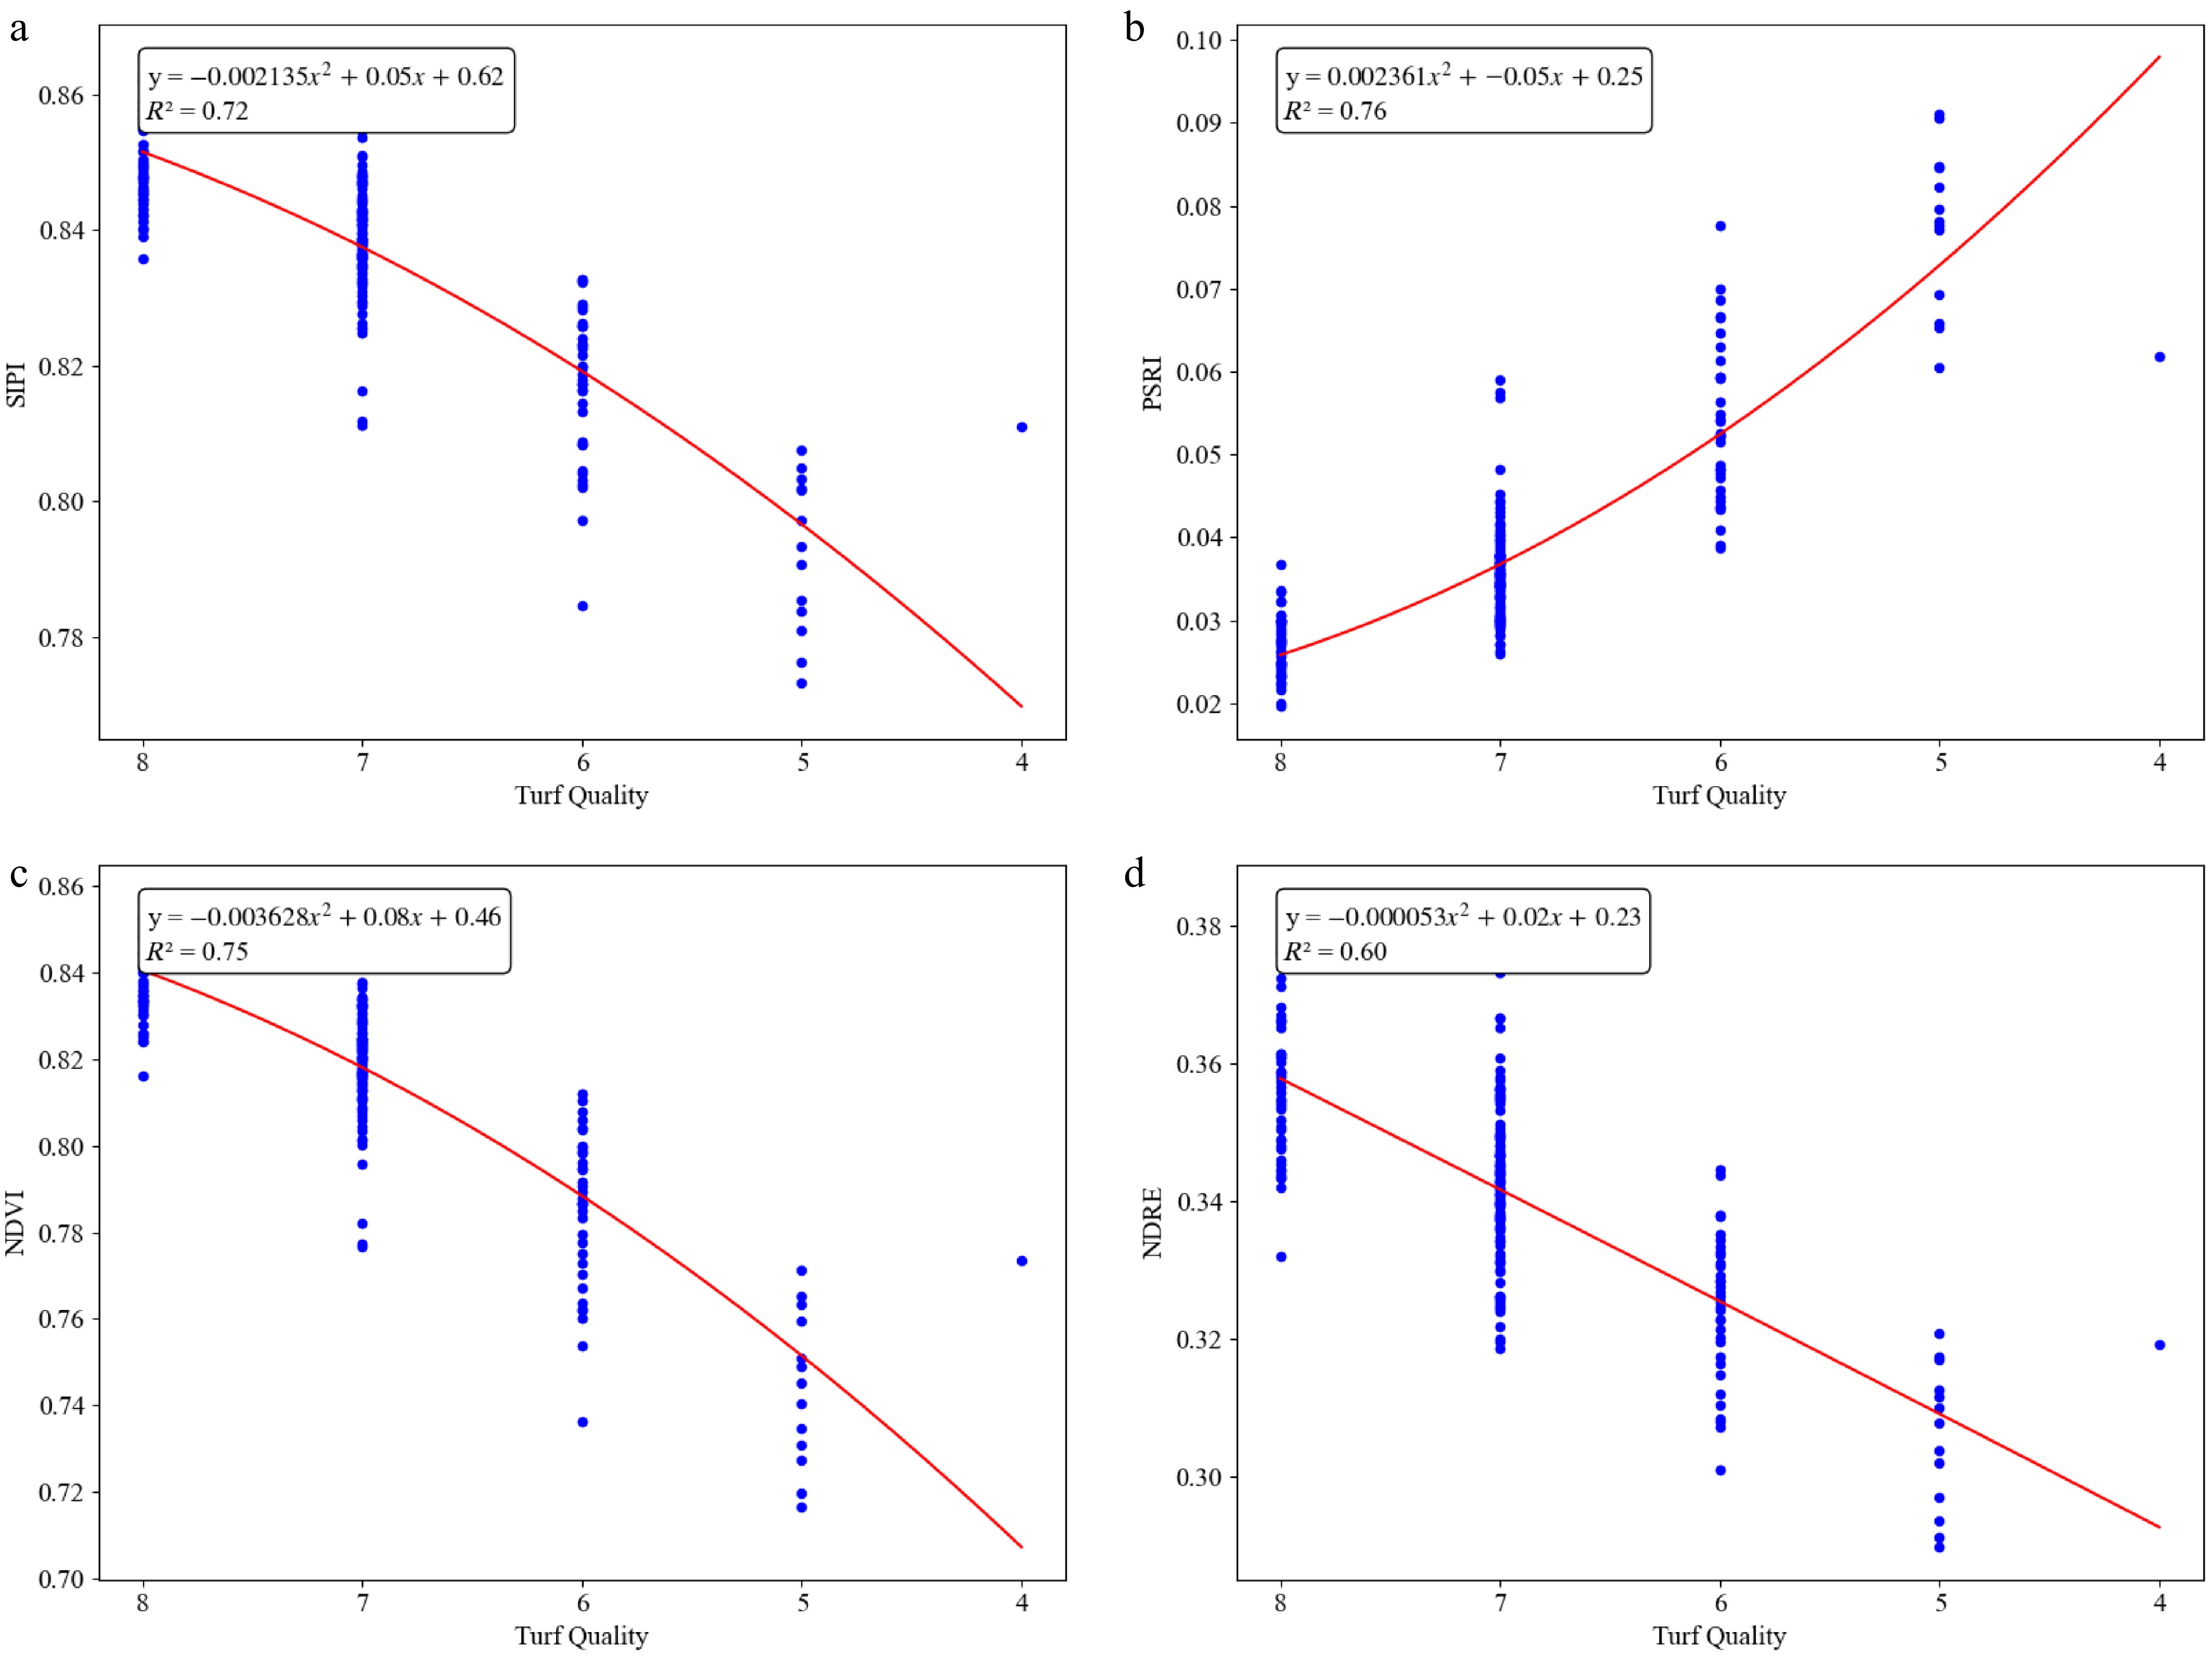
Figure 6.
Relationships of vegetation indices and turf quality during middle phase of deficit irrigation (6/17/2024). (a) SIPI vs. TQ, (b) PSRI vs. TQ, (c) NDVI vs.TQ, and (d) NDRE vs. TQ.
-
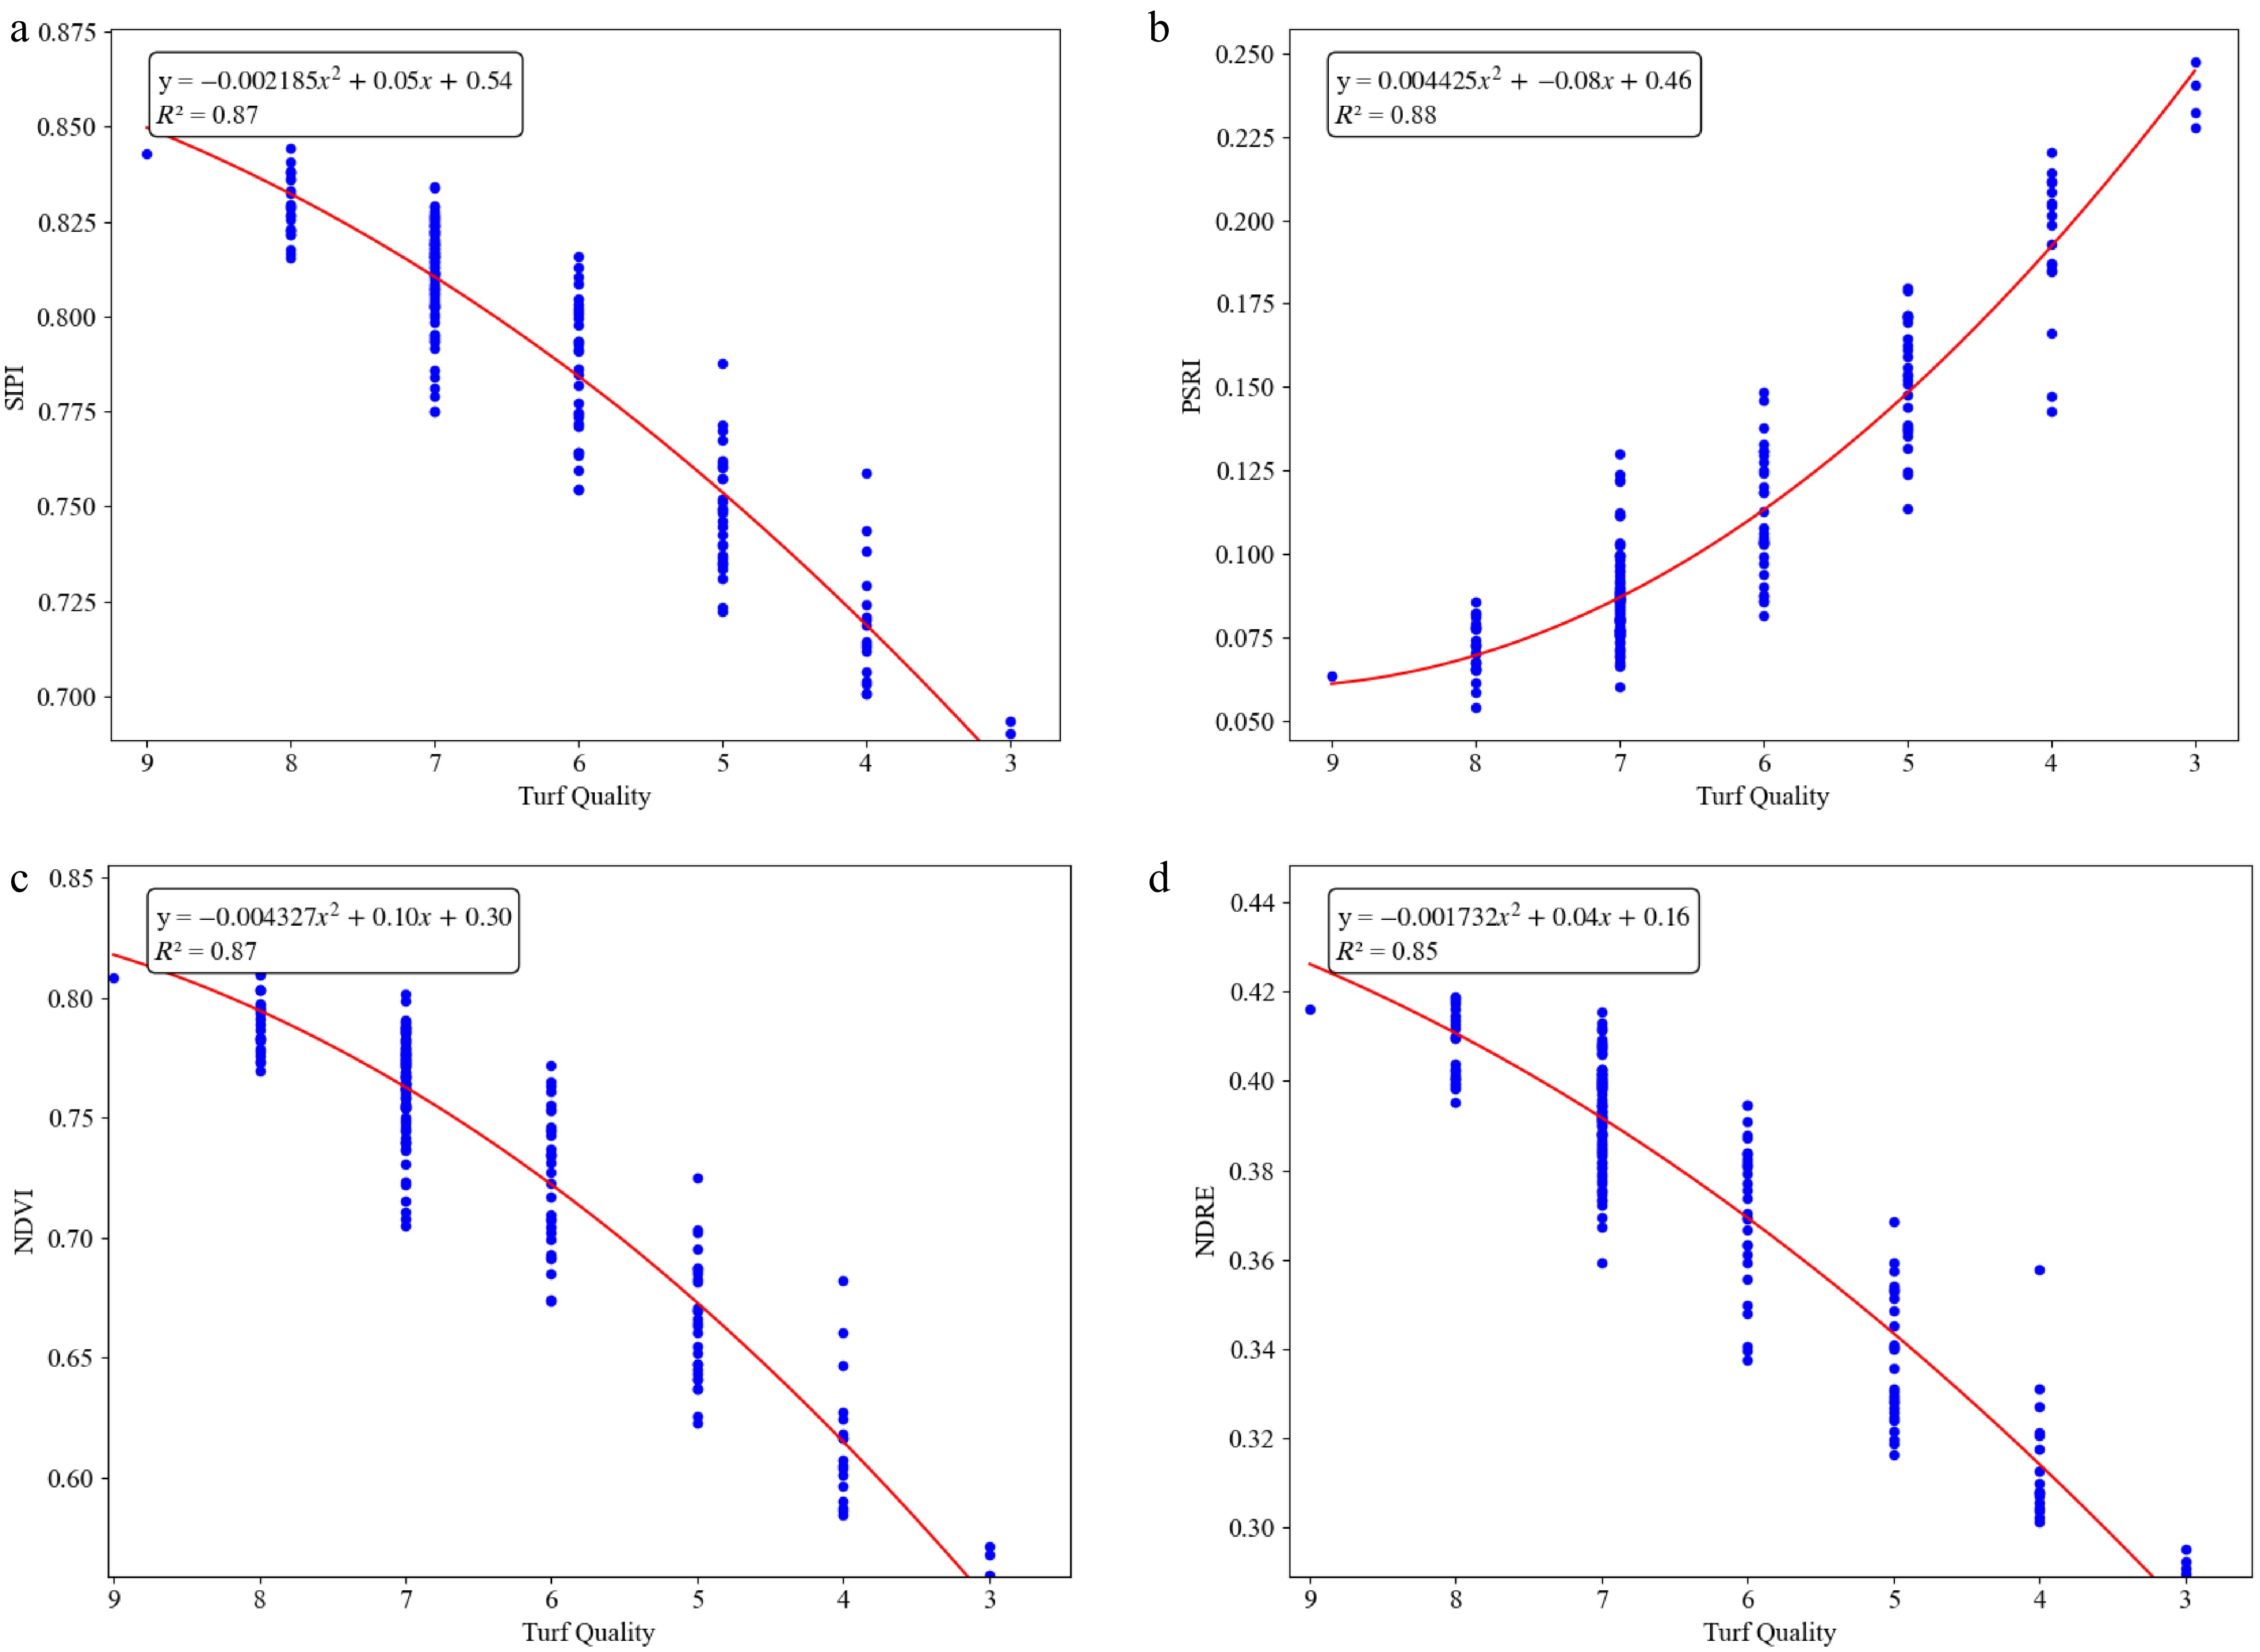
Figure 7.
Relationships of vegetation indices and turf quality during late phase of deficit irrigation (6/25/2024). (a) SIPI vs. TQ, (b) PSRI vs. TQ, (c) NDVI vs. TQ, and (d) NDRE vs. TQ.
-
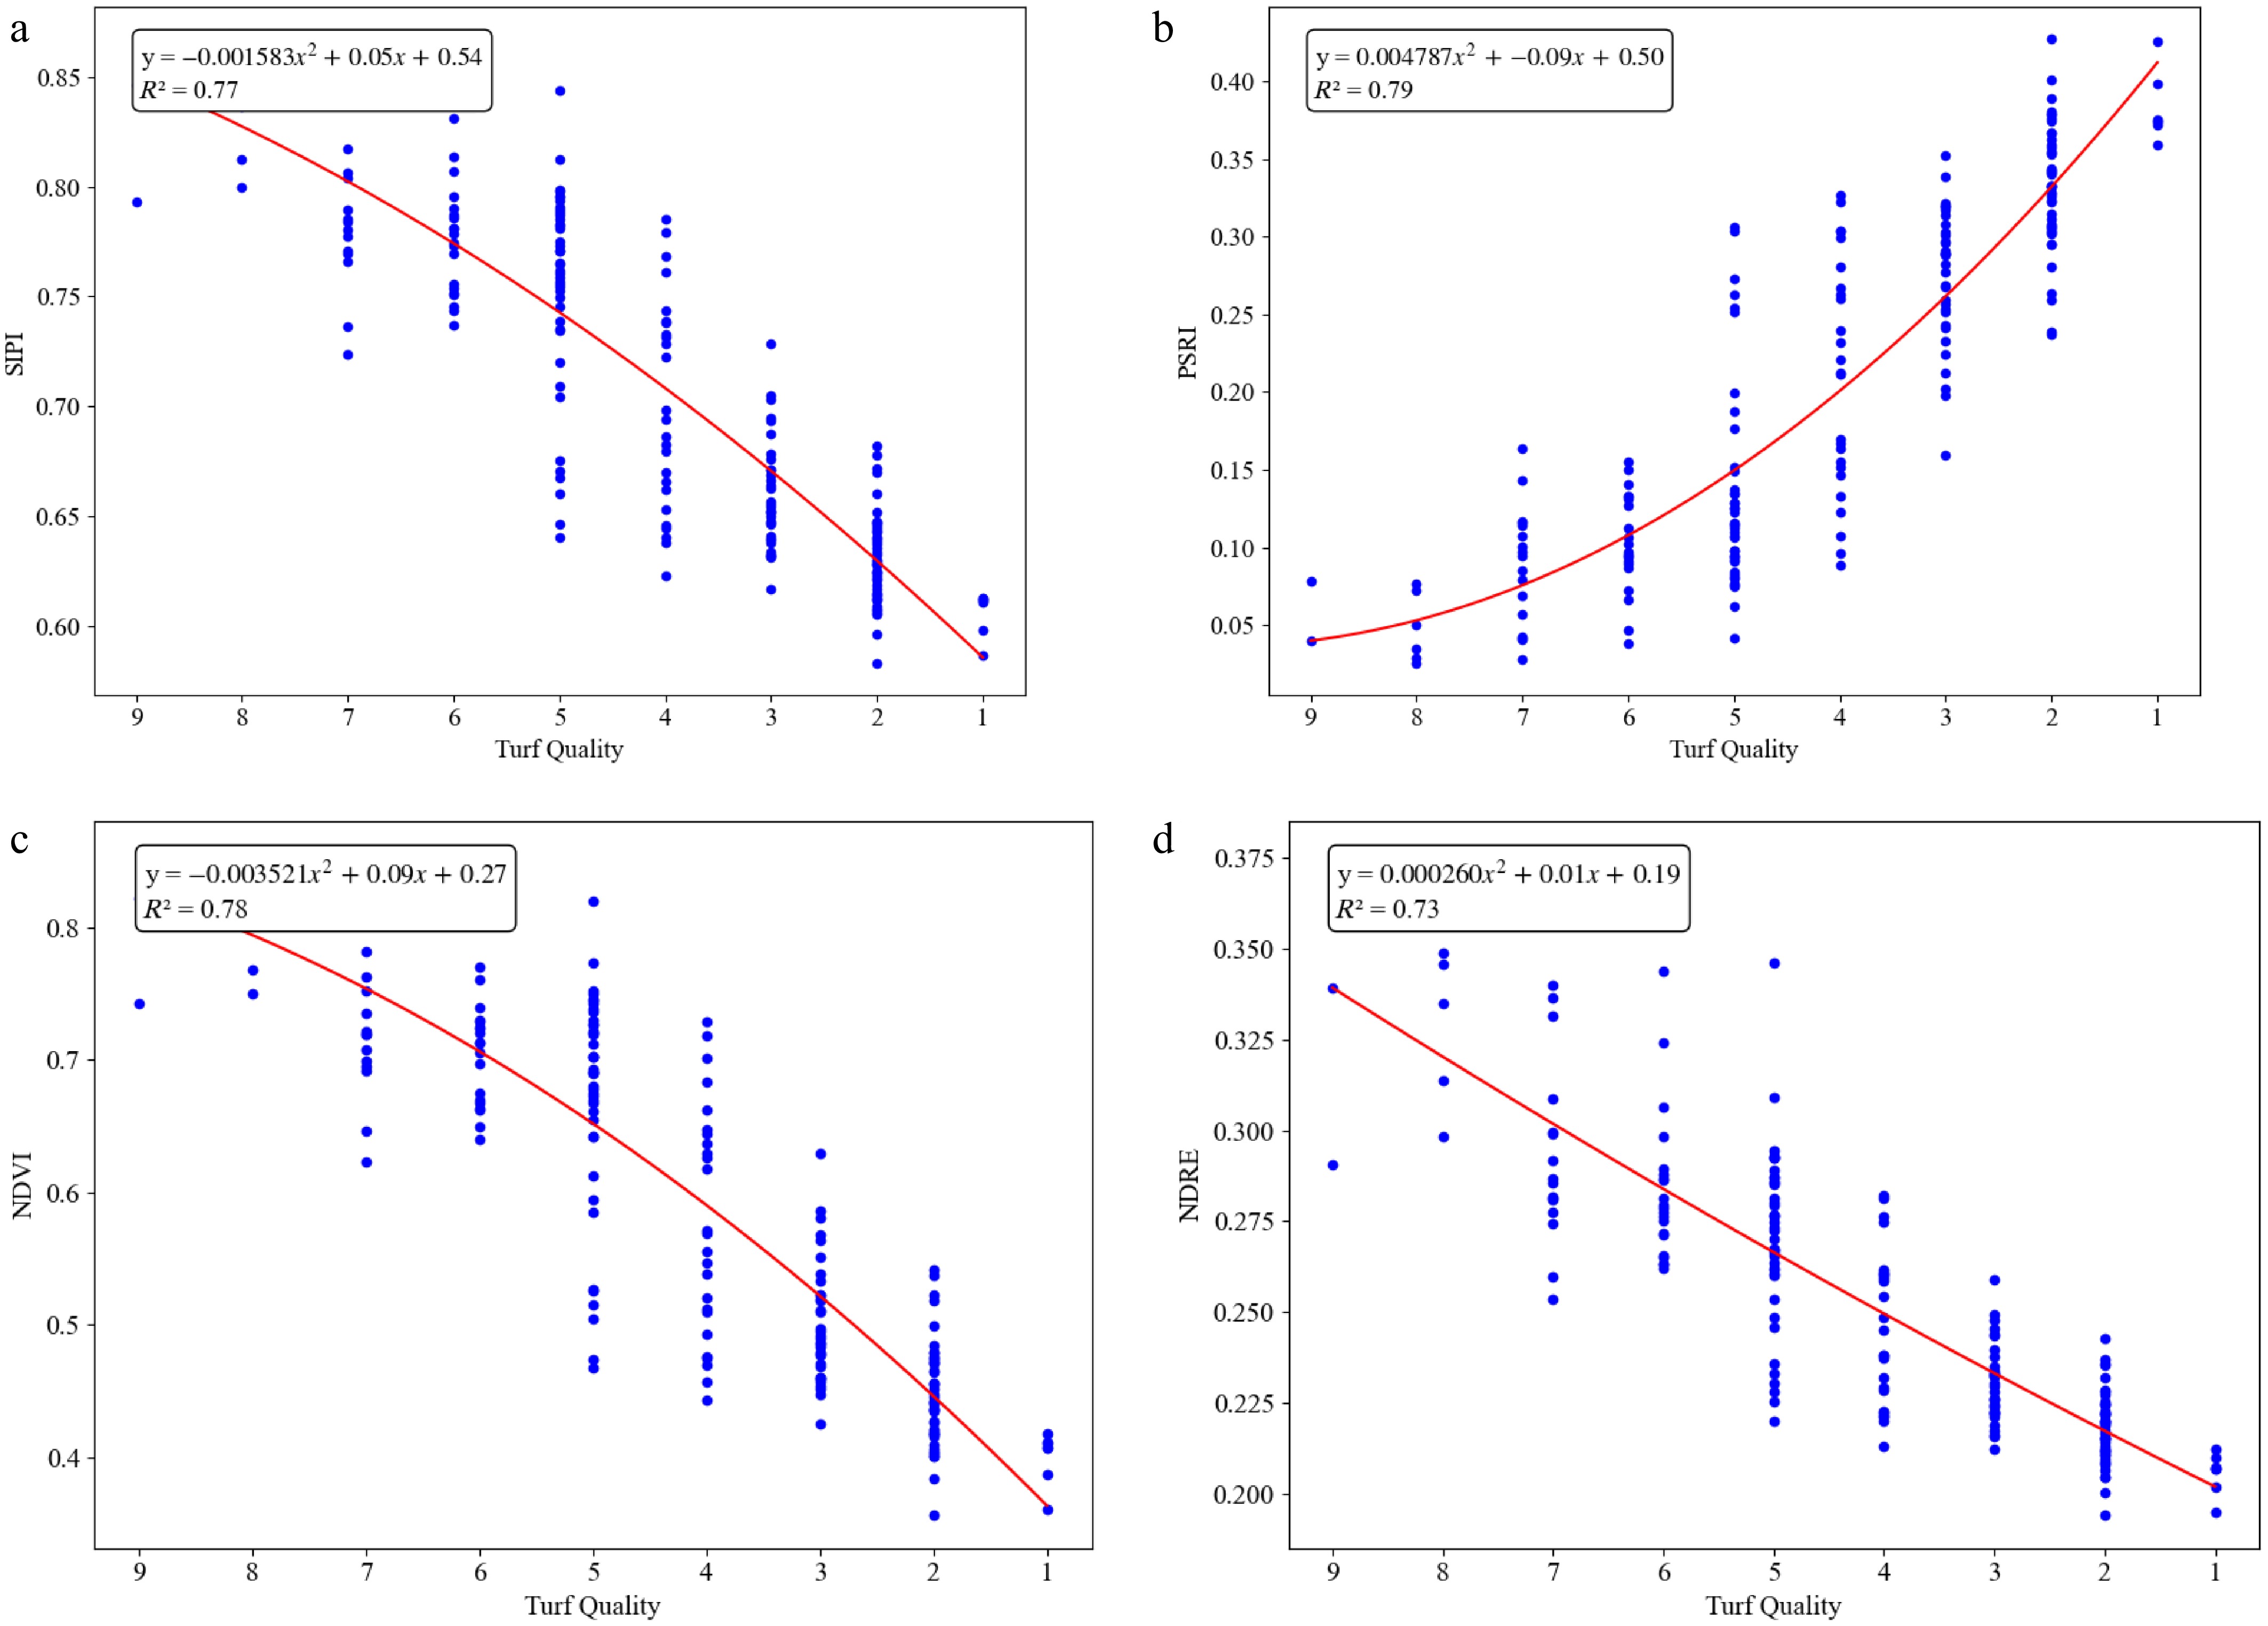
Figure 8.
Relationships of vegetation indices and turf quality during late phase of deficit irrigation (8/13/2023). (a) SIPI vs. TQ, (b) PSRI vs. TQ, (c) NDVI vs. TQ, and (d) NDRE vs. TQ.
-
NDRE 0.655 1 SIPI 0.996 0.841 1 PSRI 0.989 0.034 0.975 1 DGCI 0.812 0.671 0.733 0.785 1 TQ 0.826 0.659 0.834 0.628 0.698 1 SWC 0.694 0.087 0.677 0.793 0.454 0.335 1 NDVI: normalized differential vegetation index; NDRE: normalized difference red edge; SIPI: structure independent pigment index; PSRI: plant senescence reflectance index; TQ: turf quality; SWC: soil water content. NDVI, NDRE, SIPI, PSRI were calculated from remote sensing data, DGCI was calculated based on ground RGB camera data, and TQ was determined by the researcher's visual evaluation of the experimental plots. SWC was collected from a TDR soil moisture sensor. Table 1.
R2 of measured parameters for selected dates of experimental period.
Figures
(8)
Tables
(1)